

Crypto World
Trump Reports Over $1 Billion in Crypto Earnings in 2025 Disclosure
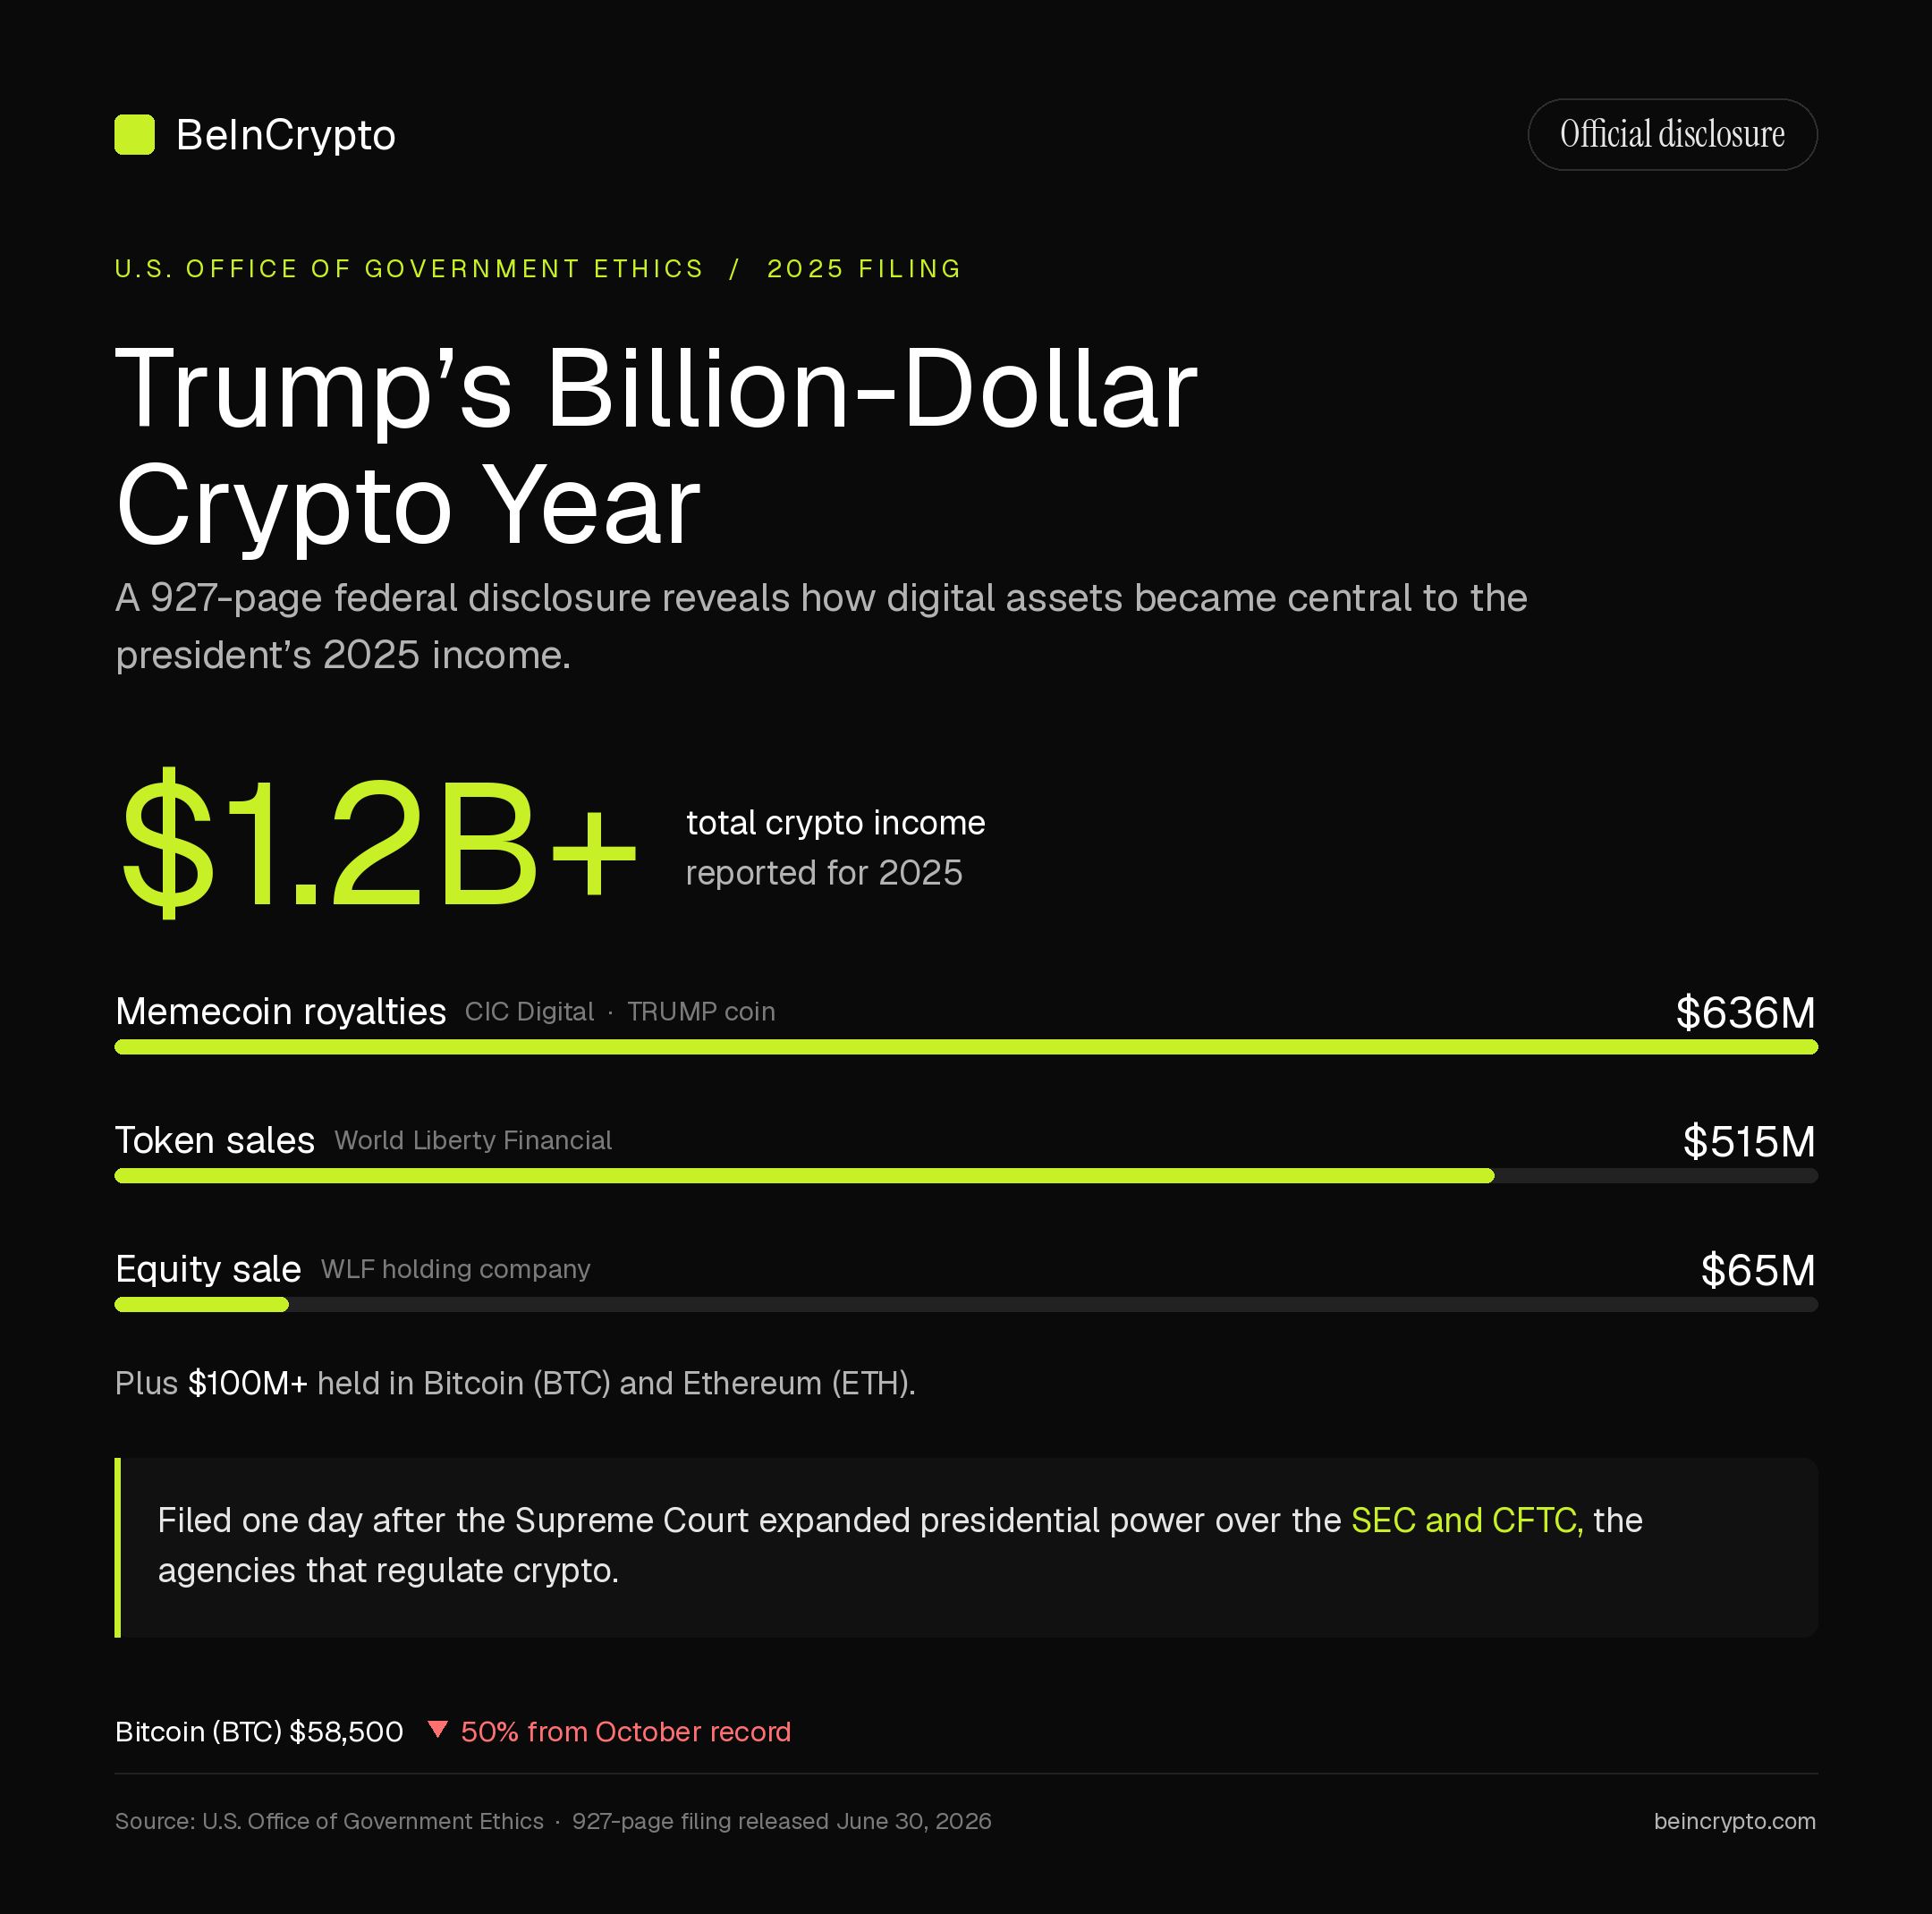
President Donald Trump reported more than $1 billion in crypto earnings for 2025, with a single meme coin and his family’s crypto venture driving most of the income detailed in a new federal financial disclosure.
The 927-page filing, released Tuesday by the Office of Government Ethics, arrived one day after a pivotal Supreme Court ruling. The decision widened presidential power over the independent agencies that regulate digital assets.

Where Trump Crypto Earnings Came From
The filing shows CIC Digital, Trump’s meme coin business, earned about $636 million in royalties. He launched the token three days before his January 2025 inauguration.
World Liberty Financial added about $515 million from token sales and $65 million from equity in its holding company. The decentralized finance (DeFi) venture is roughly 38% owned by a Trump family entity.
Together, the three streams topped $1.2 billion. Trump separately disclosed more than $100 million in Bitcoin (BTC) and Ethereum (ETH) holdings.
The stake ties him to a Trump family crypto empire built on assets he now helps regulate.
Disclosure Lands Beside a Major Court Ruling
The disclosure followed Trump v. Slaughter, a Supreme Court decision that lets presidents fire commissioners at independent regulators without cause.
The 6-3 ruling overturned Humphrey’s Executor, a 91-year-old precedent that had shielded those agencies from the White House. Legal analysts say it extends to the SEC and CFTC, the main crypto regulators.
The timing sharpened questions about Trump’s dual role as policymaker and crypto investor. Trump welcomed the outcome.
“This Decision gives tremendous additional Power back to the Presidency, where it belongs. It is an Honor to be the sitting President who, after all these years, WON this very important, and hard fought, Case,” Trump noted in a Truth Social post.
Follow us on X to get the latest news as it happens
Scrutiny Over Conflicts of Interest Grows
World Liberty Financial has drawn the sharpest scrutiny. In May 2025, Abu Dhabi state fund MGX settled a $2 billion Binance investment using the firm’s USD1 stablecoin.
That deal routed foreign-government money through a token the president’s family helps control. Senate Democrats demanded hearings into the venture over its foreign ties.
The White House has denied that a reported UAE deal shaped the firm. Lawmakers have pushed to bar federal officials from such crypto transactions.
The earnings landed during a market slump. Bitcoin’s spot price sat near $58,500 on Tuesday, down more than 50% from its October record.
Most small wallets that bought the meme coin have lost money, public data shows. Trump’s gains, set against those losses, will keep his stakes under watch as his agencies write the sector’s rules.
The post Trump Reports Over $1 Billion in Crypto Earnings in 2025 Disclosure appeared first on BeInCrypto.


A bridge asset is a cryptocurrency used as a neutral middle step to move value between two different currencies without pre-funding accounts in each one. XRP and XLM were both built for this job. Here is how a bridge asset works, the problem it solves, and the hard question of whether being a bridge makes a token valuable.
Summary
- A bridge asset is a cryptocurrency used as a neutral intermediary to convert one currency into another, source currency into bridge asset into destination currency, without holding pre-funded accounts in every currency.
- The problem it solves is the cost of traditional cross-border payments, where banks must lock up capital in pre-funded accounts around the world; a bridge asset frees that capital by settling in seconds.
- XRP and XLM are the two most prominent bridge assets, designed respectively for Ripple’s payment network and the Stellar network, both aiming to move value between currencies quickly and cheaply.
- The hard question is whether serving as a bridge creates lasting demand for the token, because a bridge asset is held only momentarily during a transfer, a tension known as the velocity problem.
- Stablecoins increasingly compete as bridge instruments, offering price stability that a volatile bridge token cannot, which complicates the long-term value case for bridge assets.
A bridge asset is a cryptocurrency that serves as a neutral intermediary for moving value between two different currencies, allowing a sender to convert from one currency into the bridge asset and then out into another currency, without needing to hold pre-funded balances in each currency along the way. The idea sits at the heart of one of crypto’s oldest and most practical use cases, cross-border payments, and it is the design purpose behind two of the largest cryptocurrencies by market value, XRP and XLM.
In a world where moving money across borders is slow, expensive, and capital-intensive, a bridge asset promises a faster and cheaper path: instead of a bank needing accounts pre-funded with local currency in every country it pays into, it can convert the source currency into a bridge asset, send that asset across a blockchain in seconds, and convert it into the destination currency on the other side. The bridge asset is the universal middle step, the common denominator that connects any currency to any other without requiring a direct relationship between them.
Understanding the bridge-asset concept is the key to understanding what XRP and XLM were actually built to do, and also to understanding the central debate about whether that role makes them valuable. This guide explains what a bridge asset is and the specific problem it solves, how the mechanics work step by step, how XRP and XLM each implement the idea, a worked example of a cross-border payment, the crucial difference between a bridge asset and a cross-chain bridge, and then the hard part: the unresolved question of whether being a bridge asset creates sustained demand for a token, including the velocity problem and the growing competition from stablecoins.
The aim is to give you both the clear mechanical picture and the honest analytical debate, because the bridge-asset story is genuinely useful technology wrapped around a genuinely contested investment thesis, and you cannot understand one without the other. This is educational material, not investment advice.
The problem a bridge asset solves
To see why a bridge asset is useful, you have to understand the problem with how cross-border payments traditionally work, because the bridge asset is an answer to a specific and expensive inefficiency. When money moves across borders through the conventional banking system, it travels through a network of correspondent banks, each holding accounts with the others. To pay out in a foreign currency, a bank typically needs a pre-funded account in that currency, sitting in a bank in the destination country, a setup known in the industry as nostro and vostro accounts.
The bank fills these accounts in advance with the local currency so that when a payment needs to be made, the money is already there to send. Multiply this across every currency and every corridor a large bank operates in, and the result is enormous amounts of capital locked up around the world, sitting idle in pre-funded accounts purely so that payments can be made when needed. That trapped capital has a cost, and it is one of the reasons cross-border payments are expensive, slow, and inaccessible to smaller players.
A bridge asset attacks this problem directly by eliminating the need for pre-funding. Instead of holding local currency in an account in the destination country, an institution can convert the source currency into the bridge asset at the moment of payment, send the bridge asset across a blockchain to the destination in a matter of seconds, and convert it into the local currency there, where it is paid out. Because the whole round trip happens almost instantly, there is no need to keep capital parked in advance; the liquidity is sourced and settled on demand. This is the core promise of a bridge asset: it replaces pre-funded, idle capital with just-in-time conversion, freeing up the money that would otherwise be locked in nostro accounts and making cross-border settlement faster and cheaper.
A neutral bridge asset is especially powerful because it does not belong to any one country or currency, so it can connect any pair of currencies without requiring a direct trading relationship between them. Rather than maintaining liquidity between every possible pair of currencies, which grows impossibly complex as you add currencies, institutions only need liquidity between each currency and the single common bridge. The bridge asset becomes the hub that every spoke connects to.
How the mechanics work
The mechanics of a bridge-asset payment follow a consistent pattern regardless of which asset is used, and walking through the steps shows why speed is everything. The process begins when a sender wants to move value from a source currency to a destination currency.
First, the source currency is converted into the bridge asset, typically on an exchange or liquidity venue in the source market, turning, say, dollars into the bridge token at the current market rate.
Second, the bridge asset is transferred across its blockchain from the source side to the destination side, a step that takes seconds on the networks designed for this purpose.
Third, on the destination side, the bridge asset is converted into the local currency at a liquidity venue in that market, turning the token into, say, pesos or euros, which are then paid out to the recipient.
The entire sequence, convert in, transfer, convert out, completes in seconds rather than the days a traditional cross-border transfer can take. The reason speed matters so much is that it is what makes pre-funding unnecessary, and it also limits the risk of holding the bridge asset. Because the bridge token is only held for the few seconds between conversion in and conversion out, the parties are exposed to its price for only a moment, which limits the risk that the token’s volatility moves against them during the transfer. This is essential, because bridge assets like XRP and XLM are themselves volatile cryptocurrencies, and no institution would want to hold a volatile asset for long simply to make a payment.
The design solves this by minimizing the holding time to near zero. It also depends on deep liquidity at both ends: there must be enough of a market to convert the source currency into the bridge asset, and the bridge asset into the destination currency, without large price slippage, which is why bridge-asset systems concentrate on building liquidity in the corridors they serve. When liquidity is deep and the transfer is fast, the bridge-asset path can be cheaper and faster than the correspondent-banking alternative. When liquidity is thin, the conversions become expensive and the advantage erodes, which is one of the practical limits of the model and one reason adoption has concentrated in specific corridors rather than spreading evenly everywhere.
How XRP and XLM implement the idea
XRP and XLM are the two most prominent bridge assets, and although they share the core concept, they come from related but distinct lineages. XRP is the native asset of the XRP Ledger and is the bridge asset used by Ripple’s cross-border payment offering, where it functions as the intermediary for sourcing liquidity on demand instead of pre-funding destination accounts. Ripple’s branded implementation of this, its on-demand liquidity service, is the productized version of using XRP as a bridge between currencies for institutional payments, and it is the clearest real-world deployment of the bridge-asset concept at scale.
The XRP Ledger settles transactions in a few seconds with very low fees, which are the properties a bridge asset needs, and XRP’s entire original design rationale was to serve as this neutral settlement intermediary between currencies. When people describe XRP as a “bridge currency,” this is what they mean: an asset meant to sit in the middle of cross-border value transfers, converted in and out within seconds.
XLM, the native asset of the Stellar network, was designed with a closely related purpose, and Stellar’s architecture makes the bridge role especially explicit. Stellar was built to move money between currencies cheaply, with a particular focus on payments, remittances, and financial inclusion. On Stellar, institutions called anchors issue tokens that represent fiat currencies, backed by reserves, and the network includes a built-in decentralized exchange and a feature called path payments that automatically finds the cheapest route to convert one asset into another. XLM serves as a bridge in this system, a neutral asset that can connect currency pairs that lack a direct market, and it is also used to pay the network’s small transaction fees.
So both assets are built around the same fundamental idea, a fast, cheap, neutral intermediary for moving value between currencies, but XRP is most associated with institutional, bank-facing cross-border payments through Ripple, while XLM is most associated with a more open, anchor-based network oriented toward payments and financial inclusion. Both illustrate the bridge-asset concept in production, and both face the same hard question about whether the role translates into lasting token value.
A worked example
Trace a single payment to make the concept concrete. Imagine a business in the United States needs to pay a supplier in Mexico the equivalent of $10,000, and consider how this works with and without a bridge asset. In the traditional model, the US business’s bank would rely on having a pre-funded account holding Mexican pesos at a bank in Mexico, or on a chain of correspondent banks that do. The payment instruction passes through this chain, the pesos are paid out from the pre-funded account, and the whole process can take one to several business days, with fees taken at multiple points and a large amount of peso liquidity sitting idle in that account at all times to make such payments possible. The cost of that idle capital, plus the intermediary fees, is what makes the traditional transfer expensive.
In the bridge-asset model, the same payment takes a different path. The $10,000 is converted into a bridge asset, say XRP or XLM, on a liquidity venue in the United States, turning dollars into the token at the current rate. The bridge asset is then sent across its blockchain to Mexico in a matter of seconds. On the Mexican side, the bridge asset is immediately converted into pesos on a local liquidity venue, and the pesos are paid out to the supplier.
The entire round trip completes in seconds, and at no point did anyone need to keep pesos pre-funded in advance, because the liquidity was sourced on demand at the moment of payment. The business’s bank did not need idle peso capital sitting in Mexico; it converted exactly what it needed, exactly when it needed it. If the liquidity on both ends is deep, the total cost of the two conversions plus the tiny network fee can be lower than the traditional route, and the settlement is far faster. This is the bridge asset doing its job: replacing days and pre-funded capital with seconds and just-in-time conversion. The token was held for only the few seconds of the transfer, which is the whole point of the design, and also, as the next sections explain, the source of the central debate about its value.
Bridge asset versus cross-chain bridge
A crucial point of confusion deserves its own section, because the word “bridge” is used in two very different ways in crypto and conflating them leads to real misunderstanding. The bridge asset described in this guide is about moving value between currencies, an asset used as a neutral intermediary to convert one currency into another in a payment. A cross-chain bridge, by contrast, is about moving tokens between blockchains, a piece of infrastructure that lets you take a token on one blockchain and represent or transfer it onto a different blockchain, for example moving an asset from Ethereum to another network. These are entirely different concepts that happen to share a word. A bridge asset is a currency playing a role in a payment; a cross-chain bridge is software connecting two blockchains, often by locking a token on one chain and minting a wrapped version on another.
The distinction matters for several reasons. First, the risks are completely different. Cross-chain bridges have been among the most exploited pieces of infrastructure in crypto, with several large hacks resulting from vulnerabilities in the smart contracts that lock and mint tokens across chains, so “bridge risk” in that context refers to the security of that connecting infrastructure. A bridge asset used in a payment carries different risks, mainly the price volatility of the token during the brief moment it is held and the depth of liquidity on each side, not smart-contract exploit risk of a chain-connecting bridge.
Second, the purpose is different: a bridge asset answers “how do I move value from one currency to another,” while a cross-chain bridge answers “how do I move a token from one blockchain to another.” When you read about XRP or XLM as bridge assets, the meaning is the currency-to-currency payments sense, not the chain-to-chain infrastructure sense. Keeping the two ideas separate is essential to understanding both the technology and the risks, because a discussion that mixes them will mislead on both. The shared word is an unfortunate accident of terminology, and the careful reader learns to ask which kind of bridge is meant.
Does being a bridge asset make a token valuable?
Now the hard question, the one that turns a clean technical story into a truly contested investment debate: does serving as a bridge asset actually create lasting demand for the token, and therefore support its value? The intuitive answer is yes, surely a token used to move large volumes of cross-border payments must capture value from that usage. But the reality is more complicated, and the complication has a name: the velocity problem.
A bridge asset, by design, is held for only the few seconds of a transfer. It is bought, used, and sold almost instantly, never accumulated. High transaction volume through a bridge asset therefore does not necessarily translate into sustained holding demand, because the same units of the token can be reused over and over for many transfers without anyone needing to hold a growing stockpile. A token can process enormous payment volume while generating little persistent demand to own it, because payments require the token to flow through, not to be held. This is the core tension in the bridge-asset value thesis, and it is why critics argue that network usage and token price can diverge: the network can be busy while the token is weak.
There is a serious counterargument, and the honest treatment gives it weight. Proponents contend that very large and growing payment volume does require deeper liquidity pools at every conversion point, and that maintaining those pools effectively takes a meaningful float of the token out of circulation, creating a baseline of demand that scales with usage. They argue that if a bridge asset became the settlement layer for a significant share of global cross-border value, the liquidity required to support that volume without slippage would be substantial and persistent, supporting the token’s value even if no individual holder keeps it for long.
The debate, then, is between the velocity critique, which says payments flow through without creating holding demand, and the liquidity-depth argument, which says sufficient scale forces a persistent float. Layered on top is a growing competitive threat: stablecoins. A stablecoin pegged to a currency can serve as a bridge instrument too, moving value between parties quickly, and it offers something a volatile bridge token cannot, price stability, so neither sender nor receiver bears volatility risk during the transfer.
As regulated stablecoins proliferate, including ones issued by the very companies behind bridge-asset networks, some of the cross-border settlement role that bridge tokens were meant to fill may flow to stablecoins instead, which would weaken the demand case for the volatile bridge asset. None of this is settled, and a careful reader should hold all of it at once: the bridge-asset technology is real and useful, the velocity problem is a genuine challenge to the token-value thesis, the liquidity-depth rebuttal is a legitimate counter, and stablecoin competition is a real and growing complication. The mechanism works; whether it makes the token valuable is the open question.
Frequently Asked Questions
What is a bridge asset in crypto?
A bridge asset is a cryptocurrency used as a neutral intermediary to move value between two different currencies. Instead of converting one currency directly into another, or keeping pre-funded accounts in every currency, a sender converts the source currency into the bridge asset, sends that asset across a blockchain in seconds, and converts it into the destination currency on the other side. The bridge asset is the common middle step that can connect any currency to any other without a direct relationship between them. XRP and XLM are the two most prominent examples, both designed to make cross-border payments faster and cheaper by replacing idle pre-funded capital with just-in-time conversion through the bridge token.
How is XRP used as a bridge asset?
XRP is the native asset of the XRP Ledger and serves as the bridge in Ripple’s cross-border payment system. Instead of a bank pre-funding accounts with local currency in every destination country, it can convert the source currency into XRP, send the XRP across the ledger in a few seconds at very low cost, and convert it into the destination currency on arrival. Ripple’s branded version of this is its on-demand liquidity service, the productized use of XRP as a settlement bridge for institutional payments. XRP’s original design purpose was exactly this neutral-intermediary role, which is why it is described as a bridge currency: an asset meant to sit briefly in the middle of cross-border value transfers.
Is XLM the same as XRP?
They share the same core idea but are distinct assets on distinct networks. XLM is the native asset of the Stellar network, which was built to move money between currencies cheaply with a focus on payments, remittances, and financial inclusion. On Stellar, institutions called anchors issue fiat-backed tokens, and the network’s built-in exchange and path-payment feature find the cheapest route to convert one asset into another, with XLM serving as a bridge between pairs that lack a direct market and paying the network’s small fees. XRP, by contrast, is most associated with institutional, bank-facing cross-border payments through Ripple. Both are bridge assets built around fast, cheap, neutral settlement, but they come from different networks with different emphases.
What problem does a bridge asset solve?
It solves the cost and slowness of traditional cross-border payments, specifically the need to pre-fund accounts. In the conventional system, a bank must keep accounts filled in advance with local currency in every country it pays into, known as nostro and vostro accounts, which locks up enormous amounts of capital sitting idle around the world. A bridge asset removes this need by sourcing liquidity on demand: the institution converts into the bridge asset and out into the destination currency at the moment of payment, in seconds, so no capital has to sit pre-funded. This frees up trapped liquidity and can make cross-border settlement faster and cheaper, which is the central promise of the bridge-asset model.
Does high payment volume make a bridge asset valuable?
Not necessarily, and this is the central debate. A bridge asset is held for only the few seconds of a transfer, so it is bought, used, and sold almost instantly instead of accumulated. This means high payment volume does not automatically create sustained demand to hold the token, because the same units can be reused for many transfers, a tension known as the velocity problem. Proponents counter that very large volume requires deeper liquidity pools, which take a meaningful float out of circulation and create demand that scales with usage. The question is unresolved, and it is complicated further by stablecoins, which can serve as bridge instruments too while offering price stability a volatile token cannot.
Is a bridge asset the same as a cross-chain bridge?
No, and confusing them is a common error. A bridge asset is a currency used to move value between two different currencies in a payment. A cross-chain bridge is infrastructure that moves tokens between two different blockchains, often by locking a token on one chain and minting a wrapped version on another. They share the word “bridge” but are entirely different concepts with different risks. Cross-chain bridges have been frequently exploited through smart-contract vulnerabilities, so their risk is about infrastructure security, while a bridge asset’s risks are mainly the token’s price volatility during the brief holding period and the depth of liquidity on each side. When XRP or XLM are called bridge assets, the meaning is the currency-to-currency payments sense.
This article is educational information, not financial or investment advice. Descriptions of XRP, XLM, and their networks reflect their design and general operation as understood in mid-2026 and can change. Nothing here is a recommendation about any asset, and the question of whether bridge assets accrue value is truly contested. Cryptocurrency is volatile, and you can lose money. Do your own research and consult a qualified professional before making any decision.


What if an artificial intelligence health coach could optimize your daily energy levels without sending a single byte of your private medical data to a corporate cloud server? That’s what Sleepagotchi is trying to achieve with its new AI-powered decentralized wellness application.
Summary
- Sleepagotchi uses AI agents that process health data directly on users’ devices to deliver personalized wellness insights while keeping biometric information private.
- The platform plans to use its SLEEP token for premium AI features, staking, and marketplace activity while offering basic health coaching for free.
- Sleepagotchi has raised $6.5 million, supports major wearable devices, and has partnered with Solana, Soneium, and Square Enix as it expands its Web3 wellness ecosystem.
With the advent of wearable devices, people have become significantly more health-conscious, tracking everything from daily workouts to baseline heart rate metrics. And with artificial intelligence now smart enough to analyze thousands of biological data points in seconds, the technology can do far more than just display numbers. This has created a market for intelligent applications that can interpret these numbers and turn the raw biometric signals into actionable daily advice.
Sleepagotchi was originally developed as a casual “sleep-to-earn” mobile mini-game that rewarded players with digital collectibles for maintaining a consistent bedtime routine.
However, the team soon realized that poor sleep sits at the root of almost all health and mood problems, which led them to expand the mini-game into a full wellness application that uses artificial intelligence to analyze data from phones and wearables for personalized health insights.
“What we noticed is that sleep is at the root of all health problems. If a user has problems with their sleep, it affects everything, including their mood and overall health,” Sleepagotchi CEO Kenny Wood told crypto.news during an interview.
“Originally, we had a sleep monitoring system in the game, and we’ve expanded that into a health app with sleep at its root. It takes health and wellness data from wearables and even from the phone and processes it to generate insights using AI. That’s basically what we’re doing with Sleepagotchi and the health app.”
What Sleepagotchi is trying to do is blend on-device artificial intelligence and utility-focused cryptocurrency infrastructure to deliver deep, personalized wellness insights while giving users complete ownership of their health data.
While this may sound pretty ambitious at first glance, the underlying software platform uses a decentralized multi-agent system where four different digital entities handle specific lifestyle tasks right on the device.
Instead of routing personal logs to an external cloud server, the application coordinates a sleep coach, a wellness coach, a meal planner, and a shopping agent that pass state data to one another in real-time.
“Basically, all the data is processed within the phone, so the data as a whole is kept on the phone,” Wood said, adding that the sleep coach studies rest patterns and passes those insights directly to the wellness assistant.
When the wellness assistant detects that a user feels fatigued despite sleeping enough, the system automatically checks for potential nutritional gaps. The platform can suggest adding specific items like leafy greens to address iron deficiencies before sending those details directly to the meal planner for custom ingredient lists.
“Those kinds of supplements and ingredients can then be given to the shopping agent,” Wood said.
To make things easier for the everyday user, Sleepagotchi also lets users set a personalized spending budget, which can then be used by the shopping agent to automatically purchase the necessary ingredients and supplements with a single click.
Even with all this, giving out your personal health information to third-party corporations may not sound ideal, but Wood has reiterated that sensitive biometric information doesn’t leave the individual smartphone, not even on the blockchain.
The decision to restrict processing entirely to local hardware represents a major change from the startup’s early roadmap, which originally included an on-chain data marketplace for research firms.
“We had the idea of giving the user the ability to sell their data, but we quickly found that it was unworkable and unfeasible, and there are laws pertaining to this,” Wood explained, noting that commercial data sales also violate wearable manufacturers’ terms of service.
Even as the industry standard these days is to store sensitive tracking metrics on the cloud, which is very much susceptible to corporate exploitation and data leaks, for Wood, the ideal infrastructure relies on decentralized networks that allow individuals to retain complete authority over their personal information.
What role does crypto play in this?
To support such a user-controlled network, any platform would need a viable economic framework that incentivizes permanent decentralization.
Sleepagotchi currently operates locally on individual smartphones using its multi-agent system, but it plans on leveraging its very own native stakable digital asset, which the team calls SLEEP, to power its upcoming marketplace and gate advanced tracking features.
It is common knowledge that running complex Artificial Intelligence models requires substantial amounts of processing power, and that’s where the token economy comes into play.
Sleepagotchi users have access to basic health insights and automated coaching at no cost, but to manage heavy processing demands, the protocol requires premium queries to be paid for with tokens once a user exhausts their daily baseline allotment, creating a natural computational boundary that protects the network from unsustainable resource strain.
“The user will pay with the sleep token for extra credits to get further information from the AI about the health and wellness data,” Wood explained. “The actual infrastructure for AI is pretty strong as it is and can handle a lot of users, so the blockchain can just focus on handling the transactions and staking side of things.”
Other revenue streams built into the platform ecosystem are designed to scale alongside user adoption.
While premium user subscriptions for advanced health tracking provide a recurring baseline of traditional capital, Sleepagotchi plans to use commercial interactions within its upcoming marketplace to introduce additional monetization layers, including listing fees and staking bonds required for external business partners to participate.
Finally, localized ingredient orders yield affiliate commerce revenue through the built-in Shopping Agent whenever a user opts for an automated product recommendation.
So far, Sleepagotchi has raised $6.5 million from investors including 6th Man Ventures, Collab+Currency, Inception, Sfermion, 1kx, Alliance, Signum Capital, GSR, and several other venture firms and angel investors. According to company documentation, the platform has attracted more than 2 million users and generated over $100,000 in revenue during a three-week beta period.
Sleepagotchi can be integrated with wearable devices such as WHOOP, Oura, Apple Watch, Cudis, and Pulse as of publication time.
On the Web3 and infrastructure side, the project has secured partnerships with ecosystems like Solana and Soneium, alongside native protocols such as Bonk, MOOAR, Pixels, Cudis, and Pulse.
The project has also secured a high-profile integration with legacy gaming giant Square Enix, bridging the application directly into traditional, mainstream entertainment markets.

The Bitcoin holding level of long-term investors has reached a record high of 14.7 million Bitcoin, which could suggest that the crypto market bottom will come early, according to Cory Klippsten, CEO of Swan Bitcoin.
“We’re at an all-time high of BTC held in addresses of long-term holders,” Klippsten told Cointelegraph in an interview, which he said has “marked cycle lows historically.”
Bitcoin (BTC) supply held by long-term holders reached 14.7 million BTC on Wednesday, an all-time high that “signals continued conviction” among seasoned investors, according to crypto analytics platform Glassnode.
Klippsten said these figures suggest that Bitcoin may find its cycle bottom earlier compared to previous cycles. That stands in contrast to several other analyses, including Lebit Mining Pool founder Jiang Zhuoer, who predicted that Bitcoin would only bottom between October and December 2026, or about six months after Strategy’s Multiple to Net Asset Value (mNAV) found its cycle low.
“MSTR’s mNAV has already dropped to 0.72,” approaching the lowest point of 0.7 seen on May 11, 2022, wrote Zhuoer, adding that Bitcoin may bottom with a six-month gap following Strategy’s mNAV, which may result in a cycle low near $42,000 to $44,000.
The mNAV measures a company’s stock market value compared to the intrinsic value of its treasury holdings. Both predictions suggest that Bitcoin’s price may sink lower, offering cheaper entry points for investors.

Cointelegraph’s Ciaran Lyons (left) and Swan Bitcoin CEO Cory Klippsten (right), during an interview. Source: Cointelegraph
BTC long-term holder supply up 14% since November
Long-term holders restarted their Bitcoin accumulation at the end of 2025, nearly two months after early October’s record $19 billion liquidation event.
The supply of Bitcoin held by long-term holders was 16.65 million BTC at publication time, up 14% from 14.6 million BTC on Nov. 26, data provider Coinglass shows.
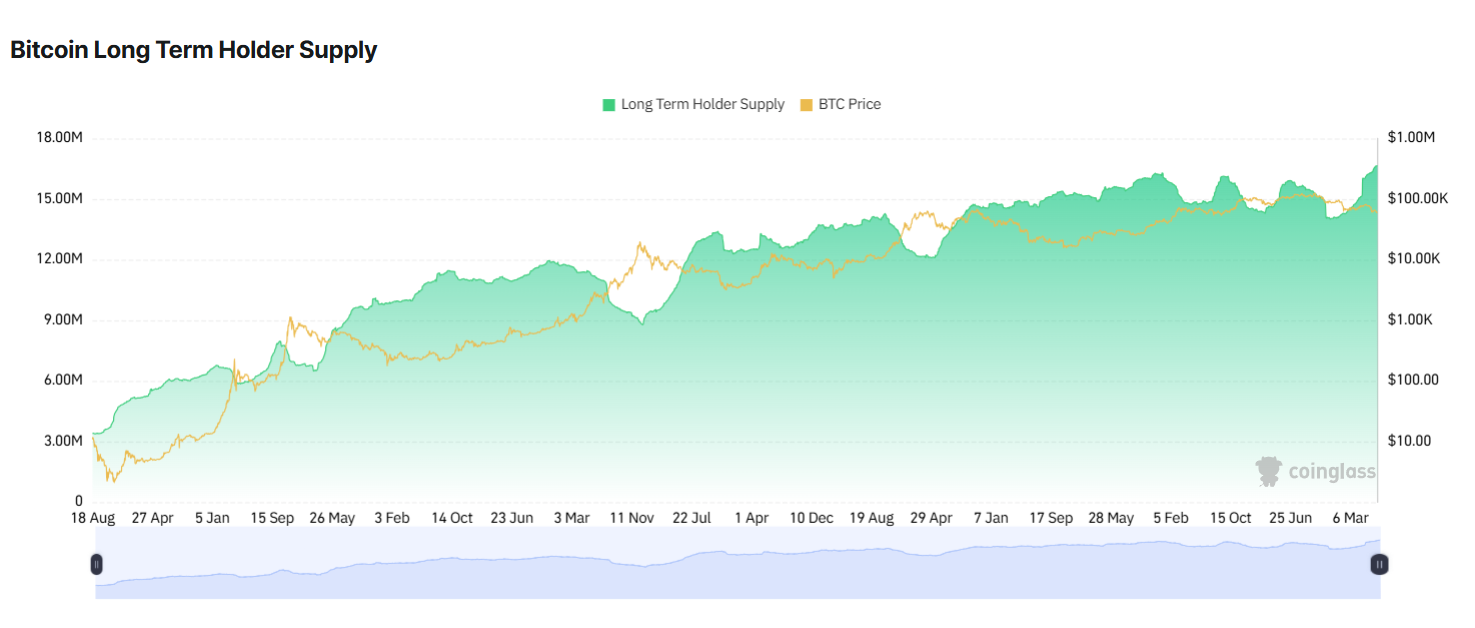
Bitcoin long-term holder supply chart. Source: Coinglass
Coinglass tracks Bitcoin held by long-term holders, or addresses that held BTC for at least 155 days. Increases in that cohort are often seen as a sign of confidence in Bitcoin’s future value, showing reluctance to sell at current prices.
Related: DeFi TVL drops 39% in 2026 amid market downturn and record hack activity
CLARITY Act uncertainty weighs on Bitcoin demand
Other regulatory developments may also influence Bitcoin’s price action, such as the uncertainty about the passage of the CLARITY Act, according to crypto-focused asset manager Grayscale.
If the CLARITY Act doesn’t pass this year, Strategy and other treasury companies may continue to further “deleverage,” causing Bitcoin to “fall moderately further,” wrote Grayscale’s head of research, Zach Pandl, in a Friday report.
On Monday, Galaxy Digital cut its odds of the CLARITY Act becoming law in 2026 to 50%, warning that the US Senate is running out of time to move the crypto market structure bill before its August recess.
The legislation is set for a House of Representatives committee hearing on July 17. The bill aims to establish the first regulatory framework for digital assets in the US, but has faced pushback from the banking industry over allowing yield on stablecoin holdings.
Magazine: Bitcoin, the ‘canary in the coal mine,’ XRP transaction demand falls 91.5%: Market Moves

Donald Trump’s latest annual financial disclosure suggests his cryptocurrency-related ventures generated more income for him in 2025 than his real estate and resort businesses, reigniting scrutiny over potential conflicts of interest as his administration has promoted pro-crypto policies.
The U.S. Office of Government Ethics (OGE) released Trump’s 2025 annual financial disclosure on Tuesday in a report spanning 927 pages, showing that he earned more than $1.4 billion from crypto-linked activities last year. According to reporting by BBC, White House Deputy Press Secretary Anna Kelly said Trump has “proudly made the United States the crypto capital of the world,” adding that neither the president nor his family has “ever engaged — or will ever engage — in conflicts of interest.”
Key takeaways
- Trump’s OGE financial disclosure reports over $1.4 billion in income tied to crypto ventures for 2025, surpassing income from his real estate and resorts.
- Memecoin licensing royalties were identified as the largest income source, followed by proceeds tied to World Liberty Financial token sales.
- The filing also indicates Trump holds cryptocurrency assets, including Bitcoin and Ether, as well as stablecoins such as USDC.
- Critics argue the structure of personal profit alongside government policy support raises conflict-of-interest concerns, while the White House rejects that claim.
Crypto income dwarfs real estate and resorts
As detailed in the OGE filing released Tuesday, Trump reported more than $1.4 billion in income from crypto-related ventures in 2025. The scale of that figure stands out against his business income from traditional assets, including Mar-a-Lago and a portfolio of golf clubs and resorts.
In the same disclosure, Trump reported more than $290 million in income connected to revenue from his Mar-a-Lago Club in Palm Beach, Florida, along with other properties and resorts he owns. The contrast is central to the controversy surrounding the disclosures: critics point to the proximity between the administration’s stance on digital assets and the president’s family-linked financial activity.
Memecoins and World Liberty Financial lead the earnings
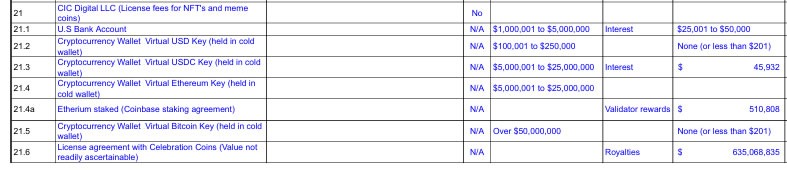
According to the disclosure, the biggest reported contributor to Trump’s crypto-related income came from the licensing and sale of memecoins, including “Trump Coin.” The filing attributes roughly $635 million in “royalties” to a “license agreement with Celebration Coins.”
The next-largest category cited in the report relates to World Liberty Financial, a DeFi platform associated with the Trump family. The disclosure states it generated about $588 million through “proceeds from token sales,” making it the second-largest income stream in the crypto portfolio described.
Trump’s reported crypto income also includes $197 million from selling equity in a stablecoin venture, the filing indicating a separate line item tied to that investment activity.
Digital assets listed in the filing
Beyond income, the disclosure also outlines certain crypto holdings. The filing states Trump owns more than $50 million in Bitcoin, with between $5 million and $25 million in Ether held in cold wallets.
In addition, the report references holdings that include USDC and USD Key (KEY). The presence of stablecoins and major cryptocurrencies among disclosed assets adds another dimension to questions about how personal exposure to the market intersects with government policy decisions affecting the sector.
White House response and renewed political pressure
Trump Organization communications emphasized what it characterized as transparency. Reuters reported that the Trump Organization said the filing’s “breadth and depth” underscores its commitment to transparency, describing the report as comprehensive.
Public Citizen, a nonprofit consumer advocacy group, took the opposite view. In a statement released Tuesday, the group called the reported crypto earnings an “obscene crypto grift,” arguing that the alignment between personal profit interests and government activity creates conditions for legislation that could put consumers at risk. Public Citizen co-president Robert Weissman was quoted urging Congress to act, warning that such conflicts could facilitate “mass rip-offs” and potentially threaten stability across the financial system.
In its broader critique, Public Citizen framed the disclosure as evidence that the president’s financial incentives are increasingly tied to the cryptocurrency industry itself. The White House, through Kelly’s statement to the media, denied any conflict concerns, asserting that the president and his family have not engaged—and will not engage—in conflicts of interest.
For investors and users watching the sector, the immediate follow-up is political rather than market-driven: the disclosures strengthen the case made by critics and may increase legislative and oversight focus on how digital-asset policy is crafted when the executive branch and private crypto interests appear intertwined. The key uncertainty remains how regulators and lawmakers will respond, and whether any specific conflict-of-interest questions translate into enforceable changes to rules or process.
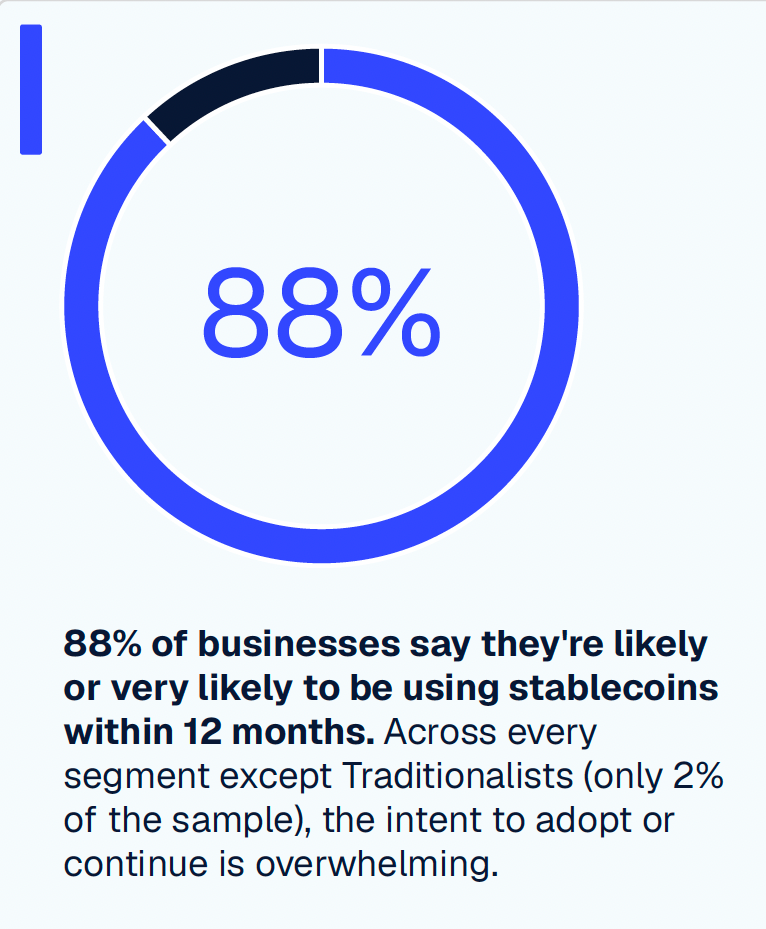
Business use of stablecoins is poised to surge in the next 12 months as adoption of the digital currency goes mainstream, according to a new report from payments infrastructure firm Cybrid.
The report found 42% of businesses surveyed are already using stablecoins for cross-border payments and 88% of respondents said they are likely or very likely to use stablecoins within the next 12 months. Still, only 2% identified as committed users of traditional payment rails.
Businesses using stablecoins reported average cross-border payment cost savings of 35%, with companies processing more than $100 million in monthly payment volume reporting average savings of up to 47%, according to the survey.

Source: Cybrid report
The global stablecoin market cap is now at $307.64 billion, led by Tether’s USDT, at $184.7 billion, and Circle’s USDC, at $73.51 billion, Coingecko data shows. Fueled by recent legislation, GENIUS Act-compliant stablecoins have reached a market cap of more than $76 billion. That established the first federal regulatory framework for payment stablecoins in the United States.
The report is based on a survey of 468 executives and business leaders conducted between April 28 and May 4.
Varied users look for regulatory clarity to gain confidence
Payroll and contractor payments were the most common stablecoin use case among respondents, followed by supplier payments, customer payments, investment and yield generation, vendor payments, and treasury and liquidity management.
Regulatory clarity was also a top factor respondents said would increase their confidence in expanding stablecoin use, with 71% identifying it as more important than trusted infrastructure providers or integration with existing systems.
Respondents came from the technology, financial services and ecommerce sectors in the United States, Canada and the United Kingdom, including C-suite executives, finance and treasury managers, and payments and operations leaders.
Related: Breez launches Bitcoin-to-stablecoin payments across more than 30 blockchains
Companies expand infrastructure for stablecoin payments
Separate industry data points to the same trend. In June, payments infrastructure provider Paybis said business customers accounted for nearly 98% of stablecoin payout volume processed through its platform during the first four months of 2026, up from 36% in 2023.
Paybis also cited McKinsey research estimating that business-to-business transactions accounted for roughly 60% of the $390 billion in global stablecoin payment volume recorded in 2025.
Companies have continued expanding infrastructure to support growing business demand. In May, Falcon Finance debuted the dollar-backed stablecoin fUSD through Anchorage Digital Bank’s federally regulated issuance platform, targeting institutional trading, collateral and treasury workflows.
On Monday, BNY expanded its digital asset custody platform to support Circle’s USDC, allowing institutional clients to store, transfer, mint and redeem the stablecoin directly through the bank.
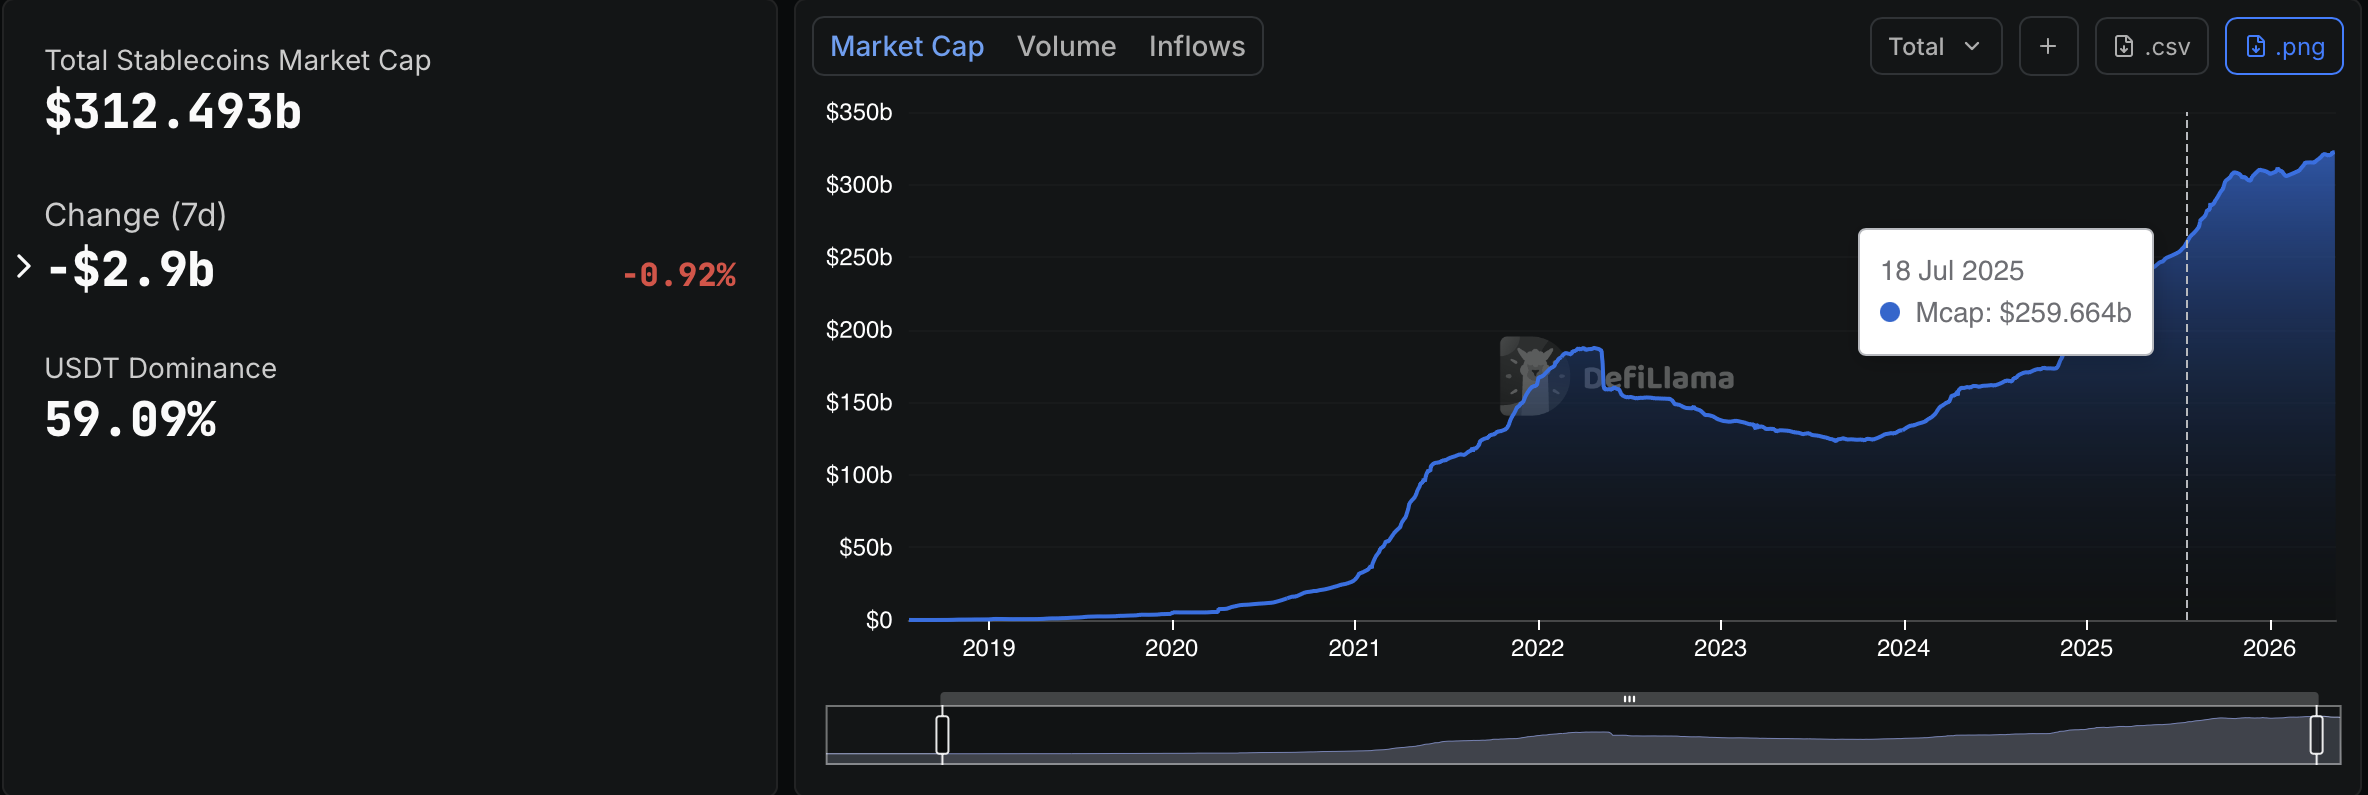
Source: DefiLlama
Magazine: AI is banking the unbanked in Africa… faster than crypto

US President Donald Trump’s cryptocurrency ventures generated more income for him in 2025 than real estate or resort businesses, according to his latest financial disclosures.
Donald Trump’s annual financial disclosure report was released by the US Office of Government Ethics on Tuesday, revealing more than $1.4 billion in income from crypto-related ventures last year.
The filings show Trump has profited substantially from an industry that he’s simultaneously regulating, which critics say creates a conflict of interest. In 2025, his administration pushed pro-crypto policy, a friendlier regulatory environment and executive orders favorable to digital assets, while his family’s ventures generated vast income as crypto markets surged to an all-time high.
In a statement to the media, White House Deputy Press Secretary Anna Kelly said Trump had “proudly made the United States the crypto capital of the world.”
“Neither the President nor his family has ever engaged – or will ever engage – in conflicts of interest,” she added.
Memecoins and WLFI top earners
According to the 927-page disclosure, the licensing and sale of memecoins such as Trump Coin (TRUMP) generated the most income for Trump, with about $635 million coming from “royalties” in a “license agreement with Celebration Coins.”
Meanwhile, the Trump family’s DeFi platform, World Liberty Financial, was the second-biggest earner, generating about $588 million from “proceeds from token sales.”
The disclosure also revealed that Trump earned $197 million from selling equity in a stablecoin venture.
Trump’s memecoin income disclosures. Source: US OGE
This combined crypto income dwarfs the second category, real estate and resorts, with the president reporting more than $290 million in income related to revenue from his Mar-a-Lago Club in Palm Beach, Florida, and various golf clubs and resorts he owns.
Public Citizen calls for action
The Trump Organization said in a statement that “the breadth and depth of this filing further underscores our commitment to transparency,” according to Reuters.
“At nearly 1,000 pages, it represents one of the most comprehensive financial disclosure reports ever submitted and demonstrates a level of financial transparency unmatched in presidential history.”
Related: Donald Trump has 10 days to decide on housing bill with CBDC ban
Public Citizen, a nonprofit consumer advocacy group, called it an “obscene crypto grift” in a statement on Tuesday,
“Trump’s personal profit interest has now aligned him with the crypto industry, paving the way for dangerous legislation that will facilitate mass rip-offs and even threaten financial system stability,” said Public Citizen co-president Robert Weissman as he called on Congress to take action.
Magazine: Bitcoin slides to $58K, XRP hits $1 but onchain data promising: Market Moves
Iran refused to meet US envoys Jared Kushner and Steve Witkoff in Doha on Tuesday June 30. Oil prices rose as ceasefire hopes dimmed in the ongoing war.
Qatar’s prime minister met the Americans in Doha instead of Iranian officials. Iran’s Foreign Ministry said Hormuz mine clearance falls under June’s memorandum of understanding (MoU) and needs no outside help, according to Al Jazeera.
Why Tehran Is Staying Away From Doha
Alex Vatanka, a senior fellow at the Middle East Institute, said Iran’s foreign minister, Abbas Araghchi, and speaker Mohammad Bagher Ghalibaf fear a Doha visit could backfire at home. Both officials want visible progress on the MoU signed June 17 first.
“In Tehran they’re asking where’s the action on the MoU? Why are Iranian assets still frozen? Why is Israel still in Lebanon?”
— Alex Vatanka, Al Jazeera
Ghalibaf said Tehran will not negotiate a final deal until Washington meets every MoU condition. Those conditions include unfreezing Iranian funds and ending hostilities in Lebanon. Iran signed the memorandum on June 17, but says Washington has not met these terms yet.
Oil Climbs as Hormuz Risk Lingers
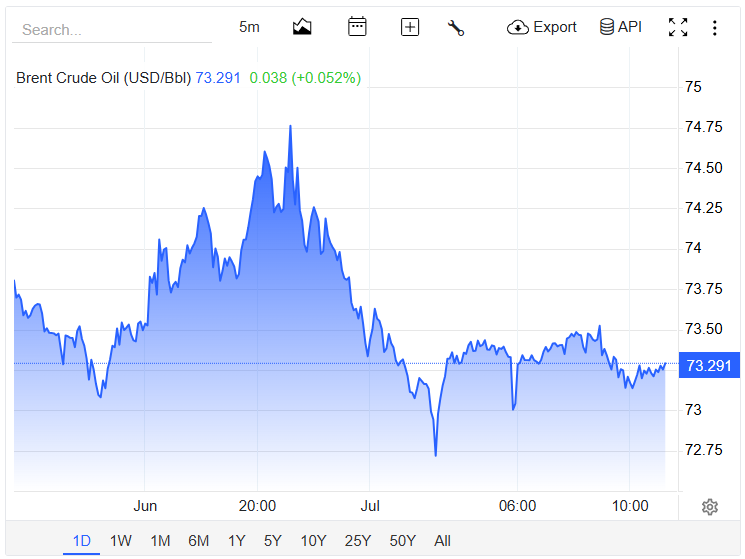
Brent crude peaked at $74.75 a barrel on Tuesday before settling to $73.29 early on Wednesday as traders keep close tabs on Iran’s dealings with the US envoys. Brent had briefly dipped after supertankers resumed Hormuz transit last week.

Vice President JD Vance said tanker traffic through the strait has reached pre-war levels. He also said Iran will not collect tolls from ships passing through Hormuz.
“This is not going to end in a place where the Iranians are collecting tolls on ships going through the Strait of Hormuz.”
— JD Vance, Reuters
US crude inventories fell 6.1 million barrels last week. The International Energy Agency warned in May that global markets would stay undersupplied through the third quarter of 2026.
Brent lost about $45 a barrel between the first and second quarters, its steepest quarterly drop since 2008. WTI fell around $31 in the same period, its biggest drop since 2020. Both benchmarks reversed course as the war de-escalated, pulling back from gains triggered by earlier Iran strikes.
The post Iran Snubs US Envoys in Doha, Dimming Ceasefire Hopes as Oil Rises appeared first on BeInCrypto.

Hollywood director Carl Rinsch has been sentenced to two and a half years in prison for defrauding Netflix out of $11 million, which he spent on crypto, stocks and luxury goods.
A Manhattan federal court on Monday sentenced Rinsch, known for directing the 2013 film “47 Ronin,” starring Keanu Reeves, to 30 months in prison after he was convicted in December on charges including fraud and money laundering.
“Rinsch orchestrated a scheme to steal millions by seeking $11 million from a subscription streaming service, falsely claiming that money would be used to finance a television show that he was creating,” Manhattan US Attorney Jay Clayton said in a statement Monday.
“Instead of using the money to make the show, Rinsch made risky bets on highly speculative stock options and cryptocurrency, and spent millions of dollars on luxury goods for himself,” Clayton added. “Today’s sentence sends a deterrent message: fraud will not be tolerated.”
Rinsch’s sentence was far below the maximum possible prison time of 90 years he was facing for his seven total charges, to which he pleaded not guilty. His defense also argued that he suffered from mental health issues.
The sentence brings to a close a 15-month saga after Rinsch was arrested in March 2025 for defrauding what prosecutors referred to in court documents as “Streaming Company-1,” which multiple reports have identified as Netflix.

Source: US Attorney SDNY
Rinsch makes $27 million on Dogecoin bet
According to a March 2025 indictment and a November 2023 New York Times report on a confidential arbitration proceeding between Netflix and Rinsch, the company initially gave Rinsch $44 million for his sci-fi show “White Horse,” later renamed “Conquest,” but he asked for more funds to finish the show, prompting Netflix to wire an additional $11 million in March 2020.
Rinsch used $10.5 million from the fresh funding to gamble on the stock market and quickly lost about half of it in a few weeks by trading options on pharmaceutical companies and the S&P 500.
Rinsch transferred more than $4 million in remaining funds to crypto exchange Kraken and went all in on the memecoin Dogecoin (DOGE), a bet that ultimately generated around $27 million when he liquidated in May 2021, according to an account statement seen by The Times.

Carl Rinsch giving an interview in 2013 for his feature directorial debut film 47 Ronin. Source: YouTube
With the DOGE winnings, Rinsch then spent about $10 million on personal expenses and luxury goods, including $1.8 million on credit card bills, $1 million on lawyers to sue Netflix, $3.8 million on furniture and antiques, $2.4 million on five Rolls-Royces and a Ferrari, and $652,000 on watches and clothes, according to the indictment.
Related: Onchain, in court: What happened in crypto legal news this week
Rinsch never finished the show or returned the funds Netflix provided to complete it.
Prosecutors asked for five years
Rinsch was convicted of one count each of wire fraud and money laundering, each carrying a maximum sentence of 20 years in prison, along with five counts of making monetary transactions in property derived from unlawful activity, each carrying a maximum of 10 years.
Prosecutors asked the court in a mid-June sentencing memo to give Rinsch five years in prison after he argued for a sentence without prison time.
Rinsch’s defense said he suffered from mental health issues, with friends and family members writing to the court to say that his behavior changed around the time of the offenses. Keanu Reeves also wrote to the court in support of Rinsch.
In addition to his two-and-a-half-year prison term, Rinsch was sentenced to three years of supervised release, $11 million in forfeiture and $700 in mandatory special assessments.
Magazine: China’s 107 Bitcoin memory thief, Bithumb CEO booked: Asia Express
A $1,000 bet on the S&P 500 in July 2021 now beats the same bet on Bitcoin (BTC). Stocks won even though Bitcoin took the wilder ride.
Many proponents of Bitcoin have pointed to the digital’s asset’s performance against traditional investment vehicles over the years. However, with Bitcoin now way below 50% of its all time high, more steady investments are overtaking.
The Numbers
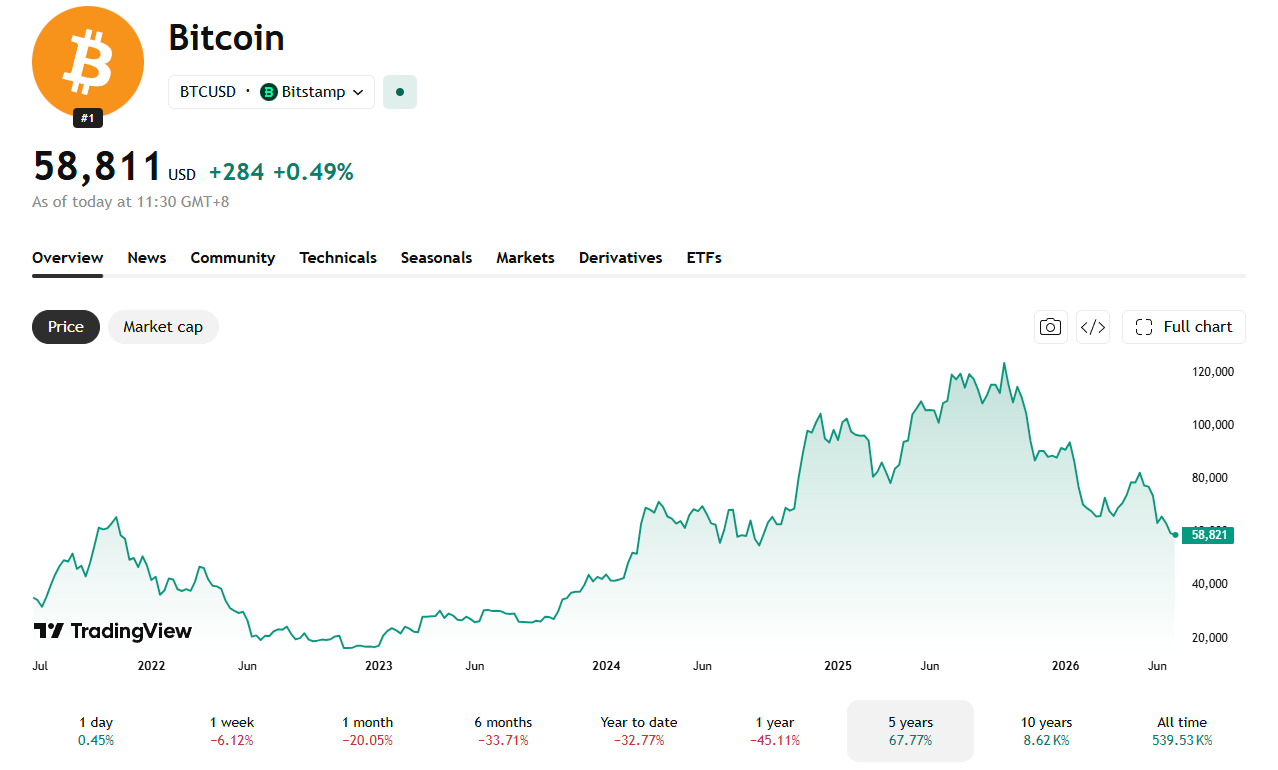
Bitcoin closed at $35,171 on July 1, 2021. It sits at around at $58,811 as of writing. That marks a gain of about 68%.

The S&P 500 closed at 4,319.94 on July 1, 2021. It closed at 7,499.36 on June 30, 2026. That marks a gain of about 74%.

A $1,000 stake in the S&P 500 grew to roughly $1,736. The same $1,000 in Bitcoin grew to roughly $1,676. Stocks came out around $60 ahead.
Stocks Won With a Much Smoother Ride
Bitcoin’s return looks unremarkable next to the risk it carried. Bitcoin rallied to nearly $69,000 in November 2021. It then crashed below $17,000 during the 2022 crypto winter. It surged past $120,000 in 2025 then slid back below $60,000 most recently.
The S&P 500 never came close to that kind of swing. Its worst drawdown in the same stretch hit about 25% in 2022, a fraction of Bitcoin’s peak-to-trough loss.
Bitcoin has beaten the index by far wider margins over longer stretches. Back in 2019, BeInCrypto reported a 250,000% Bitcoin gain since 2011, against a 147% gain for the S&P 500 over the same span.
This time, Bitcoin’s extra volatility didn’t pay off. Investors took on far more risk and still finished behind stocks.
The post $1,000 in Bitcoin or S&P 500 in 2021? Stocks Payout More Today appeared first on BeInCrypto.


The ETH/BTC ratio prices Ethereum in Bitcoin instead of dollars, stripping out the market-wide move so you can see which of the two is actually winning. Here is what the ratio measures, how to read it, what drives it, and why it has fallen to multi-year lows.
Summary
- The ETH/BTC ratio is the price of one ether expressed in bitcoin, a single number that shows whether Ethereum is outperforming or underperforming Bitcoin regardless of what the dollar price of either is doing.
- A rising ratio means ether is gaining on bitcoin, often a sign of risk appetite and a healthier environment for altcoins; a falling ratio means bitcoin is winning, usually a sign of caution and bitcoin dominance.
- As of mid-2026, the ratio sits near multi-year lows around 0.026, reflecting Ethereum’s deep underperformance against Bitcoin, down sharply from levels near 0.08 in 2021 and 0.15 in 2017.
- The ratio is driven by the tug-of-war between Ethereum-specific forces (ETF flows, staking, layer-2 activity, supply dynamics, competition from other chains) and Bitcoin-specific forces (halving cycles, ETF and treasury demand).
- It is a relative-strength gauge and a regime signal, not a price target, and it can stay depressed or elevated for years, so it should inform context rather than dictate trades.
The ETH/BTC ratio is the price of one ether (ETH) measured in bitcoin (BTC) rather than in dollars, and it is one of the most useful single numbers in crypto for understanding which of the two largest assets is actually winning. When you look at Ethereum’s price in dollars, you are seeing two things mixed together: how Ethereum is doing, and how the entire crypto market is doing, because almost everything in crypto moves loosely with Bitcoin and with the broad risk environment.
The ETH/BTC ratio removes the second factor. By pricing Ethereum directly in Bitcoin, it cancels out the market-wide move that both assets share and isolates Ethereum’s performance relative to Bitcoin alone. If both assets rise 20% in dollars, the ratio does not move, because neither outperformed the other. If Ethereum rises while Bitcoin is flat, the ratio rises, and you learn something the dollar chart obscured: capital is favoring Ethereum over Bitcoin right now.
That makes the ratio a lens, not just a number, and learning to read it changes how you see the market. This guide explains what the ETH/BTC ratio is and how it is calculated, why traders watch it, how to interpret a rising or falling ratio, what the ratio has done historically and where it sits now, the forces on each side that push it up or down, a worked example you can follow step by step, and how to use it sensibly without overreading it.
The aim is to give you a durable mental model rather than a snapshot, because the specific level will change, but the way the ratio works will not. None of this is trading advice; the ratio is an analytical tool, and like any tool, it can mislead if used in isolation. Used well, though, it is one of the clearest windows into the single most important relationship in the asset class, the one between its two dominant coins.
What the ratio actually measures
Start with the mechanics, because they are simple and the simplicity is the point. The ETH/BTC ratio is calculated by dividing the price of ether by the price of bitcoin, using the same currency for both, so the units cancel and you are left with a pure ratio. If ether trades at $1,550 and bitcoin trades at $60,000, the ratio is 1,550 divided by 60,000, which is about 0.0258, usually written as 0.026. That number tells you that one ether is currently worth about 2.6% of one bitcoin. You can read it directly: at a ratio of 0.026, it takes roughly 38 ether to equal one bitcoin in value.
Most charting platforms quote the pair as ETHBTC or ETH/BTC, and many crypto exchanges let you trade the pair directly, buying ether with bitcoin or the reverse, which is part of why the ratio is so closely watched, it is a live, tradable market, not just a derived statistic.
What the ratio measures, conceptually, is relative strength. It answers a question the dollar price cannot: between the two largest assets in crypto, which is the market choosing right now? Because Bitcoin and Ethereum share most of the same macro drivers, interest rates, risk appetite, regulatory news, dollar liquidity, comparing them to each other holds those shared factors roughly constant and exposes the difference that is specific to each asset. A dollar chart of Ethereum during a broad sell-off shows Ethereum falling, but it cannot tell you whether Ethereum fell more or less than Bitcoin.
The ratio can. If Ethereum fell harder than Bitcoin, the ratio dropped even as both went down, revealing that within the decline, capital preferred the relative safety of Bitcoin. That is the core value of the metric: it separates Ethereum’s own story from the market’s story, and in doing so it often reveals the direction of capital rotation that the dollar price hides.
Why traders watch it
The ratio matters because it functions as a regime indicator for the broader market, not just for Ethereum. In crypto, there is a long-observed pattern in which capital rotates in a rough sequence: money flows into Bitcoin first during the early, cautious phase of a rally, then rotates into Ethereum as confidence grows, and then spreads out into smaller altcoins as risk appetite peaks.
Because Ethereum sits in the middle of that sequence, the largest and most established asset after Bitcoin, the ETH/BTC ratio often acts as a barometer for where the market is in that cycle. A rising ratio, with Ethereum gaining on Bitcoin, frequently signals that risk appetite is building and that the environment is turning favorable for altcoins broadly, since Ethereum tends to lead the alt market. A falling ratio, with Bitcoin winning, usually signals the opposite: caution, a flight toward the relative safety of Bitcoin, and a harder environment for smaller tokens.
This is why traders treat the ratio as a piece of market-structure information instead of just a fact about two coins. When the ratio is trending up, many interpret it as confirmation of an “altcoin season” or “ETH season,” a period when capital is willing to move out the risk curve and non-Bitcoin assets outperform. When it is trending down, the read is “Bitcoin season” or rising “Bitcoin dominance,” a period when Bitcoin absorbs the market’s attention and capital while alts bleed against it. Portfolio decisions follow from this framing: a trader who believes the ratio is turning up might tilt toward Ethereum and altcoins, while one who sees it falling might rotate toward Bitcoin or cash.
The ratio also serves as a sanity check on narratives. If commentators are loudly predicting an Ethereum breakout but the ETH/BTC ratio keeps falling, the market is voting against the narrative in the most direct way available, by pricing Ethereum lower against Bitcoin quarter after quarter. Watching the ratio keeps a trader honest about what is actually happening versus what is being talked about.
How to read a rising or falling ratio
Reading the ratio is mostly about direction and context instead of any single absolute level. A rising ETH/BTC ratio means ether is appreciating relative to bitcoin, whether because ether is rising faster than bitcoin, falling more slowly, or rising while bitcoin falls. In all of those cases the message is the same: on a relative basis, the market is favoring Ethereum.
Sustained increases in the ratio tend to coincide with periods of broad risk appetite, strong Ethereum-specific catalysts, and outperformance across the altcoin complex, since Ethereum often pulls the alts along with it. A falling ratio carries the opposite message: bitcoin is winning the relative contest, the market is leaning toward caution and Bitcoin dominance, and altcoins are generally struggling against bitcoin even if they are flat or rising in dollar terms.
The crucial discipline is to read the ratio in context instead of as a standalone buy or sell signal. The same ratio level can mean very different things depending on the trend and the backdrop. A ratio of 0.026 reached on the way down, after months of Ethereum underperformance, signals weakness and momentum against Ethereum. The same 0.026 reached on the way up, after a period of Ethereum gaining, would signal the opposite, recovering relative strength.
Direction and trend matter more than the absolute figure. It also helps to watch the ratio across multiple timeframes: a short-term bounce in the ratio within a long-term downtrend is a different and weaker signal than a multi-month trend change. And because the ratio is relative, it is silent about absolute price. The ratio can rise while both assets fall in dollars, if Ethereum falls less, which is relative outperformance during an absolute loss, useful to know but not the same as a gain. Reading the ratio well means always holding two questions at once: which asset is winning the relative contest, and what is the absolute market doing underneath that contest.
A worked example
Make it concrete with numbers you can follow. Suppose ether is trading at $1,550 and bitcoin at $60,000. Divide 1,550 by 60,000 and you get 0.0258, so the ETH/BTC ratio is about 0.026, and one ether is worth roughly 2.6% of one bitcoin, or equivalently it takes about 38 ether to equal one bitcoin. Now run three scenarios from that starting point to see how the ratio responds to relative moves.
In the first scenario, both assets rise 25% in dollars: ether to about $1,938 and bitcoin to $75,000. The ratio is 1,938 divided by 75,000, which is still about 0.0258. Despite a large dollar gain in both, the ratio did not move, because neither outperformed the other, exactly the information the dollar chart would have hidden.
In the second scenario, ether outperforms: ether doubles to $3,100 while bitcoin stays at $60,000. The ratio becomes 3,100 divided by 60,000, or about 0.052, a doubling of the ratio. This is the signature of Ethereum outperformance, and a trader watching only the ratio would see it climb from 0.026 to 0.052 and read a strong shift of capital toward Ethereum, the kind of move associated with an ETH-led alt rally. In the third scenario, the market falls but Ethereum falls harder: bitcoin drops to $48,000 (down 20%) while ether drops to $1,085 (down 30%).
The ratio is 1,085 divided by 48,000, or about 0.0226, a decline from 0.026. Here both assets lost money in dollars, but the ratio fell, telling you that within the sell-off, capital preferred bitcoin and Ethereum bore more of the damage. These three cases show the ratio’s whole purpose in miniature: it ignores the shared move and reports only the relative winner, which is the piece of information that dollar prices alone cannot give you.
Where the ratio has been, and where it is now
History gives the current level its meaning, and the history of ETH/BTC is a story of a long round trip. In Ethereum’s earlier years the ratio climbed dramatically as Ethereum established itself as the clear number-two asset and the home of smart contracts, decentralized finance, and much of crypto’s developer activity. It reached its highest levels around mid-2017, near 0.15, when one ether was worth about 15% of a bitcoin, a peak of Ethereum’s relative strength driven by the initial-coin-offering boom that ran on Ethereum.
The ratio then fell sharply, recovered into the 2021 cycle to peak around 0.08 as decentralized finance and non-fungible tokens drove enormous activity on Ethereum, and has since entered a prolonged decline. As of mid-2026, the ratio sits near multi-year lows around 0.026, with ether near $1,550 against bitcoin near $60,000, a level that reflects a sustained stretch of Ethereum underperforming Bitcoin.
The reasons for the long decline are worth understanding because they explain why the ratio is where it is instead of simply that it is low. Several forces have weighed on Ethereum’s relative strength. Bitcoin has captured an enormous wave of institutional demand through spot ETFs and corporate-treasury adoption, a clean, simple “digital gold” narrative that has pulled capital toward Bitcoin specifically. Ethereum, meanwhile, has faced intensifying competition from faster, cheaper chains, with much of the speculative and developer energy that once flowed to Ethereum moving to rivals, which has diluted the “Ethereum is the only smart-contract platform that matters” thesis that powered its earlier outperformance.
Ethereum’s own narrative has also been harder to summarize than Bitcoin’s, shifting across staking, scaling through layer-2 networks, and supply dynamics in ways that are powerful but complex, and complexity is a disadvantage in a market that rewards simple stories. The result is a ratio that has spent a long time grinding lower, which is the context any reader should hold when they see the current figure: it is not a momentary dip but the late stage of a multi-year trend, which is exactly why it is so closely watched for signs of a turn.
What drives the ratio up and down
To anticipate the ratio instead of just observe it, you have to understand the forces on each side, because the ratio is a tug-of-war between Ethereum-specific and Bitcoin-specific drivers. On the Ethereum side, the factors that tend to push the ratio up include strong inflows into Ethereum ETFs, which signal institutional demand specifically for ether; growth in staking, which locks up supply and can tighten the available float; rising activity on Ethereum and its layer-2 networks, which supports the case that the network is being used; and periods when Ethereum’s supply dynamics turn deflationary, reducing net issuance. Broadly, anything that strengthens Ethereum’s relative narrative or tightens its supply relative to Bitcoin tends to lift the ratio. When these forces are strong and Bitcoin lacks an equally strong catalyst, capital rotates toward Ethereum and the ratio climbs.
On the Bitcoin side, the factors that push the ratio down include the four-year halving cycle and its associated demand narratives, large institutional inflows into Bitcoin ETFs, corporate-treasury accumulation of Bitcoin, and any environment in which the market wants the relative safety and simplicity of Bitcoin over the complexity of Ethereum and altcoins. Risk-off conditions generally favor Bitcoin and pull the ratio down, because in a cautious market capital concentrates in the most established, most liquid, most narratively simple asset, which is Bitcoin.
The overall risk environment is the backdrop to both sides: in risk-on periods, capital is willing to move out the curve toward Ethereum and the ratio tends to rise, while in risk-off periods it retreats toward Bitcoin and the ratio tends to fall. This framework explains why the ratio has been weak: Bitcoin has enjoyed powerful, simple, institution-friendly catalysts in ETFs and treasuries, while Ethereum’s catalysts have been real but more diffuse, and much of the market has been in a cautious, Bitcoin-favoring posture. A durable turn in the ratio would require Ethereum-specific demand to outweigh Bitcoin’s, which is exactly what traders watch the ratio to detect.
How to use the ratio without overreading it
For all its usefulness, the ratio is easy to misuse, and using it well means respecting its limits. The most important discipline is to remember that the ratio is a relative-strength gauge, not a price target or a guaranteed mean-reverting signal. A common error is to look at a depressed ratio and assume it must bounce back toward old levels, treating the multi-year average as a magnet.
There is no rule that forces the ratio to revert. It can stay depressed for years if Ethereum continues to underperform, just as it can stay elevated during a strong Ethereum cycle, and betting on reversion simply because the ratio looks low has cost many traders dearly through long stretches of continued underperformance. The ratio describes the current balance of relative strength; it does not promise that the balance will swing back on any particular schedule.
The second discipline is to never trade the ratio in isolation. It is one input among many, most powerful when combined with an understanding of the absolute market environment, the specific catalysts on each side, and your own time horizon. The ratio tells you which asset is winning the relative contest, but it says nothing about whether the whole market is heading up or down in dollars, which is what actually determines whether you make or lose money in absolute terms.
A rising ratio in a collapsing market still means losses; a falling ratio in a soaring market can still mean gains. The ratio is best used to inform allocation tilts and to read market structure, for example to judge whether the environment favors Ethereum and alts or Bitcoin, instead of as a standalone entry or exit trigger. Treat it as a compass that shows direction of relative capital flow, not a clock that tells you when to act, and it becomes one of the more reliable instruments in a crypto analyst’s toolkit. Misread as a precise timing signal or a guaranteed reversion bet, it becomes a trap. The metric is honest; the overreading is the danger.
Frequently Asked Questions
What is a good ETH/BTC ratio?
There is no single “good” level, because the ratio is a relative measure whose meaning depends on trend and context instead of any fixed number. Historically the ratio has ranged from highs near 0.15 in 2017 and 0.08 in 2021 down to multi-year lows around 0.026 in 2026. A higher ratio reflects stronger Ethereum performance against Bitcoin, and a lower one reflects Bitcoin dominance, but neither is inherently “good” or “bad,” it depends on which asset you favor and where you are in the cycle. What matters more than the absolute level is the direction: a rising ratio signals Ethereum gaining, a falling ratio signals Bitcoin winning. Read the trend and the backdrop, not a target number.
How do you calculate the ETH/BTC ratio?
Divide the price of ether by the price of bitcoin, using the same currency for both so the units cancel. For example, if ether is $1,550 and bitcoin is $60,000, the ratio is 1,550 divided by 60,000, which equals about 0.0258, usually written as 0.026. That means one ether is worth roughly 2.6% of one bitcoin, or that it takes about 38 ether to equal one bitcoin. Most charting platforms display the pair directly as ETHBTC or ETH/BTC, so you rarely need to calculate it by hand, and many exchanges let you trade the pair directly, which is why it behaves as a live market instead of just a derived statistic.
What does a rising ETH/BTC ratio mean?
A rising ratio means ether is appreciating relative to bitcoin, whether because ether is rising faster, falling more slowly, or rising while bitcoin is flat or falling. The shared message is that the market is favoring Ethereum over Bitcoin on a relative basis. Sustained increases often coincide with broad risk appetite and outperformance across altcoins, since Ethereum tends to lead the alt market, which is why a rising ratio is frequently read as a signal of “ETH season” or a building altcoin rally. The key caveat is that a rising ratio describes relative strength only; it says nothing about whether the overall market is going up or down in dollar terms.
Why has the ETH/BTC ratio been falling?
The long decline reflects a tug-of-war that Bitcoin has been winning. Bitcoin has captured a powerful wave of institutional demand through spot ETFs and corporate treasuries, supported by a simple “digital gold” narrative. Ethereum has faced intensifying competition from faster, cheaper chains that drew away speculative and developer activity, while its own narrative, spanning staking, layer-2 scaling, and supply dynamics, has been harder to summarize than Bitcoin’s. A generally cautious, risk-off market has also favored Bitcoin’s relative safety. The combination pushed the ratio to multi-year lows near 0.026 by mid-2026. A durable turn would require Ethereum-specific demand to outweigh Bitcoin’s catalysts.
Can the ETH/BTC ratio predict altcoin season?
It is one of the more useful indicators for it, but not a precise predictor. Because Ethereum sits between Bitcoin and smaller altcoins in the typical rotation of capital, the ETH/BTC ratio often acts as a barometer: a rising ratio suggests capital is moving out the risk curve toward Ethereum and, by extension, toward altcoins, while a falling ratio suggests retreat toward Bitcoin. Many traders treat a sustained uptrend in the ratio as confirmation that an altcoin season is building. However, it is a relative-strength gauge, not a guarantee, and it should be combined with other signals and an understanding of the absolute market, instead of treated as a standalone forecast of when alts will run.
Should I trade based on the ETH/BTC ratio?
The ratio is best used as an analytical and allocation tool instead of a standalone trading trigger, and this is not trading advice. It is most valuable for understanding market structure, judging whether the environment favors Ethereum and altcoins or Bitcoin, and informing how you tilt a portfolio, instead of as a precise entry or exit signal. Two cautions matter most: do not assume a low ratio must revert to old highs, because it can stay depressed for years, and never read it in isolation, because it says nothing about whether the overall market is rising or falling in dollars. A rising ratio in a falling market still means losses. Use it as a compass for relative strength, combined with other analyses.
This article is educational information, not financial or investment advice. Price levels and ratio figures reflect approximate values as of June 2026 and change continuously. Cryptocurrency is volatile, and you can lose money. Do your own research and consult a qualified financial professional before making any investment decision.
Kawasaki Heavy falls to five-month low on report of $1.2 billion fundraising plan

What is a bridge asset? How XRP and XLM are meant to move value

Cifrado’s jockey changed for 2026 Glasshouse Handicap after Ipswich mishap


-

 Fashion4 days ago
Weekend Open Thread: Staud – Corporette.com
-

 Politics5 days ago
The House | Manchesterism won’t survive the painful trade-offs unless it gets citizens on board
-

 Crypto World1 day ago
Strategy authorizes up to $1.25B in Bitcoin sales under new capital plan
-

 Politics5 days ago
Potential 2028er World Cup attendee leaderboard
-

 Business5 days ago
Asia stock markets slide as tech shares slump
-

 News Videos2 days ago
MAJOR BITCOIN & MARKET UPDATE!!!! (MUST WATCH ASAP!!!)
-

 Tech5 days ago
A Look At A Gaggle Of Transputer Boards
-

 Crypto World7 days ago
Securitize Wraps Roubini's SEC-Registered ETF as Dubai VARA Digital Security
-
 Crypto World5 days ago
Dell (DELL) Shares Tumble Over 5% Following Analyst Downgrade to Hold
-

 Crypto World4 days ago
Coinbase, Circle Deepen Crypto Stock Losses Despite Resilient S&P 500
-

 Business1 day ago
Australia treasurer says alleged access of prime minister’s bank data ’incredibly concerning’
-

 Crypto World4 days ago
Kraken's xStocks Opens Bending Spoons IPO Registration to EEA Retail
-

 Sports4 days ago
FIH Pro League: India defeat Pakistan 7-1, register biggest win of campaign | Other Sports News
-
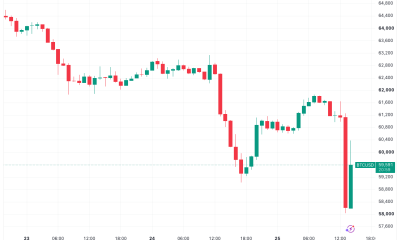
 Crypto World5 days ago
Bitcoin Sparks $600M Hourly Liquidations With $65,000 Set To Become Resistance
-

 Tech3 days ago
Bluekit phishing kit adopts browser-in-the-middle for login theft
-

 Tech4 days ago
Russian hackers now target Signal backup recovery keys
-
 Crypto World5 days ago
Hyperliquid Named on Singapore MAS Investor Alert Register
-
 Crypto World6 days ago
Ripple and SBI launch RLUSD in Japan after JFSA approval
-

 Crypto World4 days ago
RTX holders must register wallets before token distribution begins
-
 Business1 day ago
The AI boom won’t burst all at once. It will pop in ‘rolling bubbles’: Macquarie
You must be logged in to post a comment Login