
Crypto World
Trust in DeFi Starts with Proper Risk Management
DeFi has entered an institutional phase, with large investors gradually testing the waters in crypto ETFs and digital asset treasuries. The shift signals the maturation of on-chain finance, introducing new instruments and digital counterparts to traditional assets. Yet as flows rise, so do questions about risk management and the resilience of underlying infrastructure. For institutions to participate with confidence, the ecosystem must harden its guardrails, standardize risk disclosures, and ensure liquidity access remains predictable even under stress. The broad arc is clear: move beyond yield chasing toward a structured, auditable framework that aligns DeFi with the expectations of regulated finance.
Key takeaways
- Institutional participation in crypto is expanding beyond spot exposure to regulated products and digital asset treasuries, expanding on-chain liquidity and demand for governance-grade infrastructure.
- Three primary risk areas are highlighted: protocol risk driven by DeFi’s composability, reflexivity risk from leveraged staking and looping strategies, and duration risk tied to liquidity timelines and solver incentives.
- Trust is the scarce resource in the next phase of DeFi, with standardized guardrails and interoperable risk reporting viewed as prerequisites for a true institutional supercycle.
- Stablecoins and tokenized real-world assets are reshaping on-chain fundamentals, driving institutional demand and signaling Ethereum’s prominence as a settlement layer.
- Industry signals point to a need for shared risk-management frameworks similar to those in TradFi, including clearinghouse-like structures and standardized disclosures for DeFi protocols.
Sentiment: Neutral
Market context: The ascent of regulated ETFs and on-chain treasuries sits within a broader push toward more liquid, transparent, and auditable crypto markets. As institutional flows grow, liquidity conditions and risk governance will increasingly shape which DeFi primitives scale and which remain niche experiments.
Why it matters
The current rise of regulated institutional products has done more than inflate on-chain TVLs; it has moved the dialogue from “how much yield can be generated” to “how can risk be measured, disclosed, and managed at scale.” A Paradigm-backed view suggests risk management is treated as an operational pillar rather than a compliance checkbox, underscoring the need for formalized standards as DeFi seeks to attract larger, more durable capital footprints. The near-term implication is a shift in emphasis from rapid experimentation to rigorous governance, with industry-wide norms around disclosure and interoperability acting as the backbone for broader adoption.
Within this frame, the industry has begun to witness a practical convergence around three pillars: the maturation of stablecoins as a payment and settlement tool, the tokenization of real-world assets (RWAs), and the tokenization of traditional instruments such as government securities. The stability and scalability of stablecoins have become critical to supporting multi-chain liquidity and cross-border settlement, while RWAs enable the on-chain replication of largely traditional asset classes. In parallel, large institutions are piloting tokenized treasuries and stock-market access through on-chain equivalents, hinting at a future where a wider class of financial products can live on Ethereum and related networks. The net effect is a more connected, on-chain financial system that retains the risk sensitivities familiar to regulated markets.
In the institutional ETF arena, the appetite has produced notable landmarks. The framing of regulated Bitcoin and Ethereum exchange-traded products has produced flows that some observers describe as a bellwether for broader acceptance. Specifically, two of the most successful ETF launches in the last two years—BlackRock’s iShares Bitcoin ETF (CRYPTO: BTC) and Ethereum ETF (CRYPTO: ETH)—illustrate a growing willingness among asset managers to bring digital assets onto balance sheets. The momentum around ETH-related products is particularly pronounced, with net inflows into Ethereum vehicles building momentum in a tight, high-conviction space. This dynamic culminates in a broader realization: official pricing and settlement rails may increasingly depend on on-chain infrastructure built to accommodate institutional-grade risk controls and reporting standards.

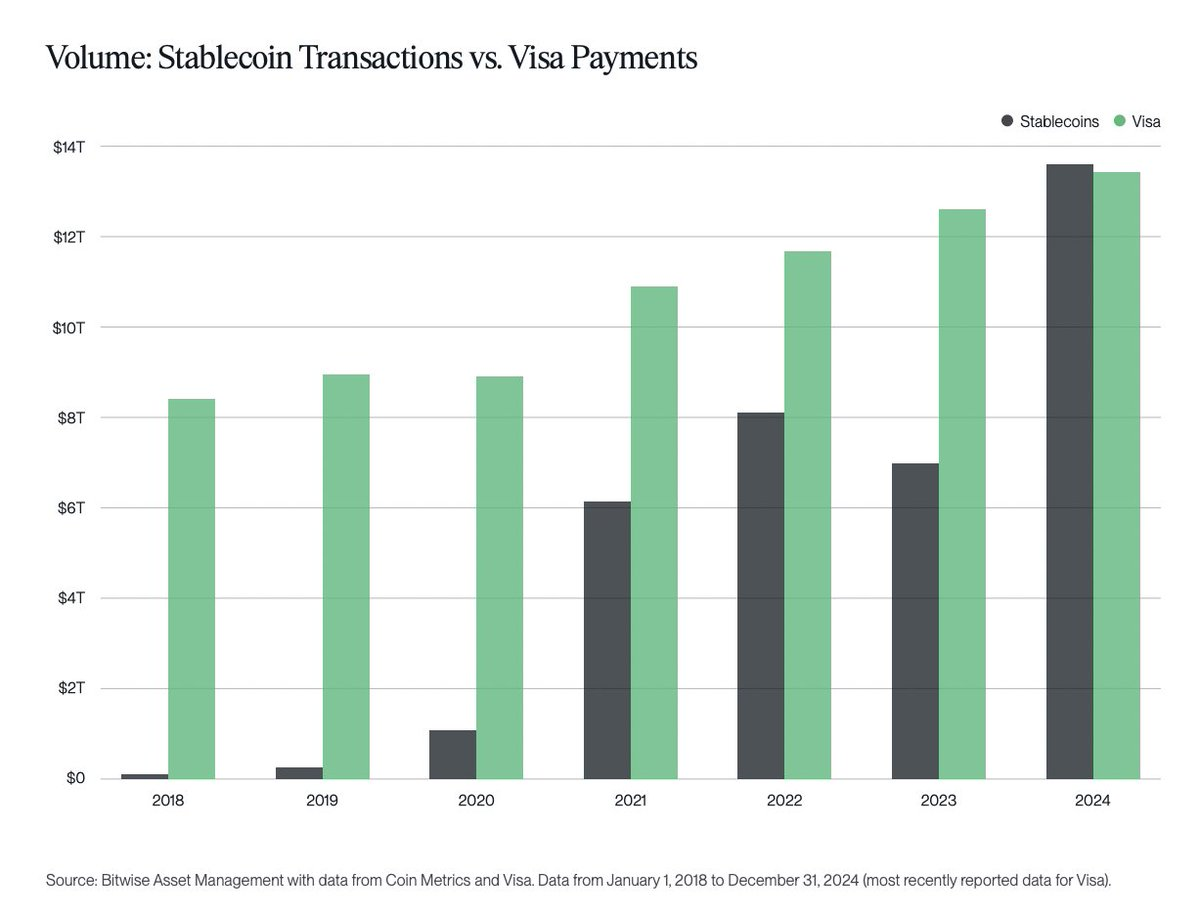
Beyond ETFs, the on-chain tooling narrative has also gained traction. Stablecoins have become crypto’s product-market fit as regulatory clarity improves, enabling them to function more reliably as settlement rails and liquidity buffers. Their TVL across protocols is approaching a striking milestone—nearly $300 billion—while they move nearly as much money every month as traditional payment rails such as Visa. This liquidity capacity, when combined with tokenized RWAs, introduces a more scalable, on-chain settlement layer that can absorb large institutions’ demand without compromising speed or risk discipline. The evolution of these instruments signals a credible path for large-scale participation, especially as governance and disclosure standards converge toward TradFi-like rigor.
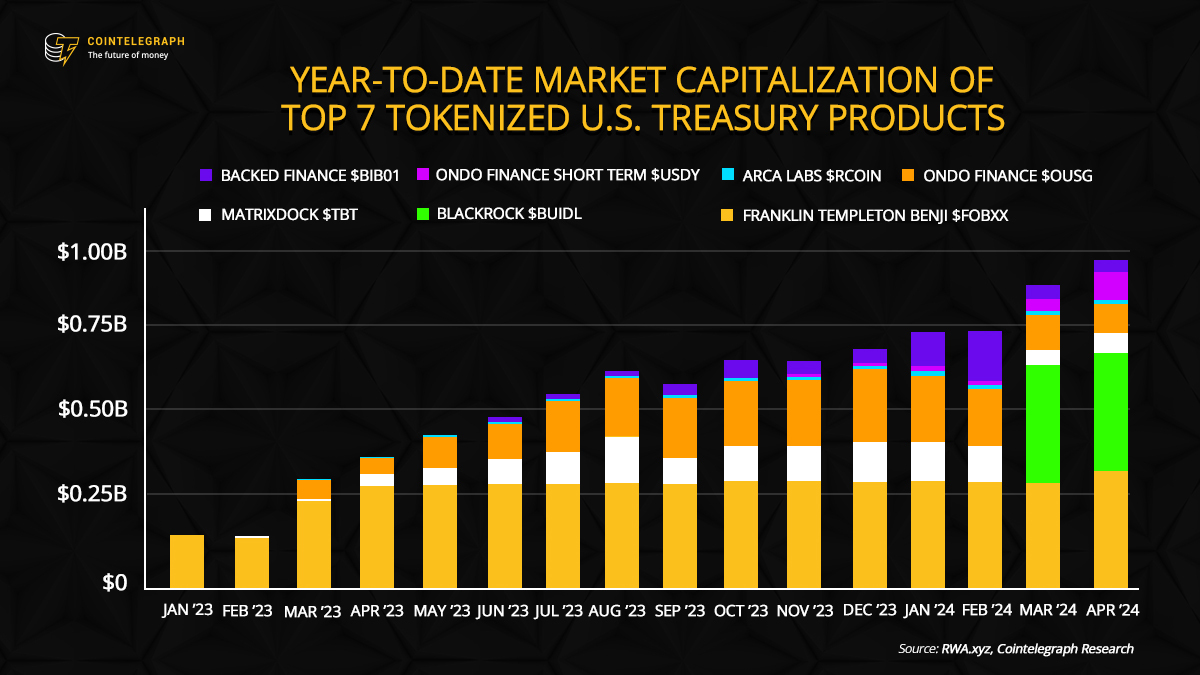
Tokenization remains a central theme in institutional strategy. Robinhood Europe, for example, has advanced tokenization projects across its stock-exchange ecosystem, while BlackRock has pursued tokenized government securities through its BUIDL initiative. The trend toward converting real-world assets into tradable digital tokens aligns with a broader push to enhance liquidity, accessibility, and efficiency across markets. As tokenization scales, it raises critical questions about transparency, custody, and governance; the path forward will hinge on robust interoperability and standardized risk reporting across platforms.
All of this reinforces a central insight: both stablecoins and RWAs are reframing DeFi’s narrative around Ethereum as a settlement and interoperability layer. The on-chain economy is increasingly anchored to the same building blocks traditional finance relies upon—clear risk delineation, verifiable disclosures, and robust settlement rails—while preserving the permissionless innovation that defines DeFi. The net effect is a push toward an on-chain financial system capable of onboarding the next trillion dollars of institutional capital, provided guardrails and standards keep pace with innovation.
In a recent assessment, Paradigm argued that risk management is not simply a cost but a core capability that must be embedded into the operational fabric of DeFi. If institutions are to scale, DeFi will need comparable institutions to the traditional clearinghouses and rating agencies—open, auditable, and interoperable frameworks for assessing and reporting risk. The evolution will not require abandoning experimentation; rather, it will require a disciplined approach to risk that can be understood, verified, and trusted across a diverse ecosystem of protocols, vaults, and strategies.
Opinion by: Robert Schmitt, founder and co-CEO at Cork.
As momentum builds, the market will increasingly reward projects that demonstrate transparent risk management, verifiable liquidity, and resilient infrastructure. The coming year is likely to feature more regulatory clarity around stablecoins, additional tokenization deals, and new on-chain products designed to meet institutional standards. The DeFi supercycle, if it unfolds, will be defined not only by capital inflows but by the depth of risk governance that can withstand the next wave of market shocks. In that sense, the focus shifts from chasing yield to building a durable, on-chain financial system that can operate at the scale of traditional markets while preserving the openness that makes DeFi unique.
What to watch next
- Upcoming industry standards for cross-chain risk disclosures and protocol reporting.
- Regulatory developments affecting stablecoins and tokenized RWAs in major jurisdictions.
- New ETF filings or substantial inflows into BTC and ETH ETFs as institutional appetite evolves.
- Expanded tokenization projects from major custodians or asset managers, including government securities and blue-chip equities.
- Governance updates and liquidity-architecture improvements that affect withdrawal timelines and risk parameters on leading DeFi platforms.
Sources & verification
- Paradigm’s report on TradFi, DeFi, and risk management in extensible finance.
- Regulated ETF launches for Bitcoin and Ethereum by BlackRock, including performance flows.
- Ethereum digital asset treasuries (ETH) and market dynamics surrounding DATs, including Bitmine Immersion.
- Stablecoin market capitalization, locked value, and regulatory clarity milestones (EY insights on treasury use and DLT).
- Robinhood Europe’s tokenization initiatives and BlackRock’s tokenization efforts on U.S. government securities (BUIDL).

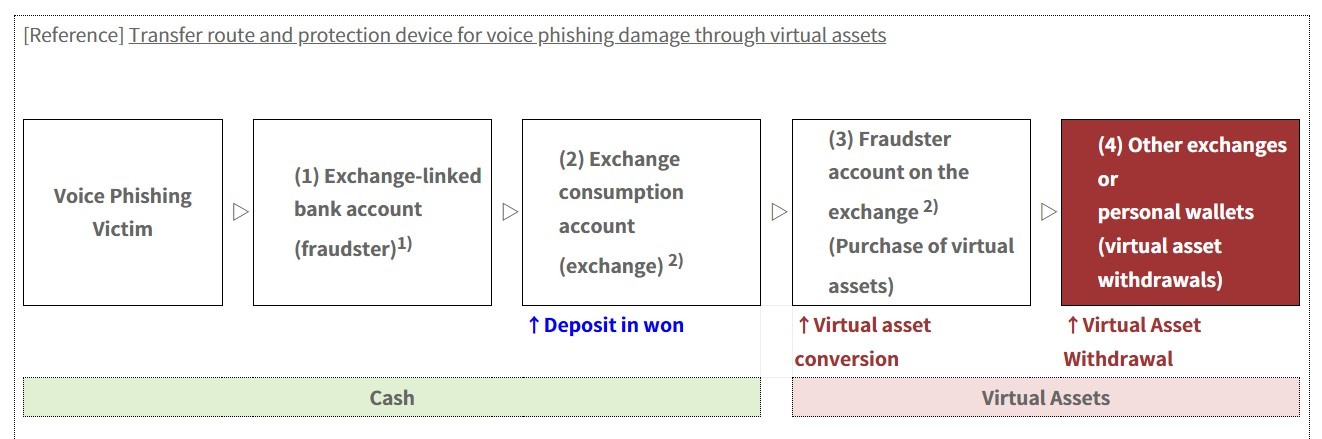
South Korea’s financial regulator said it will tighten the exception rules under crypto exchanges’ withdrawal-delay system after finding that scam-linked accounts granted exemptions accounted for most voice-phishing-related losses.
The Financial Services Commission (FSC) said Wednesday that the strengthened framework, developed with the Financial Supervisory Service (FSS) and the Digital Asset eXchange Alliance (DAXA), will impose unified standards on when users can bypass withdrawal delays.
The regulator said exchanges had been applying their own exception criteria with no clear minimum standard, creating loopholes that let bad actors quickly move funds if they meet easy requirements such as account age or trading history.
From June to September 2025, accounts granted withdrawal-delay exemptions made up 59% of fraudulent accounts and 75.5% of related losses at crypto exchanges, the FSC said.
The move follows a wider South Korean push to tighten crypto exchange controls after voice-phishing abuse and operational-control failures, including fresh reforms announced this week after Bithumb’s Bitcoin (BTC) payout error.

Unified rules aim to curb misuse of withdrawal-delay exemptions
The FSC said that under the new rules, exchanges must assess factors like trading frequency, account history and deposit and withdrawal amounts when determining whether a user qualifies for a withdrawal-delay exemption.
The regulator said the change is expected to reduce the number of users eligible for exemptions sharply. The FSC said a simulation showed the share of users eligible for exemptions would fall to around 1% under the new rules, but did not provide a baseline for comparison.
Related: South Korean brokerage Korea Investment & Securities eyes Coinone stake: Report
The FSC said it will also strengthen oversight of users granted exemptions through periodic checks, including verification of the source of funds, and by building systems to monitor suspicious withdrawal activity.
The regulator added that they will continue reviewing the rules to prevent new circumvention methods and adjust as needed.
The move adds to a broader push by South Korean regulators to tighten oversight of crypto exchanges following recent incidents.
On Tuesday, the FSC ordered exchanges to reconcile internal ledgers with actual asset holdings every five minutes after an inspection linked to the Bithumb payout error found gaps in internal controls and risk management systems.
On Jan. 29, South Korea expanded crypto licensing scrutiny to cover exchanges and major shareholders.
Magazine: ‘Phantom Bitcoin’ checks, Drift hack linked to North Korea: Asia Express


- Zcash surged above $336 after breaking key resistance as cryptocurrencies rose.
- The US-Iran ceasefire and fresh institutional interest have buoyed ZEC bulls.
- A potential short squeeze could catapult the ZEC price to above $500.
Zcash price has jumped 24% in the last 24 hours to $336, positioning ZEC as the top performer among the top 100 cryptocurrencies by market capitalization as of writing.
This sharp rally, which follows US President Donald Trump’s decision to abandon threats of military action against Iran in favour of a two-week ceasefire announcement, aligns with a pump across risk assets, including cryptocurrencies.
Zcash’s gains see it test the highest levels since late January 2026, and it currently sits 18th among the largest coins by market capitalization.
ZEC pumps amid crypto uptick
Zcash has pushed decisively beyond $300, delivering double-digit gains in 24 hours as its short-term outlook shifts bullish amid de-escalation in the US-Iran war.
The privacy-focused coin rose to intraday highs of $336, having cleared a major supply barrier as it tracked altcoins that echoed Bitcoin’s climb past $72,000.
ZEC traded at lows of $250 on Tuesday, and today’s uptick comes amid a 170% spike in daily volume.
Notably, geopolitical developments have added fuel to the upside spark of fresh institutional interest.
For instance, Foundry, operator of the world’s leading Bitcoin mining pool, has revealed plans to enter Zcash mining.
Also notable is the Zcash Open Development Lab’s unveiling of a $25 million ecosystem fund, with the initiative boasting the backing of global venture powerhouses like a16z crypto, Paradigm, and Coinbase Ventures.
Zcash price analysis
Zcash was holding above $330 on April 8, 2026, up on the day, as the broader near-term sentiment hints at bullish bias.
The positive picture aligns with the token’s powering through the convergence of its 100-day and 200-day Exponential Moving Averages (EMAs)
ZEC’s rebound means bulls can now eye the February 14 peak as a support level.
A firm close beyond this previous resistance-turned-support mark could unlock further upside, potentially triggering a short squeeze toward $500. Buyers now dominate as shorts suffer.

Leading into the breakout, Zcash had traced higher lows after a dip to a low of $193 on March 7, 2026.
Despite a long-term descending trendline, gains signal steady accumulation by investors. Momentum indicators back this recent outlook.
As well as the RSI, the Awesome Oscillator (AO) has flipped positive with expanding green bars.
That said, the steep vertical advance over the past two days hints at short-term overextension, particularly with the RSI in overbought territory.
In any case, such explosive moves typically invite minor retracements or sideways action.
Zcash price could thus revisit the $250-$230 region, before resuming higher.

Global markets moved unevenly as geopolitical tensions intensified and energy prices climbed sharply. Oil prices surged above key levels while Bitcoin maintained stability despite pressure. Meanwhile, equities fluctuated as traders reacted to escalating rhetoric and uncertain diplomatic outcomes.
Oil Market Reacts to Supply Disruption
Oil prices climbed above $110 per barrel as supply concerns deepened across global markets. Brent crude traded near $110 while West Texas Intermediate hovered above $112 during volatile sessions. These levels marked the highest range since 2022 and reflected tightening supply conditions.
The Strait of Hormuz remained partially disrupted, which affected nearly one-fifth of global oil shipments. Tanker delays increased, and shipping insurance costs rose sharply as risks intensified across the region. As a result, energy markets experienced strong upward pressure and persistent volatility.
The crisis also raised concerns about inflation and economic stability across major economies. Higher energy costs pushed production expenses upward and strained supply chains globally. Consequently, policymakers faced increasing pressure as inflation risks expanded alongside slower growth expectations.
Bitcoin Shows Stability Amid Market Stress
Bitcoin traded around $68,400 and held firm despite broader financial market volatility. The digital asset showed resilience even as sentiment indicators reflected heightened fear across markets. This divergence highlighted strong underlying demand from long-term holders and institutions.
Institutional participation supported Bitcoin’s price as large entities accumulated significant volumes in recent weeks. Exchange-traded funds absorbed substantial inflows earlier, though recent sessions showed moderate outflows. Even so, the overall structure remained stable as buyers maintained key support levels.
Leverage activity contributed to recent price movements, yet Bitcoin avoided sharp declines seen in other risk assets. This stability positioned the asset as a potential hedge during geopolitical uncertainty. As a result, Bitcoin maintained relative strength while traditional markets showed mixed performance.
Equities Fluctuate as Geopolitical Pressure Builds
Equity markets posted mixed results as geopolitical developments shaped market direction throughout the session. Major indices moved between gains and losses before stabilizing near closing levels. This pattern reflected uncertainty around potential escalation and diplomatic efforts.
Energy-driven inflation concerns weighed on sentiment while economic data added further pressure. Reports showed weaker demand in key sectors, which increased concerns about slowing economic activity. At the same time, rising input costs signaled continued inflationary pressure across industries.
Late-session momentum improved after signs of possible diplomatic engagement emerged from international leaders. Markets responded positively to any indication of reduced tension and potential negotiation. However, uncertainty remained high as the situation continued to evolve.
Crypto World
DOJ Says Tornado Cash Developer Made 250 Changes to the Protocol: Is the Immutable Code Defense Dead?

The DOJ core legal theory in the Roman Storm crypto case has never been that writing code is a crime. It’s that exercising operational control over a platform that processes more than $1 billion in illicit funds – while explicitly declining to implement feasible anti-money-laundering controls – constitutes running a criminal business.
That distinction is the mechanism that makes this case matter far beyond Tornado Cash.
Prosecutors filed a letter Tuesday rejecting Storm’s attempt to leverage a March Supreme Court ruling in Sony Music v. Cox Communications as grounds for dismissal.
The DOJ called the analogy “inapposite” – and the reasoning behind that rejection defines exactly what level of developer involvement triggers federal criminal liability under the current enforcement framework.
The unresolved question: where is the legal floor for DeFi developers who upgrade protocols, manage governance, and selectively respond to compliance inquiries? After Tuesday’s filing, that floor is still undefined – and prosecutors are pushing to make Storm’s retrial the place where it gets drawn.
- The Dismissal Attempt: Storm’s attorneys cited the Supreme Court’s Cox ruling – which shielded the ISP from liability for users’ copyright infringement – as precedent for dismissing criminal charges. DOJ prosecutors rejected the parallel as inapplicable to Storm’s conduct.
- The Control Argument: Prosecutors documented over 250 changes made to the Tornado Cash infrastructure during the charged period, directly contradicting Storm’s defense that the protocol was immutable code beyond his control. That operational record is central to the money laundering conspiracy charge.
- The Partial Conviction: A jury in August 2025 convicted Storm on conspiracy to operate an unlicensed money-transmitting business but deadlocked on money laundering conspiracy and sanctions evasion – the two charges prosecutors now want retried in October 2026.
- The Privacy Protocols Precedent: DOJ’s framing – that developers who implement changes and knowingly forgo compliance measures are operators, not bystanders – applies directly to any upgradeable DeFi protocol with identified founders or core teams.
- The Exposure: Storm faces up to 40–45 years in prison if convicted on all counts. The retrial scope covers the two deadlocked charges; the money transmitting conviction stands.
- What to Watch: The conference between Storm’s defense and Judge Katherine Polk Failla’s court will determine whether October 2026 becomes a firm retrial date – the specific scheduling order is the next legal trigger that confirms or compresses the timeline.
Explore: The best pre-launch token sales with asymmetric upside potential
What the DOJ’s Cox Rejection Actually Establishes – and Why the ‘Immutable Code’ Defense Is Running Out of Road
Storm’s legal team drew a specific parallel: the Supreme Court found Cox Communications shouldn’t be held liable for its users’ infringing activity because Cox had a robust, 98%-effective termination policy for repeat infringers.
The argument was that Storm, like Cox, was a neutral infrastructure provider. Prosecutors dismantled that comparison in a single filing.
The DOJ’s letter to Judge Failla emphasized that Cox actively discouraged the illegal conduct occurring on its network – while Storm and his co-conspirators at Tornado Cash did the opposite.
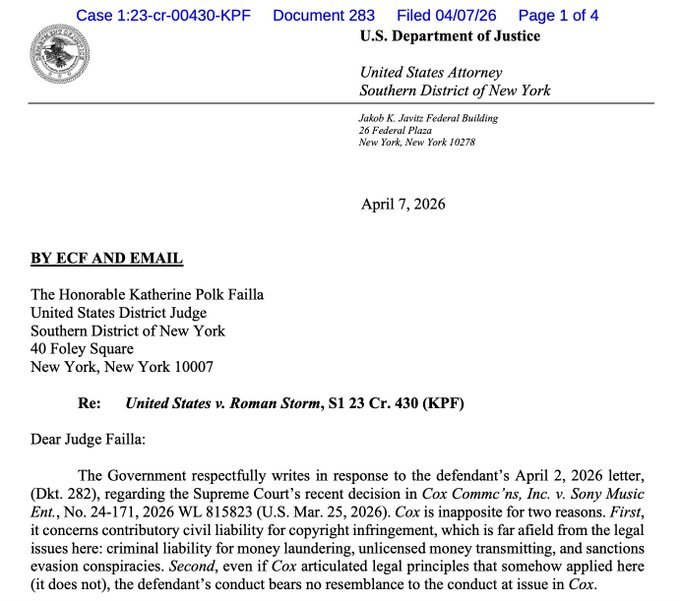
Prosecutors stated that Storm “actively lied in response to inquiries from victims, telling them he had little control over the protocol when in fact he and his co-conspirators implemented over 250 changes to Tornado Cash infrastructure during the charged time period and explicitly discussed – but forwent – feasible measures to curb criminality on their platform.”
That last clause is the legal weight-bearing element. Under the money laundering and unlicensed money transmission statutes at issue, the question isn’t whether a developer wrote code – it’s whether they operated a system they knew was being used for money laundering, had the capacity to limit that use, and chose not to.
The Bank Secrecy Act’s anti-money-laundering compliance obligations attach to operators, not passive bystanders. Prosecutors’ position is that Storm was an operator by every functional measure.
“In short, the defendant’s reaction to criminal use of his company was window dressing at best and outright misdirection at worst” – prosecutors’ letter to Judge Failla, filed Tuesday.
The August 2025 jury conviction on the unlicensed money transmission count already rejected Storm’s passive-developer framing once.
The October 2026 retrial targets the money laundering conspiracy and sanctions evasion charges directly – the counts where the jury deadlocked, not where it acquitted. That distinction matters: deadlock means twelve jurors couldn’t reach unanimity, not that the evidence was insufficient to convict.
Discover: The Best Crypto Presales Live Right Now
The post DOJ Says Tornado Cash Developer Made 250 Changes to the Protocol: Is the Immutable Code Defense Dead? appeared first on Cryptonews.

Evernorth has moved its XRPN merger plan forward with a fresh SEC filing. The amended S-4 keeps the company on course for a Nasdaq market debut. The transaction would combine Evernorth with Armada Acquisition Corp. II.
The move follows the SPAC route rather than a standard IPO. It gives the market another formal step in the listing process. If the deal closes, stock investors could access Evernorth’s XRP-focused strategy through a public company. For now, the filing serves as a process update, not a final approval.
Evernorth Advances Merger Process With Amended S-4 Filing
On April 7, 2026, Evernorth filed “Amendment No. 1” to its “Form S-4” with the SEC. The filing relates to its proposed merger with Armada Acquisition Corp. II. Armada already trades on Nasdaq under the ticker XRPN. The amendment keeps the registration path active.
A Form S-4 is used in business combinations that involve new securities. In this case, Evernorth is using a SPAC structure. That route differs from a traditional IPO. It links the market debut to the merger close.
The amended filing adds to earlier paperwork in the same transaction. It may include revised terms, updated disclosures, or responses to Sec comment. Such changes are common during review. They also give the market a clearer record before any shareholder vote.
The filing does not mean the merger is complete. The SEC review must continue, and other approvals may still be needed. Shareholders may also need to vote on the transaction. Closing terms remain part of the process.
XRPN Route Gives Evernorth a Public Market Path
XRPN is the current Nasdaq ticker for Armada Acquisition Corp. II. Evernorth plans to reach the market through that listed vehicle. If the transaction closes, the combined company would gain public market access. That is the core purpose of the merger.
The company has drawn attention because of its focus on XRP. Evernorth has described a business model tied to XRP exposure and treasury strategy. That approach differs from most recent SPAC deals. It also connects the transaction to digital asset markets.
Market attention has grown because few public companies center their strategy on XRP. No official filing text provided here confirms a direct partnership with Ripple. Even so, the company’s XRP focus remains central to the deal story. That keeps the merger in view across crypto markets.
For some investors, a listed stock can be simpler than direct token ownership. Shares can be bought through standard brokerage accounts. That structure may widen access for investors who avoid crypto custody. It may also increase attention on future treasury disclosures.
Next Steps Remain Before Any Nasdaq Debut
The next stage will center on SEC review and deal approvals. The parties may need to answer more staff comments. They may also need to update risk factors and financial details. Those steps are normal in a SPAC merger.
Market watchers are also tracking potential fundraising around the transaction. Reports have said Evernorth may seek more than $1 billion. Public confirmation on the final amount remains limited. Future filings may provide clearer numbers.
Reports have also mentioned interest from crypto-focused firms. However, the terms and participants remain unconfirmed in the provided details. Investors usually wait for named commitments in official documents.

Apple’s outlook looks materially different from the one traders were pricing a year ago. After delivering $416.2 billion in FY2025 net sales and a record $143.8 billion revenue in fiscal 2026 1Q, AAPL enters mid-2026 tied to three themes: whether the foldable iPhone expands the addressable market, whether Apple Intelligence translates into measurable Services growth, and whether a 29x forward multiple holds up if macro conditions weaken.
Analytical Apple Stock Price Prediction: Quick Answer
AAPL trades near $260 as of 6th April 2026, somewhat below its all-time high of $288.62 made in December 2025. The 12-month analyst consensus averages $304.40 across 24 analysts tracked by TipRanks, with targets ranging from $248 (Barclays) to $350 (Wedbush). MarketBeat’s average sits at $297.58.
The stock trades at approximately 29x forward earnings on consensus FY2026 EPS of $8.60–$8.80, which assumes that continued Services momentum, a full iPhone 18 and foldable launch cycle and no major tariff escalation further support AAPL’s price trajectory.
Recent Price History of AAPL
AAPL traded in a wide range over the past twelve months, swinging from around $169 near its April 2025 low to an all-time high of $288.62 in early December 2025. That represents a move of roughly 70% from trough to peak. As of 6th April 2026, AAPL is priced at around $260, having oscillated between $243 and $280 since the start of the year.
Several catalysts drove the rally. A 90-day tariff pause in April 2025 triggered an immediate bounce. Strong quarterly earnings through mid-2025 kept momentum building, and the iPhone 17 launch in September added fresh demand. Apple’s $100 billion US investment pledge in August also lifted sentiment.
The sharp swings reflected how sensitive AAPL had become to trade policy and macro headlines. In early April 2025, the stock lost over $770 billion in market capitalisation across four sessions. The recovery was equally aggressive once tariff fears eased and earnings came through.
Key Drivers Behind the Apple Stock Forecast in 2026
Several factors are driving expectations for Apple in 2026.
Services Growth
Services is now Apple’s second-largest revenue stream and its highest-margin segment. In FY2025, Services revenue set a new record of ~$109.16 billion, growing approximately 13.5%-14% year-over-year. iPhone revenue grew 4% to $209.6 billion. Fiscal Q1 2026 pushed Services to a quarterly record of $30.0 billion. Advertising, payments and cloud all set new highs. CFO Kevan Parekh has guided FY2026 Services growth at a similar rate to FY2025, pointing towards roughly $123 billion for the full year.
Greater China, Tariffs and Supply Chain Diversification
Greater China remained a pressure point in FY2025, with net sales down 4% year on year, while Europe, Japan and Rest of Asia Pacific all grew. However, Q1 FY2026 saw a sharp reversal: Greater China revenue jumped 38% to $25.5 billion. On tariffs, the US Supreme Court struck down IEEPA tariffs in February 2026, though a 10% Section 122 surcharge remains in place.
iPhone Upgrade Cycle
The iPhone 17 drove Q1 FY2026 iPhone revenue up 23% to $85.3 billion. Morgan Stanley estimates around 550 million active iPhones cannot run Apple Intelligence, highlighting a sizable installed base that may require hardware upgrades over time, potentially supporting future iPhone demand. A foldable iPhone is expected in late 2026, priced between $1,800 and $2,500.
Apple Intelligence
Apple Intelligence is live across 16+ languages on iPhone 15 Pro and newer devices. The full conversational Siri overhaul, powered by Google’s Gemini AI model, remains delayed, with a phased rollout now expected through late 2026.
Capital Returns
Apple authorised an additional $100 billion repurchase programme in May 2025 and bought back $90.7 billion of common stock during FY2025. Buybacks reduce the share count and directly support diluted EPS, which rose 19% to $2.84 in Q1 FY2026 on revenue of $143.8 billion.
Traders may keep up to date with AAPL CFD price movements in FXOpen’s TickTrader platform.
Analytical Bull, Base and Bear Scenarios for AAPL (12-Month Outlook)
In a base case, Apple keeps expanding Services, protects margins and posts steady EPS growth, supporting a gradual re-rating. In a bull case, the foldable iPhone, Apple Intelligence adoption and Greater China momentum lift the revenue mix and justify a richer multiple. In a bear case, softer consumer spending, tariff escalation and slower AI execution cap earnings.
These Apple target prices for 2026 are based on publicly available analyst consensus data from TipRanks, accessed April 2026 (24 analysts). Published values: average $304.40, high $350.00, low $248.00.
Other aggregators, including MarketBeat (average $297.58) and Ticker Nerd (median $300.00 across 77 analysts), show a broadly similar range, although exact figures vary due to differences in analyst coverage, sample windows and update frequency.
Analytical Long-Term Outlook for AAPL (2027–2030)
Projecting precise Apple stock forecasts for 2027 and beyond is difficult, especially given its 30x+ forward earnings. A more practical approach is to identify what would need to happen for AAPL to move materially higher or lower from current levels.
New Device Categories and Form Factors
The foldable iPhone, expected in late 2026, opens a price tier Apple has never occupied. If it succeeds, it adds a $1,800–$2,500 product to the lineup and lifts average selling prices. Beyond that, smart glasses (rumoured for 2027) and AI-enabled wearables could create new revenue streams. Vision Pro has underperformed commercially, so execution here is not guaranteed to lift Apple stock price predictions in 2027 and later.
AI Platform Maturity
Apple Intelligence needs to evolve from a feature set into a genuine platform by 2027–2028. If on-device AI drives measurably higher engagement, App Store spending and Services attach rates, it supports both revenue growth and a premium multiple. If Siri remains behind other voice assistants, the narrative weakens.
Regulatory Pressure on Services Economics
The EU Digital Markets Act, US DOJ antitrust trial (expected 2027), and ongoing App Store commission disputes pose structural risk to Services margins. A forced reduction in commission rates from 30% to 20% or lower would compress the segment’s contribution meaningfully over this period.
Valuation Sustainability
AAPL’s current forward P/E of roughly 29x assumes continued double-digit EPS growth. If earnings were to compound between 10% and 12% annually through 2030, the stock could continue to rate higher. If growth slows to mid-single digits, multiple compression pulls it back. Buybacks will continue to support per-share metrics, but they cannot offset a fundamental slowdown indefinitely.
How Traders Can Evaluate the Apple Stock Outlook
Traders typically break an AAPL analysis into a few core steps.
- Starting with earnings and valuation, traders check the trailing and forward P/E ratio against Apple’s five-year average and the broader S&P 500. If the premium is widening without a corresponding acceleration in EPS growth, the risk/reward shifts.
- Tracking Services momentum. Services revenue and its growth rate are the clearest signal of whether Apple is becoming a higher-margin business or staying hardware-dependent. Quarterly earnings releases break this out directly.
- Monitoring the product cycle calendar. iPhone launch quarters consistently drive the largest revenue beats. Traders check when new models ship and whether supply chain reports suggest strong or constrained demand.
- Watching macro and trade policy. AAPL’s sensitivity to tariff headlines and consumer confidence was on full display in 2025. Interest rate direction and trade policy shifts remain key swing factors.
Risks That Could Cap the Upside
China Exposure
Greater China accounts for roughly 15% of Apple’s revenue. A renewed demand slowdown or market share gains from Huawei could reverse the Q1 FY2026 recovery quickly. Geopolitical tensions add an unpredictable layer.
Valuation Compression
AAPL trades at around 29x forward earnings. That multiple leaves little room for disappointment. Any earnings miss or guidance cut would likely trigger a sharper drawdown than for a stock on a lower multiple.
Macro and Consumer Weakness
US consumer confidence sits near recessionary levels. If household spending weakens further or rate cuts stall, demand for premium devices softens. Launching a $2,000+ foldable into that environment carries timing risk.
AI Execution Gap
Google, Samsung, and Meta are shipping competitive AI features now. If the delayed Siri overhaul underwhelms when it arrives, the AI premium embedded in the stock fades and AAPL loses a key part of the upgrade narrative.
Regulatory Drag on Services
The EU DMA review report lands in May 2026 and the US DOJ antitrust trial is expected in 2027. Forced commission cuts or sideloading mandates would directly compress Apple’s margins.
Final Thoughts
Apple’s financial performance heading into 2026 is strong by any measure. Record revenue, accelerating Services growth and a large upgrade base give the stock a solid fundamental floor. But the valuation already reflects much of that strength. The path for Apple’s stock in 5 years depends on whether Apple Intelligence delivers real differentiation, whether the foldable iPhone expands the addressable market and whether macro conditions hold up.
Traders looking to explore AAPL and other stock CFDs may consider opening an FXOpen account and using the TickTrader platform for charting and analysis.
FAQ
What Is the Apple Stock Forecast for 2026?
The Apple stock prediction 2026 consensus averages $304.40 across 24 analysts on TipRanks, with a low of $248.00 and a high of $350.00. MarketBeat puts the average at $297.58, while Ticker Nerd‘s median across 77 analysts is $300.00. The spread reflects ongoing disagreement over AI execution, tariff risk, and the foldable iPhone’s impact.
What Could Push AAPL Higher?
A foldable iPhone super-cycle, faster-than-expected Apple Intelligence adoption, continued Services growth, and sustained Greater China recovery are seen as the primary upside drivers.
How Much Will Apple Stock Be Worth in 10 Years?
Analytical Apple stock predictions in 10 years are highly uncertain. The outcome depends on revenue growth, margin trajectory, new product categories and the broader market environment. Apple’s track record of compounding earnings is strong, but past returns do not guarantee future performance.
What Will Apple Stock Be Worth in 2030?
Rather than target a specific analytical Apple stock forecast for 2030, traders typically focus on what would need to go right or wrong. Sustained 10%–12% annual EPS growth and new device categories would support a higher share price. Slower growth, regulatory headwinds or multiple compression would cap analytical Apple stock price predictions for 2030.
Will Apple Stock Ever Reach $1,000?
Reaching $1,000 from roughly $255 would require a near-fourfold increase. At 12% annual EPS growth with a steady multiple, that could take well over a decade. A stock split, new revenue streams or a structural re-rating could shorten this Apple stock forecast to 5 years or more, but less than 10.
How High is Apple Stock Expected to Go?
The current Street-high 12-month target is $350, set by Wedbush analyst Dan Ives. Beyond that, longer-range projections vary widely and carry low reliability. Most analysts anchor their outlook to earnings visibility one to two years ahead.
This article represents the opinion of the Companies operating under the FXOpen brand only. It is not to be construed as an offer, solicitation, or recommendation with respect to products and services provided by the Companies operating under the FXOpen brand, nor is it to be considered financial advice.

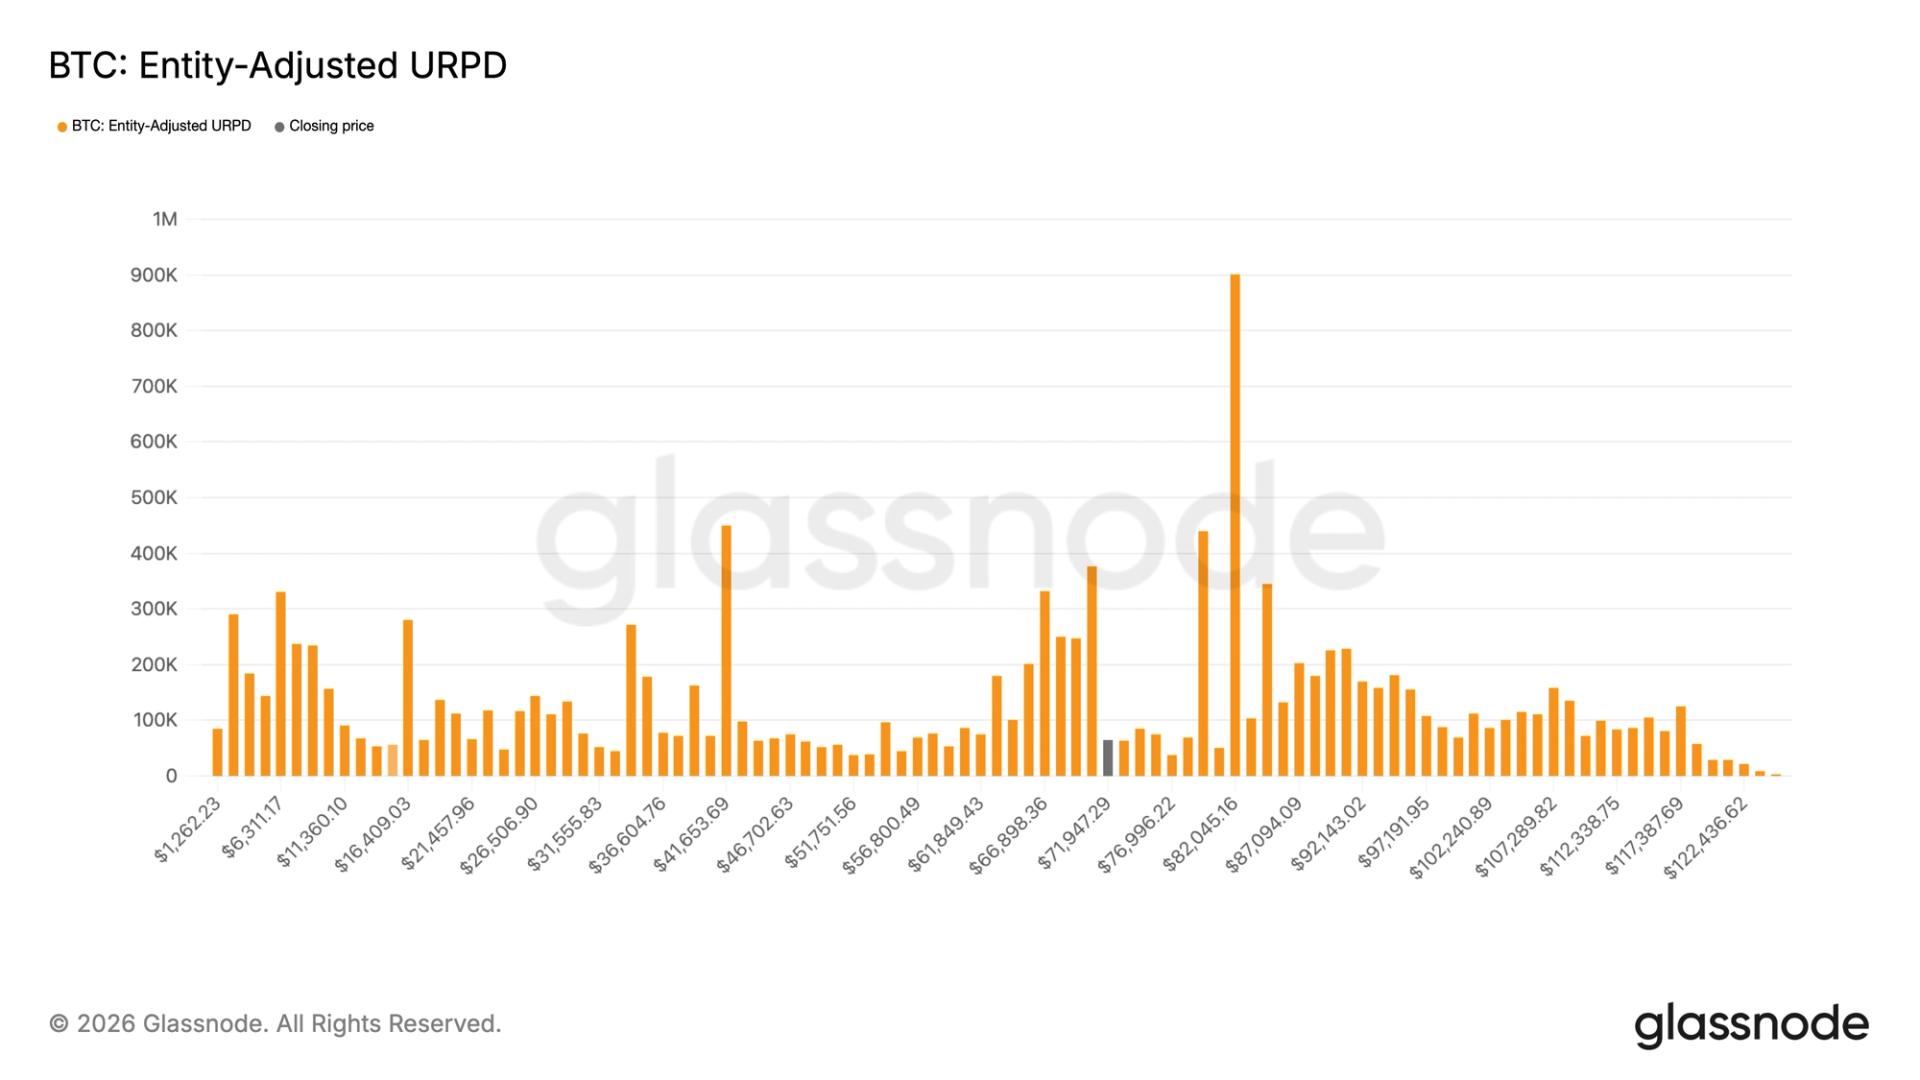
Bitcoin may have recently looked choppy under $70,000, but a ton of BTC was traded then, in a sign of strong dip demand.
That’s evident from blockchain data, which shows the total amount of BTC that last moved on-chain in the $60,000-$70,000 range now stands at 1,845,766 BTC, up from 1,001,491 BTC on Jan. 1, according to data source Glassnode. This increase of 844,275 BTC indicates that some market participants aggressively bought the dip below $70,000.
More importantly, that 1.84 million BTC figure accounts for about 9.23% of bitcoin’s circulating supply. It means valuations below $70,000 could act as a floor because a lot of coins are “anchored” there and sellers might be reluctant to sell below it.
These numbers are derived from Glassnode’s Realized Price Distribution (URPD) metric, which shows the price levels where the current set of bitcoin UTXOs – basically, individual chunks of bitcoin in wallets – were last moved. Each bar, as seen in the feature image, represents how much bitcoin is held at a given price. This version is entity-adjusted, meaning coins held by the same owner are grouped together based on the average price they were acquired at.
While the $60,000 to $70,000 range has seen heavy activity, $70,000 to $80,000 looks relatively thin, according to Glassnode. Just 400,000 BTC sit in this range, which is nearly half of the amount transacted below $70,000.
Bitcoin has bounced back above $70,000 following the temporary ceasefire between the U.S. and Iran. The cryptocurrency spent a better part of the past five weeks or so trading back and forth below $70,000. Yet, it remained resilient relative to traditional risk assets, such as stocks, which wilted as Iran war lifted per barrel oil prices above $100.
SEC Case Count Falls as Agency Resets Enforcement Approach
The US Securities and Exchange Commission reported a sharp drop in enforcement activity for fiscal 2025. The agency said it brought 456 enforcement actions through September. That was down from 583 actions in the prior year.
The news comes as the SEC changes its enforcement approach under Chairman Paul Atkins. The agency said it now wants fewer volume-driven cases. It said the focus is on fraud, market manipulation, and abuses of trust.
Penalty Totals Rise on Old Ponzi Case While Core Remedies Fall
The SEC said its latest annual report reflects a different way to judge enforcement work. The agency said past resources were often used to raise case counts. It said that method created the wrong standard for effective enforcement.
The SEC also said its annual totals did not include 1,095 matters that were investigated and later closed. Some of those matters involved practices that were fixed without formal charges. The agency used that point to explain its new reporting frame.
Atkins described the new direction in the agency statement. He said, “We have redirected resources toward the types of misconduct that inflict the greatest harm.” He added that the SEC is moving away from approaches centered on volume and record penalties.
The decline was also shaped by timing. SEC data showed that nearly half of the 456 actions were filed before January 2025. That means activity slowed further after the Trump administration began.
Crypto Cases and Staff Losses Add to the Shift
The policy change has also reached the crypto sector. Under current leadership, the SEC has dismissed several high-profile cases against crypto firms and executives. That move matters for digital asset markets because the agency had pursued the sector aggressively in earlier years.
For crypto readers, the new report signals a softer enforcement posture in some areas. Still, the SEC said fraud and market manipulation remain top priorities. That means crypto-related conduct can still draw action when investor losses are clear.
The enforcement division also faced internal strain during the year. Its enforcement director resigned suddenly last month. At the same time, the division lost 18% of its staff in fiscal 2025, according to a recent government report.
Staff losses and leadership turnover often slow enforcement work during transition periods. Experts have noted that such slowdowns are common after a change in administration. In 2025, however, the drop in SEC activity also reflects a clear reset in how the agency defines enforcement success.

“DeFi isn’t built on ETH—it’s built on dollars.”
That line sounds provocative—almost heretical in a space obsessed with native tokens and Layer 1 wars. But if you zoom out and actually trace where value flows, settles, and compounds in decentralized finance, one truth becomes unavoidable:
👉 Stablecoins are the real foundation of DeFi.
Not ETH. Not governance tokens. Not even the chains themselves.
Dollars—tokenized, programmable, and always-on—are the system
The Invisible Backbone of DeFi
Every major DeFi primitive runs on stablecoins:
- Lending: Borrowers don’t want volatility—they want predictable debt. That’s why protocols like Aave and Compound are dominated by stablecoin markets.
- Trading: Most liquidity pairs route through stablecoins. They are the base layer of price discovery.
- Yield farming: Yields are benchmarked, optimized, and stabilized using dollar-denominated assets.
Strip away stablecoins, and DeFi doesn’t collapse gracefully—it breaks entirely.
ETH may be the engine, but stablecoins are the fuel.
The Three Faces of Stablecoin Power
Not all stablecoins are created equal. In fact, their design reveals something deeper: on-chain monetary systems competing in real time.
1. Fiat-Backed: The Off-Chain Anchors
Examples: USDT, USDC
These are backed by real-world reserves—cash, treasuries, and equivalents.
- Strength: Stability and trust (assuming reserves are legit)
- Weakness: Centralization and regulatory exposure
They’re essentially banks with APIs, plugging traditional finance into crypto rails.
2. Crypto-Backed: The Overcollateralized Machines
Example: DAI via MakerDAO
These rely on excess crypto collateral to maintain stability.
- Strength: Transparency and decentralization
- Weakness: Capital inefficiency
They behave like algorithmic central banks, managing collateral ratios instead of interest rates.
3. Algorithmic: The Experimental Economies
These attempt to maintain pegs through supply-demand mechanics alone.
- Strength: Scalability and capital efficiency
- Weakness: Fragility (sometimes catastrophically so)
They are the closest thing crypto has to pure monetary theory in production—and sometimes, that theory breaks under pressure.
On-Chain Monetary Policy Is Already Here
Here’s where things get interesting.
Stablecoins aren’t just passive assets—they are active policy systems:
- Collateral ratios adjust supply
- Interest rates influence borrowing demand
- Liquidity incentives shape capital flows
- Peg mechanisms act as market stabilizers
This isn’t hypothetical economics. It’s live monetary policy, executed by smart contracts.
And unlike traditional central banks:
- It’s transparent
- It’s programmable
- It runs 24/7
- It’s globally accessible
In other words, stablecoins don’t just mimic fiat systems…
👉 They compete with them.
The Shadow Central Banks of Crypto
Think about it:
- USDC influences liquidity across chains
- USDT dominates global trading volume
- DAI governs decentralized credit creation
These aren’t just tokens.
They are issuers of money, controlling supply, stability, and trust within digital economies.
That makes them something far bigger:
👉 Shadow central banks of the internet.
The Quiet Takeover
“Stablecoins are quietly taking over global finance.”
That’s not hype—it’s already happening:
- Cross-border payments settle faster and cheaper via stablecoins
- Emerging markets increasingly rely on them as dollar substitutes
- Institutions are integrating them as settlement layers
While headlines chase memecoins and AI narratives, stablecoins are doing something far more important:
They’re rebuilding the dollar system—on-chain.
Final Thought: Follow the Stability
Crypto loves volatility. It thrives on speculation.
But infrastructure?
Infrastructure demands stability.
And in DeFi, stability has a name.
Not ETH.
Not BTC.
👉 Stablecoins.
They are the rails, the liquidity, the accounting unit, and increasingly—the policy engine.
Everything else is just built on top.
REQUEST AN ARTICLE


UBS has partnered with PostFinance, Sygnum, Raiffeisen, Zürcher Kantonalbank, Banque Cantonale Vaudoise, and Swiss Stablecoin AG to launch a sandbox to test various use cases for a Swiss franc stablecoin in Switzerland.
Summary
- UBS and six other Swiss banks have launched a sandbox to test Swiss franc stablecoin use cases in a controlled live environment.
- Swiss Stablecoin AG will provide issuance infrastructure, with the project set to run through 2026 and open to additional participants.
According to the Wednesday announcement, the initiative will allow participating banks to test selected stablecoin use cases in a secure digital live environment. The banks will use the sandbox to build experience in handling digital payment methods. The sandbox is slated to be conducted throughout 2026.
Swiss Stablecoin AG will provide the issuance infrastructure, and the project is also open to other banks, companies, and institutions that want to participate.
Bitcoin Suisse AG has previously developed and issued a Swiss franc stablecoin dubbed the CryptoFranc, or XCHF. However, the stablecoin was discontinued in 2024.
The sandbox brings together some of the largest lenders in Switzerland. UBS Group is the largest among them with $1.7 trillion in total assets. Meanwhile, Raiffeisen Schweiz holds $353 billion, while Zürcher Kantonalbank has $241 billion, and PostFinance holds $121 billion, according to data provided by Advratings.
There’s been a lot of activity around blockchain-based payment systems in Switzerland.
Last year, UBS, PostFinance and Sygnum Bank completed testing of legally binding interbank payments under the Swiss Bankers Association.
As previously reported by crypto.news, the trial tested whether tokenized deposits could support secure, programmable transactions on public blockchains while remaining compliant with Swiss financial rules, including use cases covering payments between bank customers and escrow-like exchanges involving tokenized real-world assets.
The tests confirmed the “feasibility” of institutional blockchain payments; however, the SBA noted that “additional design adjustments” would still be required.

The Viral ‘Jessica’ Toddler Tantrum Hack Is Not A Long-Term Parenting Fix

Konnor Griffin extension: Pirates lock up top prospect on nine-year deal

Google Photos now saves you a precious second with a iPhone-like copy trick

Why Israel is blocking foreign journalists from entering

Bitcoin: We’re Entering The Most Dangerous Phase

Alan Cumming Brands Baftas Ceremony A ‘Triggering S**tshow’

These 6 simple rules can change your financial future #MoneyRules #FinancialFreedom #MoneyManagement

FASILITAS NUKLIR IRAN DISERANG! #trading #kriptodump #trader #forex #crypcurrencey #bitcoin #kripto

Rewire Your Happiness – Luke Belmar #motivation #lukebelmar #success
-

 NewsBeat6 days ago
Steven Gerrard disagrees with Gary Neville over ‘shock’ Chelsea and Arsenal claim | Football
-

 Business6 days ago
No Jackpot Winner and $194 Million Prize Rolls Over
-

 Fashion5 days ago
Weekend Open Thread: Spanx – Corporette.com
-

 Crypto World7 days ago
Gold Price Prediction: Worst Month in 17 Years fo Save Haven Rock
-

 Business3 days ago
Three Gulf funds agree to back Paramount’s $81 billion takeover of Warner, WSJ reports
-

 Business4 days ago
Expert Picks for Every Need
-

 Sports4 days ago
India men’s 4x400m and mixed 4x100m relay teams register big progress | Other Sports News
-

 Business6 days ago
Login and Checkout Issues Spark Merchant Frustration
-

 Tech15 hours ago
How Long Can You Drive With Expired Registration? What Florida Law Says
-
Business3 days ago
No Jackpot Winner, Prize to Climb to $231 Million
-

 Tech6 days ago
Commonwealth Fusion Systems leans on magnets for near-term revenue
-

 Fashion2 days ago
Massimo Dutti Offers Inspiration for Your Summer Mood Board
-

 Crypto World7 days ago
Ripple rolls out enterprise crypto treasury platform for corporates
-

 Tech7 days ago
Drawing Tablet Controls Laser In Real-Time
-

 Crypto World7 days ago
Why It’s Partnering, Not Issuing
-
Politics5 days ago
Wings Over Scotland | The quality of mercy
-
 Sports7 days ago
Steal Gary Woodland’s subtle power move for longer drives
-
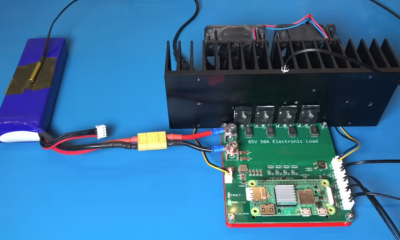
 Tech7 days ago
Battery Tester Outperforms Cheaper Options
-

 Business4 days ago
Akebia Therapeutics, Inc. (AKBA) Discusses Pipeline Progress and Strategic Focus on Kidney Disease Treatments at R&D Day – Slideshow
-

 Fashion20 hours ago
Let’s Discuss: DEI in 2026
You must be logged in to post a comment Login