
Crypto World
US midterms could spark Bitcoin and stock rallies
Geopolitical frictions and a shifting macro backdrop are sharpening focus on what could emerge as a tipping point for crypto and broader risk assets: the US midterm elections. In a March 11, 2026 market commentary, Binance Research surveys how election cycles historically fed rebounds in equities and Bitcoin, suggesting the upcoming vote might unlock a constructive window for risk-on assets. The report flags that the 12 months after past midterms have seen the S&P 500 rise by about 19% on average, while Bitcoin delivered roughly a 54% gain across the three post-midterm years on record. With the midterms slated for November 3, 2026, the study frames the coming year as a potentially pivotal phase for markets trading around political uncertainty.
Key takeaways
- Historical post-midterm performance shows a potential upside for risk assets, with the S&P 500 up ~19% on average and Bitcoin up ~54% over the three post-midterm years in prior cycles.
- Bitcoin has experienced negative returns during several midterm years (example declines: 2014, 2018, 2022), but the pattern in subsequent years has generally been a rebound.
- The near-term direction hinges on geopolitics, notably US-Israel-Iran tensions, with oil prices a potential pressure point if energy supply is disrupted.
- The energy market narrative was reinforced by an emergency energy stock release of 400 million barrels, the largest coordinated drawdown on record.
- Market participants appear to be in a wait-and-see phase, awaiting clearer directional signals once election outcomes are known.
Tickers mentioned: $BTC
Sentiment: Neutral
Price impact: Positive. The historical pattern of post-midterm rebounds in both equities and Bitcoin suggests a potential uplift in risk assets once political uncertainty subsides.
Trading idea (Not Financial Advice): Hold. Investors may want to wait for clearer post-election directional cues and macro signals before taking sizable new positions.
Market context: The narrative arcs around the midterms intersect with macro risk sentiment, regulatory discourse, and energy-market dynamics, all of which can shape liquidity and appetite for crypto assets in the near term.
Why it matters
The Binance Research framework emphasizes that the political risk hurdle commonly cleared after election outcomes has historically unlocked a more robust risk-on regime. In practical terms, if the 2026 midterms resolve with a clearer policy outlook, traders could see renewed bid activity across both traditional markets and crypto. The historical lens does not guarantee future moves, but it provides a reference for how sentiment has tended to shift when political ambiguity diminishes.
From a trader’s vantage point, the divergence between headline risk and market mechanics is notable. Even as Bitcoin (CRYPTO: BTC) has flirted with key levels and traded within ranges shaped by liquidity flows, the broader message of the Binance analysis is that the cycle often accelerates once electoral uncertainty recedes. In prior midterm years, Bitcoin’s trajectory has been punctuated by sharp corrections during the year itself, followed by significant recoveries in the ensuing periods. That pattern could inform risk budgeting and timing considerations for funds that aim to participate in the rebound without overexposure to interim volatility.
Oil and energy markets add another layer of complexity. As geopolitical tensions intensify, crude prices have shown sensitivity to supply expectations. Recent data suggest the market could spike further if disruptions endure, a scenario that tends to weigh on risk assets in the short run even as longer-term cycles remain dependent on policy clarity and liquidity dynamics. A one-day spike to the vicinity of $95 per barrel framed the current stress, underscoring how energy risk can spill over into equities and crypto markets.
In parallel, market infrastructure signals have pointed to a broader risk-off posture in the near term. The energy-release maneuver by international authorities, described as the largest-ever coordinated drawdown, adds a layer of supply-side management that could temper volatility in the energy complex—but it does not eliminate the risk of further macro shocks. Analysts cautioned that continued geopolitical escalation could keep risk assets under pressure, at least until a clearer post-election framework emerges. For readers interested in the on-the-ground links to these developments, recent reporting from Reuters outlined the energy dynamics and the rhetoric around price stability amid the conflict.
Despite the near-term headwinds, the longer historical arc highlighted by Binance Research remains relevant: the period after the election and the associated resolution of political uncertainty has historically produced meaningful rallies. The message is not to extrapolate a foolproof blueprint, but to recognize that policy clarity can reframe risk appetite. Bitcoin’s own history of midterm-year drawdowns, followed by rebounds, adds a layer of complexity but also a potential pathway for investors who can weather the interim noise. To see a related compilation of market context including the energy shock and its ripple effects, readers can review the linked analyses and the energy market data sources cited in the coverage, including the market commentary that anchors these observations.
For a quick snapshot of the broader narrative in motion, a concise explainer video on market dynamics related to this cycle can be found here: Video discussion.
The analysis arrives as markets enter a period of heightened attention ahead of the November 3, 2026 vote, when the 120th Congress will take shape and set the tone for policy and regulatory signals in the year ahead. While the near term may ride a roller-coaster of headlines, the data from prior cycles provides a reference point for investors assessing whether a recovery window could be opening for equities and digital assets alike. The key takeaway: the post-election horizon could be the most constructive phase of the cycle, provided geopolitical tensions do not diverge into a sustained risk-off regime before the dust settles.
The crosscurrents at play—geopolitics, energy stability, and the timing of policy clarification—mean that market moves could be as much about risk sentiment and liquidity flows as about fundamentals. In the coming months, traders will be watching for progress in diplomatic channels, oil market signals, and any regulatory developments that could influence market structure or capital flows into crypto. The interplay of these factors will help determine whether the long-hoped-for recovery accelerates or remains restrained by ongoing uncertainty.
As with all such analyses, the caveat remains: past performance is not a guarantee of future results. However, the framework outlined by Binance Research provides a structured lens to interpret how the upcoming midterms might align with broader macro and crypto-market rhythms. The next few quarters will be telling as investors weigh the odds of a meaningful reset against continued geopolitical volatility and policy debates that will shape the market landscape for the remainder of the year.
What to watch next
- November 3, 2026 — US midterm elections determine the composition of the 120th Congress and influence policy signals for the year ahead.
- Post-election period — watch for any substantive shifts in regulatory discourse that could affect crypto market structure and liquidity.
- Geopolitical developments in the Middle East — escalation or de-escalation can impact energy prices and risk sentiment.
- Official energy-market actions — monitor further commentary on energy security and any additional emergency stock management outcomes.
- Market commentary updates — ongoing analyses that correlate election outcomes with volatility and liquidity in crypto markets.
Sources & verification
- Binance Research, Weekly Market Commentary (March 11, 2026) — historical post-midterm performance data and interpretation.
- Reuters reporting on energy disruptions and price implications related to Middle East tensions.
- Trading Economics data on crude oil price movements and daily price spikes.
- International Energy Agency announcements on emergency stock releases (largest coordinated drawdown).
- Election date and political timeline for the November 3, 2026 midterms.
Post-midterm dynamics could reshape crypto and risk assets
The central premise is that the political fog surrounding election outcomes has historically been a wind at the back of risk assets once it lifts. Binance Research’s synthesis shows a pattern of strength following periods of uncertainty, with the S&P 500 and Bitcoin delivering memorable advances in the year or years after midterm cycles. That pattern does not imply a guaranteed rally, but it offers a framework for considering how a calmer political horizon might influence price action across markets that have become increasingly interlinked in recent years.
In practice, the near-term trajectory will be colored by geopolitics and macro data arrivals. The immediate risk premiums tied to the US-Israel-Iran dynamic could push energy prices higher, which tends to compress risk appetite in the short run. Yet if the election outcomes resolve in a way that reduces political risk, liquidity could improve and traders may reallocate toward risk assets, including digital currencies. Bitcoin’s own history in midterm years—marked by episodic declines followed by longer-term recoveries—adds nuance to how investors should position themselves during this transition window. The historical signal is not a guarantee, but it is a lens for weighing potential outcomes as the cycle evolves.
Market participants will also be watching for any policy shifts or legislative milestones that could affect the crypto market structure, such as regulatory proposals or framework updates that impact market access and capital flows. The energy-market backdrop, with its flashpoints and emergency stock actions, will continue to feed volatility but also to shape the tempo of risk-taking. In a landscape where liquidity and risk sentiment are closely tethered to macro and geopolitical developments, the post-midterm period could offer a clearer directional signal for traders, investors, and builders navigating the crypto ecosystem.

Solana price managed to hold above the $70 support on Thursday as bulls stepped in to defend the psychological level.
Summary
- Solana price dropped nearly 9% after a $270 million exploit on Drift and a sharp decline in network TVL.
- Broader risk-off sentiment driven by escalating Middle East tensions and rising oil prices added pressure on the token.
- Technical indicators show weakening momentum despite a potential falling wedge breakout, with bears still dominating trend strength.
According to data from crypto.news, Solana (SOL) price fell nearly 9% from an intraday high of $85.1 on Wednesday to an intraday low of $77.6 on Tuesday before stabilizing at $80 at press time.
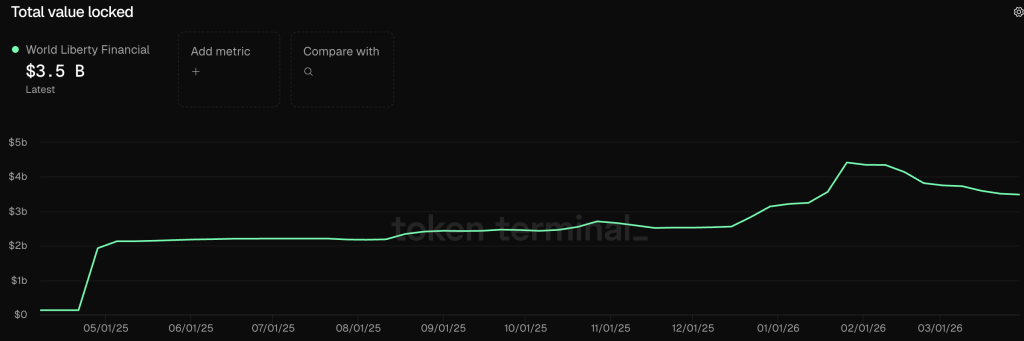
Solana price fell following a $285 million exploit that occurred yesterday on Drift Protocol, a trading venue native to the Solana blockchain. Following the breach, the total value locked on Solana has shrunk by nearly $1 billion since the incident, per DeFiLlama.
The token also fell amid tensions in the Middle East that continued to drive investor sentiment away from risk assets. Notably, Iranian officials noted they would be targeting retaliatory measures against 18 U.S. military assets, including strategic bases in the region. On the other hand, the U.S. struck several key targets, including a critical supply bridge and logistics hubs.
The resulting conflict has fueled expectations that the Strait of Hormuz would continue to remain closed as the U.S. focuses its attention on bringing the regional threat to a standstill over the coming 2 to 3 weeks. Oil prices rose back above $110 amid fears of runaway inflation and supply chain disruptions.
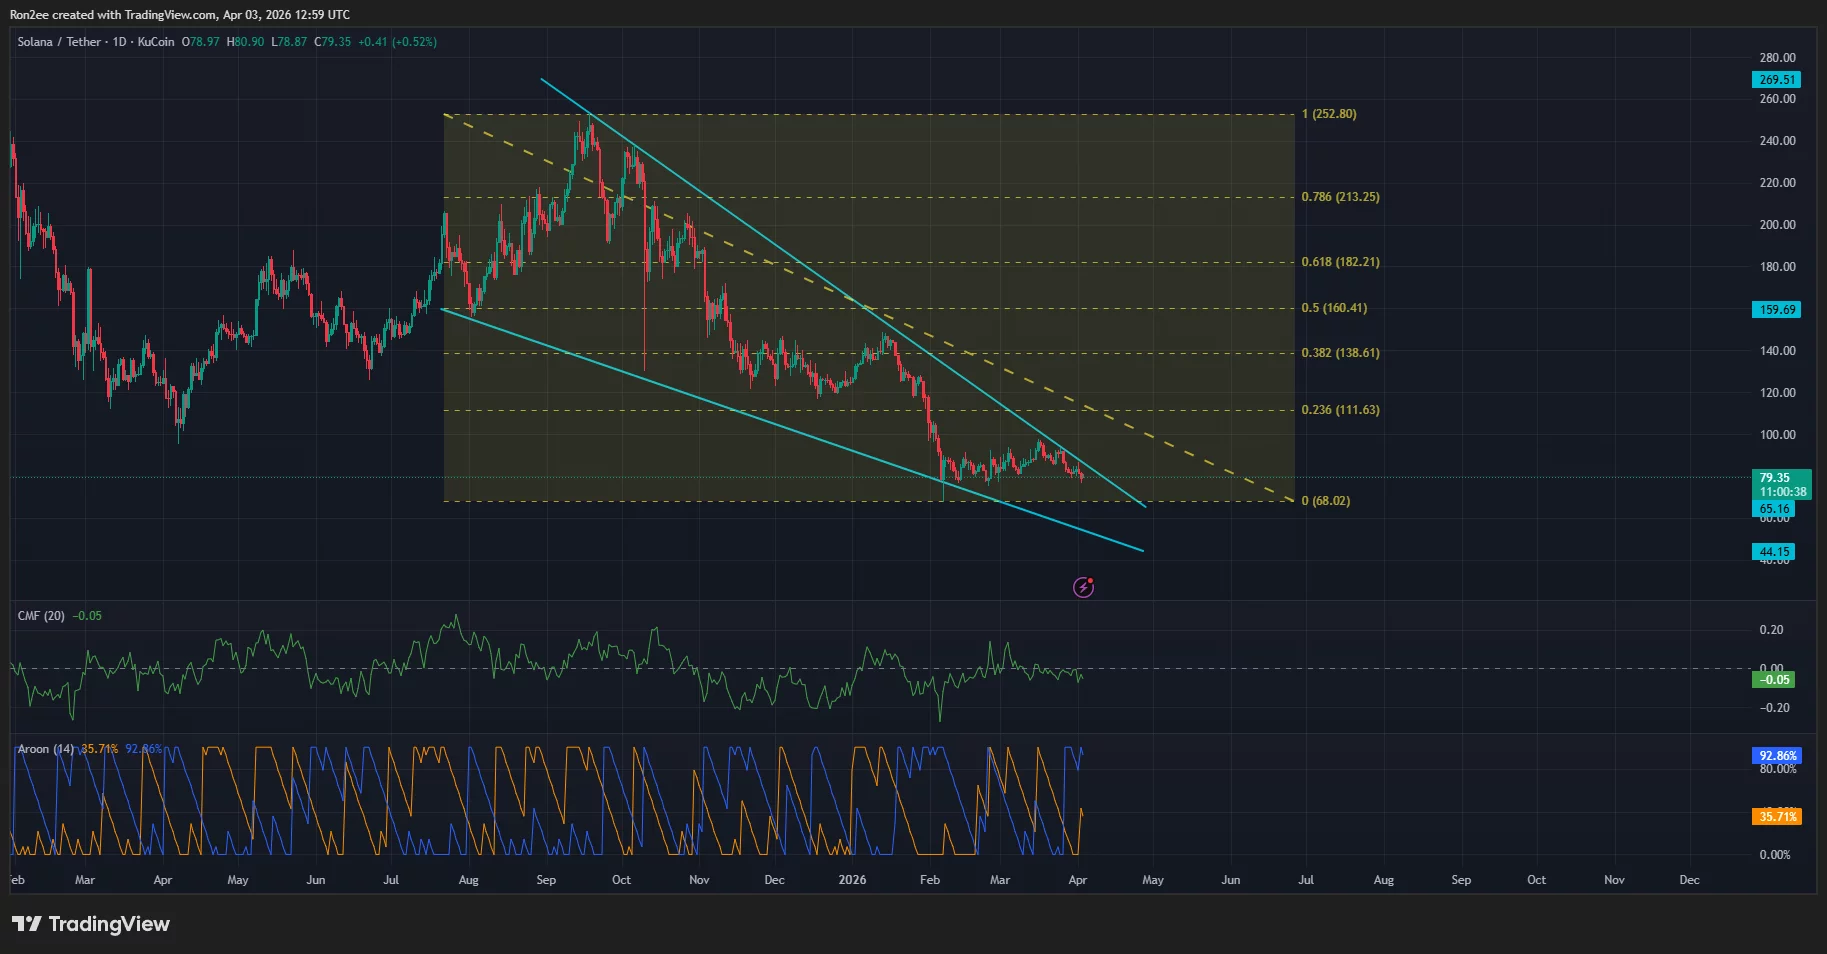
On the daily chart, Solana price is close to breaking out of a multi-month falling wedge pattern formed of two descending and converging trendlines. A breakout from a falling wedge pattern often signals a powerful bullish reversal as selling pressure finally exhausts itself.

For Solana, a confirmed breakout from such a pattern could fling the price all the way to $111, which aligns with the 23.6% Fibonacci retracement level. Reaching this target would represent a significant recovery from recent lows and could reignite broader investor interest in the ecosystem.
However, current technical data suggests some caution on the way. Notably, the Chaikin Money Flow index showed a negative reading of -0.05. A negative reading on the indicator suggests that there is still a lack of strong buying pressure and that some capital is still flowing out of the asset.
At the same time, the Aroon Down stood at 92.86% while the Aroon Up was at 35.71%, which means the bears still hold the upper hand in terms of trend strength. This disparity indicates that while a breakout is possible, the downward momentum has not yet been fully broken by the bulls.
Disclosure: This article does not represent investment advice. The content and materials featured on this page are for educational purposes only.

Coinbase and the Linux Foundation launched the X402 Foundation on April 2, 2026, a non-profit tasked with stewarding an open-source protocol that finally puts the 30-year-dormant HTTP 402 status code to work as the web’s native payment layer.
The founding coalition includes Stripe, Cloudflare, AWS, Google, Microsoft, Visa, and Mastercard, which means this is not a crypto-native experiment – it is a bid to rewire how the entire internet handles money.
Key Takeaways:
- Protocol Scope: X402 standardizes the HTTP 402 “Payment Required” response code to trigger stablecoin or ERC-20 token settlement directly inside web and API interactions.
- AI-First Design: The protocol is built explicitly for autonomous AI agents – machines can encounter a paywall, read the X402 response, and settle the payment via a pre-authorized wallet with no human intervention required.
- Neutral Governance: By housing X402 under the Linux Foundation, Coinbase has structurally prevented any single corporation – including itself – from controlling the web’s new financial rails.
- Layer-2 Integration: X402 is blockchain-agnostic but debuted on Base, Coinbase’s Layer-2 network, with Cloudflare’s Agents SDK already supporting live transactions on Base Sepolia testnet using USDC.
- Micropayments at Sub-Cent Cost: Stablecoin settlement delivers near-instant finality at sub-cent transaction fees – a cost structure that credit card networks and ACH cannot match for machine-to-machine commerce.
- What to Watch: Reference implementation and SDK releases scheduled throughout 2026 are the critical adoption milestones – browser-level integration and sign-off from traditional financial members will determine whether X402 becomes infrastructure or a footnote.
Discover: The best crypto to diversify your portfolio during market turbulence
What X402 Actually Does – and Why HTTP 402 Sat Unused for Three Decades
HTTP 402 was reserved in 1995 as a placeholder for future payment systems that never arrived. The reason it never arrived is structural: the internet had no native settlement layer.
Every payment required routing through a third-party processor, a bank, or a proprietary API – none of which a web server could negotiate with autonomously at the protocol level.
X402 changes the handshake. When a server requires payment, it issues a standardized X402 response containing the price, accepted tokens, and payment terms. The client – whether a browser, an application, or an AI agent – reads those terms, constructs a signed payment payload in the X-PAYMENT HTTP header, and submits it. A payment facilitator (currently the Coinbase X402 Facilitator) verifies the signed payload before the server returns an X-PAYMENT-RESPONSE confirmation. The entire flow is atomic and requires no account creation, no API key provisioning, no manual authentication step.
The protocol supports all ERC-20 tokens – not just stablecoins, and is designed to be blockchain-agnostic, though its early infrastructure runs on Base, Coinbase’s Layer-2 network. Cloudflare has already shipped a withX402Client wrapper for its Agents SDK that lets developers toggle between human-confirmation and fully autonomous execution modes. The technical specification and codebase are publicly available at x402.org under LF Projects, LLC.
Linux Foundation CEO Jim Zemlin described the foundation as the “neutral home” for the protocol – language that signals deliberate insulation from the kind of corporate capture that killed earlier micropayments standards.
That governance decision is what separates X402 from Coinbase’s previous developer initiatives: this is not a product. It is an attempt to establish a standard.
Explore: The best pre-launch token sales with asymmetric upside potential
Who Benefits – and What X402 Needs to Actually Win
The immediate winners are developers building on Base and anyone deploying autonomous AI agents that need to purchase data, call premium APIs, or access metered content at scale.
Traditional payment infrastructure, built around two-factor authentication and fixed per-transaction fees – is structurally incompatible with high-frequency, low-value machine-to-machine payments. X402 is purpose-built for exactly that environment.
Coinbase benefits disproportionately in the near term. Base is the reference network, the Coinbase X402 Facilitator is the default payment verifier, and USDC, Circle’s stablecoin with deep Coinbase ties, is the primary settlement asset.
The x402 foundation launched on 4/02 by the way. https://t.co/WULpuBdVhW
— Coinbase
(@coinbase) April 3, 2026
The open governance structure prevents lock-in on paper, but network effects will concentrate volume on whatever infrastructure ships first. That is currently Base. The broader regulatory groundwork Coinbase has laid through FIT21 advocacy compounds this structural advantage – a company that shapes both the legal framework and the technical standard occupies a uniquely durable position.
The adoption risk is browser integration. X402 can function today at the application and API layer without any browser changes, but mainstream consumer adoption requires Chrome, Safari, and Firefox to natively parse X402 responses.
Google and Microsoft are founding members of the X402 Foundation, which is the strongest signal available that browser-level support is on the roadmap, but roadmaps are not shipping products. The protocol wins if the SDKs land before a competing standard gains traction. It stalls if the major browser vendors treat this as a low-priority governance commitment rather than an active engineering project.
The verdict: X402 is the most credible attempt to build a native payment layer into the web since the original HTTP spec reserved that status code. Execution is the only variable left.
The post Coinbase & Linux Foundation Debut X402: HTTP-Native Crypto Payment Standard appeared first on Cryptonews.

Arkham Intelligence published a comprehensive breakdown of the largest Ethereum (ETH) holders in 2026, revealing that staking contracts, exchanges, and financial institutions now control most of the supply.
The report draws on on-chain data from the Arkham Intel Platform and covers entities ranging from centralized exchanges to individual pre-sale investors.
Staking and Exchanges Control Most ETH
The ETH2 Beacon Deposit Contract sits at the top of the list with over 82 million ETH, valued at approximately $169 billion.
That figure represents roughly 66% of the total ETH supply, locked by validators securing the network.
Among exchanges, Coinbase leads with 4.2 million ETH ($8.6 billion), followed by Binance with 3.6 million ETH ($7.3 billion).
South Korean exchange Upbit ranks third at 1.7 million ETH. These holdings are custodial, held on behalf of users for trading, withdrawals, and staking services.
On the financial institution side, BlackRock holds over 3 million ETH ($6 billion) through its iShares Ethereum Trust ETF.
Treasury company Bitmine has declared 4.7 million ETH in total, though only 914,000 ETH has been verified on-chain by Arkham.
Bitmine aims to accumulate 5% of the total ETH supply.
Individual Holders and Lost Fortunes
Among individuals, Estonian pre-sale investor Rain Lohmus technically owns the most ETH at 250,000 tokens worth $530 million.
However, he lost access to his private keys after purchasing them for $75,000 during the 2014 presale.
Ethereum co-founder Vitalik Buterin is the largest individual holder with accessible funds, holding 224,000 ETH ($480 million).
Ethereum Foundation Shifts From Selling to Staking
Separately, Arkham reported the Ethereum Foundation staked an additional $46.64 million in ETH, its largest single-day deployment.
That brings the Foundation’s total staked amount to approximately $96.59 million.
The move is part of a broader plan announced in February to stake 70,000 ETH from its treasury. Staking rewards will fund research, ecosystem grants, and protocol development.
The Foundation previously relied on periodic ETH sales, which drew community criticism for creating sell pressure.
With institutions, exchanges, and now the Ethereum Foundation itself locking supply into validators, the distribution of ETH increasingly favors long-term holders over liquid markets.
The post Who Really Owns All the Ethereum? On-Chain Study Reveals Surprising Names appeared first on BeInCrypto.
Crypto World
World Liberty Financial Under Ethics Fire: Can WLFI Crypto Survive Corruption Allegations?
World Liberty Financial (WLFI) crypto is structured to funnel 75% of net revenues to DT Marks DEFI LLC, a Delaware entity tied directly to Donald Trump and his family, while insulating them from any legal or financial liability for the project’s operations.
House Democrats published a staff report on November 24 describing WLFI as the centerpiece of what it calls presidential self-dealing on an unprecedented scale, with Representative Jamie Raskin stating that Trump has “turned the Oval Office into the world’s most corrupt crypto startup operation.”
The conflict-of-interest mechanism is direct and unambiguous. Donald Trump simultaneously controls crypto policy from the White House and holds a dominant financial stake in a DeFi project whose commercial value depends on the regulatory environment he shapes. That is not a perception problem – it is a structural one.
Discover: Best Crypto to Diversify Your Portfolio
Key Takeaways:
- Revenue structure: 75% of WLFI net revenues flow to DT Marks DEFI LLC, a Trump family-linked entity, with no personal liability attached.
- Scale of extraction: The Trump family has collected at least $890 million in revenues and holds WLF tokens valued at $3.8 billion, with no evidence of personal capital investment.
- Foreign money: Justin Sun invested $75 million in WLFI tokens before his SEC fraud case was dropped; UAE-based Aqua 1 Foundation wired $100 million in stablecoins with unclear origins.
- Token performance: WLFI tokens are down 50% from all-time highs; Trump and Melania memecoins have collapsed 91% and 99% respectively.
- Banking expansion: On January 9, 2026, WLFI applied to the OCC for a national trust bank charter under World Liberty Trust Company, with Zach Witkoff listed as proposed president.
- Political exposure: House Democrats’ Anti-Crypto Corruption Week scrutiny is escalating, with the November 24 report naming obstruction of justice, foreign influence, and self-dealing as core allegations.
What WLFI’s Revenue Structure Actually Means – and Why Ethics Experts Are Alarmed
The mechanics of World Liberty Financial’s compensation structure are what drive the ethics concerns, not the politics surrounding them.
Under the project’s Gold Paper, DT Marks DEFI LLC – the Trump family’s designated revenue vehicle – receives 75% of net revenues generated by the DeFi platform, while the legal wrapper around that entity specifically protects the Trump family from operational liability. The distinction matters because it creates a one-way financial relationship: profit flows to the Trumps, risk does not.
Citizens for Responsibility and Ethics in Washington (CREW) and other watchdog organizations have flagged this arrangement as without precedent in the relationship between a sitting president and an active commercial enterprise.
The Trump family has extracted at least $890 million in revenues from WLFI while holding tokens currently valued at approximately $3.8 billion – with no documented personal capital investment at inception. That is not a founder’s equity stake built through risk-taking. It is a revenue claim backed by name recognition and political positioning.

The foreign investment dimension compounds the structural problem significantly. Justin Sun, charged by the SEC for fraud and market manipulation, invested $75 million in WLFI tokens. His multibillion-dollar SEC case was subsequently dropped.
The UAE-based Aqua 1 Foundation, linked by analysts to entities with ties to China’s state-owned CNPC, wired $100 million in stablecoins to the project in summer 2025 – with Reuters reporting that the origins and expectations attached to that transfer remain opaque. A 60 Minutes report on November 17, 2025 further connected a $2 billion Binance-MGX deal settled in WLFI’s USD1 stablecoin to Binance founder Changpeng Zhao’s Trump pardon.
Crypto insiders have described WLFI as a mechanism for global influence-buying dressed as a DeFi project. Some institutional players, approached with what sources describe as “mutual investment” pitches, declined after concluding the arrangement crossed ethical lines.
The absence of institutional whales in WLFI’s order books – with retail participants dominating token purchases – suggests sophisticated capital has reached a similar conclusion.
Discover: The Best Crypto to Buy Right Now
Can a President Profit From Crypto Policy? The Conflict WLFI Can’t Shake
Trump’s administration has moved aggressively on crypto-friendly policy reform since January 2025, and each legislative win that benefits the broader industry also directly benefits World Liberty Financial.
The GENIUS Act, which Trump endorsed to establish a stablecoin regulatory framework, creates legitimacy infrastructure for USD1 – WLFI’s own stablecoin – at exactly the moment the project needed it.
The FIT21 regulatory framework, which restructures SEC and CFTC jurisdiction over crypto assets, would materially ease the compliance burden on DeFi platforms like WLFI.
The SEC’s dramatically softened enforcement posture under the Trump administration is not a coincidence critics are willing to overlook, particularly given the Sun case. A president whose family holds $3.8 billion in tokens tied to a DeFi project has quantifiable financial incentives to reduce regulatory friction on DeFi.
The White House maintains that Trump’s assets are held in a trust managed by his children and that no conflicts exist. That framing is deliberate: a trust managed by the president’s children, in a project co-founded by those same children, is not a meaningful separation under any conventional ethics standard.
The evolving legal frameworks for DeFi entities make WLFI’s structural opacity harder to dismiss as a technicality. WLFI’s January 2026 OCC application for a national trust bank charter – listing Zach Witkoff as proposed president – would, if approved, extend the project’s reach into federally regulated banking infrastructure. The political and financial interests at stake are not abstract. They are denominated in billions and written into legislation.
Discover: The Best Crypto Presales Live Right Now
The post World Liberty Financial Under Ethics Fire: Can WLFI Crypto Survive Corruption Allegations? appeared first on Cryptonews.

Riot Platforms sold 3,778 Bitcoin in Q1 2026, netting $289.5 million-a volume that dwarfs its 1,473 BTC production for the same period by 2.6x.
The company ended Q1 with 15,680 BTC on its books, down 18% from the 18,005 coins it held at the close of 2025. That gap between what Riot mined and what it sold is the number that demands explanation.
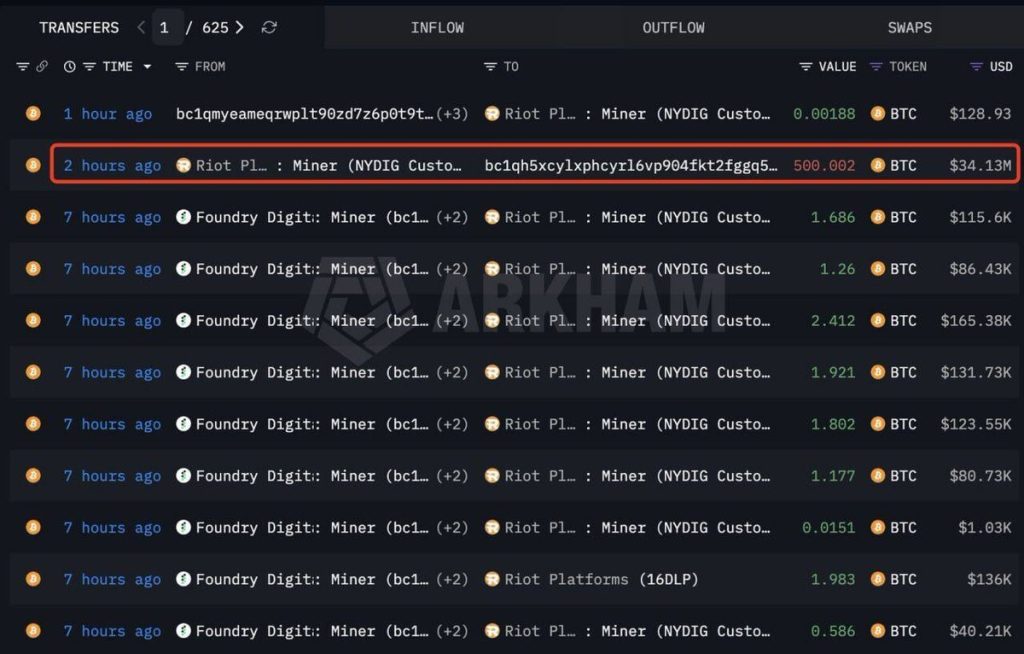
Blockchain intelligence platform Arkham flagged a separate 500 BTC outflow from a wallet attributed to Riot on Thursday, suggesting the selling didn’t stop when Q1 closed.
The company is also pushing deeper into high-performance computing colocation, shifting its business model beyond pure mining toward infrastructure hosting-a pivot that requires capital, which partially explains the aggressive liquidation pace.
Energy costs are the other half of the story. Kadan Stadelmann, blockchain developer and co-founder of AI company Compance, said miners are selling because rising energy costs-worsened by the escalating Middle East conflict since February-are compressing margins across the industry.
“This leads to a fall in hashrate and difficulty in Bitcoin mining. This makes it easier and more profitable to mine Bitcoins for those miners who remain online,” Stadelmann said, predicting further capitulation from less efficient operators.
- Sales volume: Riot sold 3,778 BTC in Q1 2026, generating $289.5 million against quarterly production of just 1,473 BTC.
- Treasury drawdown: BTC holdings fell 18% quarter-over-quarter, from 18,005 to 15,680 BTC.
- Power cost improvement: All-in power cost dropped 21% year-over-year to 3.0¢/kWh, even as selling accelerated.
- Hash rate expansion: Deployed hash rate grew 26% to 42.5 EH/s, signaling infrastructure reinvestment over accumulation.
- Power credits: Riot generated $21.0 million in power credits during Q1-more than double the prior year period.
- Industry-wide selling: MARA Holdings, Genius Group, and Nakamoto Holdings sold a combined 15,501 BTC in the last week alone.
Discover: The Best Crypto to Get Right Now
Selling Above Production Rate – Operational Pivot or Distress Signal?
Selling 2.6x your quarterly production isn’t treasury management in the traditional sense-it’s a structural drawdown.
That matters because it signals Riot isn’t just covering operating costs; it’s funding something larger, whether that’s hash rate expansion, colocation infrastructure buildout, or balance sheet repair ahead of continued Bitcoin price pressure.
The operational data cuts against a pure distress read, though. Riot improved its all-in power cost 21% year-over-year to 3.0¢/kWh and grew deployed hash rate 26% to 42.5 EH/s. It also generated $21.0 million in power credits during Q1-more than double the year-ago period-by leveraging renewable energy agreements and grid services.

That’s not the profile of a miner bleeding out; it’s a miner reallocating capital aggressively into infrastructure while conditions remain volatile.
Riot isn’t alone. MARA Holdings, Genius Group, and Nakamoto Holdings sold a combined 15,501 BTC in the past week.
Genius Group went further-liquidating its entire Bitcoin stash. The industry is clearly in a rotation away from passive accumulation toward active treasury management, a departure from the hodl-first playbook that defined miner strategy through the 2021 bull cycle. If Bitcoin prices don’t recover in Q2, watch for Riot’s treasury to test the 14,000 BTC level within two quarters at the current drawdown rate.
Discover: The Best Crypto Presales Live Right Now
Miner Selling and BTC Supply Pressure: How Much Does It Move the Market?
Bitcoin mining difficulty dropped from approximately 145 trillion to 133 trillion on March 20-a 7.7% decline-while network hash rate fell from 1,160 exahash to roughly 990 exahash as of Friday.
Weaker miners are going offline, exactly as Stadelmann predicted, which structurally benefits survivors like Riot with lower difficulty and higher per-block rewards.
The supply side picture is more complicated when viewed against demand. Bitcoin ETFs snapped a four-month outflow streak with $1.32 billion in March inflows, meaning institutional demand is partially absorbing the miner supply hitting the market.
Riot alone doesn’t move BTC price-but Riot plus MARA plus Genius Group plus Nakamoto in the same week represents a coordinated pressure event that on-chain miner outflow metrics will reflect clearly.
The invalidation condition here is simple: if BTC reclaims and holds above $90,000 in Q2, Riot’s treasury logic flips from defensive liquidation to premature selling at cycle lows. Until that happens, the selling looks rational given the broader market pressure on holders and the rising cost environment compounding miner margin squeeze globally.
Explore: The best pre-launch token sales with asymmetric upside potential
The post Riot Platforms Sells 3,778 Bitcoin in Q1 as Miner Strategy Shifts appeared first on Cryptonews.


The U.S. employment market rebounded in a big way from February’s sizable losses.
According to a Friday morning release from the Bureau of Labor Statistics, the country added 178,000 jobs in March, after losing 133,000 positions the previous month. Economist forecasts had been for 60,000 jobs to have been added.
The unemployment rate fell to 4.3% versus 4.4% in February and expectations for 4.4%.
At least part of the beat was due to a sizable downward revision in the February data from an originally reported decline of 92,000.
Trading quietly near the $67,000 level in the hours ahead of the data, bitcoin remained there in the minutes just following the report.
Expectations about the future course of interest rates, of late, have been far more influenced by events in the Middle East and the price of crude oil than by the outlook for domestic economic growth.
As recently as last week, oil’s surging price had markets forecasting imminent rate hikes by the U.S. Federal Reserve. Speaking earlier this week, though, Fed Chairman Jerome Powell said the central bank recognized that oil price shocks — while initially making headline inflation numbers look worse — can depress economic activity. He indicated the Fed would be in no hurry to raise rates in response to short-term moves in the price of crude.
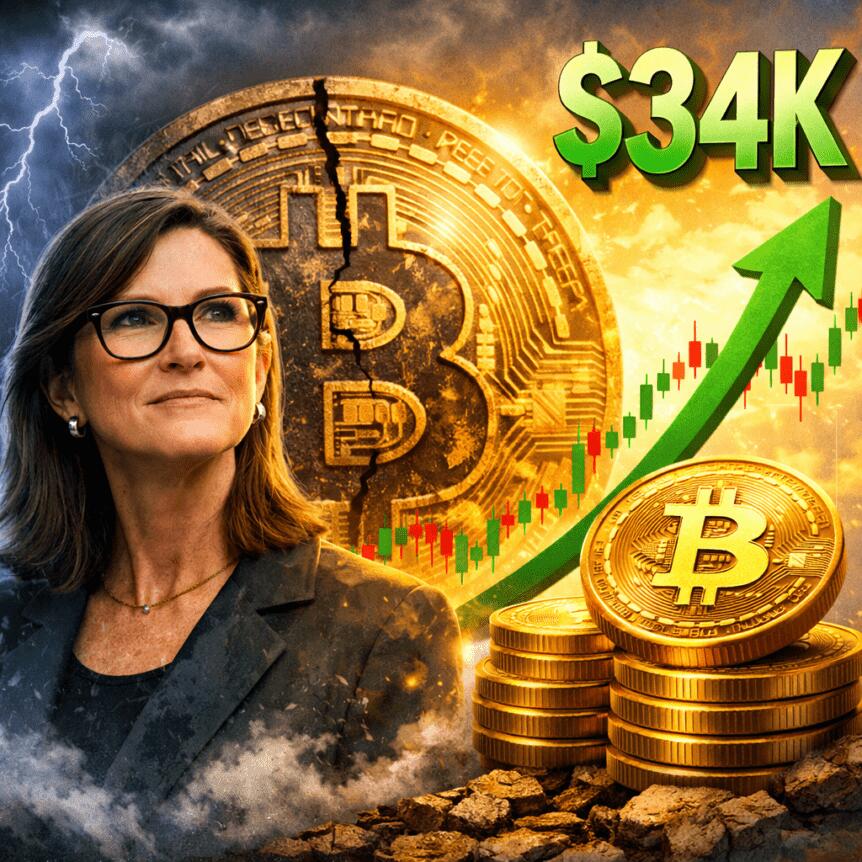
Bitcoin’s drawdown narrative is shifting from a pattern of extreme collapses to a more mature market dynamic, according to Cathie Wood, the founder and CEO of ARK Invest. In a CNBC appearance on Squawk Box dated April 1, Wood argued that the era of 85% or greater corrections may be behind BTC, framing the asset as a proven technology and monetary tool rather than a volatile tech experiment.
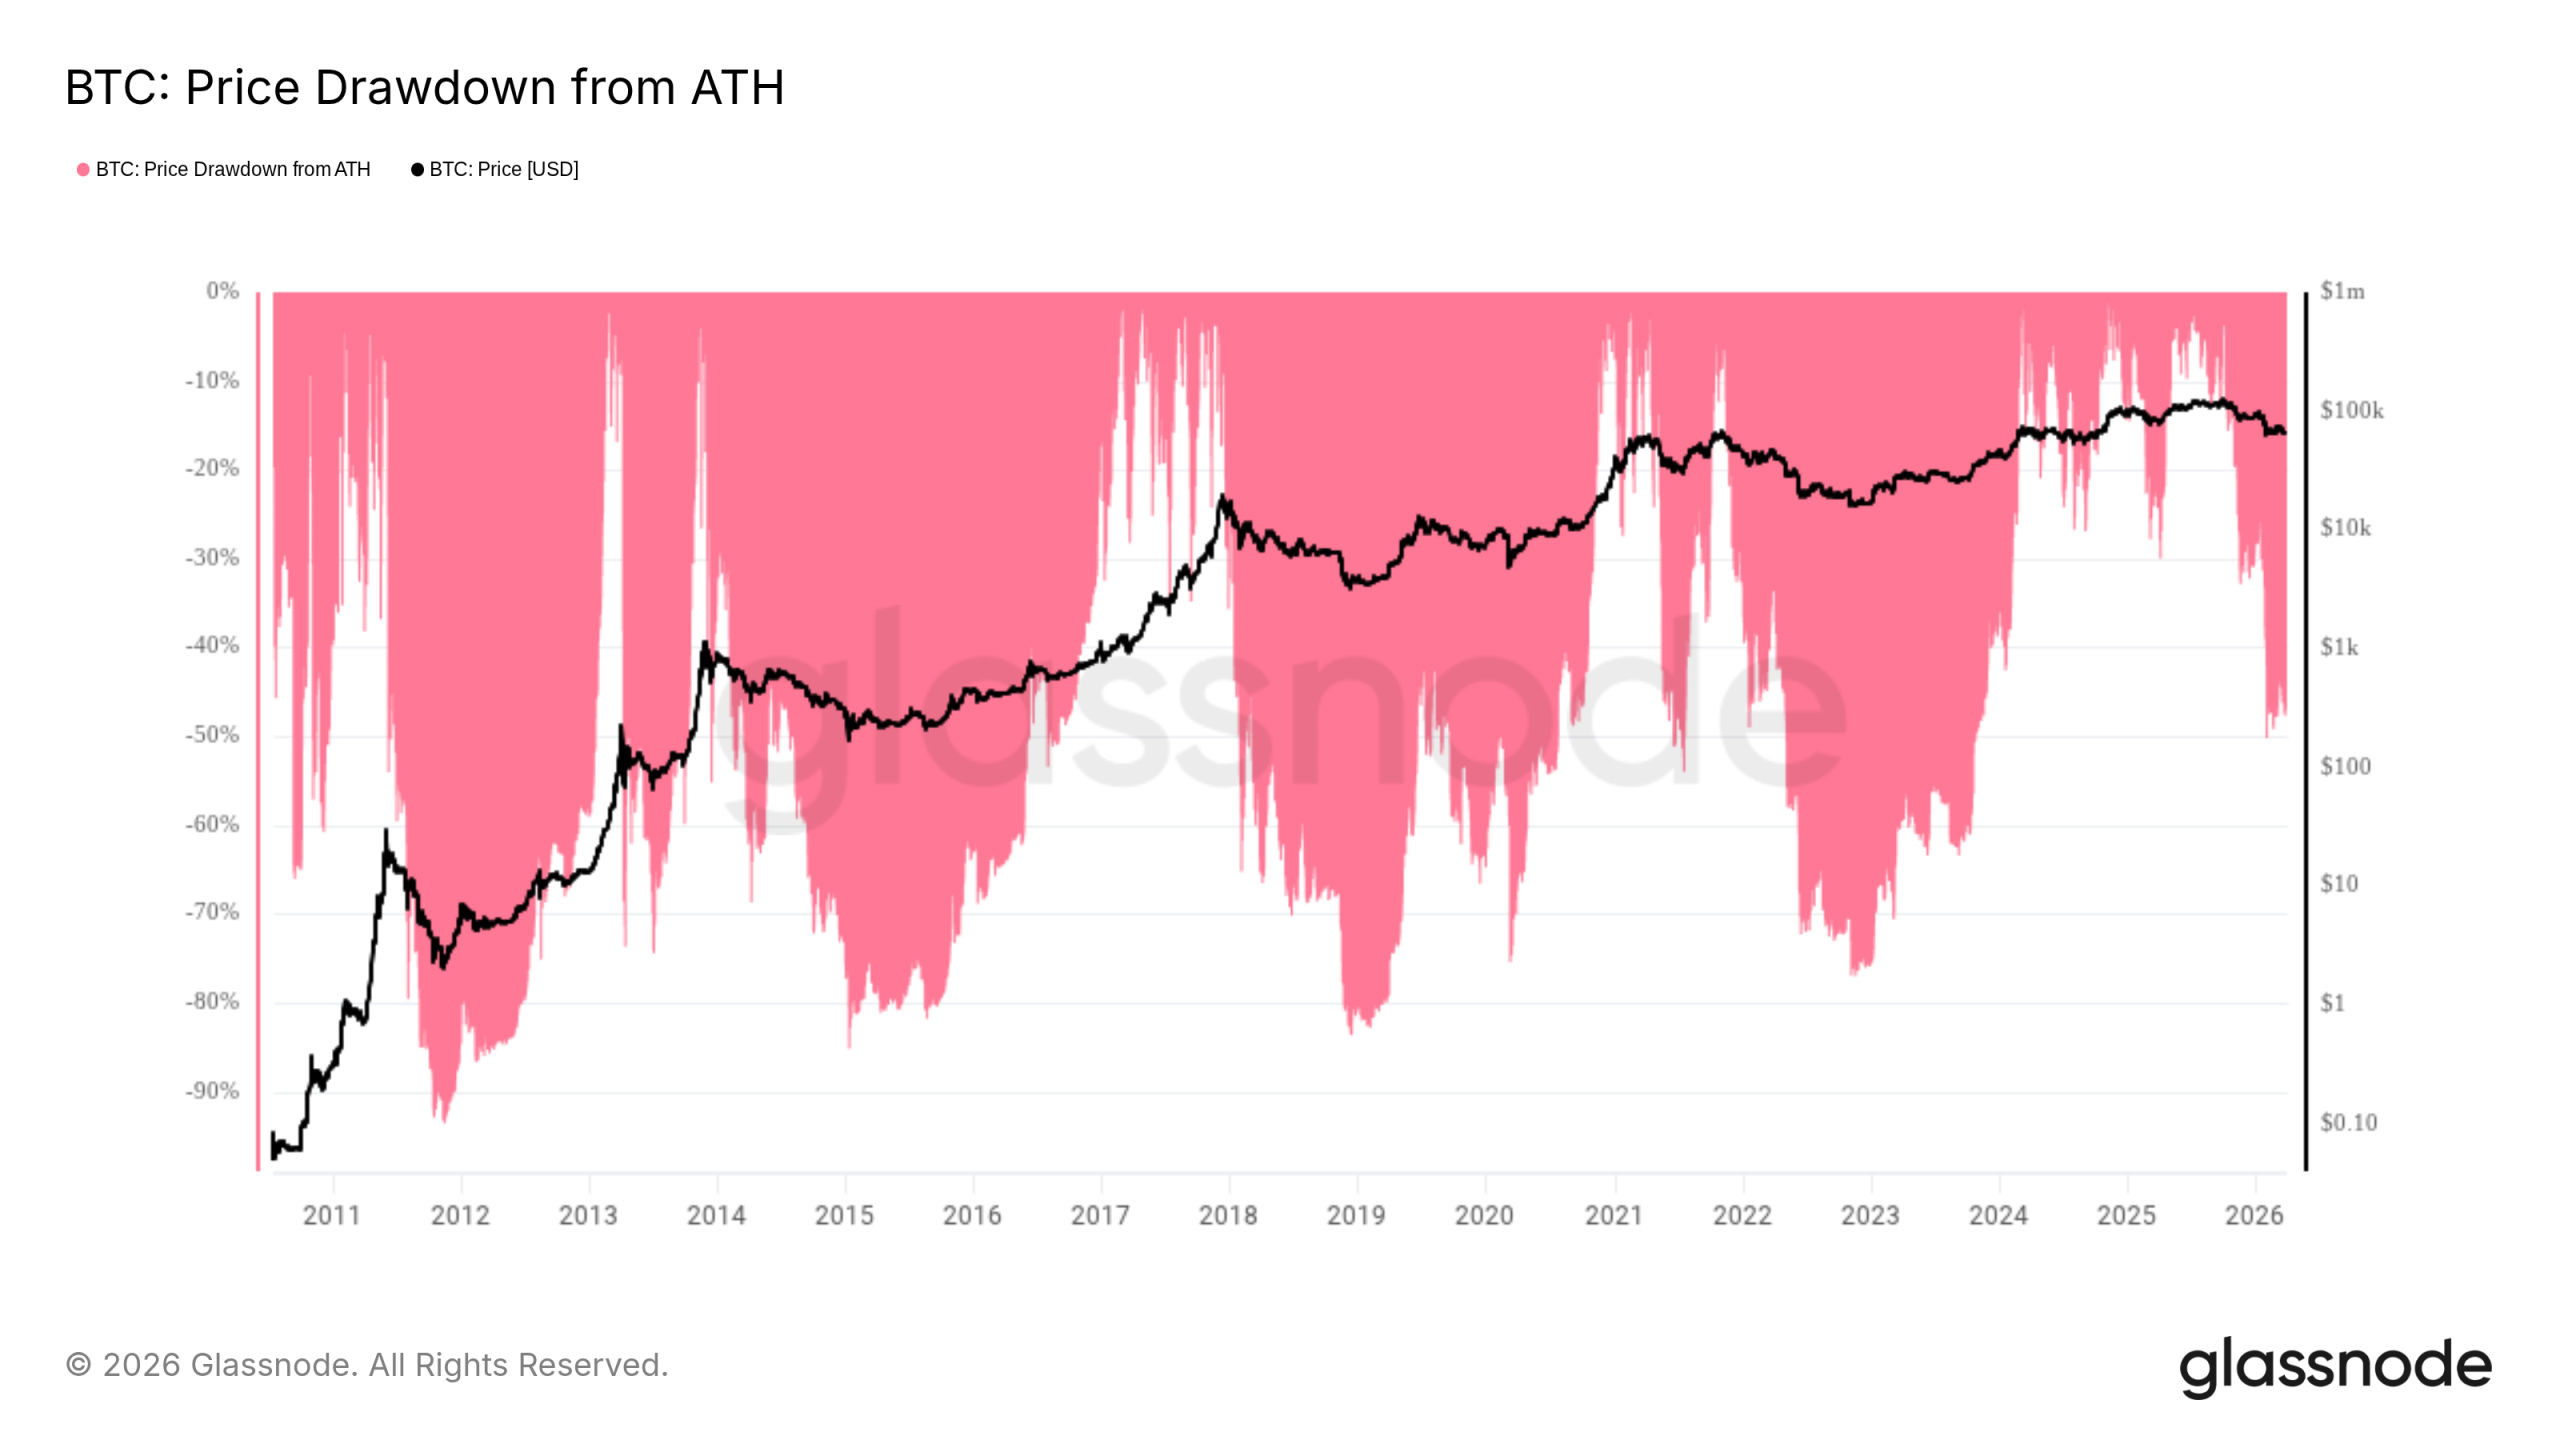
Speaking amid a price backdrop around the 69,000 level—the prior all-time high reached in 2021—Wood’s remarks come after a long bear market that wiped out roughly 80% of BTC’s value before a bottom near 15,600. On-chain data, however, suggest the current downturn has not yet mirrored the depth seen in prior cycles. Glassnode data indicate the bear market’s maximum drawdown from BTC’s peak remains well short of past extremes, around 52% from the record high of about 126,200 in October 2025.
Key takeaways
- ARK Invest’s Cathie Wood argues Bitcoin is past the era of 85%+ price collapses, framing BTC as a proven technology and monetary asset rather than a speculative fad.
- Analysts disagree on the next significant price level: a chartist forecast points to roughly $34,000 as a bottom (a 72% drawdown), while consensus from broader coverage points to a range of roughly $40,000 to $50,000.
- On-chain data show the bear market depth to date is shallower than in some previous cycles, with maximum drawdown around 52% from the all-time high, suggesting a potentially different extinction-like pattern for BTC.
- April seasonality and near-term momentum remain in focus: some analysts see historical patterns of spring recoveries during bear phases, while macro headlines and liquidity conditions continue to influence the path forward.
Wood’s view: BTC’s maturation and the new normal
Wood’s comments came during a dialogue about Bitcoin’s long-run narrative. She stressed that the 85–95% declines associated with earlier, less mature markets are unlikely to recur for Bitcoin, a narrative she frames as evidence of BTC’s transformation into a validated monetary system and a new asset class. The remarks echo her longstanding bullish stance on Bitcoin, which has been a hallmark of ARK’s research orientation toward disruptive technologies.
At the time of her appearance, Bitcoin was hovering near the post-2021 high watermark—an area that previously marked the transition into a multi-quarter bear cycle. Wood’s perspective contrasts with the more cautious or range-bound themes that have dominated much of the current trading backdrop, where macro conditions, policy signals, and sector rotation often determine day-to-day moves.
That said, Wood’s optimism sits alongside a chorus of caution from other analysts who note that the road ahead remains data-driven and uncertain—a reminder that even as BTC stabilizes, macro headwinds can quickly reassert themselves.
Forecasts diverge on the floor of the bear market
While Wood’s stance centers on BTC’s maturation, other voices point to specific downside scenarios. Tony Severino, a veteran market technician, floated a bottom near $34,000, implying a 72% drawdown from the peak. He summarized the trajectory in a post on X, suggesting that a decline to that level would mark a “max drawdown” consistent with a new phase for the asset.
Beyond Severino’s projection, broader market commentary remains split. A section of traders and analysts continues to anticipate a bottom in the higher $40,000s to low $50,000s, a range that Cointelegraph has cited in prior coverage as a common region for a generational floor rather than a catastrophic collapse. For some observers, the 40k–50k zone remains the anchor for a long-term re-rating of Bitcoin’s risk profile.
Meanwhile, Bloomberg Intelligence analyst Mike McGlone has warned that prices could be trending toward seven-year lows, underscoring the risk that macro developments—such as central-bank policy and global liquidity—could extend the bear phase even as on-chain metrics offer a more nuanced view of drawdown depth.
Seasonality, on-chain signals, and what to watch next
Seasonality has long been cited as a potential internal driver of Bitcoin’s price path. Timothy Peterson, a network economist and commentator, highlighted a pattern in which April historically functions as a turning point during bearish cycles. A chart he shared on X illustrates April as a potential inflection month in past bear phases, though whether that dynamic repeats remains contingent on broader market conditions.
March’s monthly close added a modest, 1.8% gain for BTC/USD, effectively ending a five-month losing streak. The move, while not dramatic, keeps the door open for a spring rebound, provided macro momentum aligns with technical and on-chain signals.
On-chain context adds another layer to the discussion. Glassnode’s analysis shows that the current bear market’s depth—though material—is not yet aligned with the most severe declines observed historically. The all-time high of roughly 126,200 in October 2025 has given way to a drawdown of about 52%, a figure that suggests the market could behave differently than in previous cycles if macro conditions stay supportive or liquidity improves.
For investors, this combination of on-chain resilience and mixed macro signals creates a nuanced backdrop. A Bitcoin trading environment shaped by a less severe drawdown yet ongoing external headwinds could translate into a more protracted consolidation rather than a sharp capitulation or a swift breakout. Observers will be watching for signs of sustained demand, improving liquidity in risk markets, and any shifts in policy that could alter the risk-reward calculus for crypto exposure.
As the calendar turns to April, market participants will parse a mix of seasonality whispers, data-driven cautions, and evolving macro narratives. The next several weeks could prove decisive in whether BTC resumes a broader uptrend, remains range-bound, or teeters on renewed volatility as external conditions shift.
This article synthesizes observations from multiple sources, including Cathie Wood’s CNBC discussion, on-chain data from Glassnode, and commentary from market analysts such as Tony Severino and Mike McGlone, as well as prior coverage from Cointelegraph on price floors and seasonality in Bitcoin’s bear markets. Investors should treat forecasts as probabilistic scenarios rather than certainties and remain mindful of the evolving macro landscape that continues to shape crypto markets.
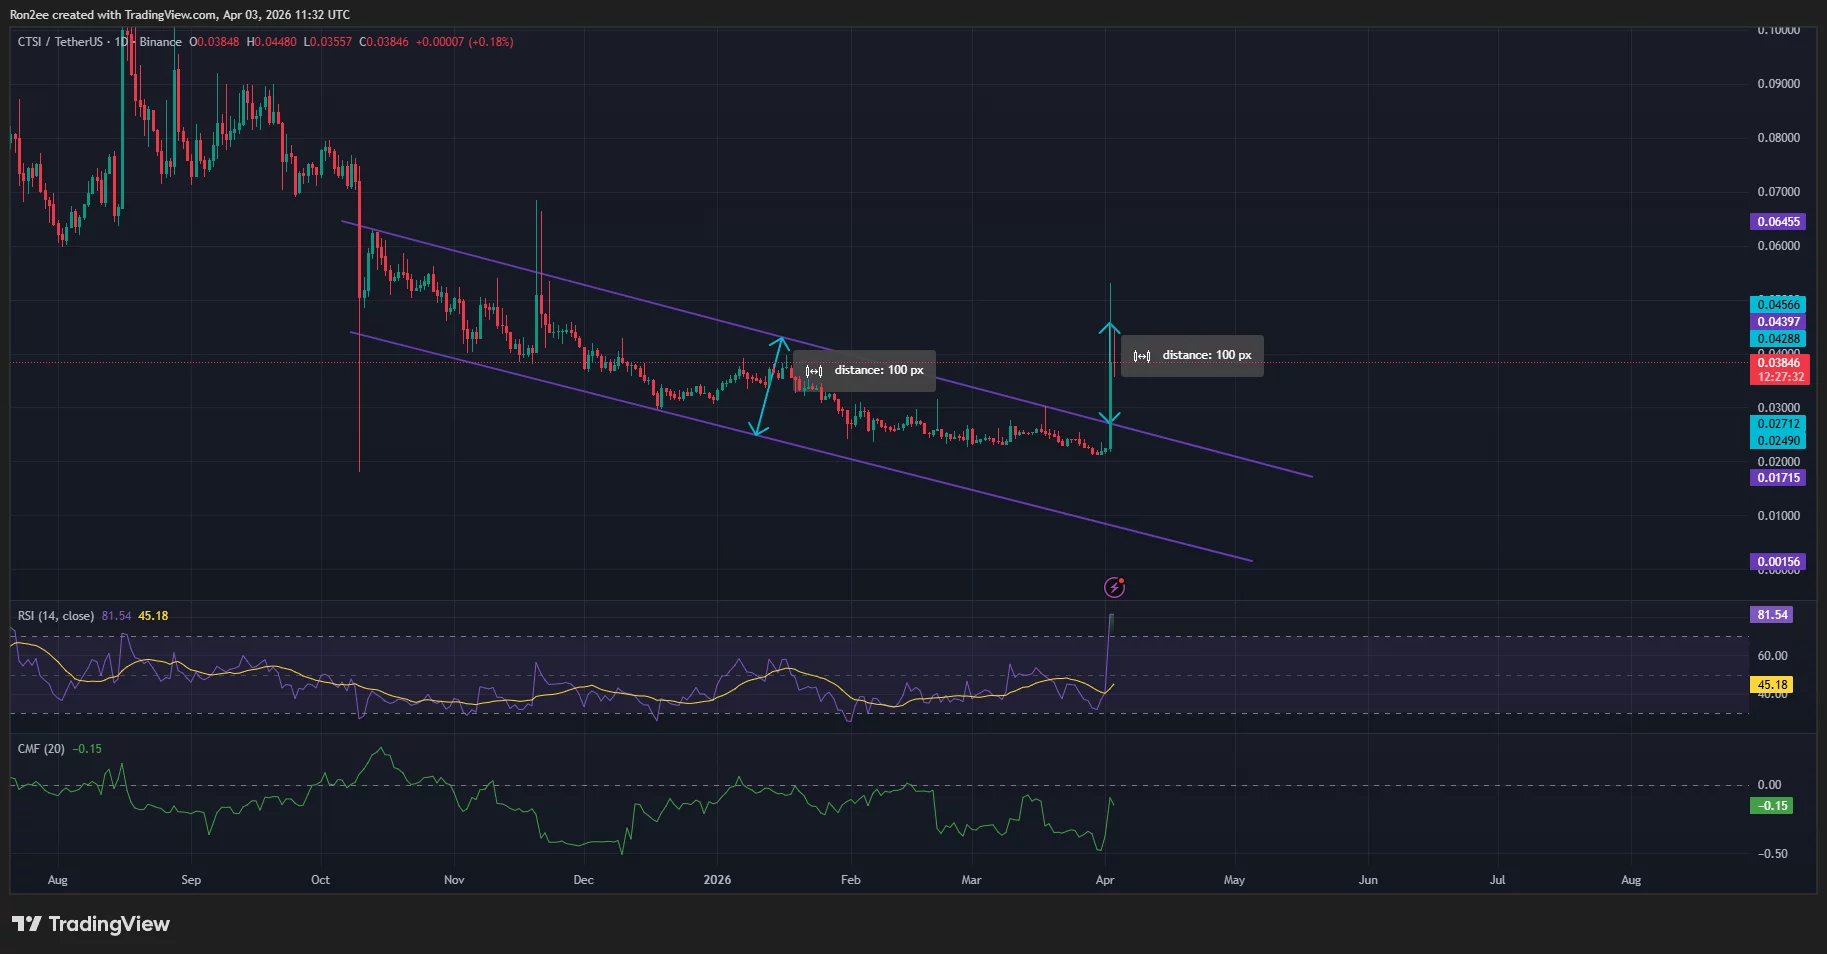
Cartesi token soared over 100% to a 3-month high of $0.049 on Friday. Will the Layer 2 token edge higher over the coming sessions, or will it succumb to profit-taking?
Summary
- Cartesi price surged over 100% to a three-month high amid a sharp rise in trading volume and a short squeeze.
- The rally was driven by progress toward L2BEAT Stage 2 status and growing developer activity around Cartesi Machine deployments.
- Technical indicators show overbought conditions and profit-taking signals, with CTSI price at risk of a pullback toward $0.030 support.
According to data from crypto.news, Cartesi (CTSI) price rallied nearly 110% to $0.049 on Friday, reaching its highest level since November 2022.
The rally came in a high-volume trading environment. In the past 24 hours, the daily trading volume of Cartesi rose 1,260%, suggesting a sharp rise in demand from traders that likely buoyed the token toward its highs today.
There are three main reasons why Cartesi price broke out today.
First, Cartesi’s Permissionless Refereed Tournament fraud-proof system is reportedly nearing the Stage 2 classification by L2BEAT. This milestone would rank it among the most secure and decentralized Layer 2 scaling solutions, setting it apart from competitors that still rely on permissioned validators.
Second, the project’s recent initiative to ship high-throughput applications reached critical implementation deadlines in April. Tangible developer interest in the Cartesi Machine, which allows decentralized apps to run on Linux, is finally translating from theoretical potential into live deployments.
Third, after months of trading in a narrow range of $0.02 to $0.025, the sudden break above long-term resistance triggered a volatility spike. This caused a short squeeze, forcing bearish traders to buy back their positions and further fueling the massive gains seen today.
On the daily chart, Cartesi price has broken out of a multi-month descending parallel channel pattern, a sign that bulls have finally gained control of the market. It has already attained the target level from the breakout, suggesting there could be some selloff on the horizon.

Such selloff risks also come as the relative strength index has crossed the overbought threshold. Crypto rallies often face some pullback when this metric hits an overbought state.
Additionally, the Chaikin Money Flow index showed a negative reading, a sign that investors have started to rotate capital or take profits at these higher levels.
Hence, the Cartesi token could likely retest its immediate support of $0.030 before its next leg higher.
Disclosure: This article does not represent investment advice. The content and materials featured on this page are for educational purposes only.
Bitcoin (BTC) is “done” with drawdowns of 85% or more from all-time highs, says ARK Invest CEO, Cathie Wood.
Key points:
-
Bitcoin will not see another correction of 85% or more versus its latest all-time high, Cathie Wood argues.
-
A new prediction sees $34,000 becoming the next BTC price bottom.
-
Bitcoin bear-market seasonality hints that a reversal could come this month.
Wood on BTC price: No more 85% “collapses”
In an interview with CNBC’s Squawk Box segment on April 1, Wood stayed calm about double-digit BTC price losses.
“Believe it or not, in the Bitcoin community, down 50% — if that’s as far as it goes — they’ll consider that a real victory,” she said.
“Because you’re right; the 85-95% collapses associated with a very new technology — that’s done. This is a proven technology, it’s a proven monetary system and it’s a new asset class.”
Wood, a longtime Bitcoin bull, was speaking as Bitcoin circled its old $69,000 all-time highs from 2021.
Those preceded a year-long bear market in which BTC/USD lost nearly 80% before bottoming at $15,600. That marked the latest such correction, with bear markets typically bringing losses around the 80% mark.
Data from onchain analytics platform Glassnode shows that the current bear market has yet to match historical patterns with maximum downside versus Bitcoin’s $126,200 record from October 2025 at 52%.

Responding to Wood, analyst Tony Severino predicted that 2026 would bring a price bottom equal to a 72% drawdown.
“Correct, -72% max drawdown next =$34,000,” he wrote on X.
That figure exceeds commonly held predictions by traders for where Bitcoin’s next generational floor will be. As Cointelegraph reported, consensus favors the area between $40,000 and $50,000.
This week, however, Bloomberg Intelligence analyst Mike McGlone warned that price may already be trending toward seven-year lows.
Bitcoin historically rebounds in April
Continuing the bear-market comparison, data from network economist Timothy Peterson revealed that April could mark some form of inflection point for price.
Related: Bitcoin risks new lows as US dollar targets highest level since April 2025
A chart uploaded to X this week shows April typically being a recovery month during bearish phases.

The March monthly close, meanwhile, ended a five-month losing streak for BTC/USD with modest gains of 1.8%.
This article is produced in accordance with Cointelegraph’s Editorial Policy and is intended for informational purposes only. It does not constitute investment advice or recommendations. All investments and trades carry risk; readers are encouraged to conduct independent research before making any decisions. Cointelegraph makes no guarantees regarding the accuracy or completeness of the information presented, including forward-looking statements, and will not be liable for any loss or damage arising from reliance on this content.
Crypto World
AccuQuant launches automated trading of Ethereum contracts, enabling users to earn $7k a day through swing trading


Disclosure: This article does not represent investment advice. The content and materials featured on this page are for educational purposes only.
Ethereum drops below key support as traders turn to automated systems like AccuQuant for intraday strategies.
Summary
- Ethereum drops below key support as bearish momentum builds, while traders watch resistance near 2200 for reversal signals
- AccuQuant launches automated Ethereum trading system targeting intraday gains amid heightened market volatility
- Automated crypto strategies gain traction as traders seek emotion-free execution and consistent small-profit accumulation
Ethereum experienced a sharp drop yesterday, with the price breaking below support near the daily moving average. The MACD bearish momentum intensified again, and other technical indicators remained relatively flat.
If the price rebound fails to break through the previous high near 2200, a further pullback could potentially trigger a fifth wave retracement. In such volatile markets, relying solely on manual judgment is often susceptible to emotional biases and makes it difficult to capture market rhythms in a timely manner. To address this pain point, AccuQuant launched a fully automated Ethereum contract trading system, enabling users to earn $7,000 per day through intraday trading.
What is AI automated trading?
AI cryptocurrency automated trading uses algorithms and data models to replace manual market analysis. It continuously monitors the cryptocurrency market 24 hours a day, accurately identifies trading opportunities, automatically makes long and short trading decisions, and executes buy and sell operations. It is an intelligent trading system that operates around the clock, delivering high efficiency without emotional interference.
How to start AI-powered fully automated trading?
1. Register now and claim a $20 welcome bonus.
2. Choose a suitable strategy and start automated trading.
3. Withdraw profits or continue trading.
- Beginner Experience: Amount: $100 | Period: 2 days | Daily Return: $3 | Return at Maturity: $100 + $6
- Starter: Amount: $500 | Period: 5 days | Daily Return: $7 | Return at Maturity: $500 + $35
- Advanced: Amount: $3,000 | Period: 15 days | Daily Return: $45.3 | Return at Maturity: $3,000 + $679.5
- Premium: Amount: $5,000 | Period: 20 days | Daily Return: $78.50 | Return at Maturity: $5,000 + $1,570
- Pro: Amount: $10,000 | Period: 25 days | Daily Return: $162 | Return at Maturity: $10,000 + $4,050
- Expert: Amount: $30,000 | Period: 30 days | Daily Return: $516 Maturity Payout: $30,000 + $15,480
- Elite: Amount: $100,000 | Lifetime: 42 days | Daily Payout: $2,000 Maturity Payout: $100,000 + $84,000
(Click here to see more automated trading strategies)
Case study: How to achieve a daily profit of $7,000
An AccuQuant user, after enabling an automated Bitcoin trading strategy, saw the system complete multiple trades throughout the day.
Given the day’s highly volatile market, the strategy achieved a cumulative profit of approximately $7,000 by consistently capturing small fluctuations.
The key was not in a single large profit, but rather in:
- High-frequency, small-amount profit accumulation
- Strict adherence to strategy discipline
- Avoid emotional trading
- Continuously participate in market fluctuations
- Sign Up and Receive Rewards, Easily Start Trading
New users receive a $20 reward upon registration and can earn an additional $0.50 daily upon login. Experience automated trading with zero barriers to entry.
- No Need to Monitor the Market, the System Works for You 24/7
Say goodbye to staying up all night watching market data. The AI system runs automatically 24/7, avoiding emotional interference and giving you back your time.
- Simple and Easy to Use, Even Beginners Can Quickly Get Started
The interface is intuitive and clear, requiring no complicated operations. Whether someone is a beginner or a professional trader, they can easily use it.
- Earn Money Through Referrals, Multiple Ways to Reward
Join the affiliate program and earn up to 3% + 1.5% referral rewards, diversifying income streams.
- Transparent Fees, No Hidden Costs
No extra transaction fees or management fees. All fees are clearly visible, making every profit safer.
- Multi-currency support, flexible and convenient deposits and withdrawals
Supports deposits and withdrawals of various mainstream cryptocurrencies, including:
BTC, ETH, DOGE, SOL, XRP, USDC, LTC, and USDT (TRC20/ERC20), meeting the needs of different users.
In the volatile cryptocurrency market, where volatility equals opportunity, the key is not predicting prices but rather how to efficiently participate in the volatility itself.
AccuQuant empowers users to participate more systematically in intraday cryptocurrency market movements through automated and quantitative strategies.
For more information, visit the official website.
Media contact: [email protected]
Disclosure: This content is provided by a third party. Neither crypto.news nor the author of this article endorses any product mentioned on this page. Users should conduct their own research before taking any action related to the company.

Solana bulls defend $70, can SOL price recover as a falling wedge breakout nears?

Test Your Knowledge With the Collider TV Quiz — April 3, 2026

Biggest non-draft NFL questions in April: George Pickens contract, Aaron Rodgers decision


-

 NewsBeat7 days ago
The Story hosts event on Durham’s historic registers
-

 NewsBeat18 hours ago
Steven Gerrard disagrees with Gary Neville over ‘shock’ Chelsea and Arsenal claim | Football
-

 Sports7 days ago
Sweet Sixteen Game Thread: Tide vs Michigan
-
Entertainment4 days ago
Fans slam 'heartbreaking' Barbie Dream Fest convention debacle with 'cardboard cutout' experience
-

 Crypto World2 days ago
Gold Price Prediction: Worst Month in 17 Years fo Save Haven Rock
-

 Business13 hours ago
No Jackpot Winner and $194 Million Prize Rolls Over
-
 Entertainment6 days ago
Lana Del Rey Celebrates Her Husband’s 51st Birthday In New Post
-

 Tech4 days ago
The Pixel 10a doesn’t have a camera bump, and it’s great
-
Crypto World3 days ago
Dems press CFTC, ethics board on prediction-market insider trades
-

 Sports3 days ago
Tallest college basketball player ever, standing at 7-foot-9, entering transfer portal
-

 Tech3 days ago
EE TV is using AI to help you find something to watch
-

 Fashion5 days ago
Amazon Sundays: Soft Spring Layers
-

 Tech4 days ago
Avatar Legends: The Fighting Game comes out in July and it looks pretty slick
-

 Business1 day ago
Login and Checkout Issues Spark Merchant Frustration
-

 Fashion6 days ago
When Evening Dressing Gets Colorful for Spring
-

 Tech3 days ago
How to back up your iPhone & iPad to your Mac before something goes wrong
-

 Tech5 days ago
Elon Musk’s last co-founder reportedly leaves xAI
-

 Tech4 days ago
Apple will hide your email address from apps and websites, but not cops
-

 Crypto World4 days ago
U.S. rule change may open trillions in 401(k) funds to crypto
-

 Politics4 days ago
Should Trump Be Scared Strait?
You must be logged in to post a comment Login