
Crypto World
Whales Coming to Rescue ADA?
Cardano has shown early signs of stabilization after weeks of pressure. The ADA price is attempting a bounce from recent lows. Market data suggests the recovery is being supported by two key investor groups.
Large holders and long-term investors appear to be stepping in. Their activity is shaping short-term sentiment around the altcoin. As volatility persists across the crypto market, these cohorts may play a decisive role in ADA’s next move.
Sponsored
Sponsored
Cardano Holders Are Seemingly Bullish
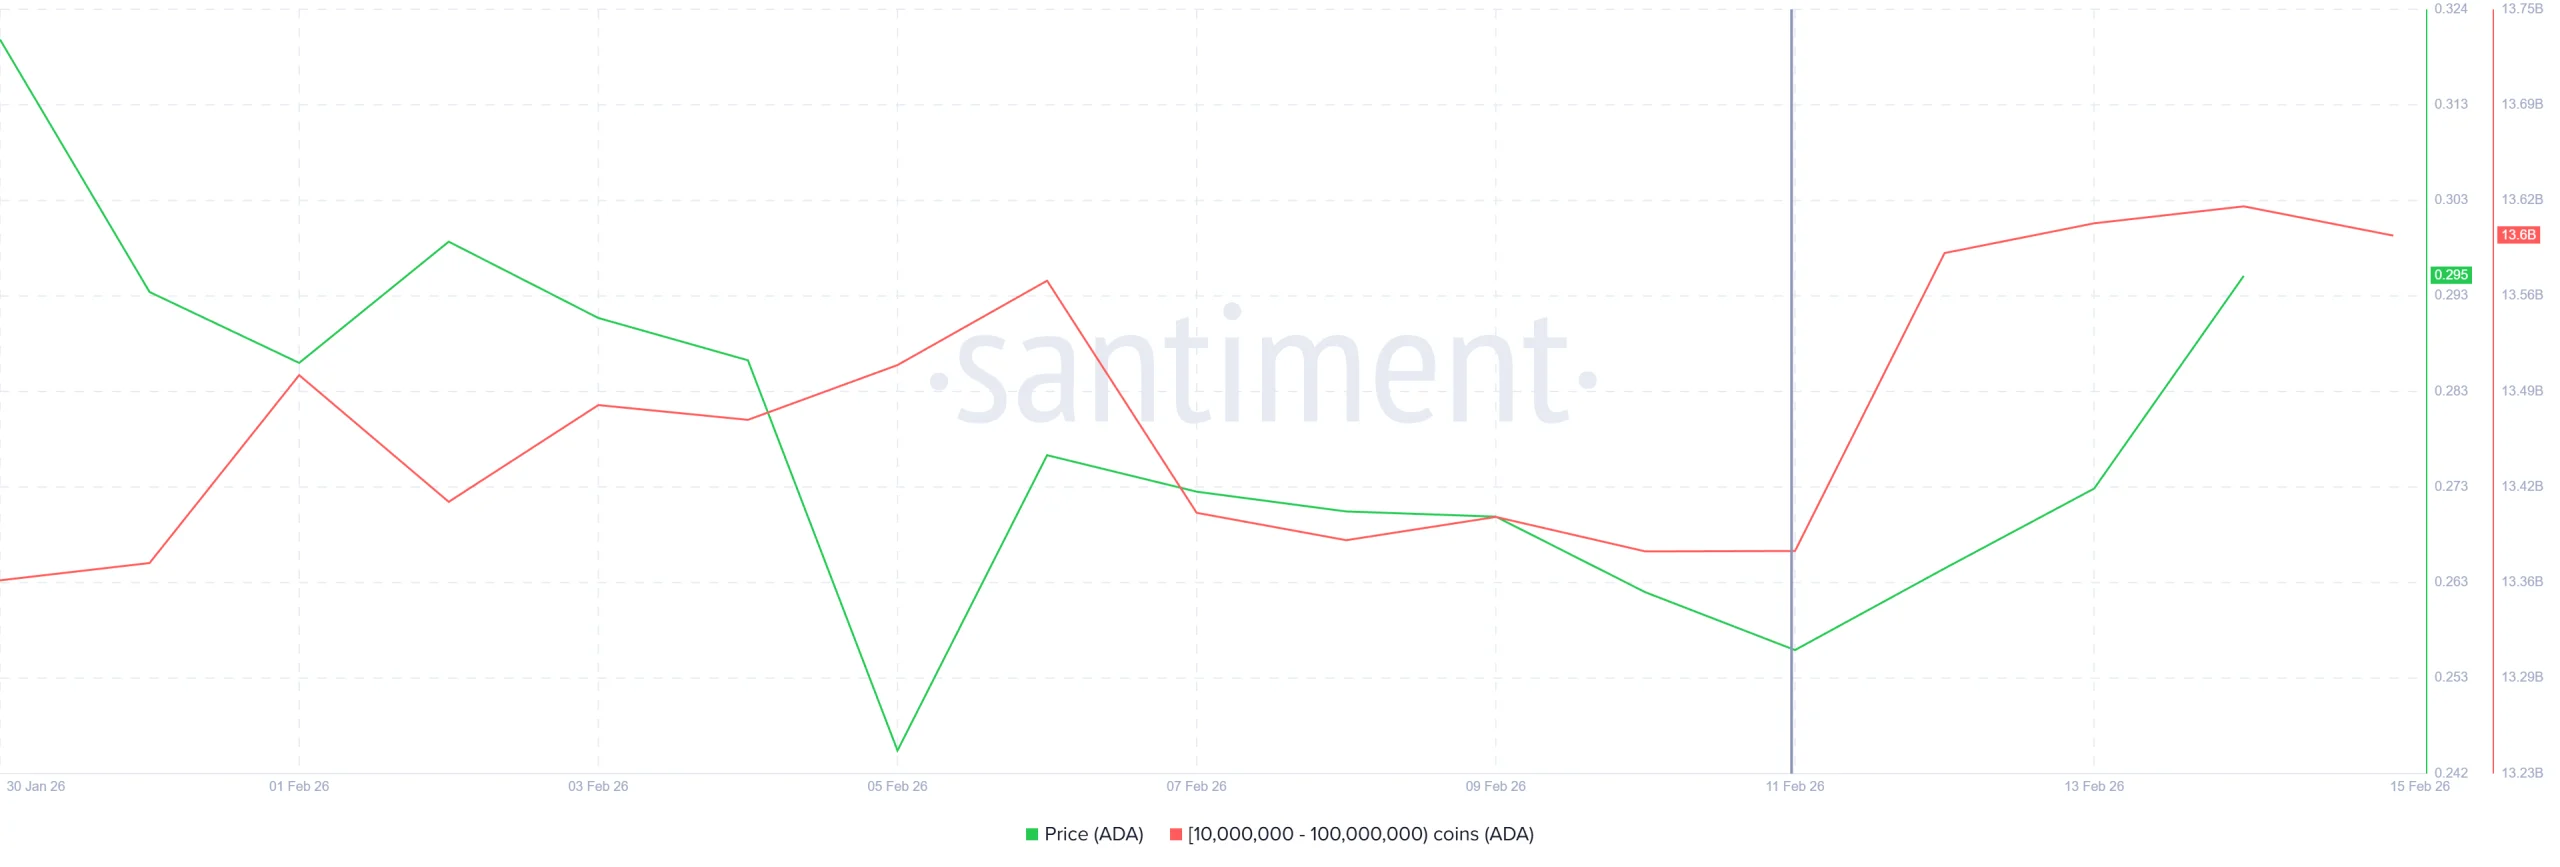
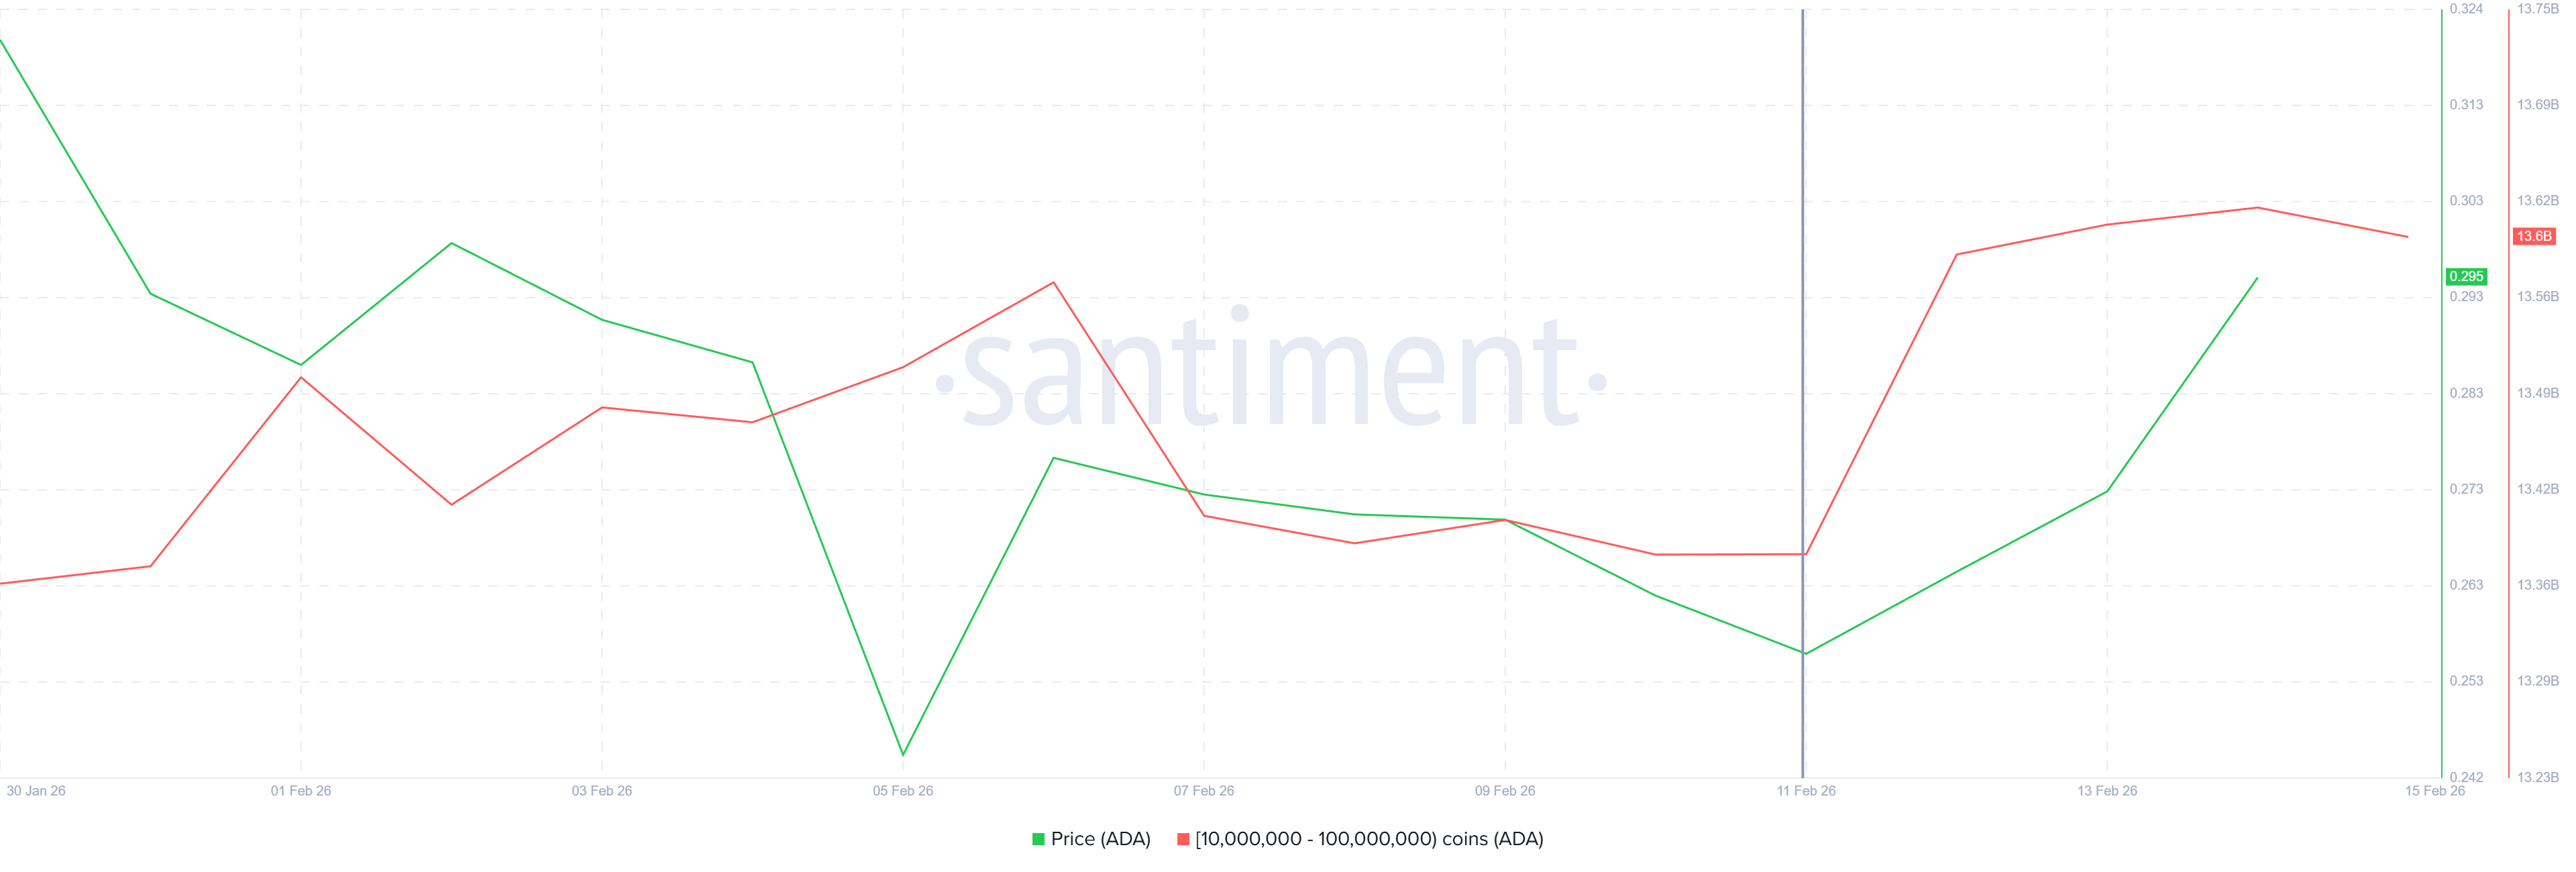
On-chain data indicates that Cardano whales have been consistently supportive. Addresses holding between 10 million and 100 million ADA have accumulated heavily in recent days. These wallets added more than 220 million ADA, valued at over $61 million at the time of writing.
Such accumulation during price weakness often reflects strategic positioning. Whales likely took advantage of discounted prices. Their buying signals conviction in ADA’s recovery potential.
Large-scale accumulation can also reduce circulating supply, which may support price stability in the near term.
Want more token insights like this? Sign up for Editor Harsh Notariya’s Daily Crypto Newsletter here.
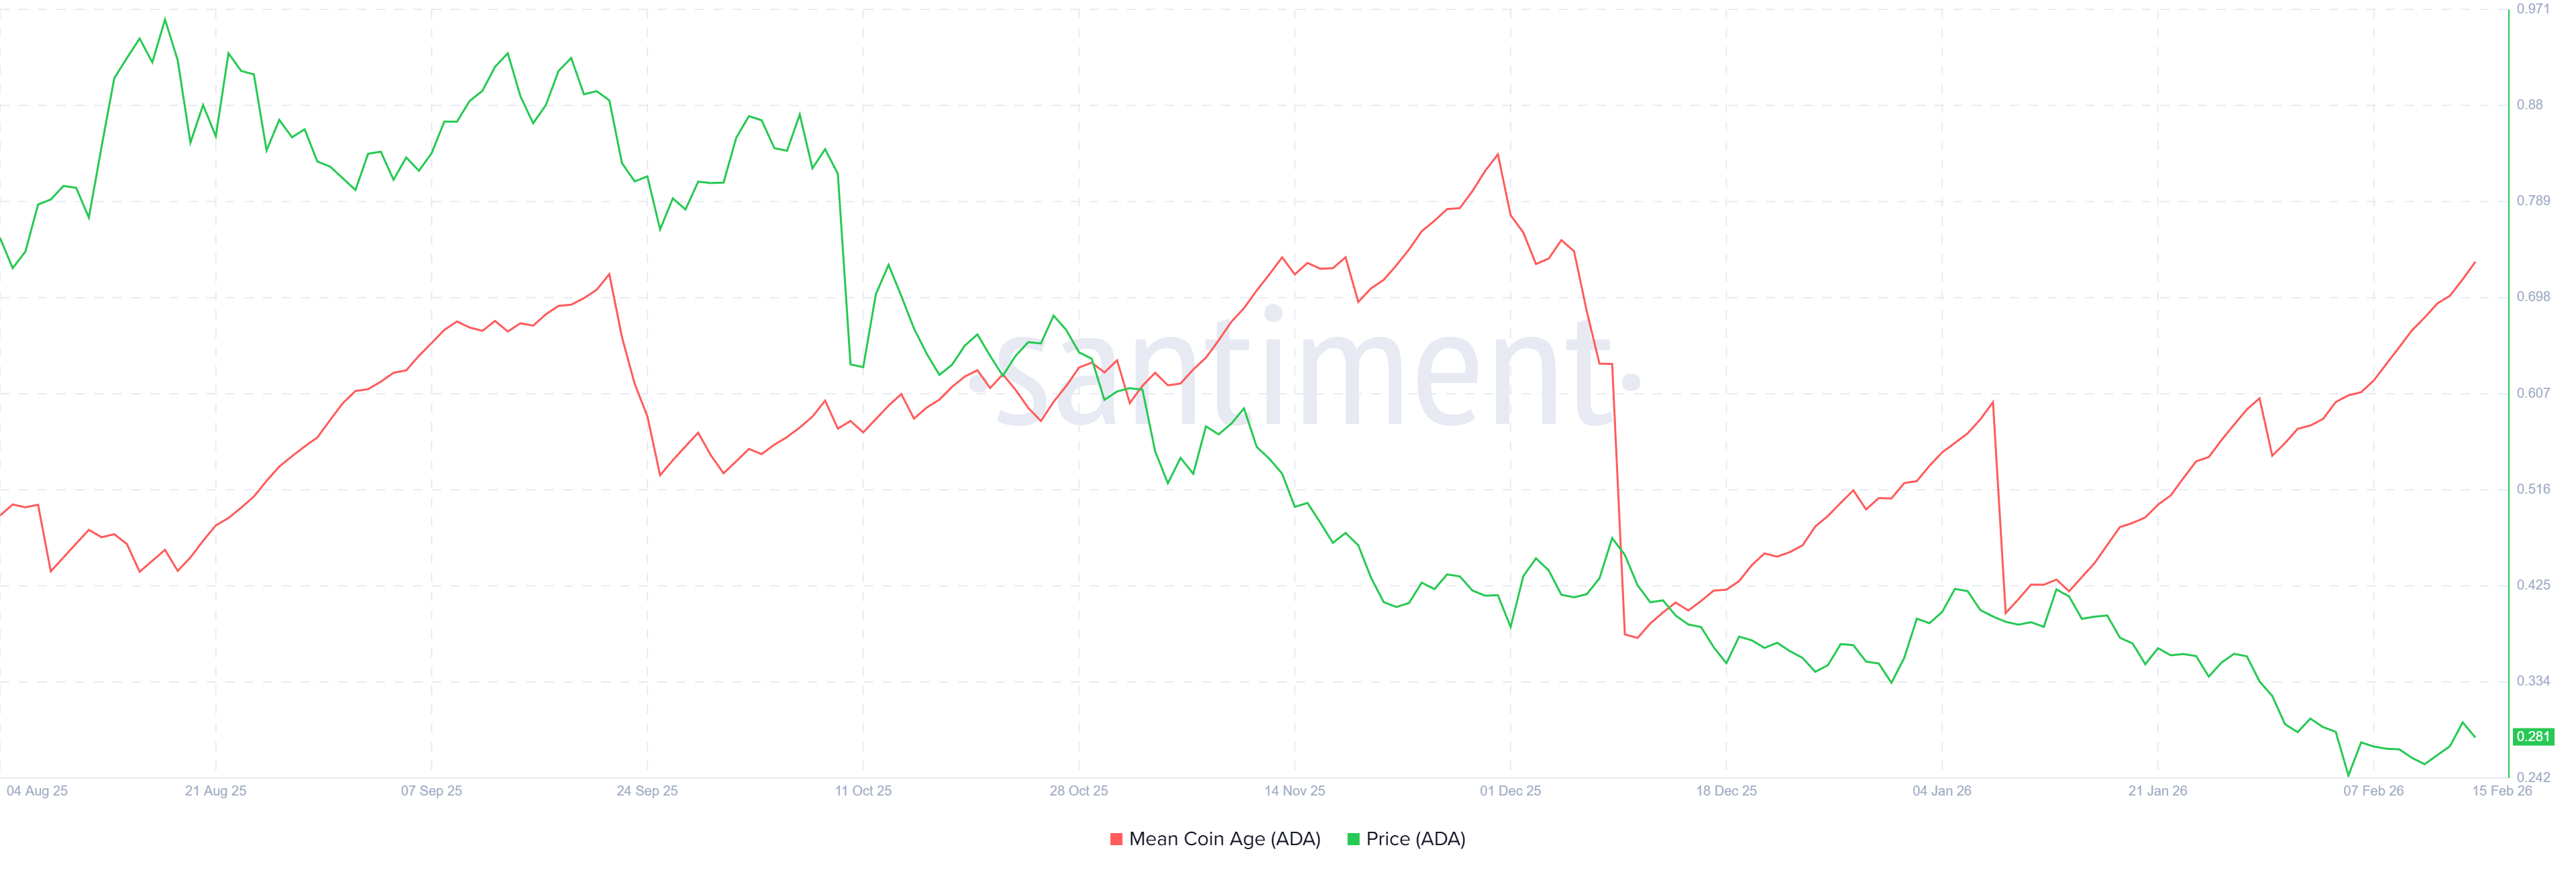
Beyond whale activity, long-term holders are reinforcing confidence. The Mean Coin Age metric, which tracks the average age of circulating coins, has been steadily increasing. This indicator reflects whether older coins are moving or remaining dormant.
During bear markets, a decline in Mean Coin Age often signals transactions and potential selling. However, the current rise places the metric at a three-month high.
Sponsored
Sponsored
This suggests long-term holders are opting to HODL rather than liquidate positions. Sustained dormancy typically indicates expectations of future ADA price appreciation.
ADA Price Breach On The Cards
Cardano price is trading at $0.278 at the time of writing. The altcoin is attempting to secure the $0.271 level, which aligns with the 23.6% Fibonacci Retracement. Holding this support would strengthen the bullish structure. A confirmed rebound could open the path toward $0.303.
Whale accumulation combined with long-term holder conviction may inject needed stability. If buying pressure continues, ADA could extend gains beyond $0.303.
The next resistance stands near $0.354. A decisive move above that zone could push Cardano toward $0.391, reinforcing recovery momentum.
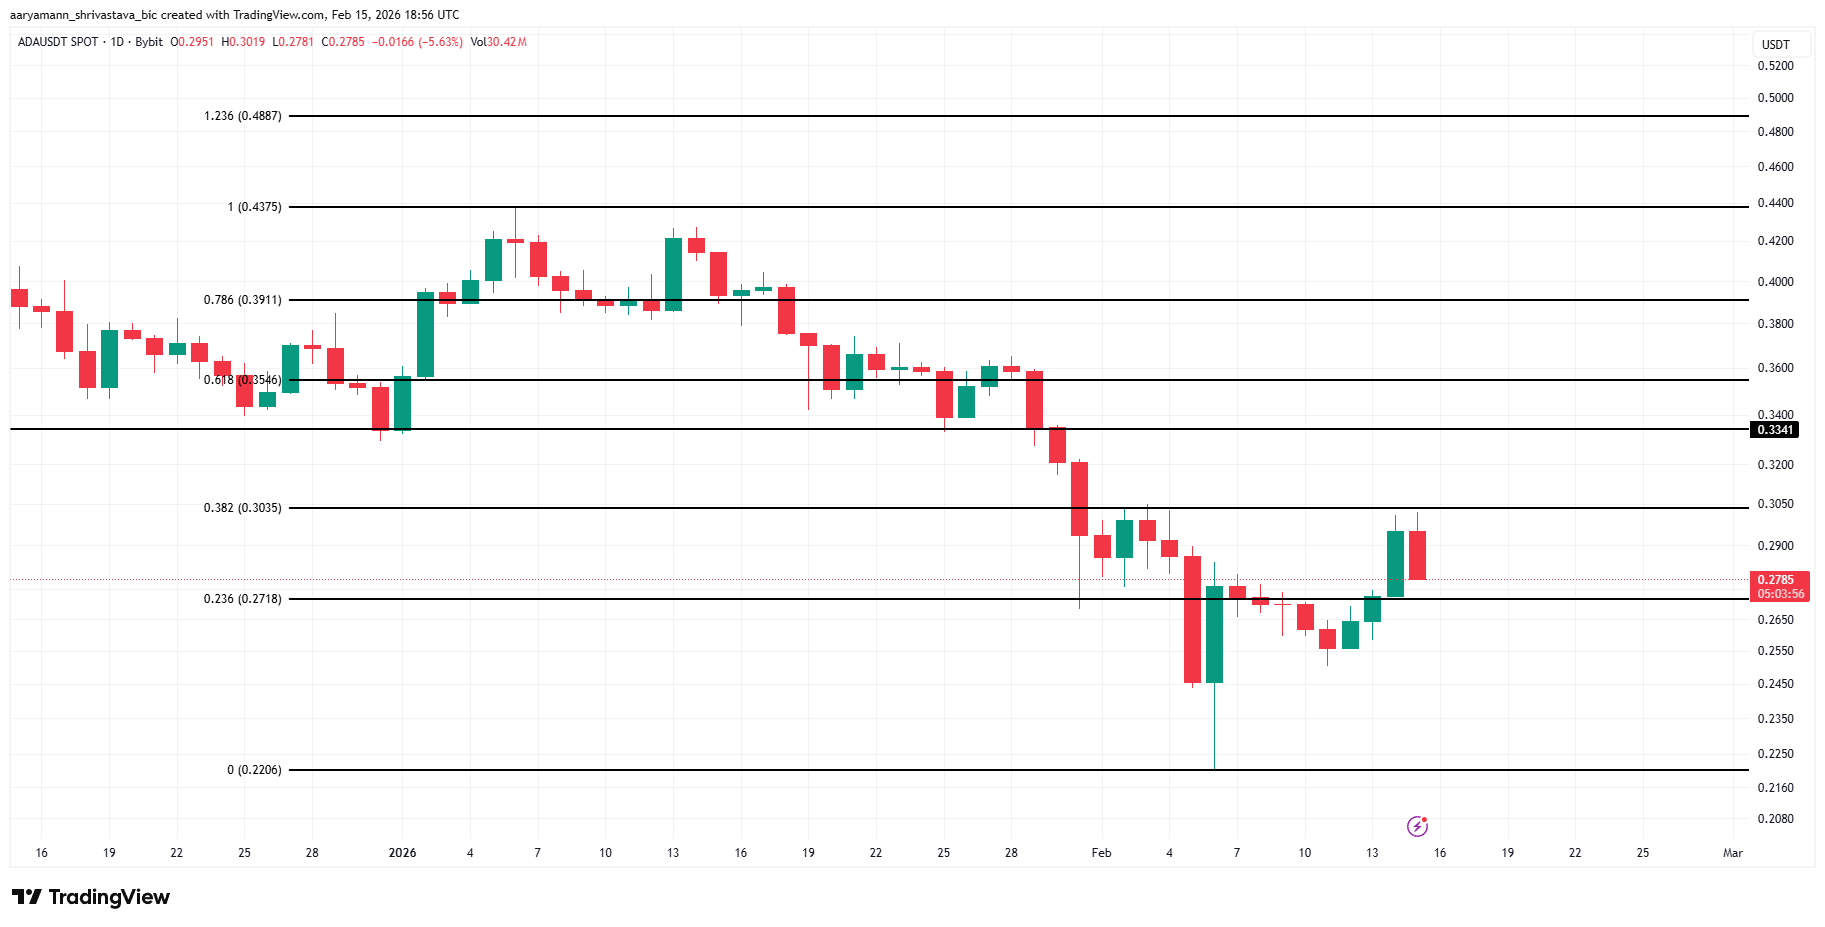
However, risks remain in volatile market conditions. If ADA fails to breach $0.303, sellers may regain control. Renewed pressure could force the price below the $0.271 support again.
A breakdown would likely expose $0.245 as the next downside target, invalidating the current bullish outlook.


Blockchain investigator ZachXBT has publicly accused Circle of failing to freeze stolen USDC as it moved through the company’s own cross-chain infrastructure during the $285 million Drift Protocol exploit on April 1, 2026 — raising pointed questions about when and why the stablecoin issuer chooses to exercise its freeze authority.
Summary
- The Drift Protocol hack on April 1 is the largest DeFi exploit of 2026, draining over $285 million from the Solana-based perpetual futures exchange
- The attacker bridged approximately $232 million in USDC from Solana to Ethereum via Circle’s CCTP across more than 100 transactions over six consecutive hours with no action from Circle
- ZachXBT’s broader filing lists 15 cases totaling over $420 million in alleged Circle compliance failures since 2022
The April 1 attack on Drift, a Solana-based decentralized perpetuals exchange, was flagged by security firm PeckShield. Using a manipulated oracle and compromised admin key, the attacker drained Drift’s main vault in approximately 12 minutes, according to blockchain analytics firm Arkham. Drift’s total value locked fell from roughly $550 million to under $300 million within an hour. The DRIFT token dropped more than 40%. Over ten additional Solana protocols reported disruption.
After converting most of the stolen assets to USDC, the attacker used Circle’s Cross-Chain Transfer Protocol (CCTP) to bridge approximately $232 million from Solana to Ethereum across more than 100 transactions — over six consecutive hours during U.S. business hours.
“Circle was asleep while many millions of USDC were swapped via CCTP from Solana to Ethereum for hours from the 9-figure Drift hack during US hours,” ZachXBT wrote on X.
The criticism cuts sharper given the timing. Just nine days earlier, on March 23, Circle froze USDC across 16 unrelated business hot wallets — including one belonging to the DFINITY Foundation — as part of a sealed U.S. civil case. ZachXBT called that freeze “potentially the single most incompetent” action he had witnessed in five years of on-chain investigations.
The contrast — aggressive action against legitimate businesses, inaction during a confirmed nine-figure exploit transiting Circle’s own bridge — has reignited debate over how centralized stablecoin governance actually works in practice. Security researcher Specter noted the attacker deliberately avoided converting funds to Tether’s USDT, appearing confident Circle would not intervene.
Circle’s Defense
Circle responded: “Circle is a regulated company that complies with sanctions, law enforcement orders, and court-mandated requirements. We freeze assets when legally required, consistent with the rule of law and with strong protections for user rights and privacy.”
Salman Banei, general counsel at Plume, warned that freezing assets without authorization could expose Circle to legal liability. Ben Levit, CEO of stablecoin ratings agency Bluechip, described the situation as “a gray area,” noting this was an oracle exploit rather than a clean hack. Blockchain analytics firm Elliptic identified multiple indicators suggesting North Korean hackers were responsible for the Drift exploit.
As crypto hack losses had moderated significantly in the months preceding this incident, the $285 million Drift hack marks a stark reversal — and the Circle debate it has sparked may have lasting implications for how the broader stablecoin regulatory framework is written, particularly around freeze authority and issuer accountability.


Tether is again in focus after a report said it may delay a planned fundraising round if investors do not support a $500 billion valuation.
Summary
- Tether is seeking investor commitments for a fundraising round at a reported $500 billion valuation.
- The company may delay the raise if investor demand does not meet expectations, reports said.
- Reports also said Tether hired KPMG for its first full audit of USDt financial statements.
The reported timeline and target have added fresh attention to the stablecoin issuer’s growth plans, valuation goals, and audit efforts.
A Friday report said Tether is pushing investors to commit to a fundraising round at a $500 billion valuation within the next two weeks. The report added that the company may postpone the raise if demand does not meet expectations.
The El Salvador-based firm has reportedly been seeking new capital since late 2025. However, some investors have shown caution over the proposed valuation. The reported target would place Tether among the world’s largest financial firms if the raise moves forward on those terms.
The reported $500 billion valuation would place Tether above every US bank except JPMorgan Chase. JPMorgan’s market value stands near $794.55 billion, while Bank of America’s market value is about $352.86 billion, based on figures cited in the report.
Tether’s main product, USDt, remains the largest stablecoin by market value, with a market cap of about $184 billion. The company also offers other products, including Tether Gold and Tether EURt. The fundraising talks show how Tether is trying to expand beyond stablecoins into several other business areas.
In September 2025, Bloomberg reported that Tether was exploring a raise of up to $20 billion. That report said the company was looking at a private placement for about a 3% stake, with Cantor Fitzgerald acting as lead adviser.
Later, Tether chief executive Paolo Ardoino said on X that the company was exploring a raise from a select group of investors to grow across “existing and new business lines.” In February, Ardoino pushed back on claims that Tether had an active plan to raise up to $20 billion, saying earlier figures reflected hypothetical scenarios.
Audit effort adds another layer
At the same time, reports said Tether has hired KPMG for its first full audit of USDt’s financial statements. PwC is helping the company prepare its internal systems for that process.
Tether has long relied on reserve attestations from BDO Italia rather than a full audit. A full audit would examine assets, liabilities, and internal controls across the balance sheet, rather than only providing reserve snapshots. The reported move comes as the company faces close scrutiny over both its valuation plans and financial reporting.


Charles Schwab has confirmed it remains on track to launch direct spot trading for Bitcoin and Ether in the first half of 2026, opening one of the largest pools of investor capital in the world to direct crypto access for the first time.
Summary
- Schwab confirmed a spot Bitcoin and Ether trading launch in H1 2026 through its Charles Schwab Premier Bank unit
- The firm manages nearly $12.2 trillion in client assets across approximately 46 million brokerage accounts and has opened a waitlist for early access
- CEO Rick Wurster first signaled the move in mid-2025 and confirmed a phased Q2 rollout in March 2026 remarks to Barron’s
A Schwab spokesperson confirmed to multiple outlets: “We remain on track to launch our spot crypto offer in the first half of 2026, starting with bitcoin and ether.” The service, branded as “Schwab Crypto,” will be operated through Charles Schwab Premier Bank, SSB — a regulated banking subsidiary.
Clients will trade Bitcoin and Ether directly within their standard brokerage accounts, without a separate wallet or third-party exchange. Schwab will process orders internally. The rollout will be phased: internal employee testing first, followed by invited clients, before full public availability. Early access is currently limited to U.S. residents, excluding New York and Louisiana.
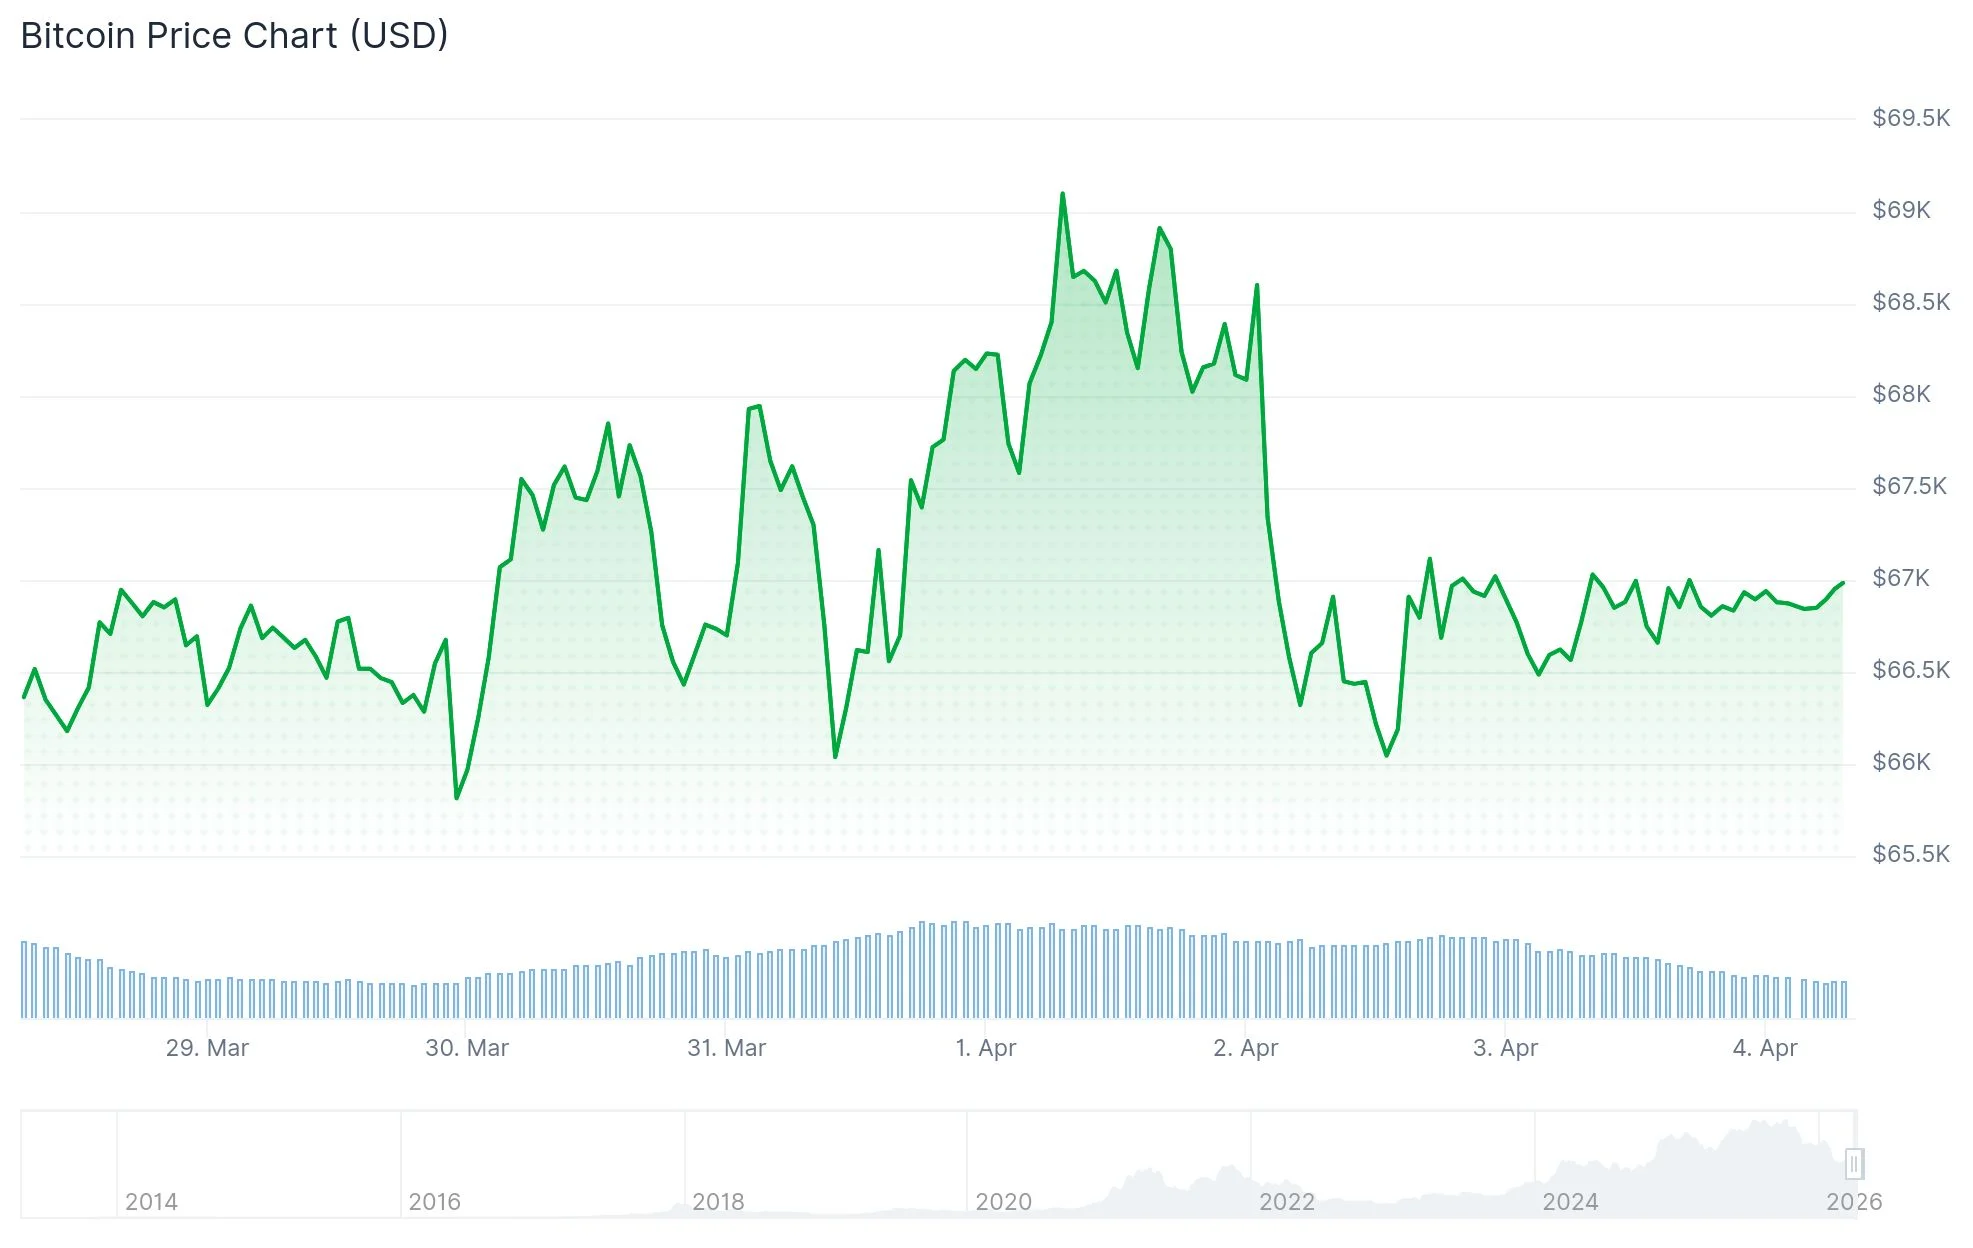
Yahoo Finance reports that Bitcoin was trading near $66,864 at the time of the announcement, down approximately 47% from its all-time high of $126,080. Ether changed hands near $2,052, roughly 59% below its August 2025 peak.
TradFi Moves In
Schwab has been working toward this moment for several years, citing regulatory uncertainty as the primary obstacle. With the Trump administration rolling back SEC accounting restrictions and the Federal Reserve loosening bank crypto guidelines, the path cleared. Schwab reported a 400% increase in traffic to its crypto site in 2025, with 70% coming from non-clients — a signal of untapped demand the firm is now moving to capture.
The competitive implications for the crypto exchange landscape are significant. Analysts have noted that Schwab’s scale could allow it to undercut competitors on fees, potentially reshaping the retail crypto trading market. Morgan Stanley is also preparing a comparable launch through its E*TRADE platform. Schwab has additionally indicated plans to introduce a stablecoin product following the passage of the GENIUS Act.
Market Relevance
The firm already offers cryptocurrency-linked ETFs, Bitcoin futures contracts, and the Schwab Crypto Thematic Index ETF. Spot trading is the next step in a deliberate, regulated build-out. CEO Wurster said the company is “ready to compete in spot Bitcoin and Ethereum trading,” a statement that carries weight given Schwab’s 46 million existing brokerage relationships — a potential distribution advantage that no crypto-native exchange can replicate.

Key Takeaways
- Cybercriminals extracted $285 million from the Drift protocol, transferring $232 million in USDC between blockchains via Circle’s native CCTP system
- On-chain detective ZachXBT criticized Circle for not acting quickly enough to freeze the stolen stablecoin during the breach
- Circle maintains it only freezes digital assets when mandated by legal authorities or law enforcement agencies
- According to ZachXBT, Circle has declined to freeze approximately $420 million in questionable USDC movements spanning 15 incidents since 2022
- Legal professionals caution that freezing funds without proper legal backing could leave Circle vulnerable to lawsuits
The stablecoin issuer Circle is under intense scrutiny following its response to this week’s $285 million theft from the Drift protocol.
The perpetrators initially drained approximately $71 million in USDC tokens directly from Drift’s platform. Following the conversion of most other stolen digital assets into USDC, the attacker utilized Circle’s Cross-Chain Transfer Protocol (CCTP) to relocate roughly $232 million worth of USDC from the Solana blockchain to Ethereum.
This cross-chain movement significantly complicated recovery efforts. It also placed Circle squarely in the crosshairs of industry criticism.
On-chain investigator ZachXBT emerged as a prominent voice challenging Circle’s response. He contended that Circle possessed the technical capability to blacklist addresses and immobilize funds but failed to deploy these measures swiftly during the ongoing attack.
“Why should crypto businesses continue to build on Circle when a project with nine-figure TVL could not get support during a major incident?” he posted on X.
Circle’s Official Response
Circle issued a firm rebuttal to the accusations. A company representative informed CoinDesk that as a regulated entity, Circle exclusively freezes assets when legally mandated through judicial orders or official law enforcement directives.
“We freeze assets when legally required, consistent with the rule of law and with strong protections for user rights and privacy,” the spokesperson said.
Salman Banei, who serves as general counsel for tokenized asset platform Plume, supported Circle’s stance. He emphasized that freezing cryptocurrency without proper legal authorization could subject issuers to significant legal exposure. He advocated for legislators to establish legal protections enabling issuers to respond more rapidly in unambiguous theft scenarios.
Not everyone in the cryptocurrency sector views this incident through a simple lens. Ben Levit, who heads stablecoin evaluation firm Bluechip, characterized the Drift incident as involving market and oracle manipulation rather than a conventional hack, positioning it within a murky legal territory.
“Any action by Circle becomes a judgment call, not just a compliance decision,” Levit said.
ZachXBT Alleges Systemic Pattern
ZachXBT escalated his critique by releasing data suggesting that Circle has declined to freeze or blacklist approximately $420 million in suspicious USDC transactions spanning 15 distinct incidents dating back to 2022.
Within this collection of cases, he alleges Circle refused to freeze $9 million from the GMX exchange breach in July 2025, and that addresses associated with the $200 million Cetus DEX theft only received blacklist treatment after the stolen funds had already been exchanged out of USDC.
He emphasized that the $420 million estimate encompasses only prominent public incidents and that actual losses likely exceed this figure substantially.
Circle had previously investigated “reversible” USDC functionality in September 2025, a mechanism potentially enabling the rollback of transactions in theft situations. The company has historically frozen USDC holdings, notably funds connected to Tornado Cash wallets sanctioned by US authorities in 2022.
Cybersecurity experts tracking blockchain threats have attributed the Drift exploit to hacking groups affiliated with North Korea’s government.

Key Highlights
- Direct spot trading for Bitcoin and Ethereum will debut in H1 2026 at Charles Schwab
- Schwab Crypto accounts will operate through Charles Schwab Premier Bank
- Early access waitlist is currently available ahead of the full public launch
- The brokerage oversees $11.9 trillion across approximately 46 million client accounts
- Schwab-backed EDX Markets is pursuing a national bank charter through the OCC
Charles Schwab is set to introduce direct cryptocurrency trading capabilities, enabling clients to purchase and hold Bitcoin and Ethereum through newly created “Schwab Crypto” accounts. The launch timeline targets the first six months of 2026.
On April 3, 2026, the brokerage giant validated these plans to CoinDesk. An early access waitlist has been activated for interested customers.
Charles Schwab Premier Bank, SSB will handle the service operations. According to CEO Rick Wurster, a select group of clients may receive access during the current quarter, followed by a comprehensive rollout.
Wurster initially revealed the cryptocurrency trading initiative last July. His stated objective was enabling clients to consolidate their crypto holdings with traditional investments like equities and fixed income in a unified view.
The platform currently provides crypto-related investment products, including digital asset ETFs, bitcoin futures contracts, and micro bitcoin futures. Schwab has also introduced the Schwab Crypto Thematic ETF, designed to track companies engaged in the blockchain and digital currency ecosystem.
The forthcoming Schwab Crypto account represents a significant advancement by facilitating direct asset ownership of bitcoin and ether, distinguishing it from indirect exposure through ETFs or derivative instruments.
Traditional Finance Firms Rush Into Digital Assets
Schwab isn’t alone among legacy financial institutions embracing this strategic shift. Morgan Stanley has similarly revealed intentions to provide cryptocurrency trading via its E*TRADE platform, featuring Bitcoin, Ethereum, and Solana.
These developments signal a widespread movement among established financial organizations to integrate direct crypto access for their customer bases. Schwab’s massive scale provides an immediate advantage with its substantial existing clientele.
As of 2025, the firm managed $11.9 trillion in client assets. With approximately 46 million accounts under management, this represents a potentially enormous audience for cryptocurrency adoption.
EDX Markets Pursues National Banking Status
EDX Markets, a cryptocurrency exchange with Schwab backing, has filed a separate application for a national bank charter through the Office of the Comptroller of the Currency.
The platform aims to join Ripple and Coinbase, both recipients of conditional approvals for trust charter requests.
EDX CEO Tony Acuña-Rohter has stated that mainstream crypto growth will be driven by major banking institutions. He views national trust charter status as essential for EDX to effectively partner with these financial entities.
Schwab’s phased implementation strategy begins with internal employee testing, progresses to a limited client pilot program, and culminates in full public availability.
Pricing structures and additional specifications for the Schwab Crypto account remain unannounced. Interested parties can join the waitlist through the company’s website.


Elon Musk is requiring banks, law firms, and auditors competing for roles on SpaceX’s upcoming IPO to purchase subscriptions to Grok, his artificial intelligence chatbot — a mandate the New York Times reported Friday that some Wall Street firms have already agreed to, spending tens of millions of dollars annually.
Summary
- Musk has made Grok subscription purchases a condition of participation in SpaceX’s record-breaking IPO, according to the New York Times citing four people with knowledge of the arrangements
- Some banks have agreed to spend tens of millions of dollars per year on Grok and have begun integrating it into their internal IT systems
- The requirement comes as SpaceX targets a $1.75 trillion valuation and a raise of up to $75 billion for a planned June Nasdaq listing
The demand is not a suggestion. Four people familiar with the confidential discussions confirmed to the Times that Musk insisted on it. The leverage is precisely calibrated: access to advisory and underwriting roles on what could be the largest IPO in financial history.
According to Benzinga, the five active bookrunners — Bank of America, Citigroup, Goldman Sachs, JPMorgan Chase, and Morgan Stanley — are the lead banks managing the deal. International institutions including Royal Bank of Canada, Mizuho Financial Group, and Macquarie Group are also participating, focused on share distribution in their respective markets.
Musk separately asked the banks to advertise on X, though people familiar with the matter said he was considerably less insistent on that point.
SpaceX acquired xAI in an all-stock deal in February 2026, folding the Grok chatbot and the X social network into its corporate structure. xAI was valued at $250 billion at the time of the transaction. Grok currently ranks fourth in the AI chatbot market, behind OpenAI’s ChatGPT, Anthropic’s Claude, and Google’s Gemini.
The subscription mandate effectively turns the IPO process into a forced distribution mechanism for xAI’s commercial product. With 21 banks involved across the deal, the financial institutions committing to subscriptions represent a significant and captive customer base that Musk appears to view as a distribution channel as much as a capital-raising partner.
It is not the only unconventional feature of the offering. Bankers involved in the deal are also reportedly considering waiving the traditional 180-day lock-up period that typically prevents insiders from selling shares immediately after listing — an arrangement that has drawn concern from some market observers about potential conflicts of interest.
Context
SpaceX is targeting a June Nasdaq listing at up to $1.75 trillion, with a raise of up to $75 billion. Despite nearly 23 years of operation, the company reported zero net earnings as of early 2026. IPO proceeds are earmarked for orbital data centers, a lunar base, and crewed Mars missions.
The SpaceX brand has historically been exploited in crypto markets through impersonation scams and copycat token launches, but the Grok subscription clause puts the company squarely in the center of a different kind of market conversation. As major institutions have accelerated capital movements across both traditional and digital asset classes, the SpaceX offering is now emerging as a defining test of how Wall Street adapts to Musk’s increasingly integrated financial, AI, and infrastructure empire.

Key Takeaways
- Binance spot market shows $451 million in net XRP accumulation while futures traders hold -$1.5 billion in bearish bets
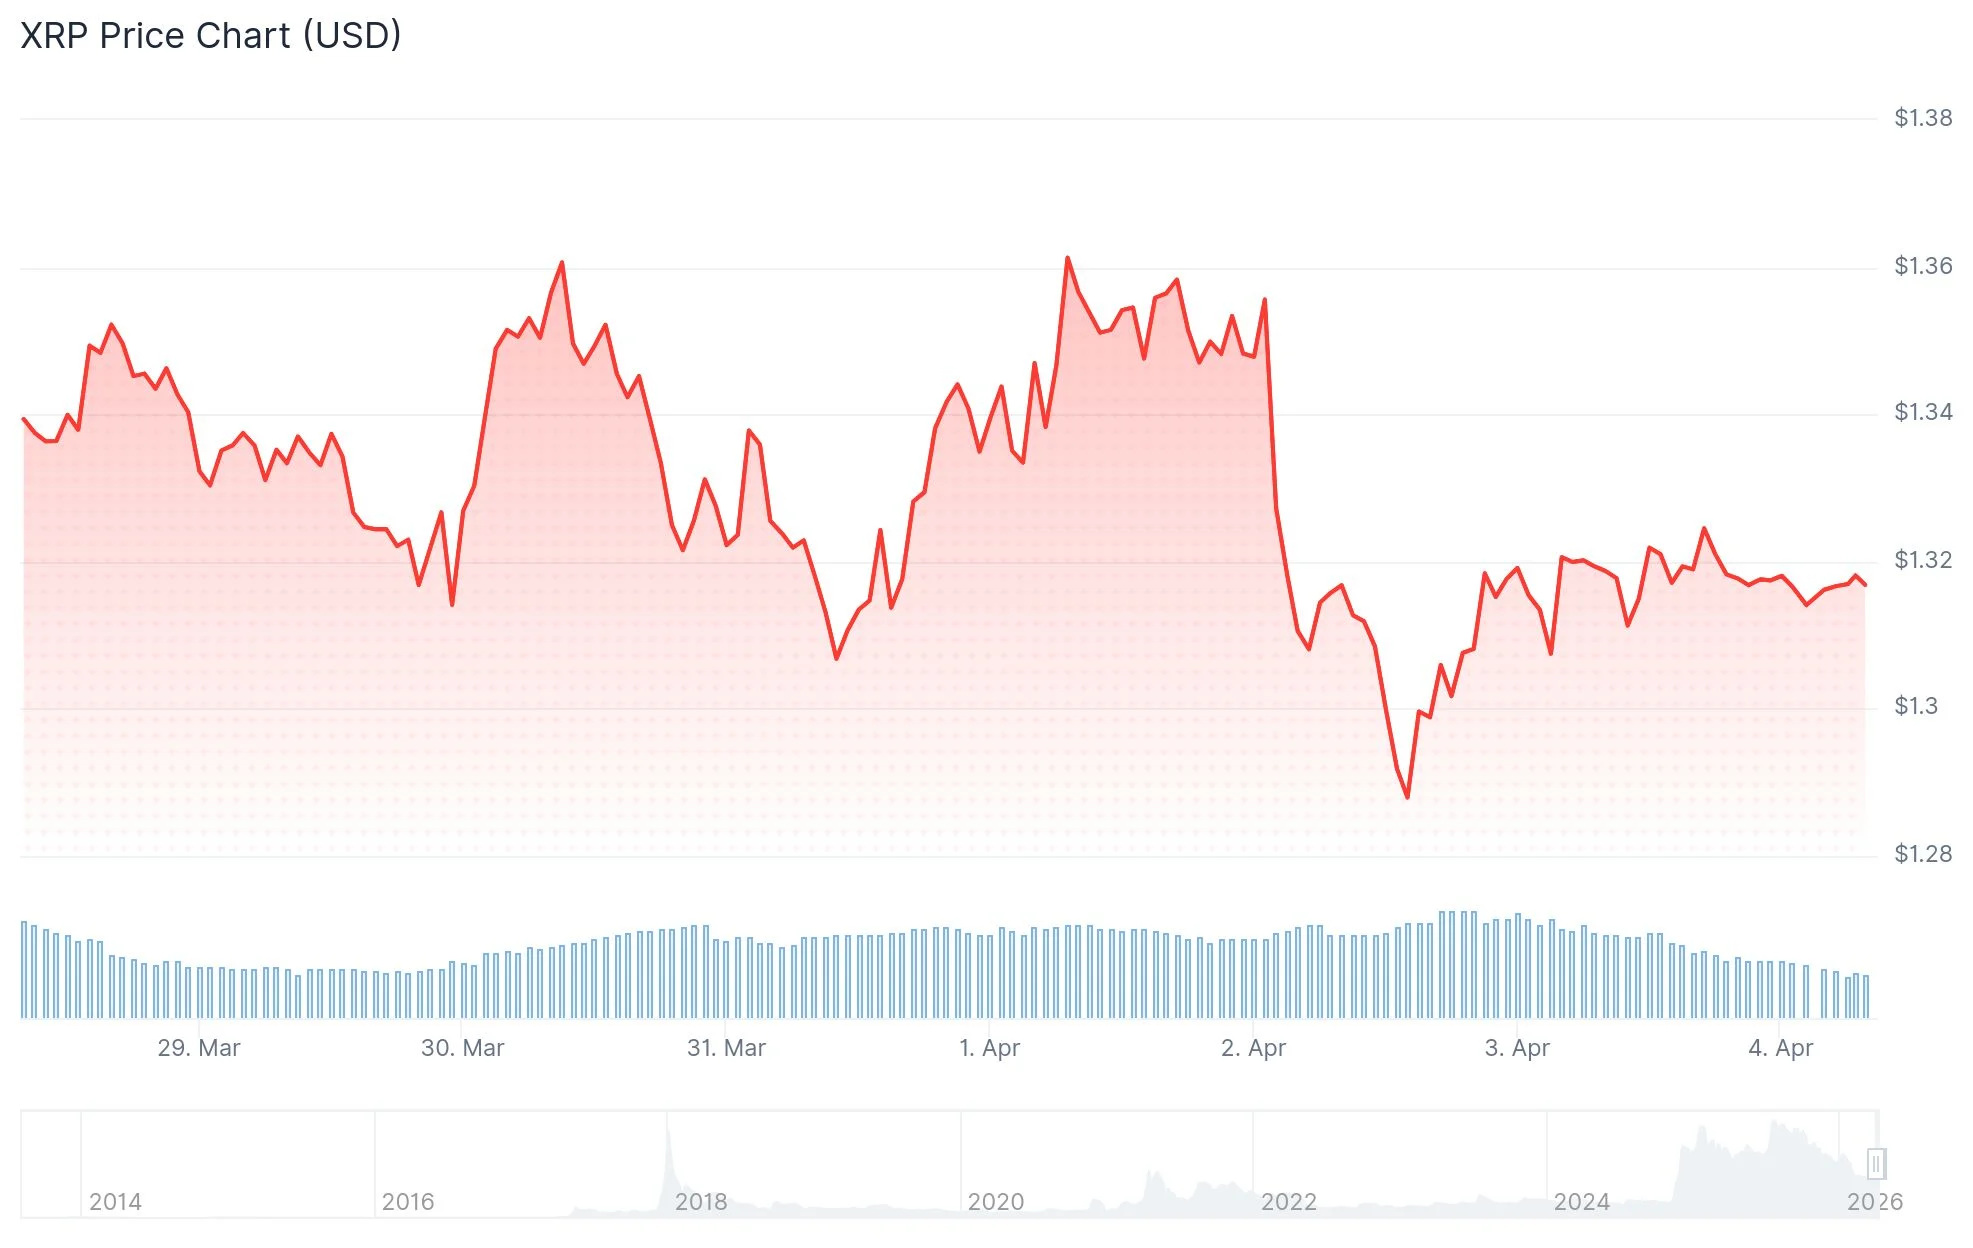
- XRP currently trades near $1.31 after six straight months of red candles dating back to September 2025
- Network usage surged to 4.49 million daily transactions on April 2, with active wallets exceeding 200,000
- A descending wedge formation is tightening, with breakout confirmation requiring a move above $1.47
- March 2026 marked the first month of negative XRP ETF flows since U.S. products debuted in November 2025
XRP finds itself in a fascinating standoff between contrasting market forces. Physical buyers continue accumulating tokens, while derivative traders maintain aggressive bearish positions.
Data from Binance reveals spot Cumulative Volume Delta (CVD) has reached $451 million in positive territory. This metric represents actual capital flowing into physical XRP holdings. Conversely, Binance Perpetual CVD registers approximately -$1.5 billion, indicating substantial leverage-based short exposure. When examining the broader exchange landscape, aggregate CVD approaches -$1 billion in bearish positioning.
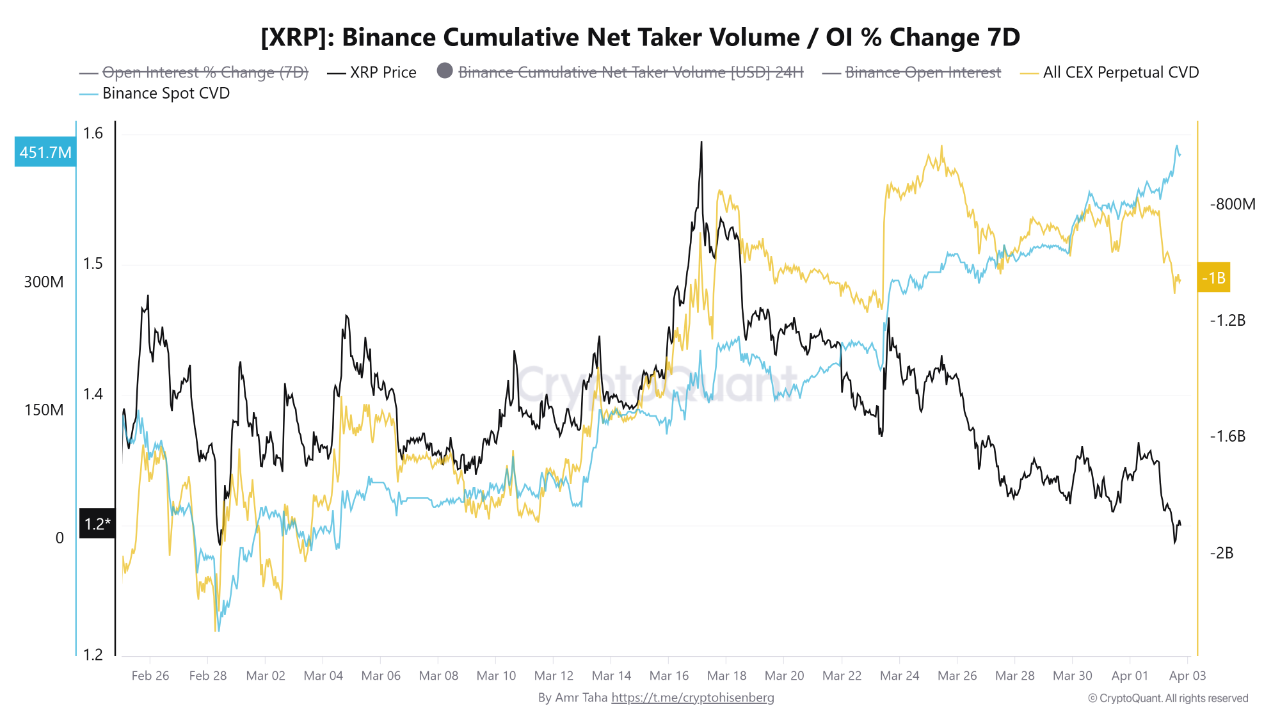
Market analysts identify this configuration as a classic pre-squeeze environment. As spot market participants continue absorbing sell pressure generated by derivatives positions, the available supply for downward price movement diminishes. Once this supply reaches critical depletion levels, short positions transform from strategic advantages into potential vulnerabilities.
As of April 3, XRP exchanges hands at $1.31, registering a modest 0.33% daily decline. The token has experienced six consecutive negative monthly closings without a single green candle since September 2025.
Technical Formation Nears Critical Decision Point
XRP’s daily chart reveals compression into a descending wedge apex, characterized by converging upper resistance and gradually ascending lower support trendlines. The daily MACD histogram currently reads -0.0222, maintaining bearish territory while showing signs of contraction—suggesting diminishing downward momentum.
Examining the 4-hour timeframe, the signal line has marginally crossed into positive terrain for the first instance since February. While a confirmed bullish MACD crossover remains pending, momentum indicators are displaying directional shifts.
Crypto analyst Ali Martinez highlighted via X that XRP “could offer a short-term buying opportunity” at current price levels within its broader multi-year ascending triangle pattern. However, he cautioned about a potential 30% correction scenario before any sustained long-term recovery materializes.
A confirmed daily close surpassing $1.47 would validate breakout momentum, establishing initial targets at $1.50 followed by $1.60. Alternatively, a breakdown beneath $1.27 would expose XRP to downside risk toward $1.14. Notably, approximately 19.6 million XRP tokens are concentrated between $1.27 and $1.28, establishing this range as the critical support zone requiring defense.
Blockchain Metrics Reach Unprecedented Levels
On-chain analytics paint a markedly different picture from price performance. The XRP Ledger processed 4.49 million successful transactions on April 2—representing a two-year record. Daily active addresses have rebounded above the 200,000 threshold. The total count of non-empty wallets recently surpassed 7.7 million, establishing a new benchmark in the ledger’s 13-year operational history.
Significant XRP volumes have migrated off exchanges in recent periods, with Binance alone witnessing $11.4 billion in outflows.
March 2026 represented a watershed moment as U.S. spot XRP ETF products recorded their first negative flow period since launching in November 2025. Meanwhile, aggregate open interest across all exchanges currently stands near $2.45 billion, reflecting an approximately 73% contraction from September 2025 peak levels.
Key Takeaways
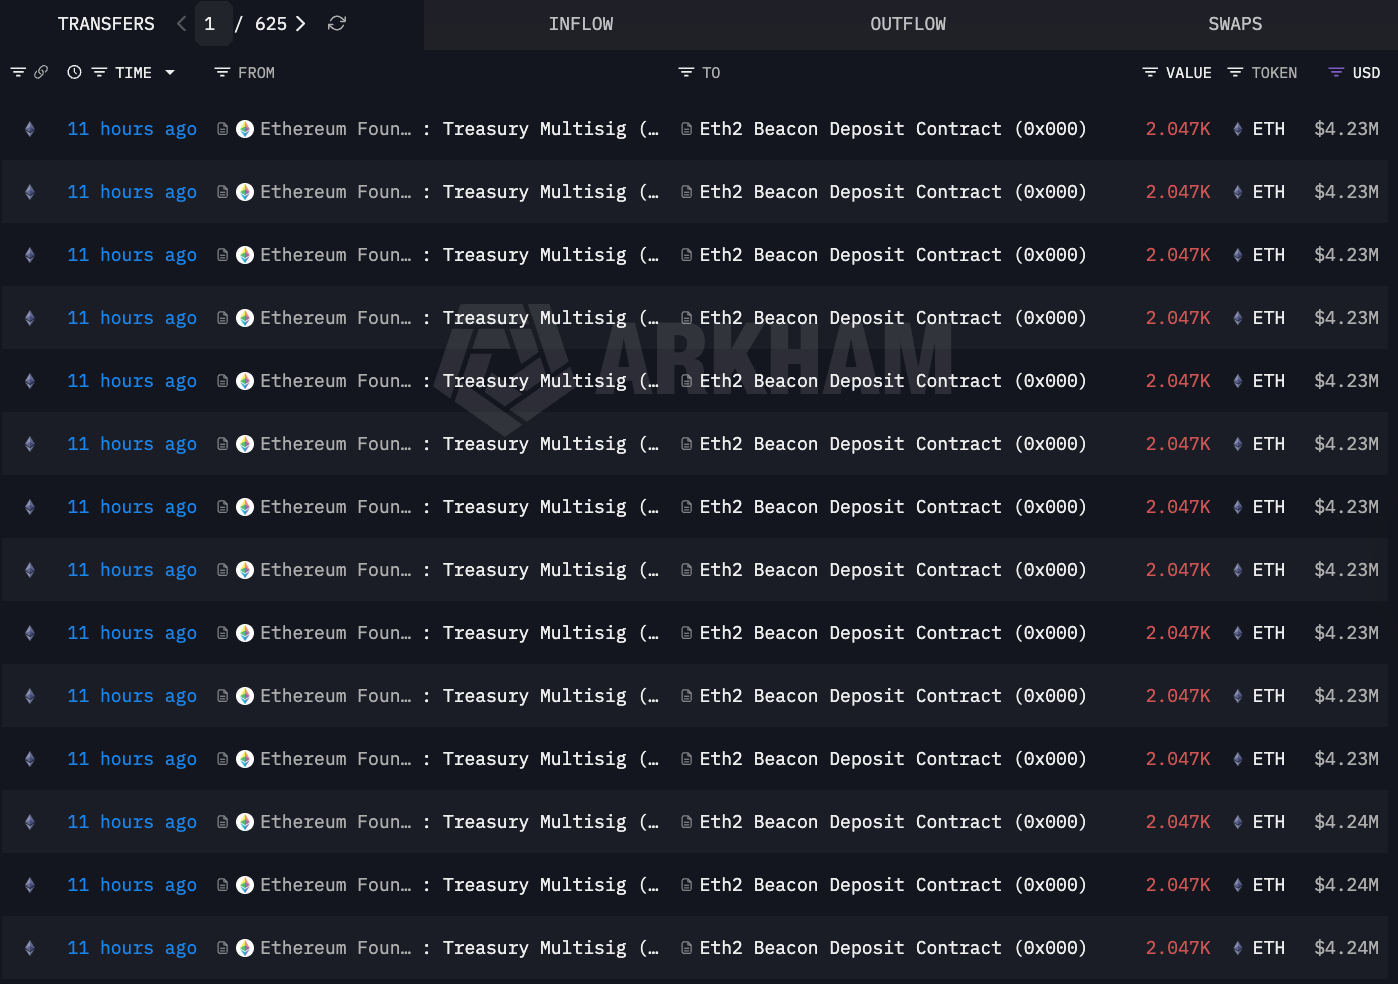
- Ethereum Foundation has deposited 69,500 ETH into staking, leaving only 500 ETH to reach its 70,000 milestone
- More than $143 million worth of ETH is currently secured in the Beacon Deposit Contract
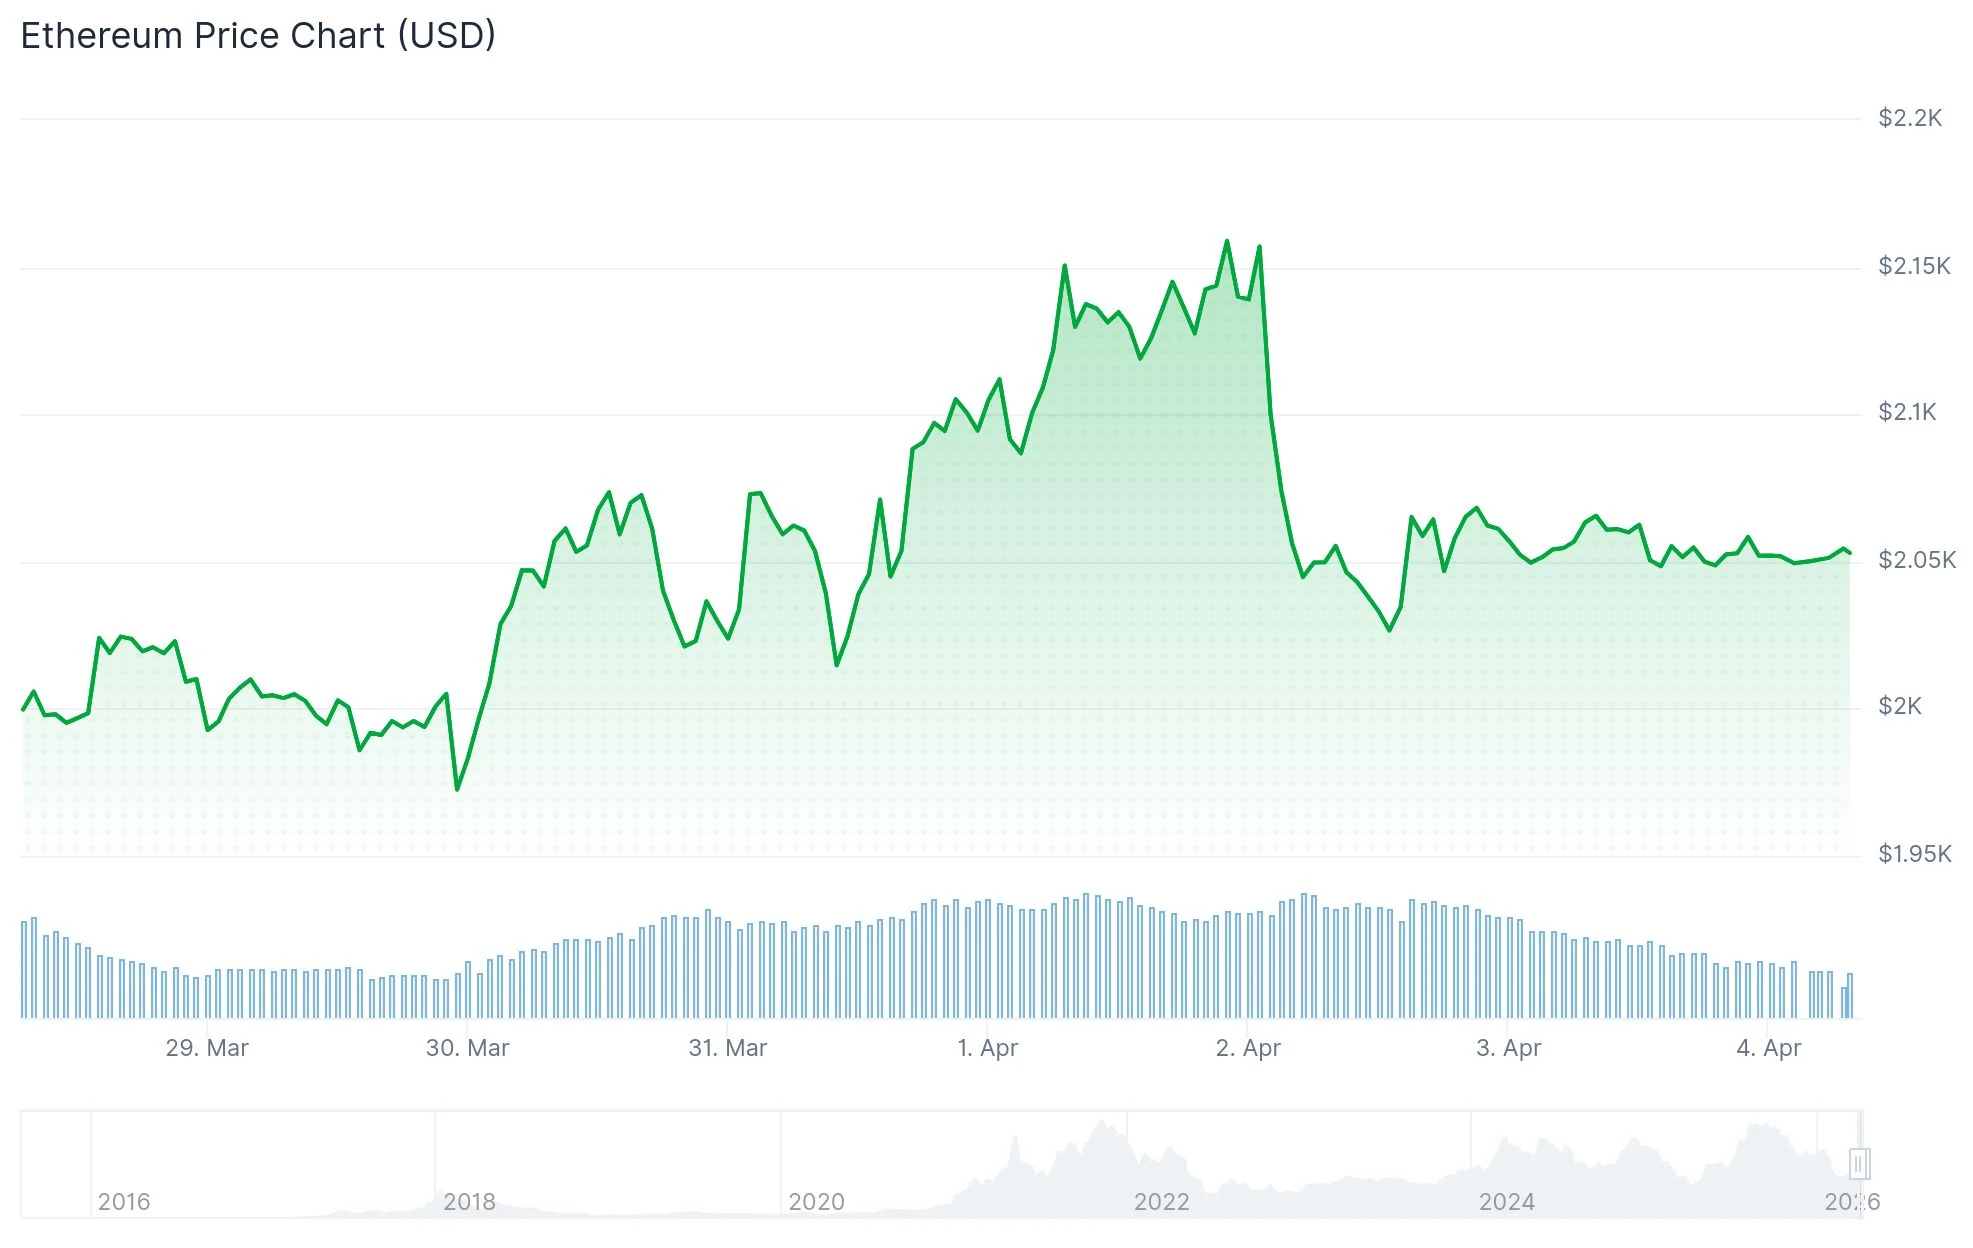
- ETH maintains trading activity around $2,050 with critical support established at $2,000 and resistance zones between $2,150–$2,200
- Spot ETH ETFs experienced $42.1 million in net outflows during the past week, including $53.3 million from BlackRock
- Korean retail investors are accumulating, evidenced by a positive Korea Premium Index reading
In a series of Friday transactions, the Ethereum Foundation (EF) deposited more than 45,000 ETH into staking contracts, with each transaction containing exactly 2,047 ETH. This substantial move elevated the foundation’s cumulative staked position to approximately 69,500 ETH — leaving just under 500 ETH remaining to achieve its publicly announced 70,000 ETH objective.

According to blockchain analytics platform Arkham Intelligence, Friday’s staking operations represented over $92.2 million in value. The foundation’s total holdings within the Ethereum Beacon Deposit Contract now exceed $143 million.
This staking initiative launched in February 2025, following a treasury management strategy the foundation outlined in June 2025. The strategic shift aims to generate staking rewards that will finance protocol development, research initiatives, and ecosystem grant programs, eliminating the need to liquidate ETH holdings for operational expenses.
The foundation’s staking timeline began with 2,016 ETH deposited in February, expanded to 22,517 ETH throughout March, and culminated with Friday’s substantial allocation.
However, co-founder Vitalik Buterin has expressed reservations about this methodology. In January 2025, he highlighted that by staking its treasury, the foundation would effectively be compelled to align with one faction during any disputed protocol upgrades or hard forks. Foundation representatives acknowledge this concern and are actively exploring mitigation strategies.
Price Action Maintains $2,000 Floor Amid Mounting Sell Orders
ETH currently trades in the vicinity of $2,050. The psychological $2,000 threshold has proven resilient as a support floor, withstanding numerous tests over recent weeks as buyers continue defending this critical level.
Derivatives market data reveals Ethereum’s net taker volume has shifted sharply negative, indicating a wave of aggressive market sell orders. This recent spike represents one of the most pronounced sell-side imbalances observed in weeks, occurring alongside approximately $1 billion in collective sell pressure throughout major exchanges.
Technical indicators show price action remains suppressed beneath the Ichimoku cloud formation, which currently functions as dynamic overhead resistance. The Relative Strength Index hovers near neutral territory, reflecting market indecision without clear directional dominance from either buying or selling forces.
ETF Capital Flight and Geographic Buying Patterns
Market analyst Ted Pillows reported on X that Ethereum spot ETF products recorded $42.1 million in net outflows throughout the week, with BlackRock’s offering accounting for $53.3 million in redemptions alone.
Conversely, South Korean retail market participants appear to be accumulating during price weakness. The Korea Premium Index has shifted into positive territory at approximately 0.6, signaling that Korean exchange users are willing to pay premiums above international market rates for ETH access.
Global spot market flows remain dominated by outflows, with only sporadic inflow periods that haven’t materially altered the prevailing negative trend.
Critical resistance levels for ETH lie at $2,150 and $2,200. A decisive break above $2,200 with sustained volume could pave the way toward $2,300 and potentially $2,400. Conversely, failure to maintain support above $2,000 would likely target $1,900 and $1,800 as subsequent downside objectives.

More than 20 crypto projects have shut down in the first quarter of 2026, signaling a fresh wave of consolidation as market conditions tighten.
The closures span wallets, exchanges, NFT platforms, and DeFi tools, pointing to a broader shakeout across the industry.
Several high-profile names stand out. Magic Eden shut down its wallet and scaled back multi-chain operations to refocus on Solana.
Meanwhile, Leap Wallet confirmed a full shutdown by late May, marking a complete exit rather than a pivot.
Derivatives exchange Bit.com has also wound down operations, alongside DeFi aggregator Slingshot and Web3 messaging platform Dmail.
Earlier in the quarter, NFT marketplace Nifty Gateway and analytics tool Parsec also ceased operations.
These closures reflect a pattern: many of the affected projects were launched during the 2021–2022 and early 2025 bull cycle, when capital was abundant and user growth came easily.
However, the current environment is less forgiving. Trading volumes have cooled, funding has tightened, and user activity has consolidated around a smaller number of dominant platforms.
As a result, products without clear revenue models or strong user retention have struggled to survive.
This trend suggests the market is moving into a more mature phase. Instead of rapid expansion, the focus is shifting toward sustainability, profitability, and real usage.
For now, smaller and mid-tier projects remain the most exposed as the industry resets.
The post Over 20 Crypto Projects Are Shutting Down in the First Half of 2026 appeared first on BeInCrypto.

Key Takeaways
- BTC currently trades around $66,800, confined within a $60,000–$70,000 corridor for several weeks
- Trader Michael van de Poppe suggests extended consolidation typically precedes significant price movements
- Wednesday witnessed $173.73 million exiting spot Bitcoin ETFs
- Presidential remarks regarding international conflicts reduced appetite for risk assets marketwide
- Several market observers believe Bitcoin hasn’t reached its cyclical low, with projections dipping under $50,000
Bitcoin currently sits near $66,800, reflecting an approximately 8% decline across the last month. The flagship digital asset has remained trapped between $60,000 and $74,000 following its annual bottom of $60,000 recorded on February 6.
Michael van de Poppe, who founded MN Trading Capital, shared his perspective on the current price behavior through a Friday post on X. “Bitcoin remains stagnant in this area, which means that there’s literally no direction,” he observed. He continued: “The longer it lasts, the heavier the breakout will be.” Van de Poppe is monitoring a potential climb above $71,000, a threshold BTC last touched on March 26.
Market observer Ted shared via X that the $60,000 level “wasn’t the bottom.” He anticipates a conclusive capitulation event before Bitcoin establishes a firm foundation. Ted highlighted that BTC faced resistance at the $69,000–$70,000 area, which had previously served as a support zone. He cautioned that breaking below the $65,000–$66,000 bracket would probably trigger a fresh decline.
Institutional Withdrawals Mount Pressure
Institutional appetite has shown inconsistency. Spot Bitcoin ETFs experienced $173.73 million in withdrawals on Wednesday, ending a two-day streak of inflows. This reflects caution among institutional participants who are stepping back from volatile assets.
Glassnode’s weekly analysis observed that BTC continues in a “redistribution phase.” The amount of supply held at a loss stays elevated while long-term holder selling hasn’t completely subsided. The analysis determined that the market is “no longer in outright stress but is still searching for stronger conviction.”
Trader Jordan forecasted in an X message that Bitcoin might surge to $80,000, referencing an upward trend that began in February. He observed BTC has maintained support in the lower $60,000s during each retest of that zone. Jordan suggested that holding there could propel prices toward the $80,000–$84,000 CME gap region.
Market Watchers Disagree on Cycle Bottom
Cryptocurrency analyst Doctor Profit indicated he sees a medium-high likelihood that BTC touches the $79,000–$84,000 area. Nevertheless, he revealed plans to establish short positions at those levels, targeting zones beneath $50,000. He also expressed conviction that Bitcoin’s price hasn’t found its floor yet.
Analyst CrypFlow referenced the 2-month stochastic RSI as a critical indicator. He noted that a bullish crossover below 20 has signaled optimal entry points in 2015, 2019, and 2023. That formation hasn’t materialized yet, implying additional downside may be forthcoming.
Bitcoin analyst Willy Woo stated on March 30 there exists a “very good chance” of a more severe bear market stemming from deteriorating global macroeconomic conditions. Seasoned trader Peter Brandt informed Cointelegraph he doesn’t anticipate Bitcoin achieving a new all-time peak until the second quarter of 2027.
The Crypto Fear & Greed Index registered at 11 on Saturday, firmly within “Extreme Fear” range.
From a technical standpoint, BTC trades close to the lower edge of a parallel channel around $65,900. The RSI hovers in the low 40s while the MACD stays beneath its signal line, indicating persistent selling momentum. A decisive close above $72,600 would mark the initial indication of a bullish reversal.
IMF backs gradual BOJ rate hikes as Iran war and weak Yen fuel inflation risks

Circle Faces Heat From ZachXBT Over Inaction
Ryan Coogler to produce “Animorphs” TV series reboot for Disney+ after “Sinners” Oscar win


-

 NewsBeat2 days ago
Steven Gerrard disagrees with Gary Neville over ‘shock’ Chelsea and Arsenal claim | Football
-

 Business1 day ago
No Jackpot Winner and $194 Million Prize Rolls Over
-
Entertainment5 days ago
Fans slam 'heartbreaking' Barbie Dream Fest convention debacle with 'cardboard cutout' experience
-

 Fashion14 hours ago
Weekend Open Thread: Spanx – Corporette.com
-

 Crypto World2 days ago
Gold Price Prediction: Worst Month in 17 Years fo Save Haven Rock
-

 Tech5 days ago
The Pixel 10a doesn’t have a camera bump, and it’s great
-
 Entertainment6 days ago
Lana Del Rey Celebrates Her Husband’s 51st Birthday In New Post
-
Crypto World4 days ago
Dems press CFTC, ethics board on prediction-market insider trades
-

 Tech5 days ago
Avatar Legends: The Fighting Game comes out in July and it looks pretty slick
-

 Sports4 days ago
Tallest college basketball player ever, standing at 7-foot-9, entering transfer portal
-

 Fashion6 days ago
Amazon Sundays: Soft Spring Layers
-

 Tech4 days ago
EE TV is using AI to help you find something to watch
-

 Business2 days ago
Login and Checkout Issues Spark Merchant Frustration
-

 Tech6 days ago
Elon Musk’s last co-founder reportedly leaves xAI
-

 Politics5 days ago
Should Trump Be Scared Strait?
-

 Tech4 days ago
How to back up your iPhone & iPad to your Mac before something goes wrong
-

 Crypto World4 days ago
U.S. rule change may open trillions in 401(k) funds to crypto
-

 Fashion5 days ago
The Best Spring Trends of 2026
-

 Tech5 days ago
Apple will hide your email address from apps and websites, but not cops
-

 Tech4 days ago
Flipsnack and the shift toward motion-first business content with living visuals
You must be logged in to post a comment Login