
Crypto World
What Crypto Whales Are Buying and Selling Ahead Of The April US CPI Print
The March Consumer Price Index (CPI) data, a measure of the cost of goods and services, lands today with a hot print expected amid Iran war-driven energy costs. A fragile ceasefire has offered reprieve, but uncertainty lingers. Crypto whales are already positioning.
BeInCrypto analysts tracking on-chain whale activity have identified three tokens showing sharp accumulation or selling ahead of the release.
Ethereum (ETH)
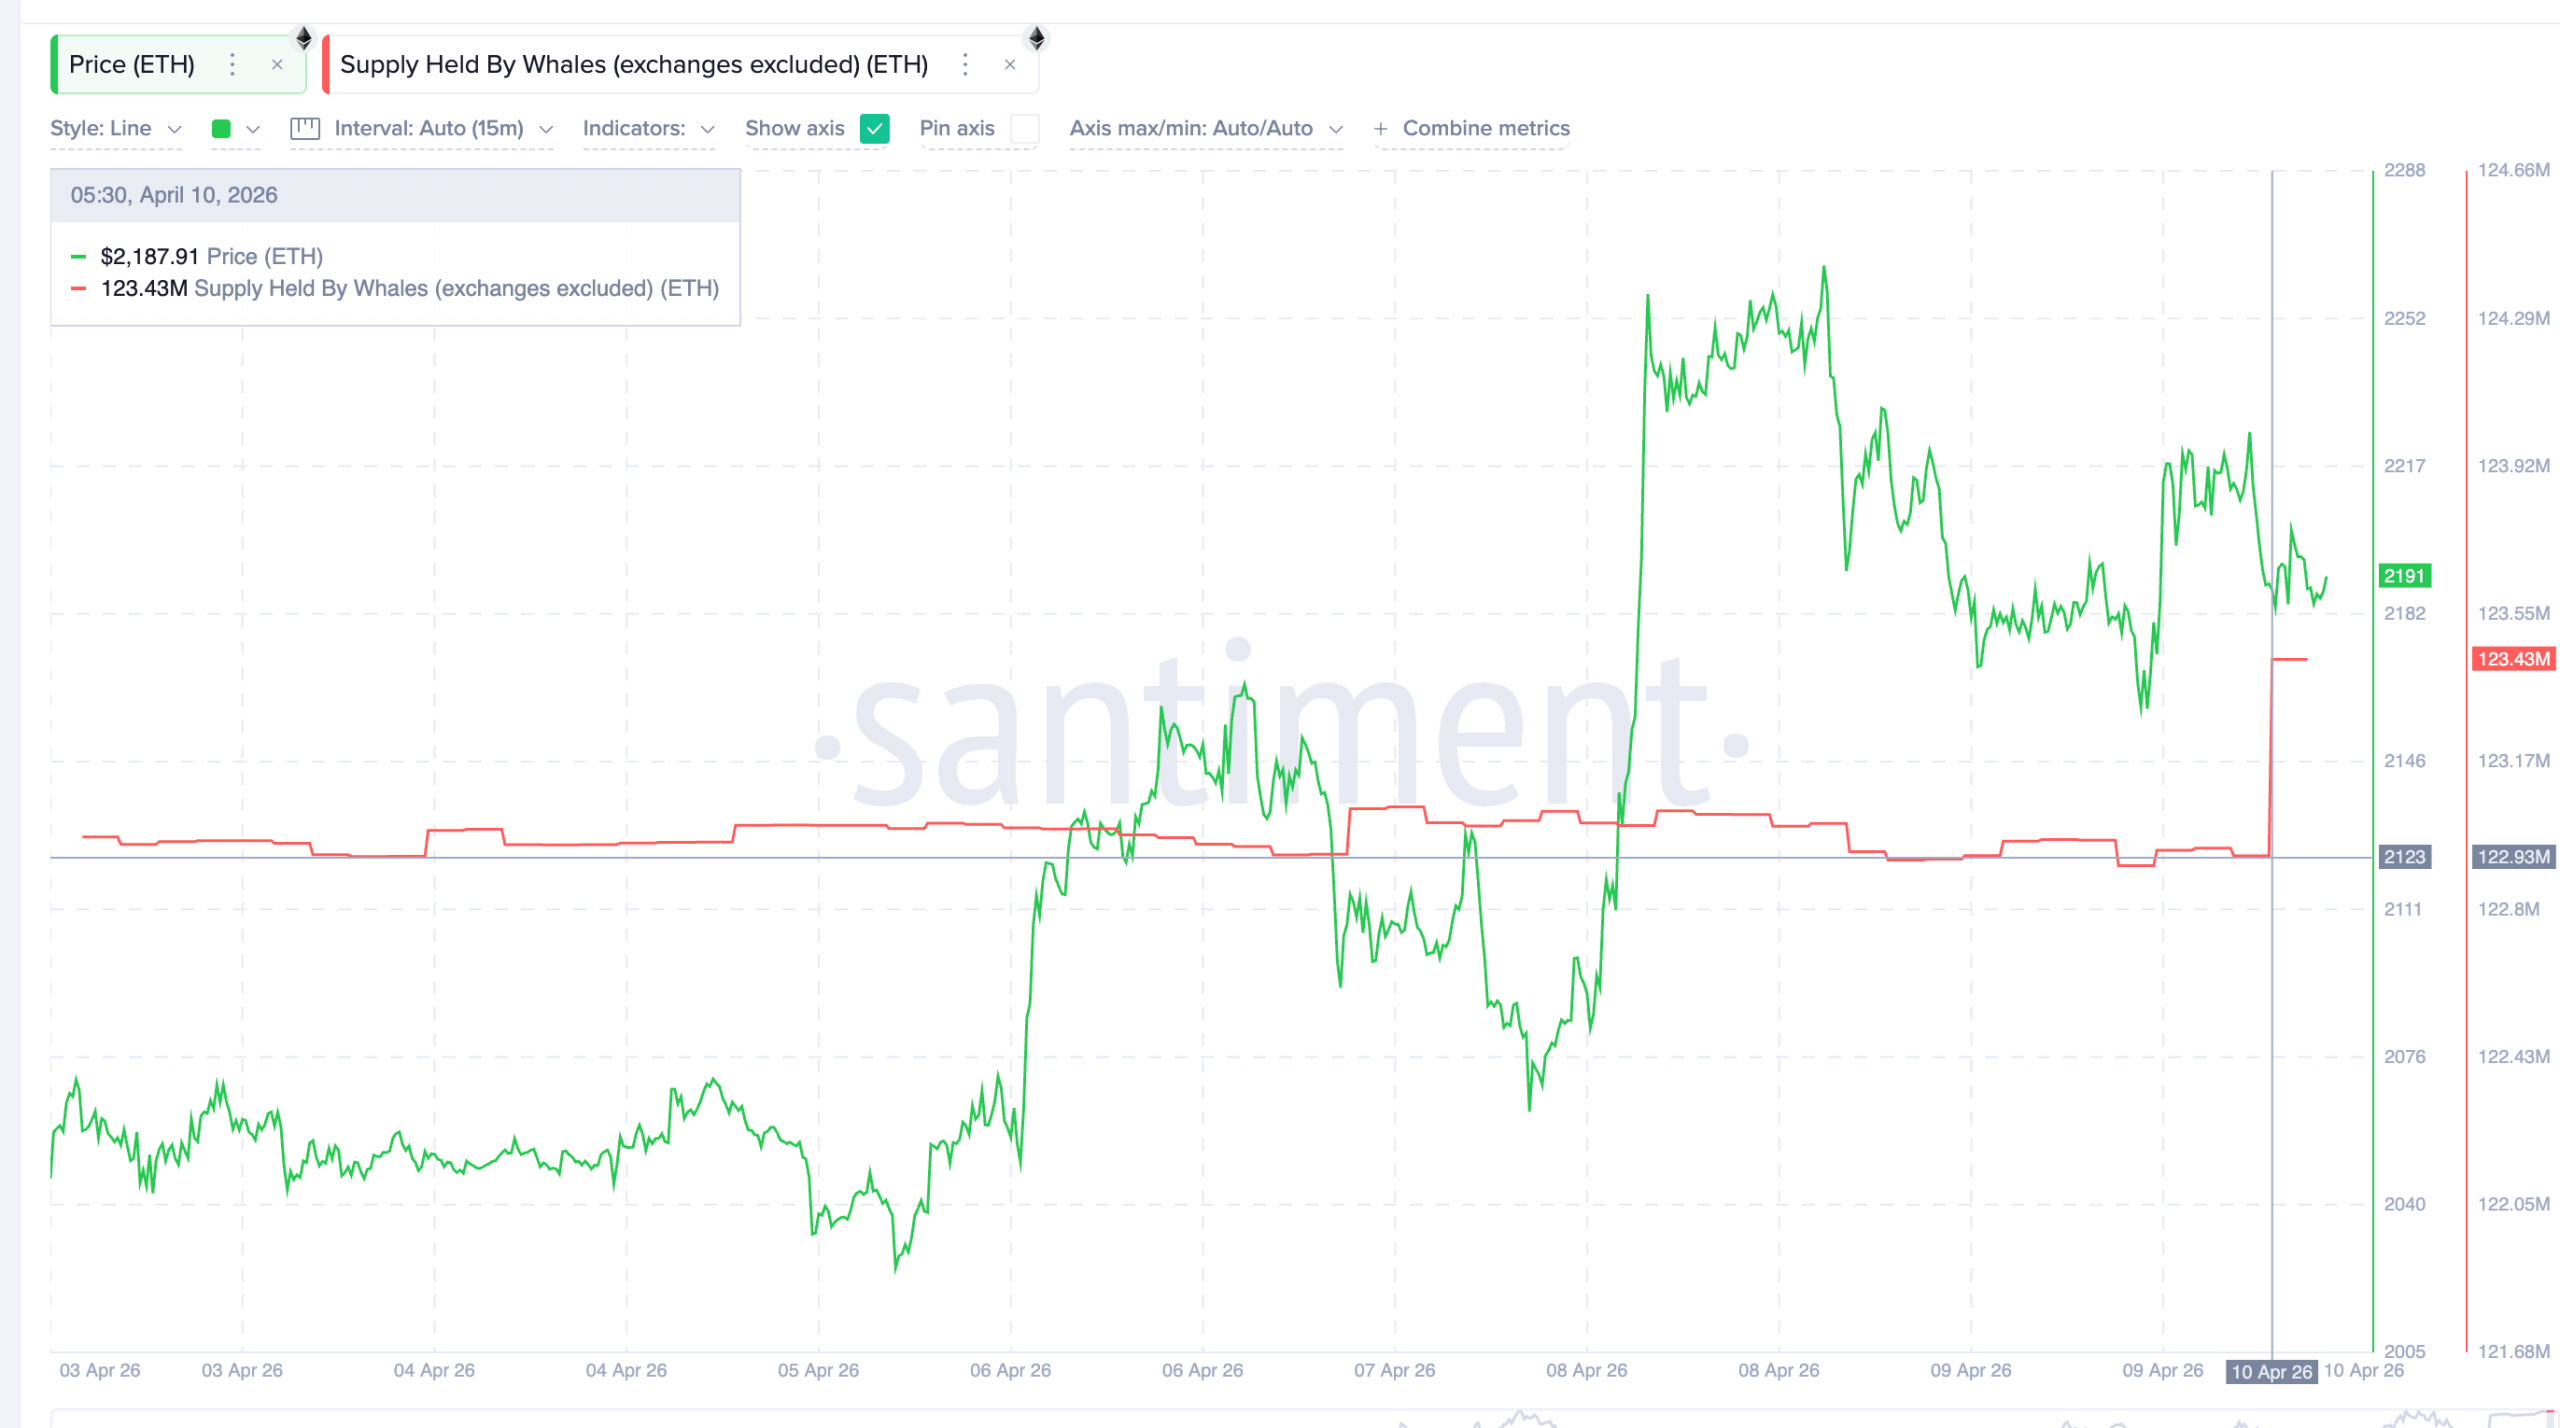
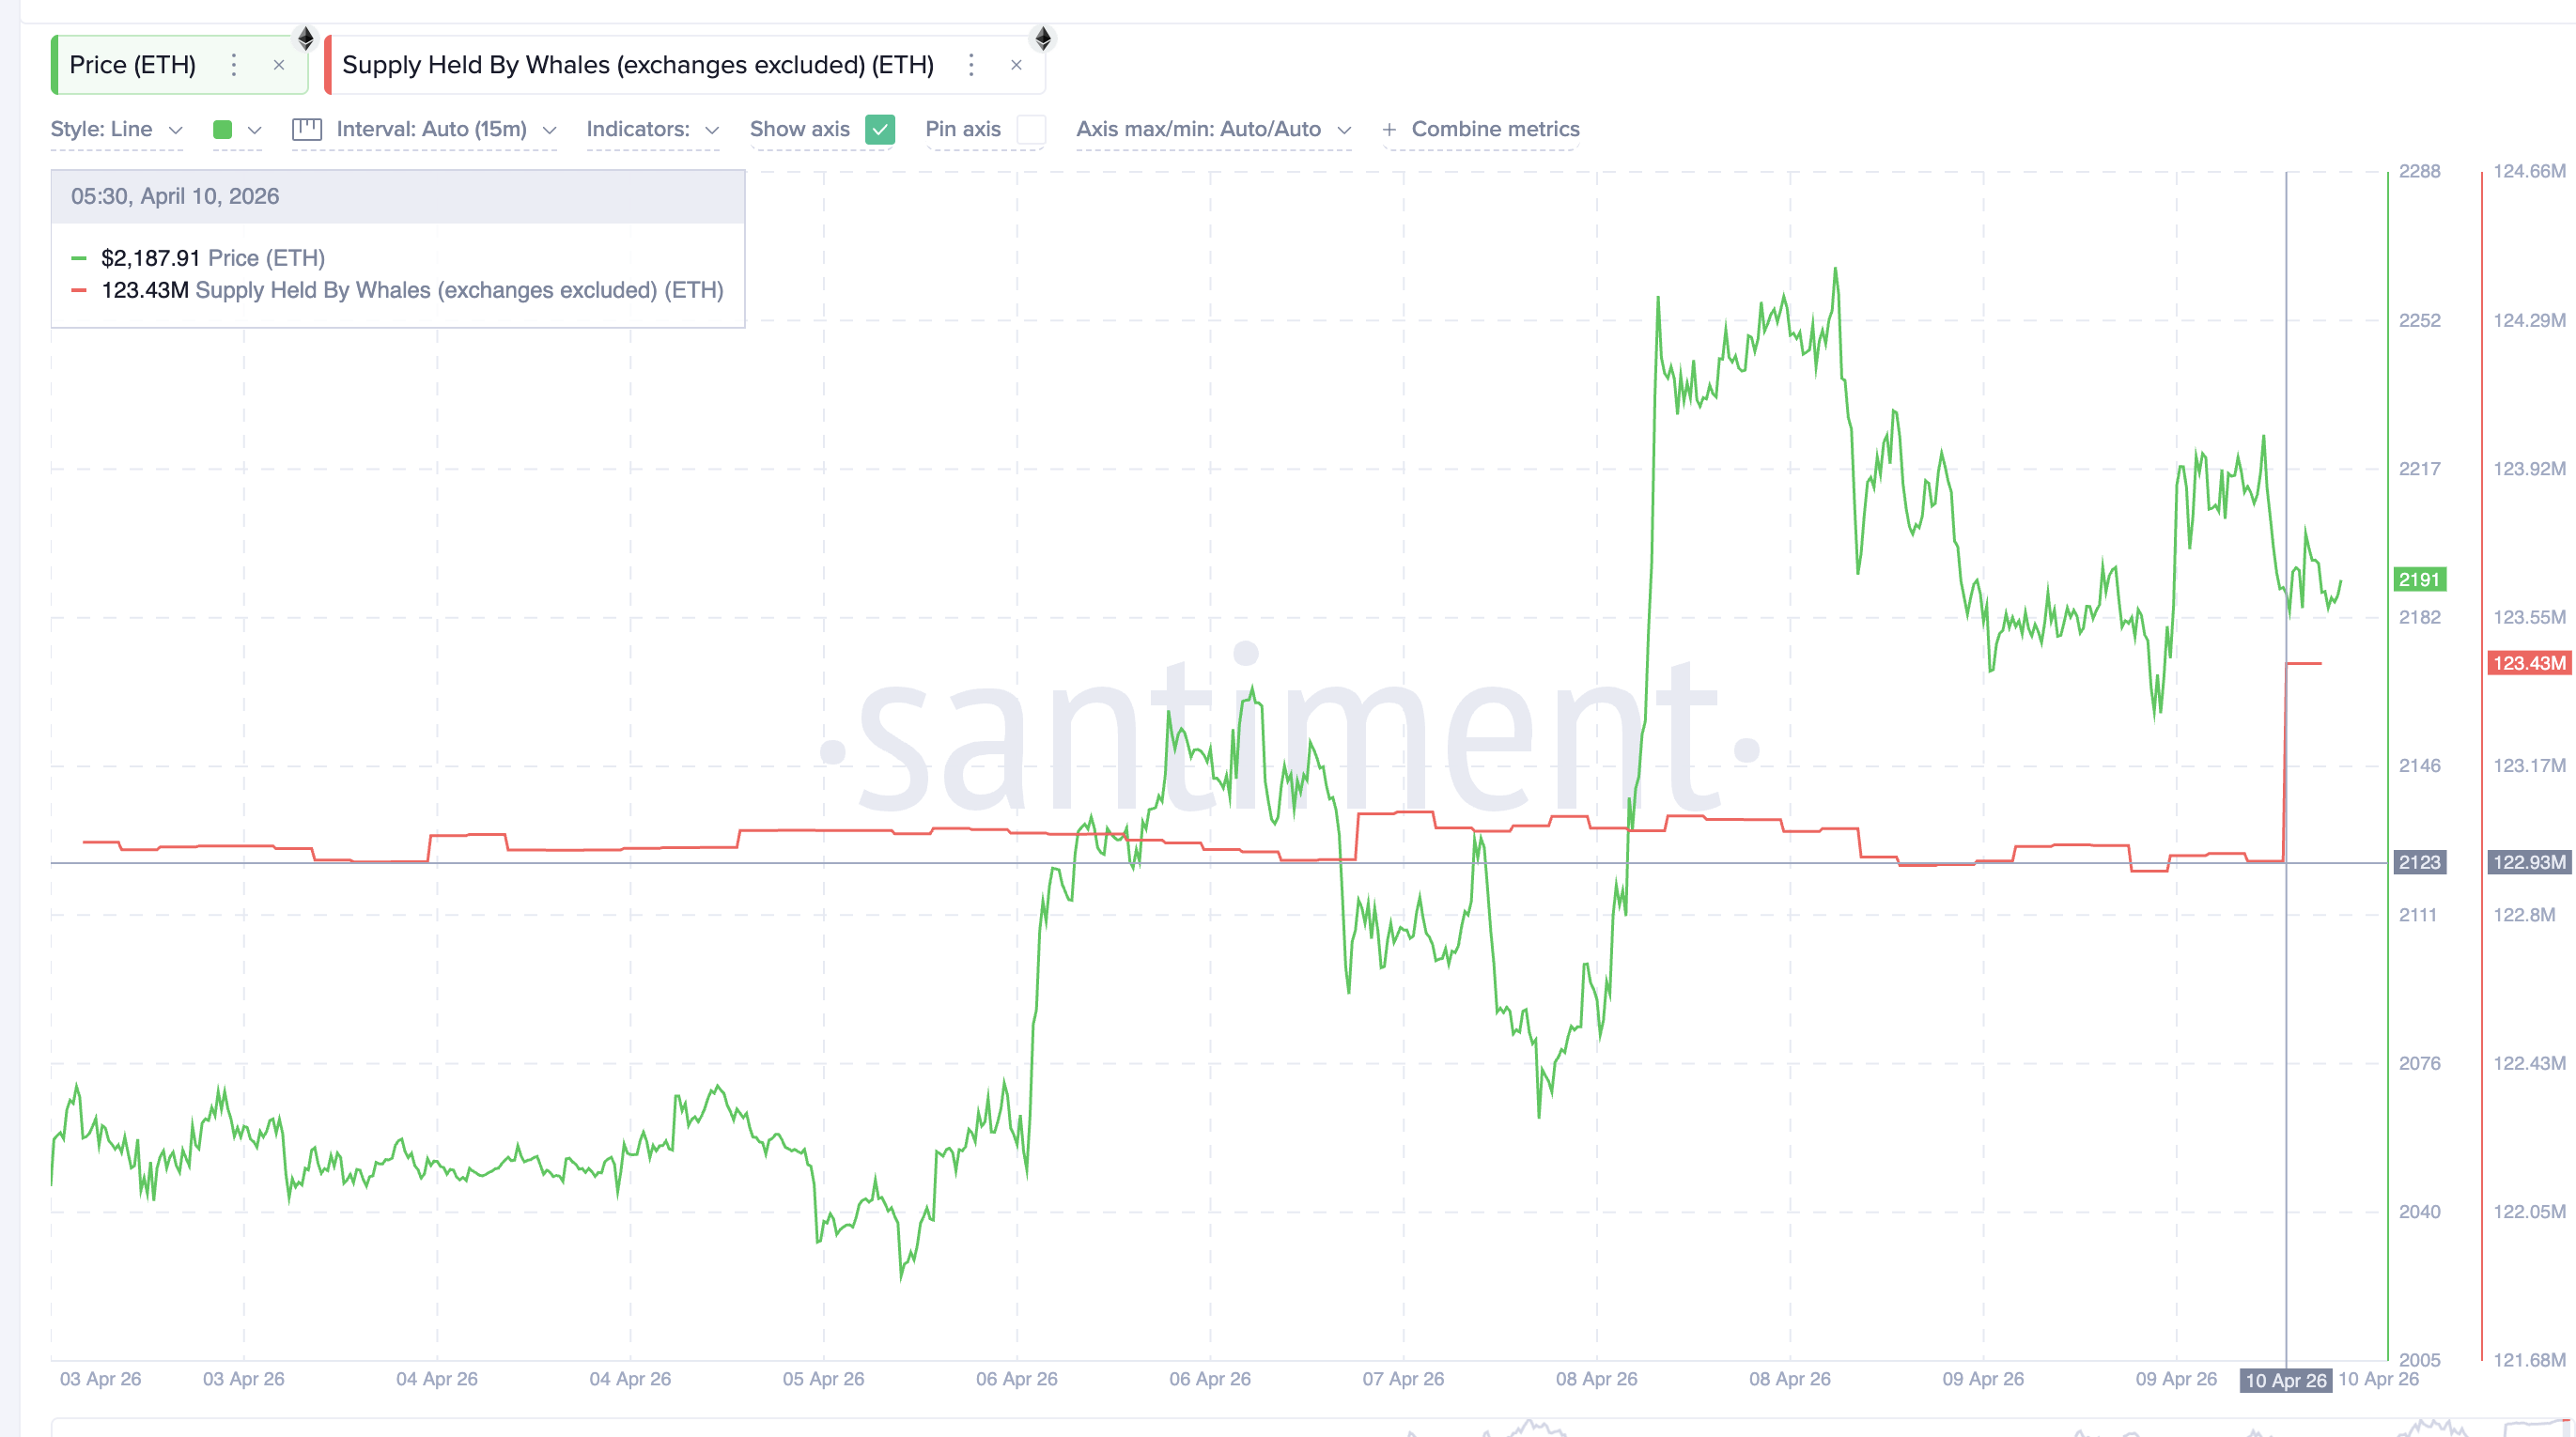
Among the tokens seeing heavy whale accumulation ahead of the April CPI print, Ethereum (ETH) stands out. Its positioning dwarfs all others.
Santiment data shows ETH crypto whale wallets surged from 122.93 million to 123.43 million tokens in hours. That 500,000 ETH increase translates to roughly $1.09 billion in fresh buying.
Want more token insights like this? Sign up for Editor Harsh Notariya’s Daily Crypto Newsletter here.
Headline CPI is expected to spike due to a 10.6% month-over-month jump in energy costs. However, core CPI inflation data is forecast at a softer 0.3% month over month. Large holders appear to be betting on that softer undertone sparking a relief rally.
Meanwhile, the Ethereum Foundation recently staked roughly 45,000 ETH to generate yield rather than sell. That structural shift reduces ongoing sell-side pressure from a major network entity and reinforces the bullish thesis.
On the daily chart, ETH is forming a cup-and-handle pattern inside a descending channel. The cup bottomed near $1,938 before curving higher. The handle’s upper boundary aligns with the channel neckline near $2,270. A single breakout could therefore confirm both structures simultaneously. A daily close above $2,231 would signal early strength.
A move through $2,270 followed by a clean reclaim of $2,300 would validate the pattern. That level aligns with the 0.618 Fibonacci level and would confirm renewed momentum.
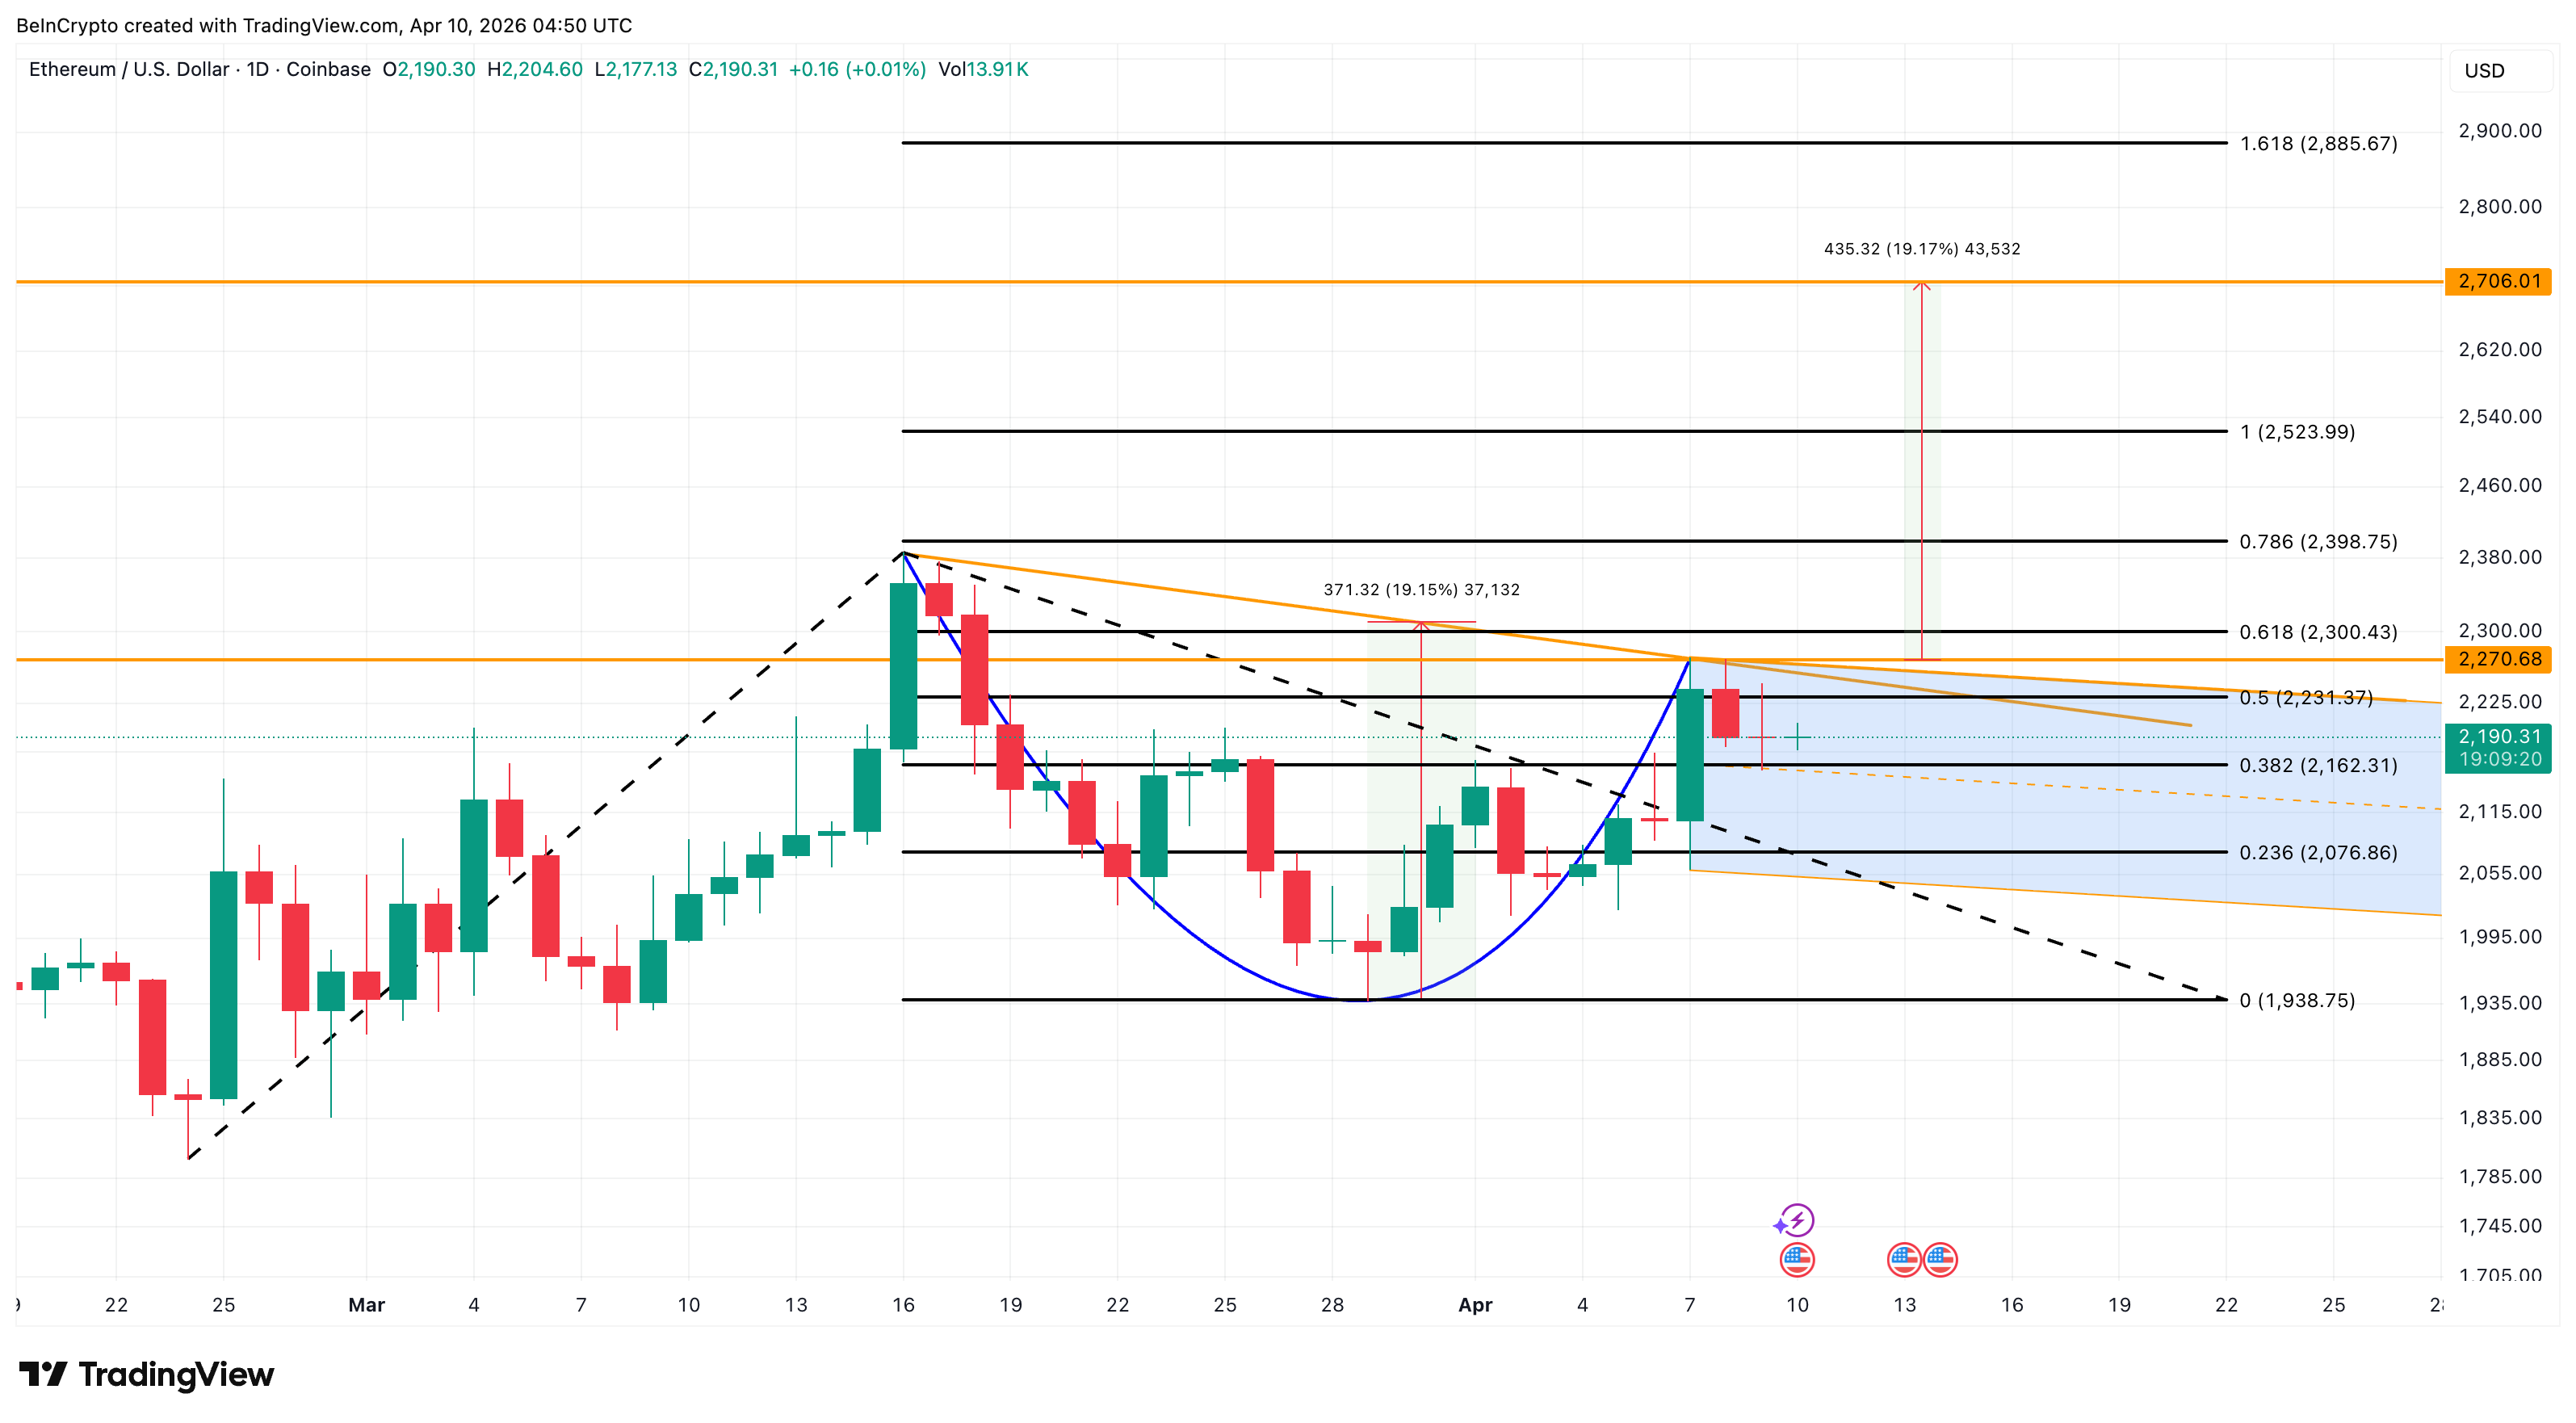
The projected upside sits near 19.15%, which could push ETH toward $2,706. However, a drop below $2,162 would weaken the setup. The pattern gets fully invalidated with a close under $1,938.
Uniswap (UNI)
While some crypto whales are loading up ahead of the CPI print, others are trimming DeFi exposure. In contrast to Ethereum’s $1.09 billion inflow, Uniswap (UNI) has seen consistent whale selling pressure over the past seven days.
Nansen data shows UNI whale wallets cut holdings by 2.48% over the past week. The stash now sits at 3.57 million tokens. That amounts to roughly 90,000 UNI sold, worth approximately $283,000 at the current price near $3.14. The selling aligns with broader DeFi profit taking as the sector trades mostly flat in the 7-day timeframe. Large holders appear to be de-risking ahead of a volatile CPI print rather than reacting to any UNI-specific catalyst.
The daily chart supports the bearish tone. UNI has been trading inside a bear flag pattern since its March 13 high of $4.21. The flag’s lower boundary was tested near $3.01. UNI has since rebounded without reclaiming meaningful resistance. The 7-day whale distribution aligns with this bearish structure.
If that lower trendline breaks, the projected drop stands at roughly 28%. A daily close below $3.08, the 0.618 Fibonacci level, would start the trigger. Support levels at $2.92 and $2.72 could slow the decline. Yet the measured target sits near $2.20 if buyers fail to step in.
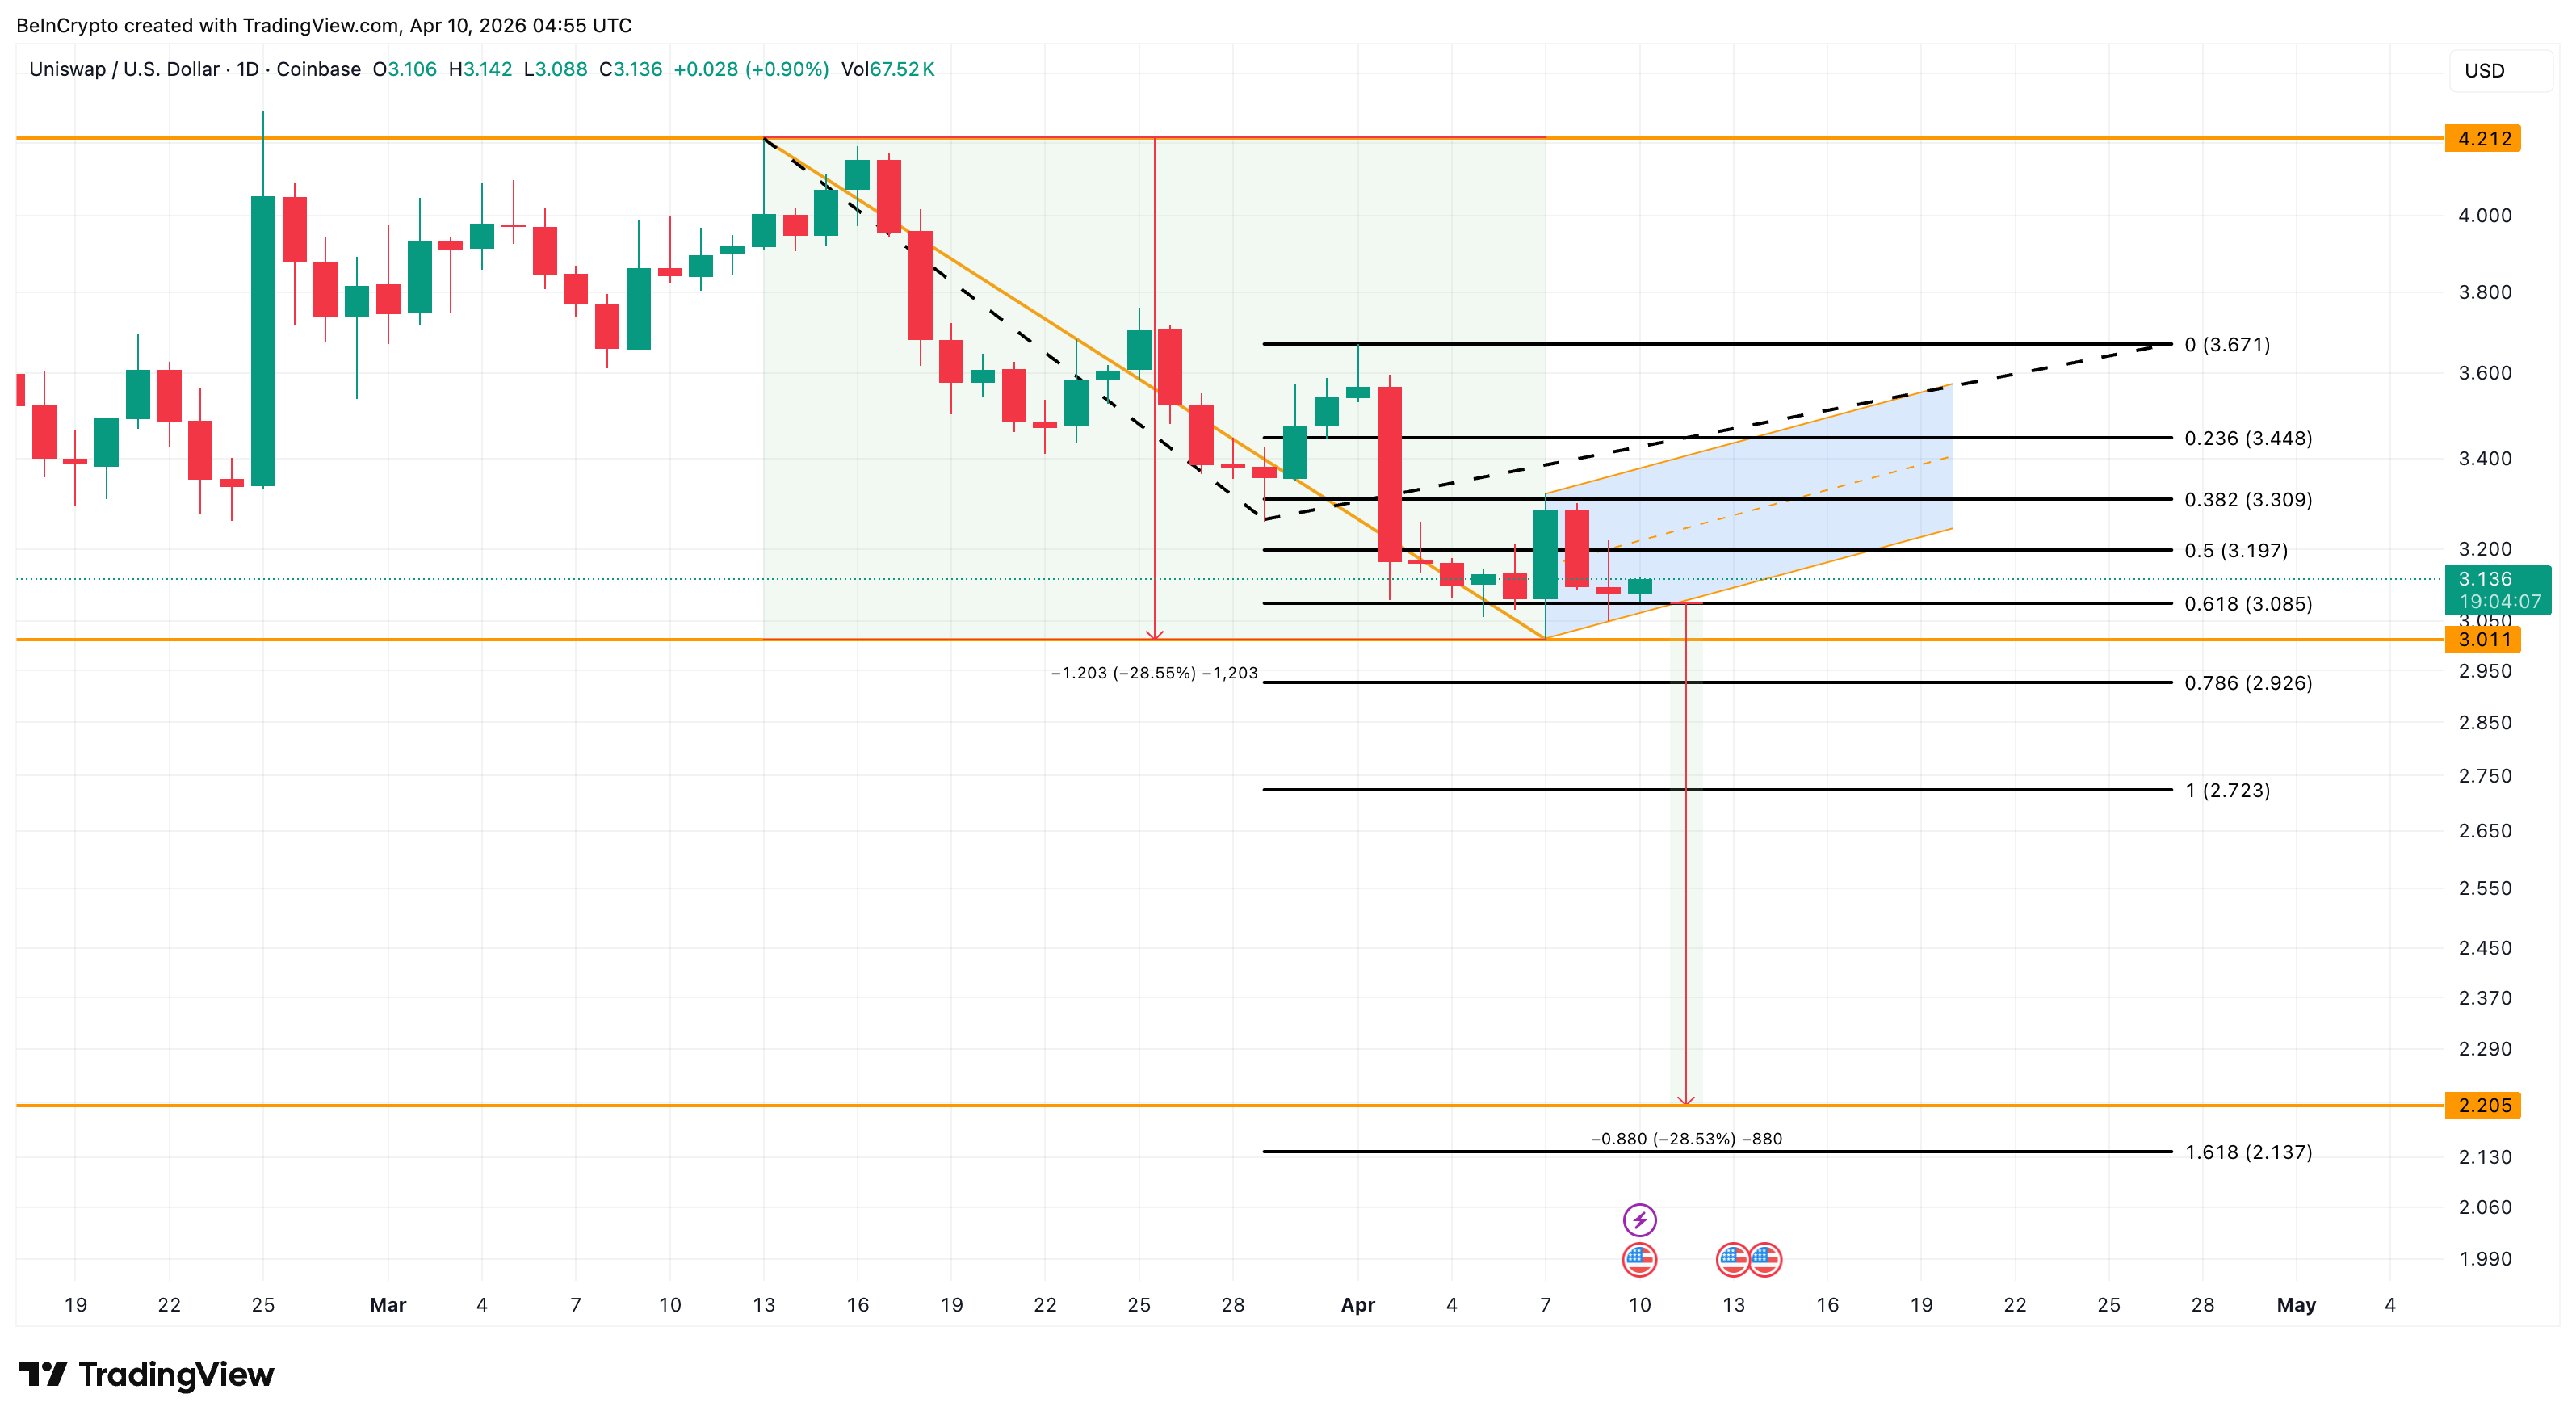
However, a push above $3.44 would challenge the bearish structure. A move beyond $3.67 would likely invalidate the bear flag entirely.
Chainlink (LINK)
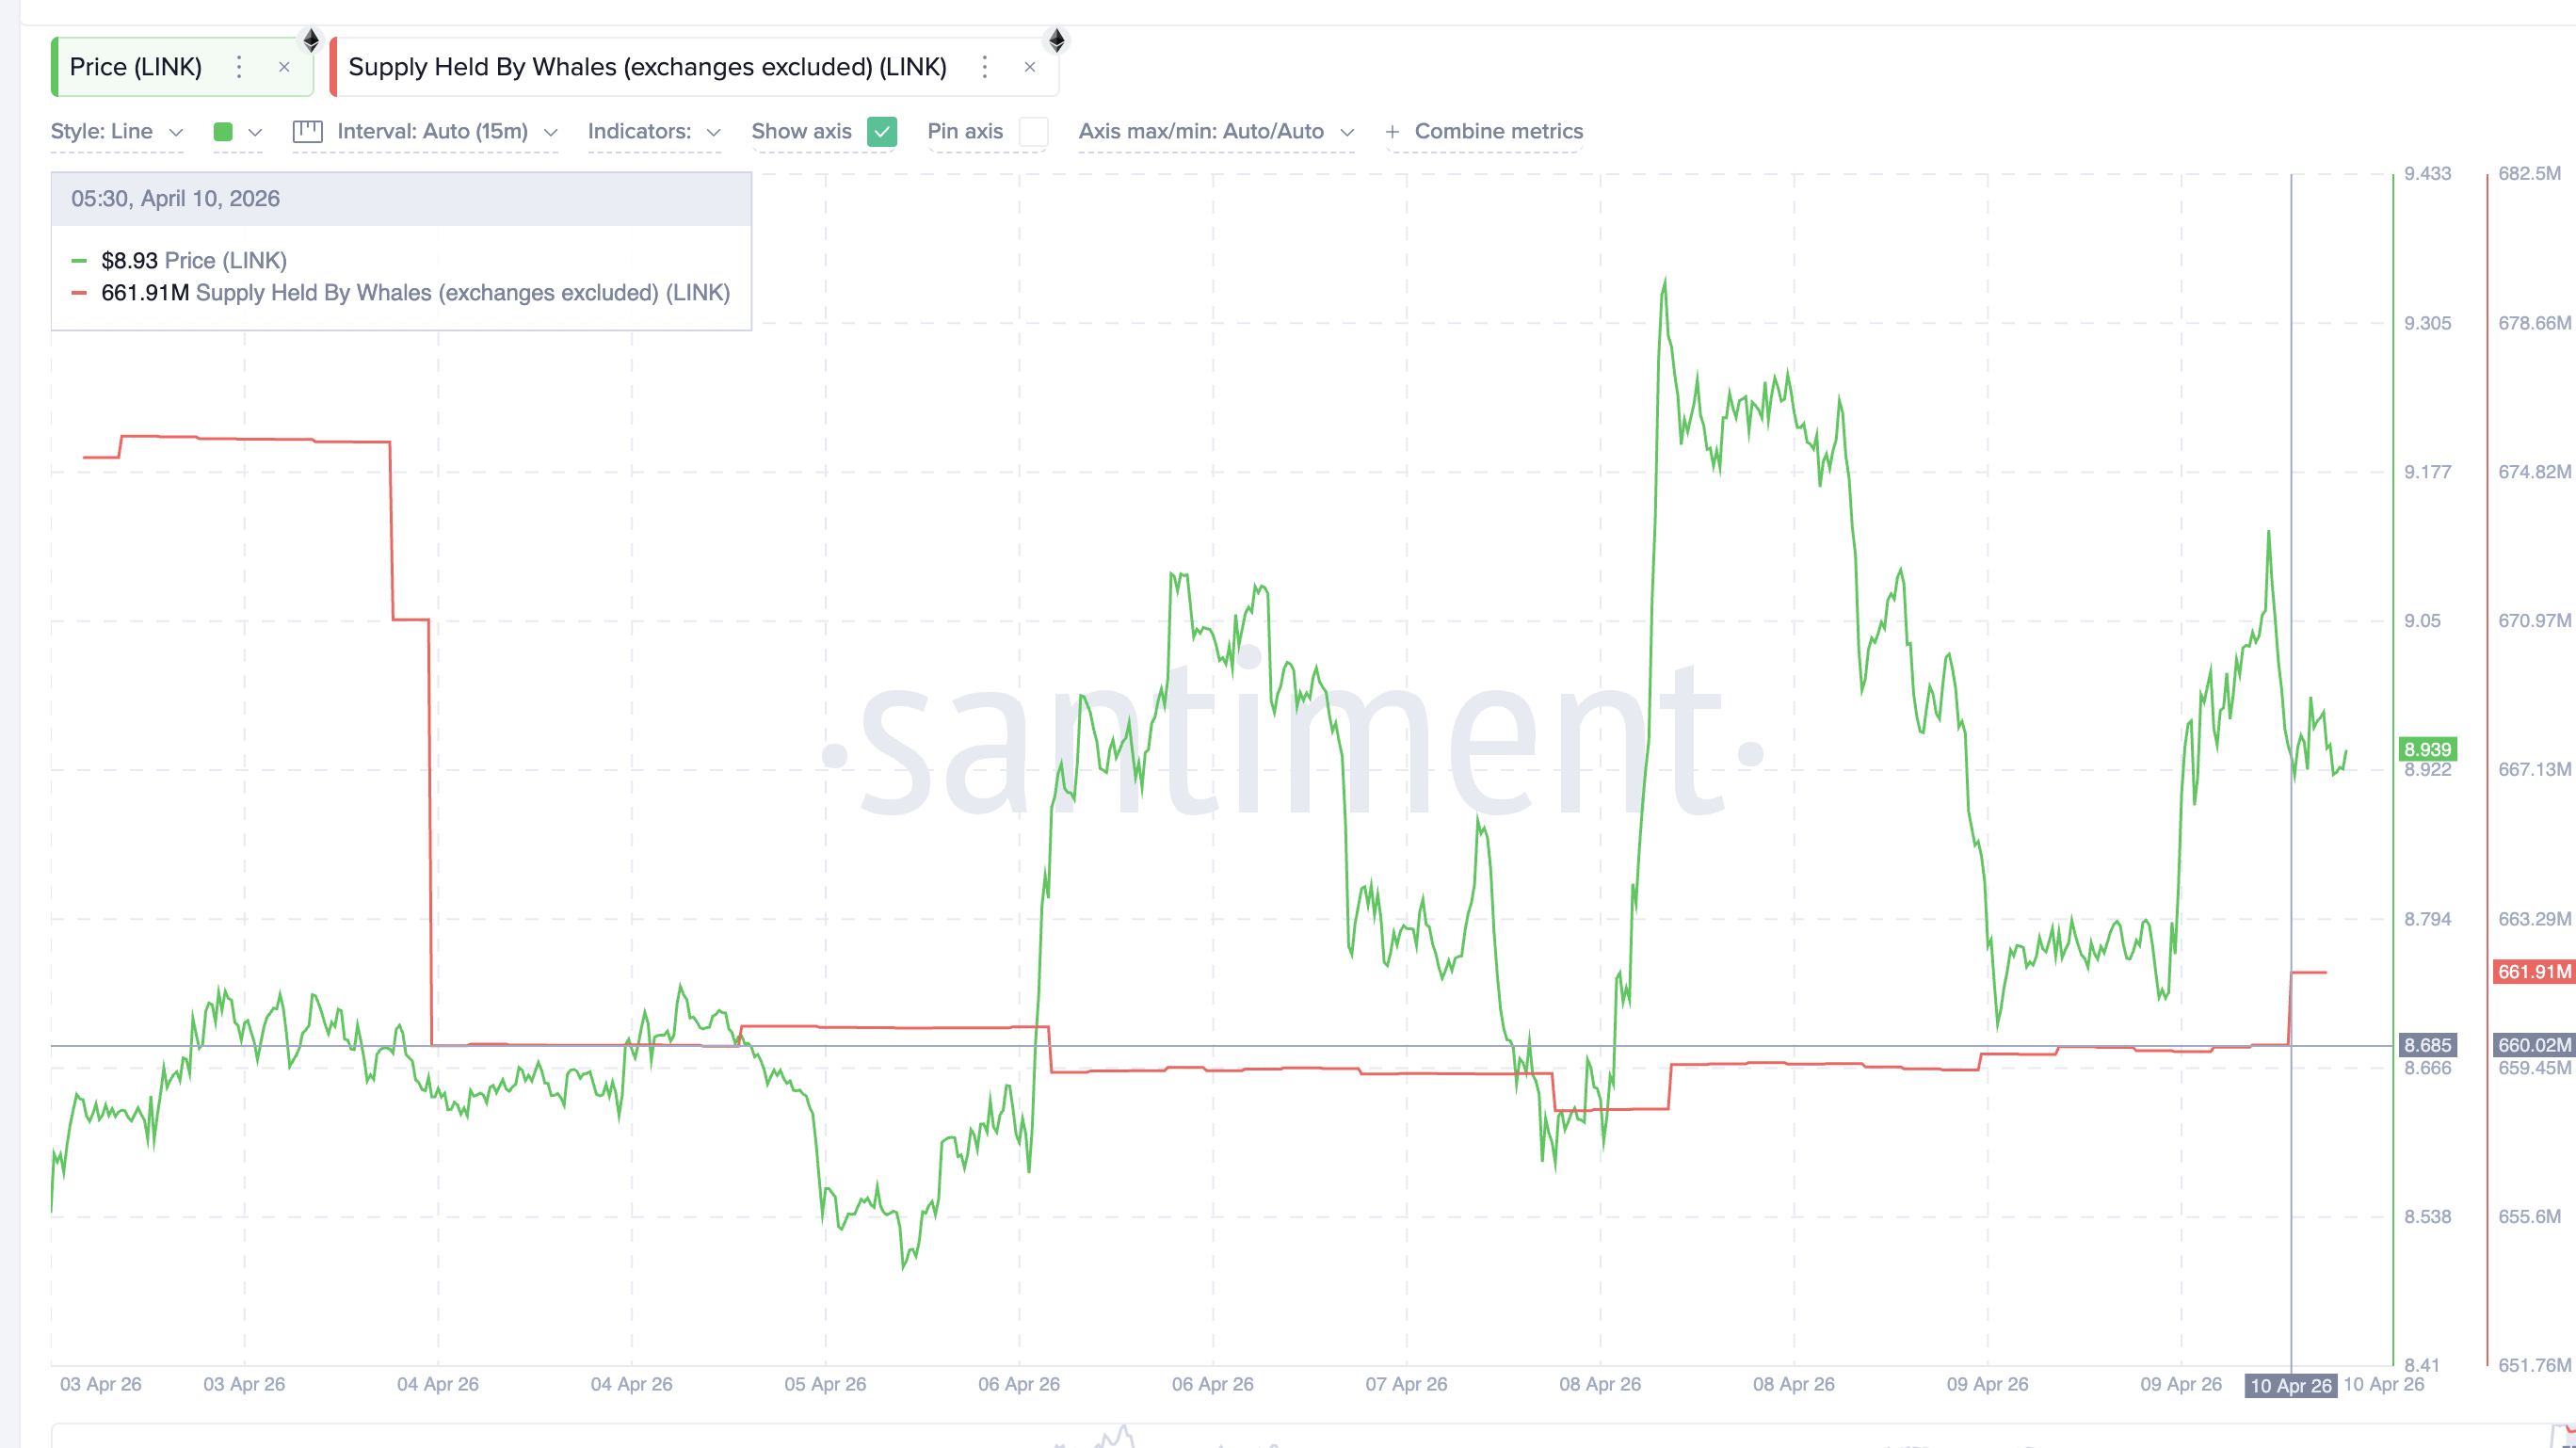
Chainlink (LINK) rounds out the altcoin whale buying picture with a sudden surge in accumulation over the past few hours. Its oracle infrastructure feeds price data to DeFi protocols, positioning it to benefit from any activity uptick.
Santiment data shows LINK whale wallets climbed from 660.02 million to 661.91 million tokens. That 1.89 million LINK pickup translates to approximately $16.93 million in fresh buying. The accumulation mirrors the ETH whale pattern. Large holders appear to see the CPI print as a potential macro catalyst, provided a softer core reading surfaces.
On the daily chart, LINK is trading inside an inverse head-and-shoulders pattern. The right shoulder has locked into place, and the neckline sits near $9.43. From the head to the neckline, the measured target implies a 15.40% move higher. That could push LINK toward $10.82, above the psychological $10 mark.
A daily reclaim of $9.43 would confirm the breakout. From there, $9.63 and $9.89 serve as the first set of intermediate targets. However, $8.96 acts as the immediate floor. A slip below $8.68 would put the right shoulder under threat.
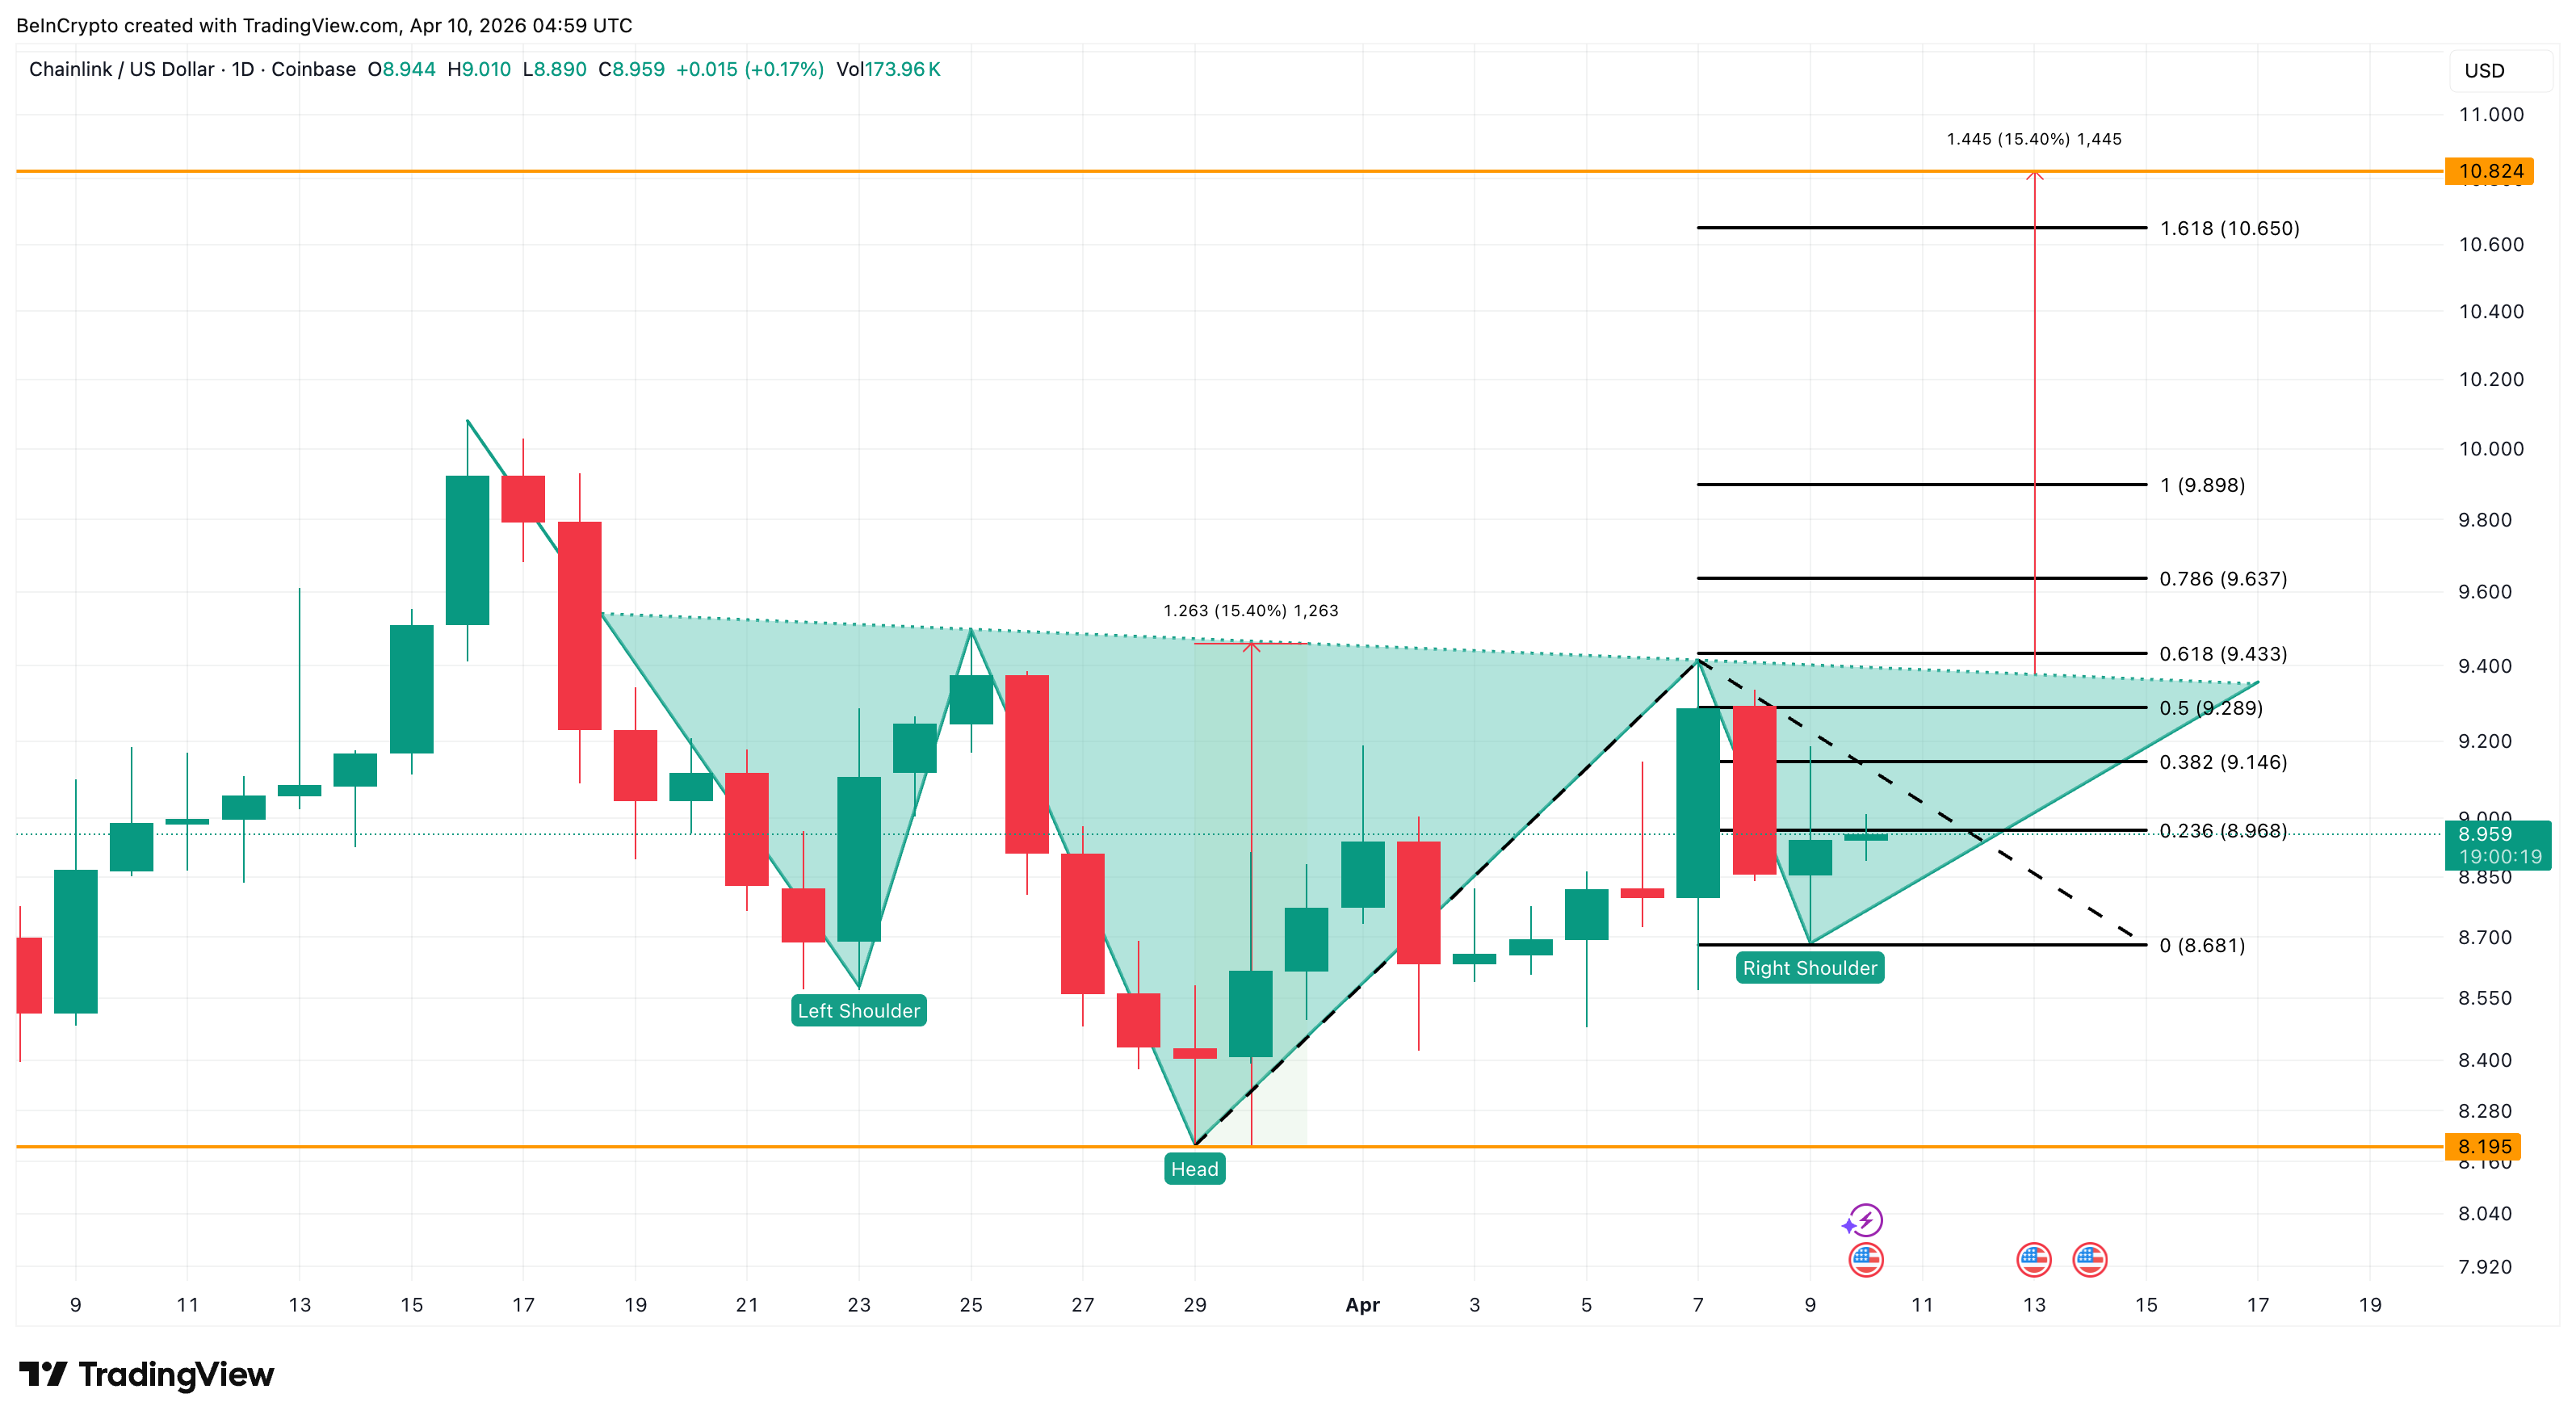
Yet the pattern retains its validity as long as LINK holds above $8.19, the head of the formation. Only a daily close below that level would fully invalidate the setup. Despite the macro uncertainty, that gives bulls a relatively wide margin of safety heading into the CPI release.
The post What Crypto Whales Are Buying and Selling Ahead Of The April US CPI Print appeared first on BeInCrypto.


Commodity-linked currencies continue to strengthen, while the US dollar remains under pressure amid easing geopolitical tensions and a shift in investor preference towards riskier assets. Reports of a temporary ceasefire between the US and Iran have helped stabilise sentiment and reduced demand for safe-haven assets, supporting currencies sensitive to the global economic cycle, including the Australian and Canadian dollars.
Another factor weighing on the dollar is expectations around Federal Reserve monetary policy, which remain highly sensitive to incoming macroeconomic data. Lower US Treasury yields and ongoing uncertainty بشأن inflation dynamics are reinforcing cautious market positioning. Against this backdrop, attention is turning to upcoming US data releases, including inflation, consumer sentiment, and business activity indicators, which may reshape interest rate expectations.
AUD/USD
AUD/USD continues its upward move after breaking out of the 0.6840–0.6960 range. The next upside targets are the yearly highs in the 0.7160–0.7180 area. The bullish scenario would be invalidated if the pair falls and holds below 0.7020.
Key events for AUD/USD:
- Today at 15:30 (GMT+3): US Core CPI
- Today at 17:00 (GMT+3): University of Michigan inflation expectations
- Today at 17:00 (GMT+3): University of Michigan consumer sentiment
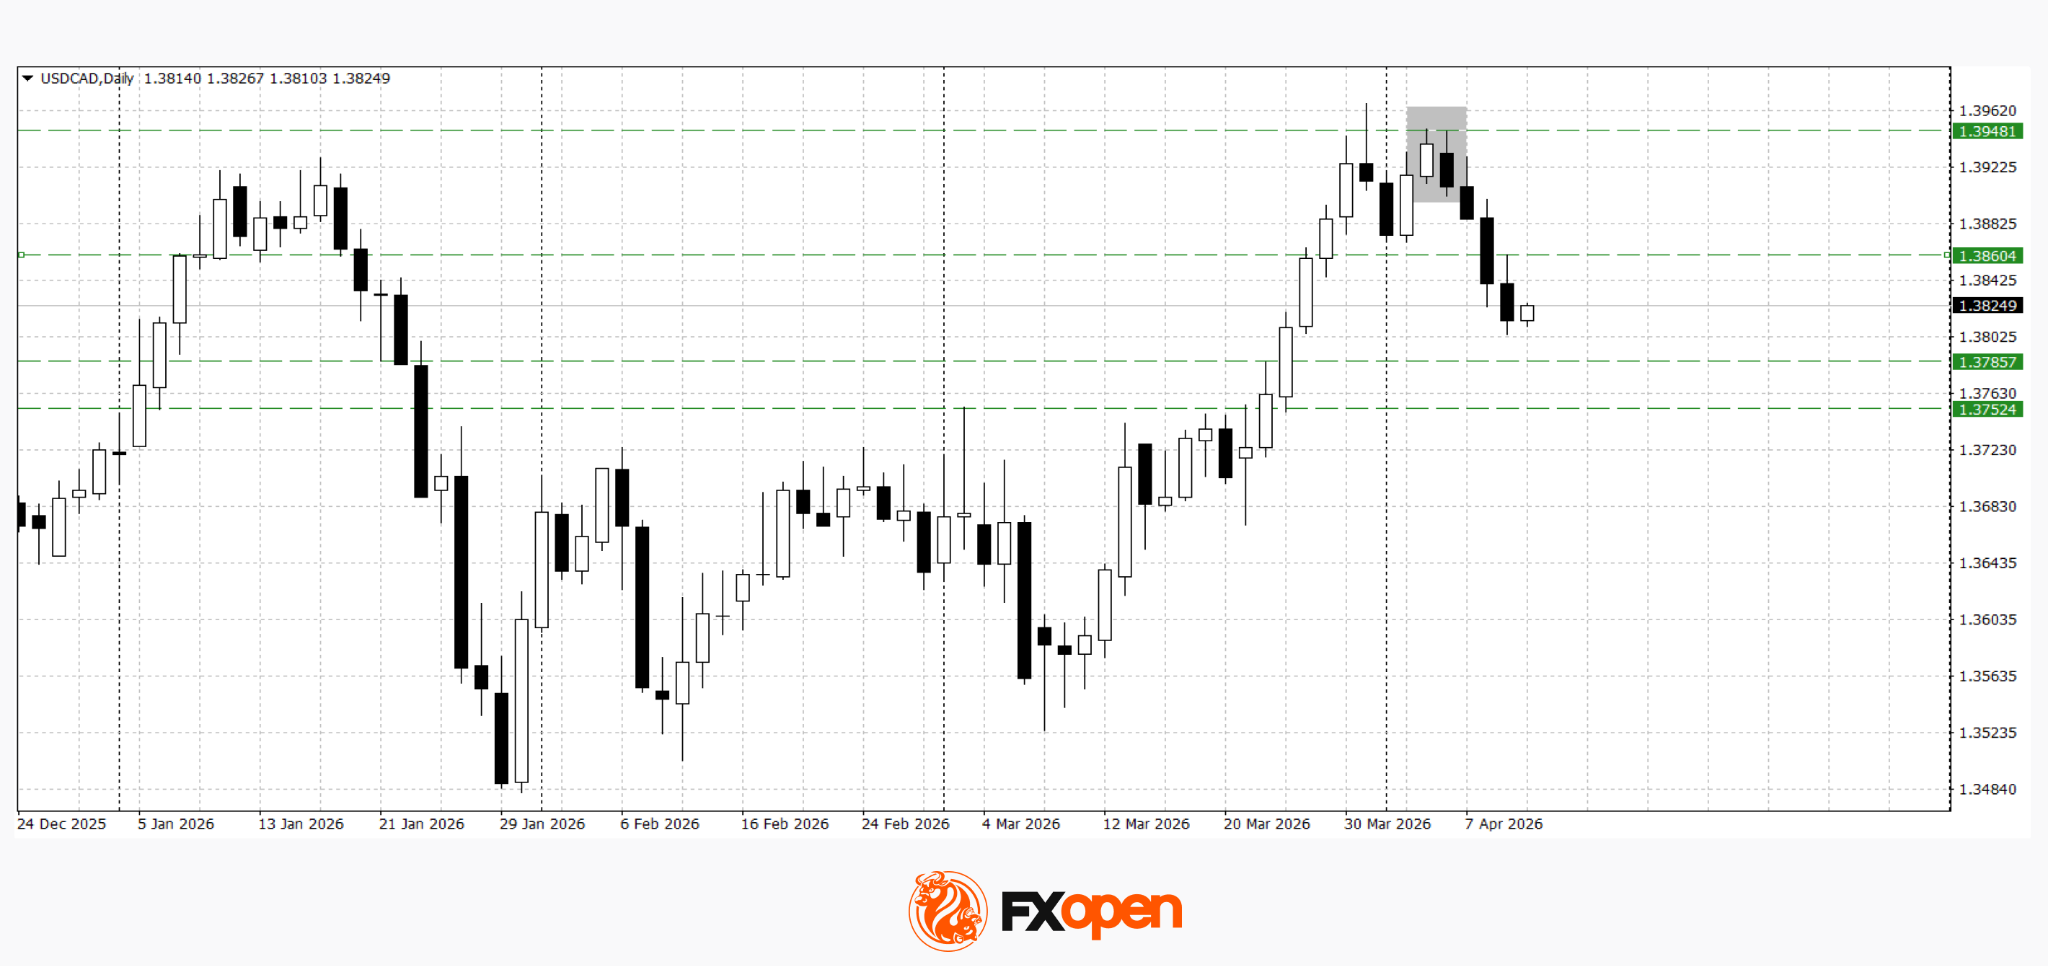
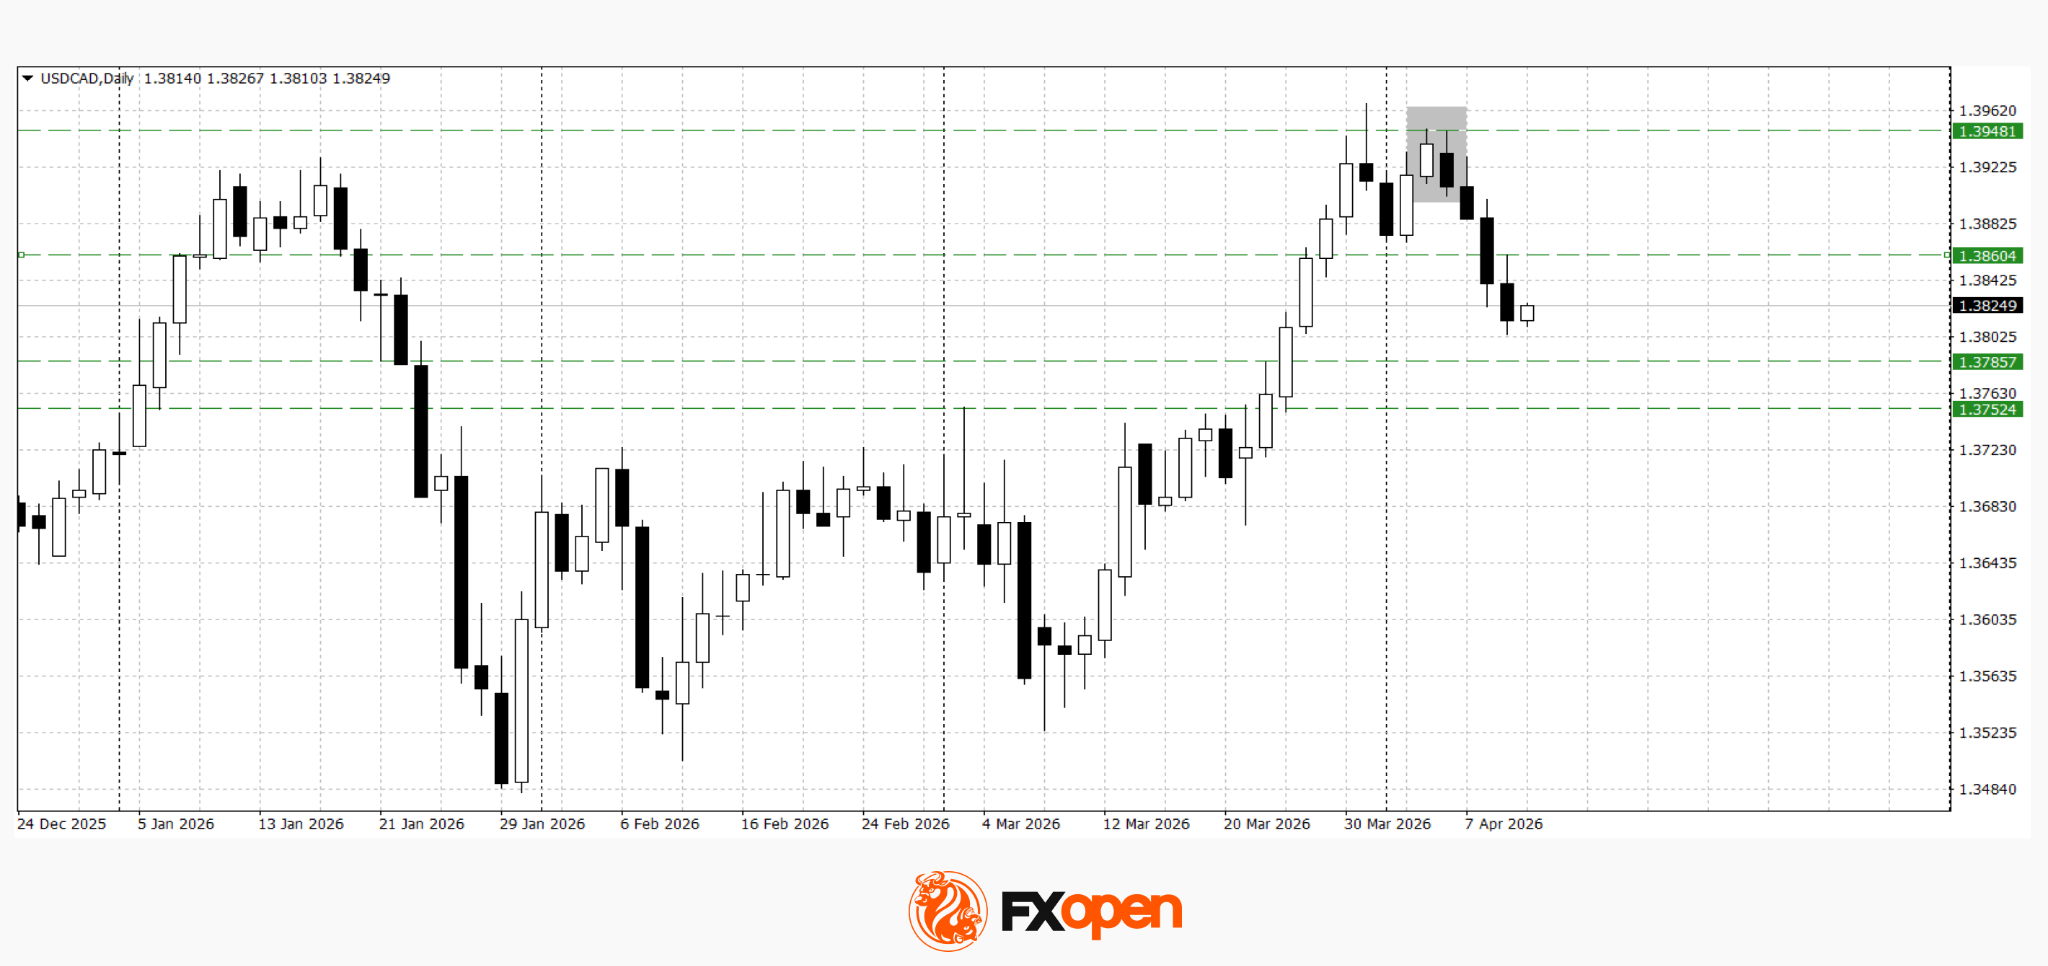
USD/CAD
USD/CAD is trending lower, continuing the move driven by Canadian dollar strength. The downside breakout reflects a shift in favour of commodity currencies, supported by both the broader macro backdrop and expectations ahead of key Canadian data, including the employment report.
Technical analysis suggests a potential decline towards the 1.3750–1.3780 range, as several reversal patterns have formed on the daily timeframe. The bearish outlook would be invalidated if the pair rises and holds above 1.3860.
Key events for USD/CAD:
- Today at 15:30 (GMT+3): Canada unemployment rate
- Today at 15:30 (GMT+3): average hourly wages (permanent employees)
- Today at 22:30 (GMT+3): CFTC net speculative positions in crude oil
The strength in commodity currencies is being driven by a combination of easing geopolitical risks, a weaker US dollar, and rising demand for risk assets. Breakouts in AUD/USD and USD/CAD reinforce the likelihood of trend continuation; however, upcoming US and Canadian data remain a key source of uncertainty. Depending on the outcome, the current momentum may either extend or shift into a phase of consolidation.
Trade over 50 forex markets 24 hours a day with FXOpen. Take advantage of low commissions, deep liquidity, and spreads from 0.0 pips (additional fees may apply). Open your FXOpen account now or learn more about trading forex with FXOpen.
This article represents the opinion of the Companies operating under the FXOpen brand only. It is not to be construed as an offer, solicitation, or recommendation with respect to products and services provided by the Companies operating under the FXOpen brand, nor is it to be considered financial advice.
Crypto World
Bitcoin Price Builds Its First Breakout Setup of April, but One Metric Dropped Over 50%
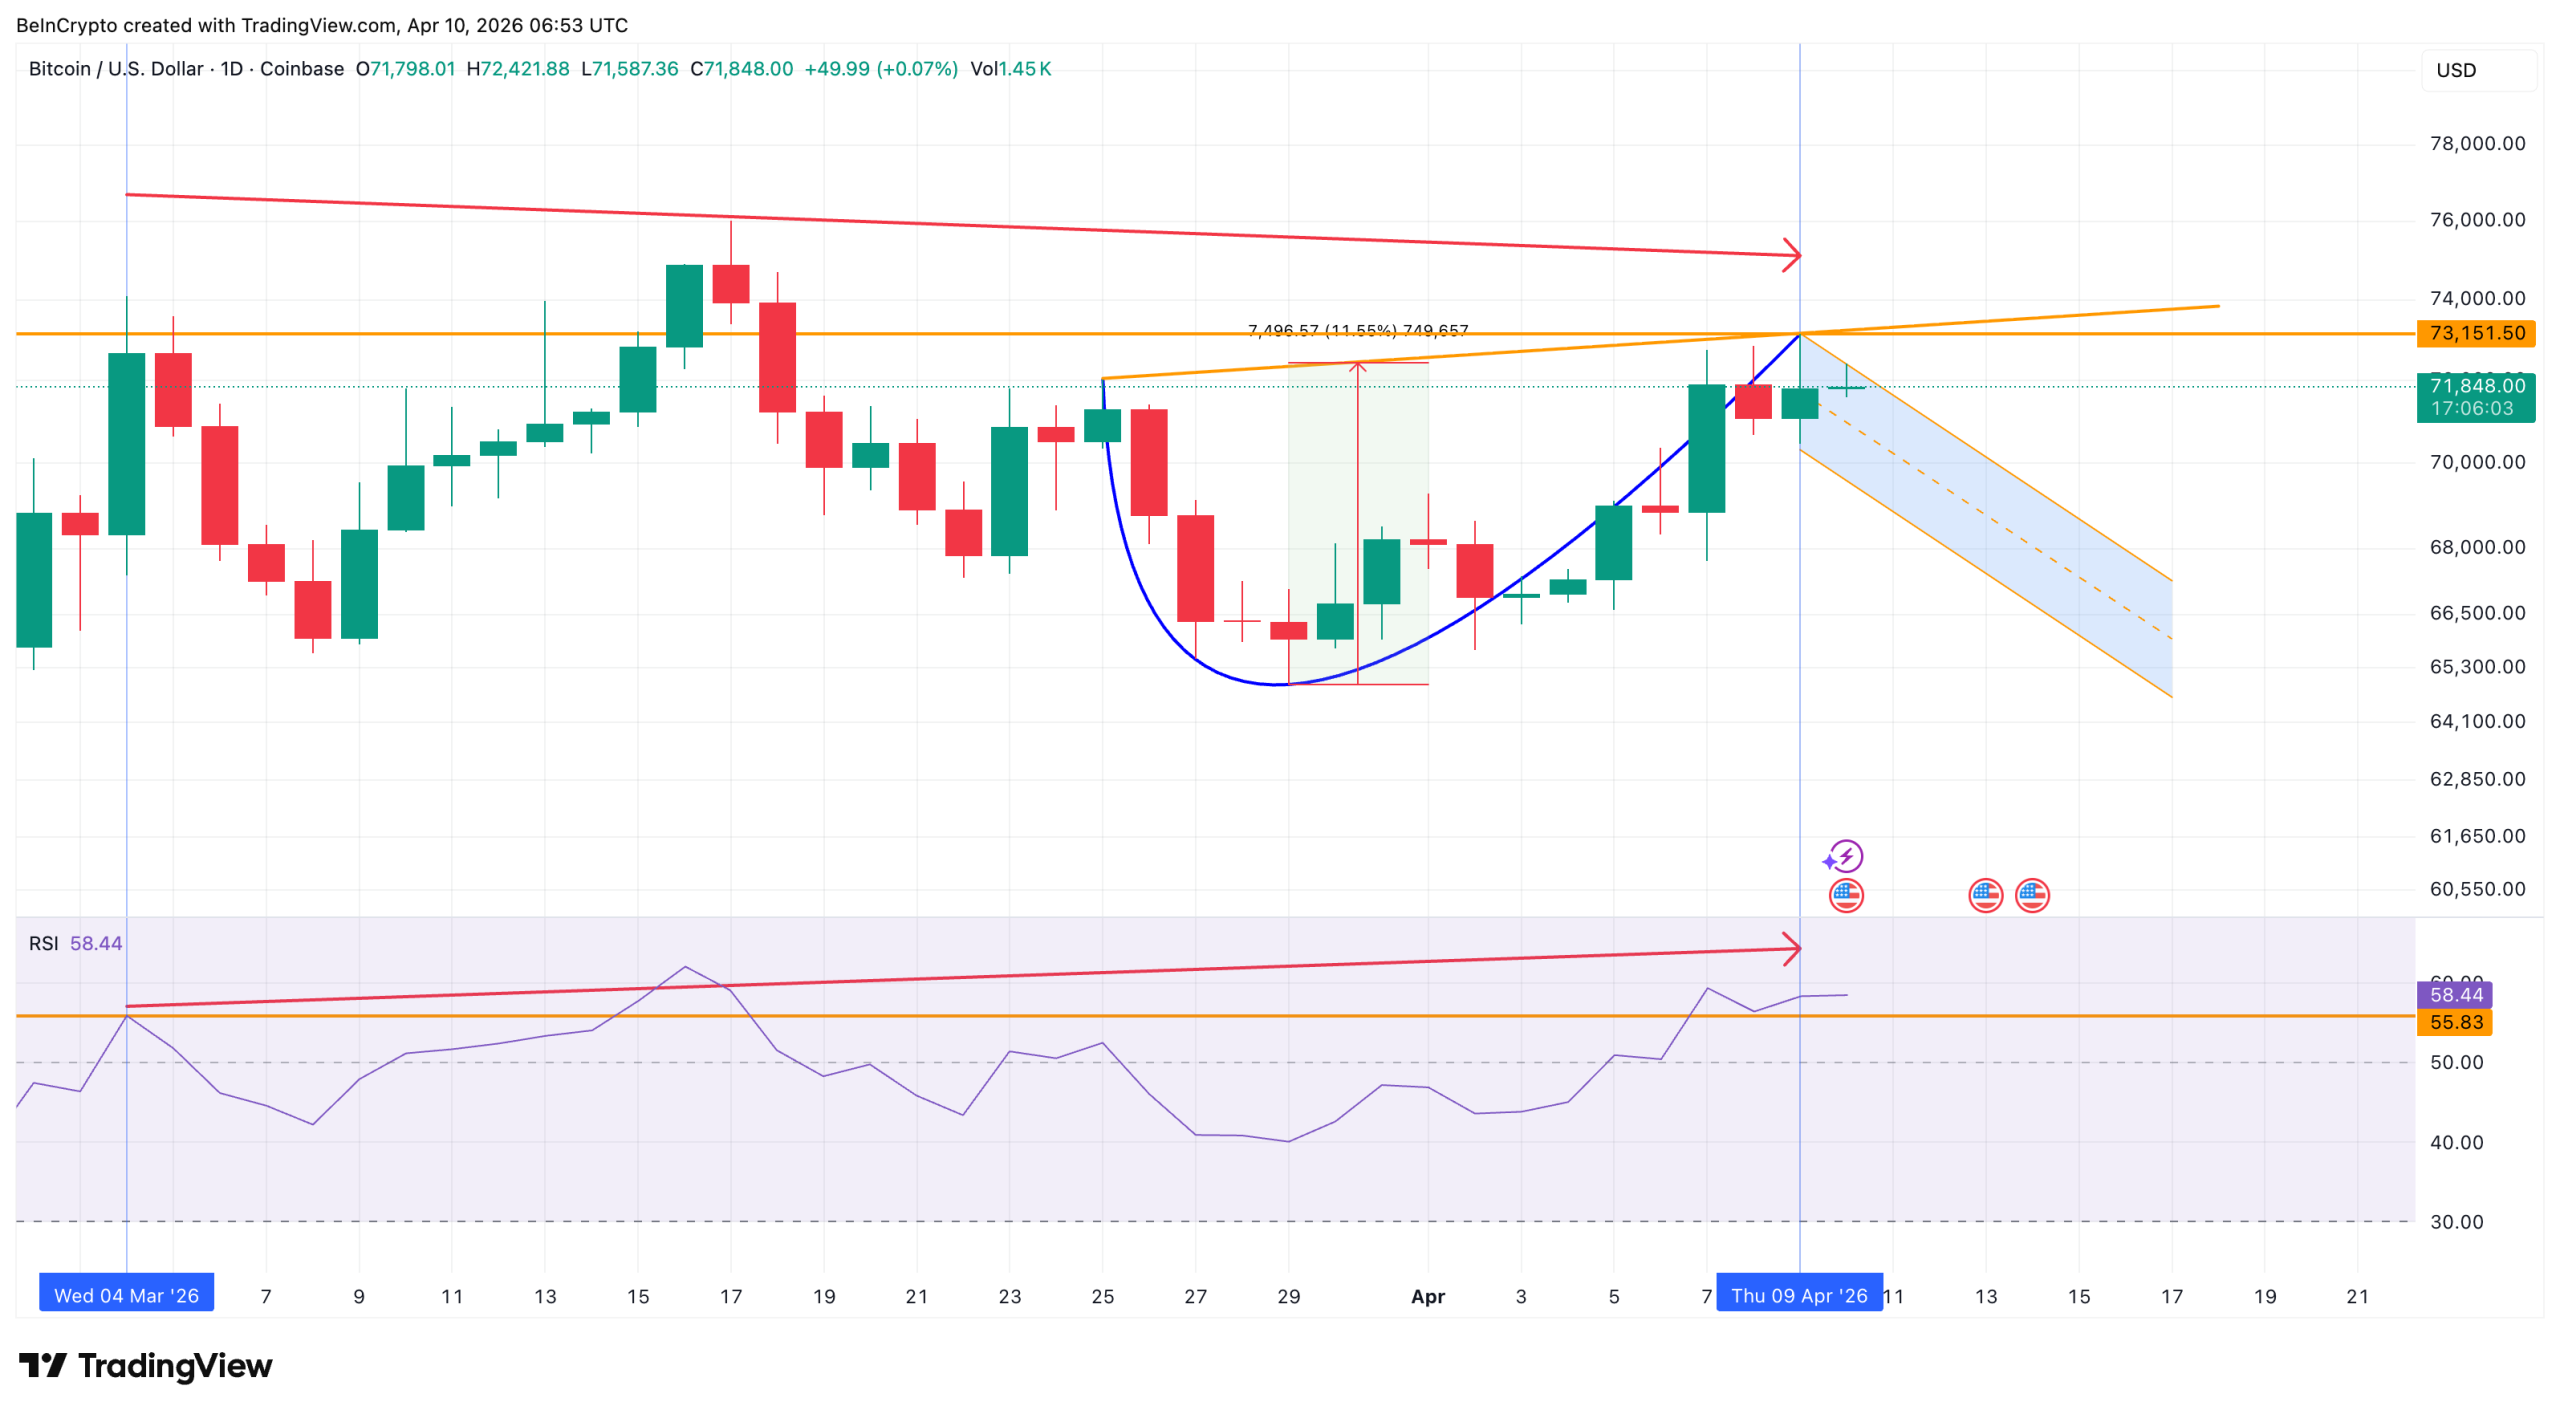
Bitcoin price today trades near $71,800, up roughly 2.9% over the past month. A bullish pattern on Bitcoin’s (BTC) daily chart now points to an 11% breakout target.
Yet the data behind the rally tells a cautious story. Bitcoin open interest has dropped, spot outflows have halved, and long-side conviction is well below earlier levels. The structure is ready. The fuel is not.
Bitcoin Price Builds Breakout Structure as RSI Hints at a Pullback
On the daily chart, the Bitcoin price has formed a clear rounded bottom pattern with a slightly upward-slanting neckline. The cup completed its formation after weeks of gradual recovery from late March lows. Since the April 9 local peak, a consolidation has started that could align with the handle if the pattern continues.
However, momentum tells similar but a more aggressive story. The Relative Strength Index (RSI), a measure of buying and selling pressure, currently sits at 58.44. Between March 4 and April 9, price printed a lower high while RSI printed a higher high. That is a hidden bearish divergence, a pattern that often hints at downtrend continuation.
Want more token insights like this? Sign up for Editor Harsh Notariya’s Daily Crypto Newsletter here.
Despite being up 2.9% month on month, BTC remains down 17% year to date. The divergence suggests the recent pullback (consolidation into handle) may have further to run before any Bitcoin breakout attempt. While the structure looks constructive, whether it stalls or accelerates depends on the derivatives and spot side.
Derivatives Cool Off and Spot Flows Weaken by More Than Half
The comparison between April 8 and today reveals how quickly conviction has faded. On April 8, when BTC traded near $72,300, total open interest stood at $27.39 billion. The BTC funding rate, which measures the cost of holding long positions, sat at 0.007%. Aggressive long bias or sentiment was driving the rally.
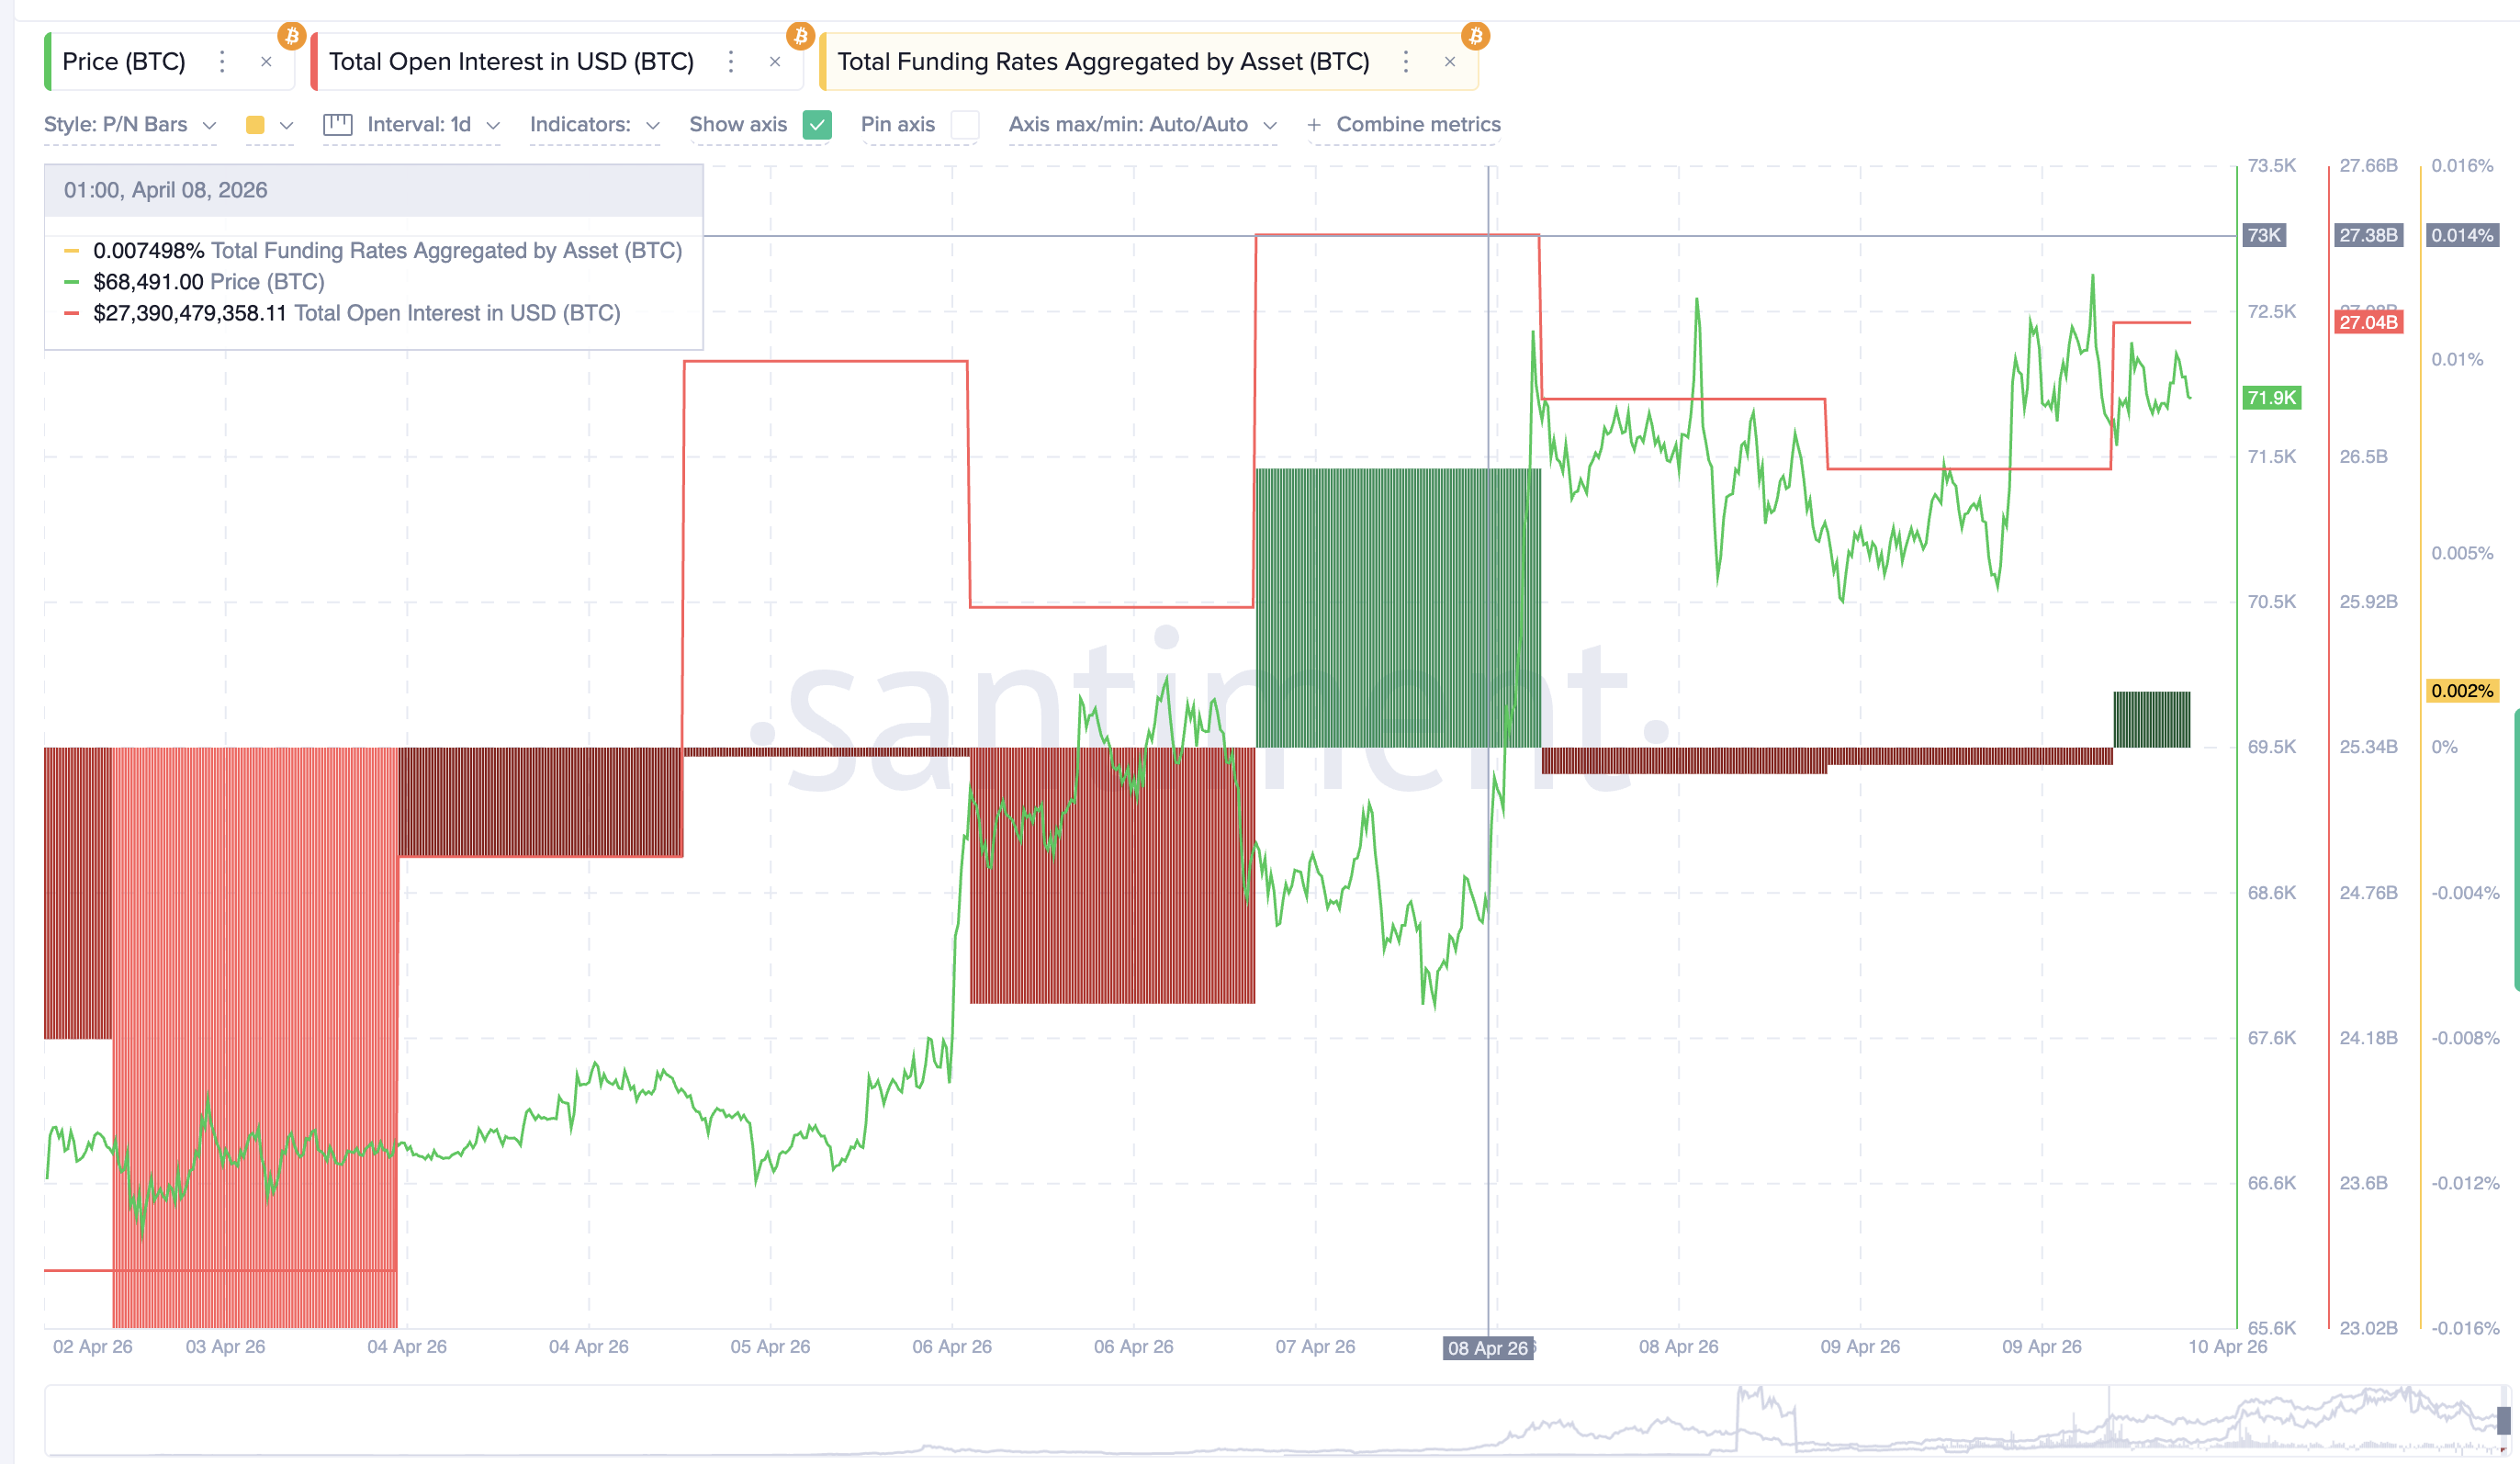
Today, at a similar price near $71,900, open interest has slipped to $27.04 billion. Funding has dropped to just 0.002%. Fewer traders are betting on further upside at these levels. That absence of leverage is a double-edged sword. It means less fuel to push higher, but it also means fewer positions to liquidate if prices drop as the sentiment is still long-biased.
Meanwhile, Bitcoin exchange flows confirm the spot side is weakening too, alongside bullish sentiment. Glassnode data shows the exchange net position change, a metric that tracks exchange flows, peaked at negative 80,352 BTC on March 26. The metric tracks tokens moving in and out of exchanges. That figure has since dropped to negative 36,221 on April 9, a decline of over 50%.
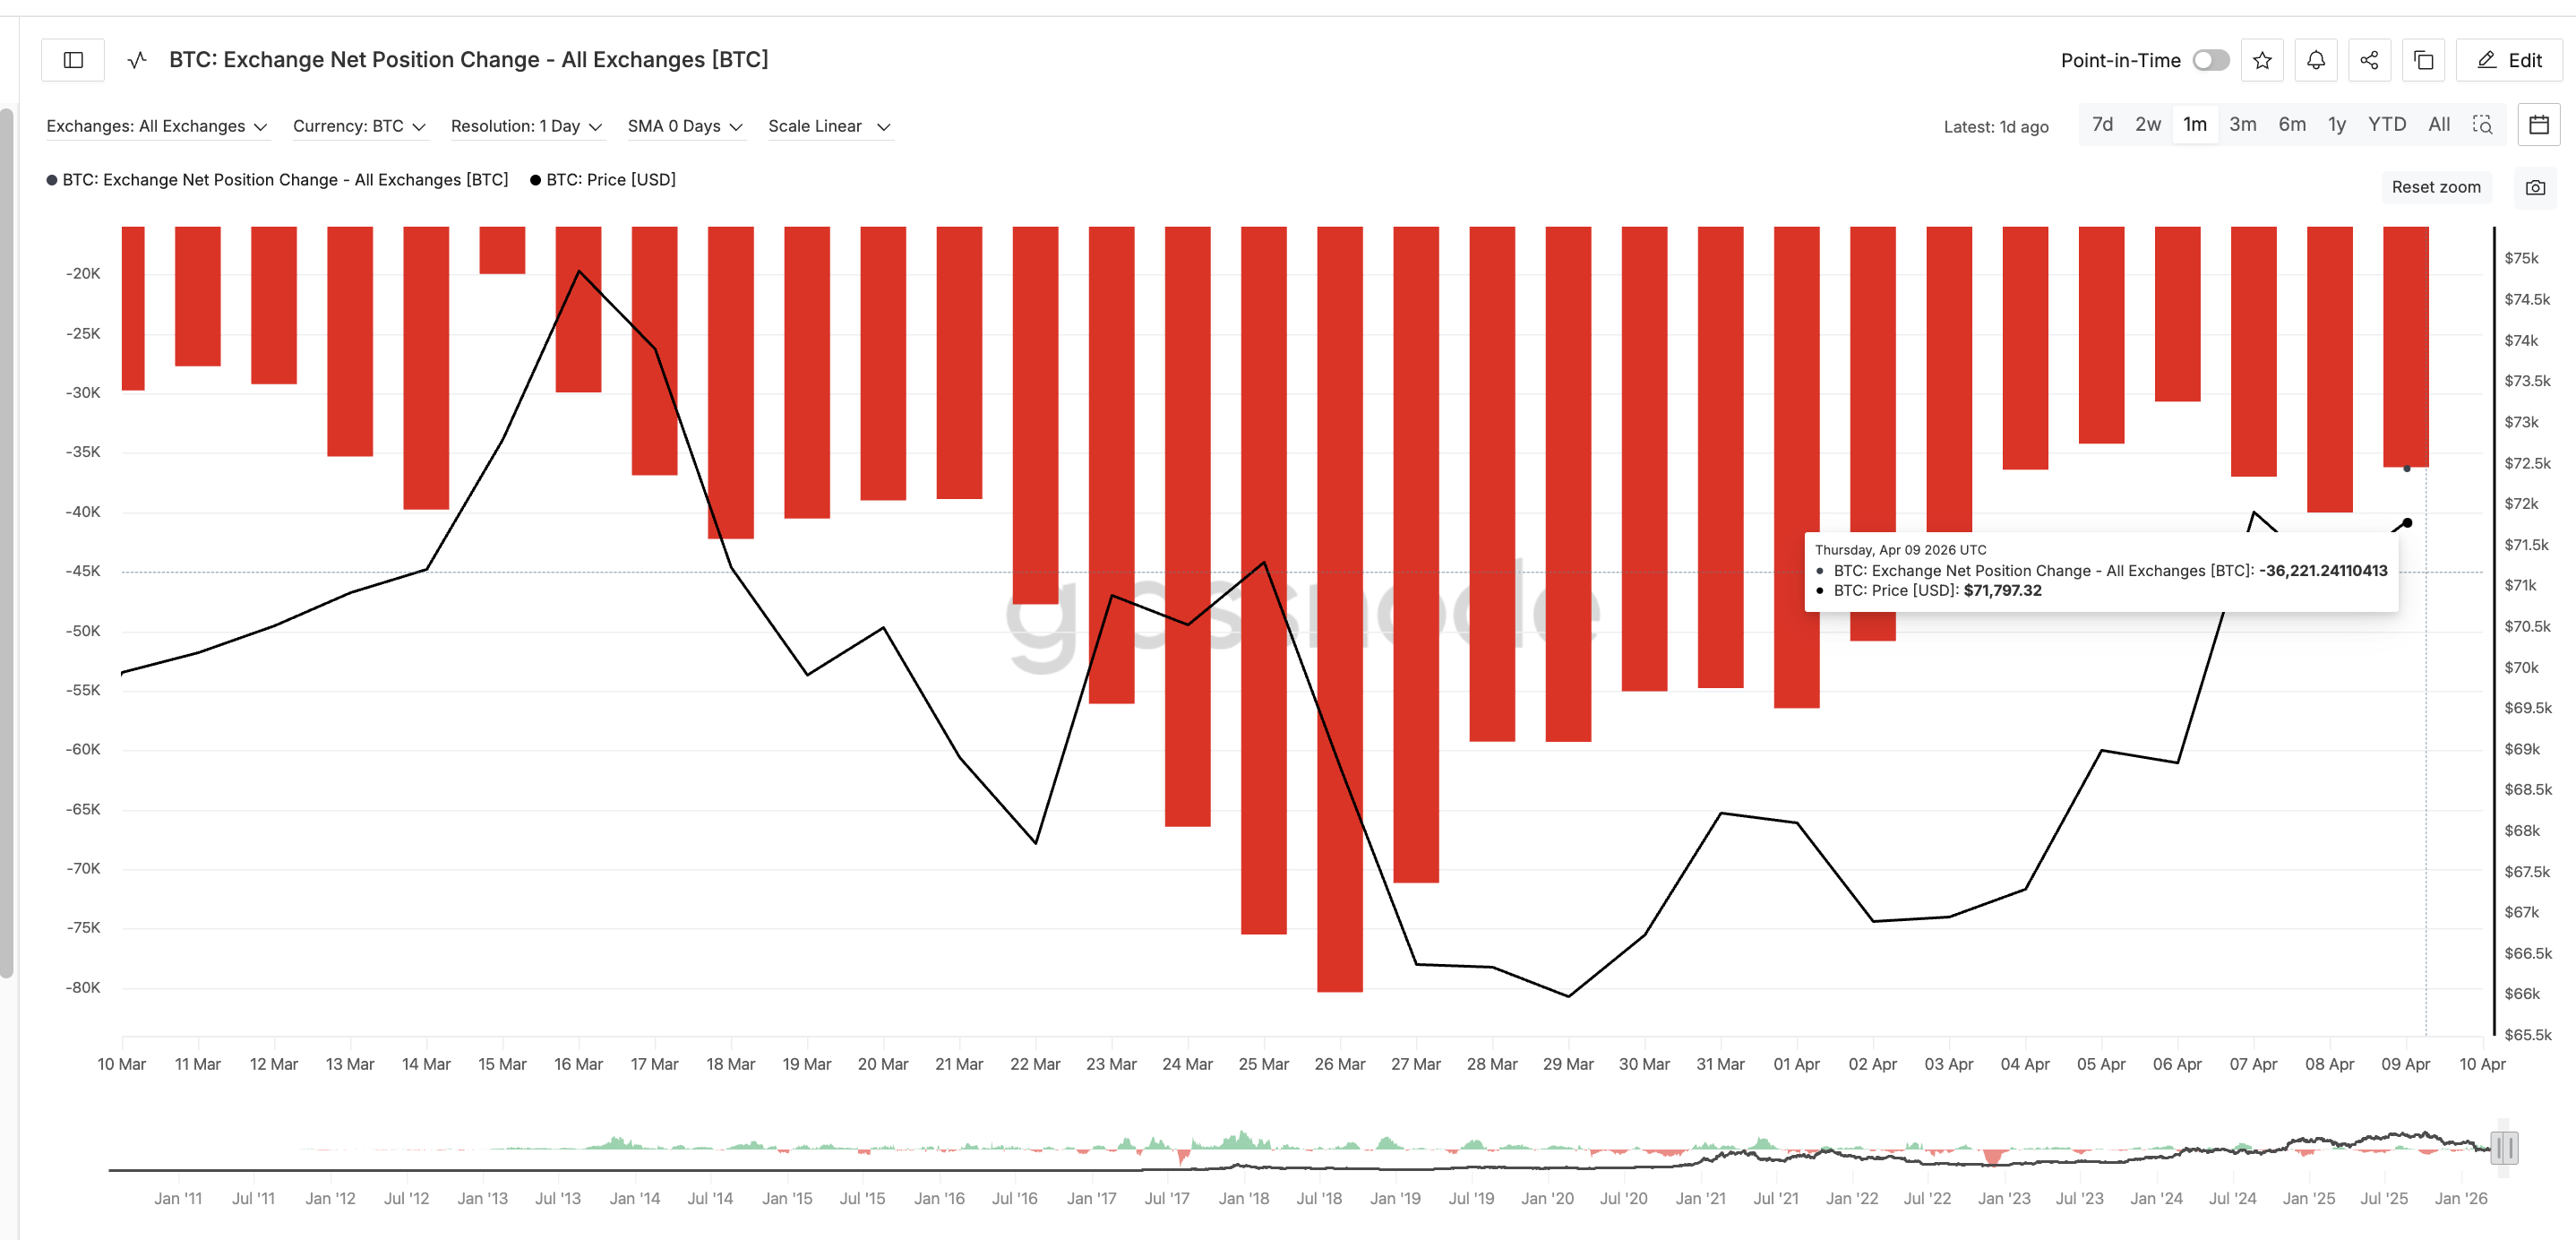
During the March 22 to March 25 rally from $67,860 to $71,303, exchange outflows were at their strongest. Yet as prices approach similar territory now, spot buyers are not showing the same urgency. The breakout structure exists. The question is whether enough conviction remains to push through.
Bitcoin Price Levels Where Conviction Must Show Up
The daily BTC chart with Fibonacci levels maps the exact zone where the pattern resolves. Bitcoin price prediction models center on the $73,151 to $73,240 range. That is where the neckline of the rounded bottom and the 0.618 Fibonacci retracement converge.
A clean daily close above $73,240 would confirm the breakout. The measured move from the pattern projects roughly 11%, which would place the target near $81,720. That level is where fresh conviction from derivatives and spot markets would need to follow through.
Yet with open interest down, funding near flat, and exchange outflows halved, the fuel gap is the primary risk. If Bitcoin price fails to reclaim $73,151, the pullback deepens as the RSI sign is still active. The first Bitcoin support level sits at $70,065. However, below that, $64,920 is the line where the entire bullish structure breaks.
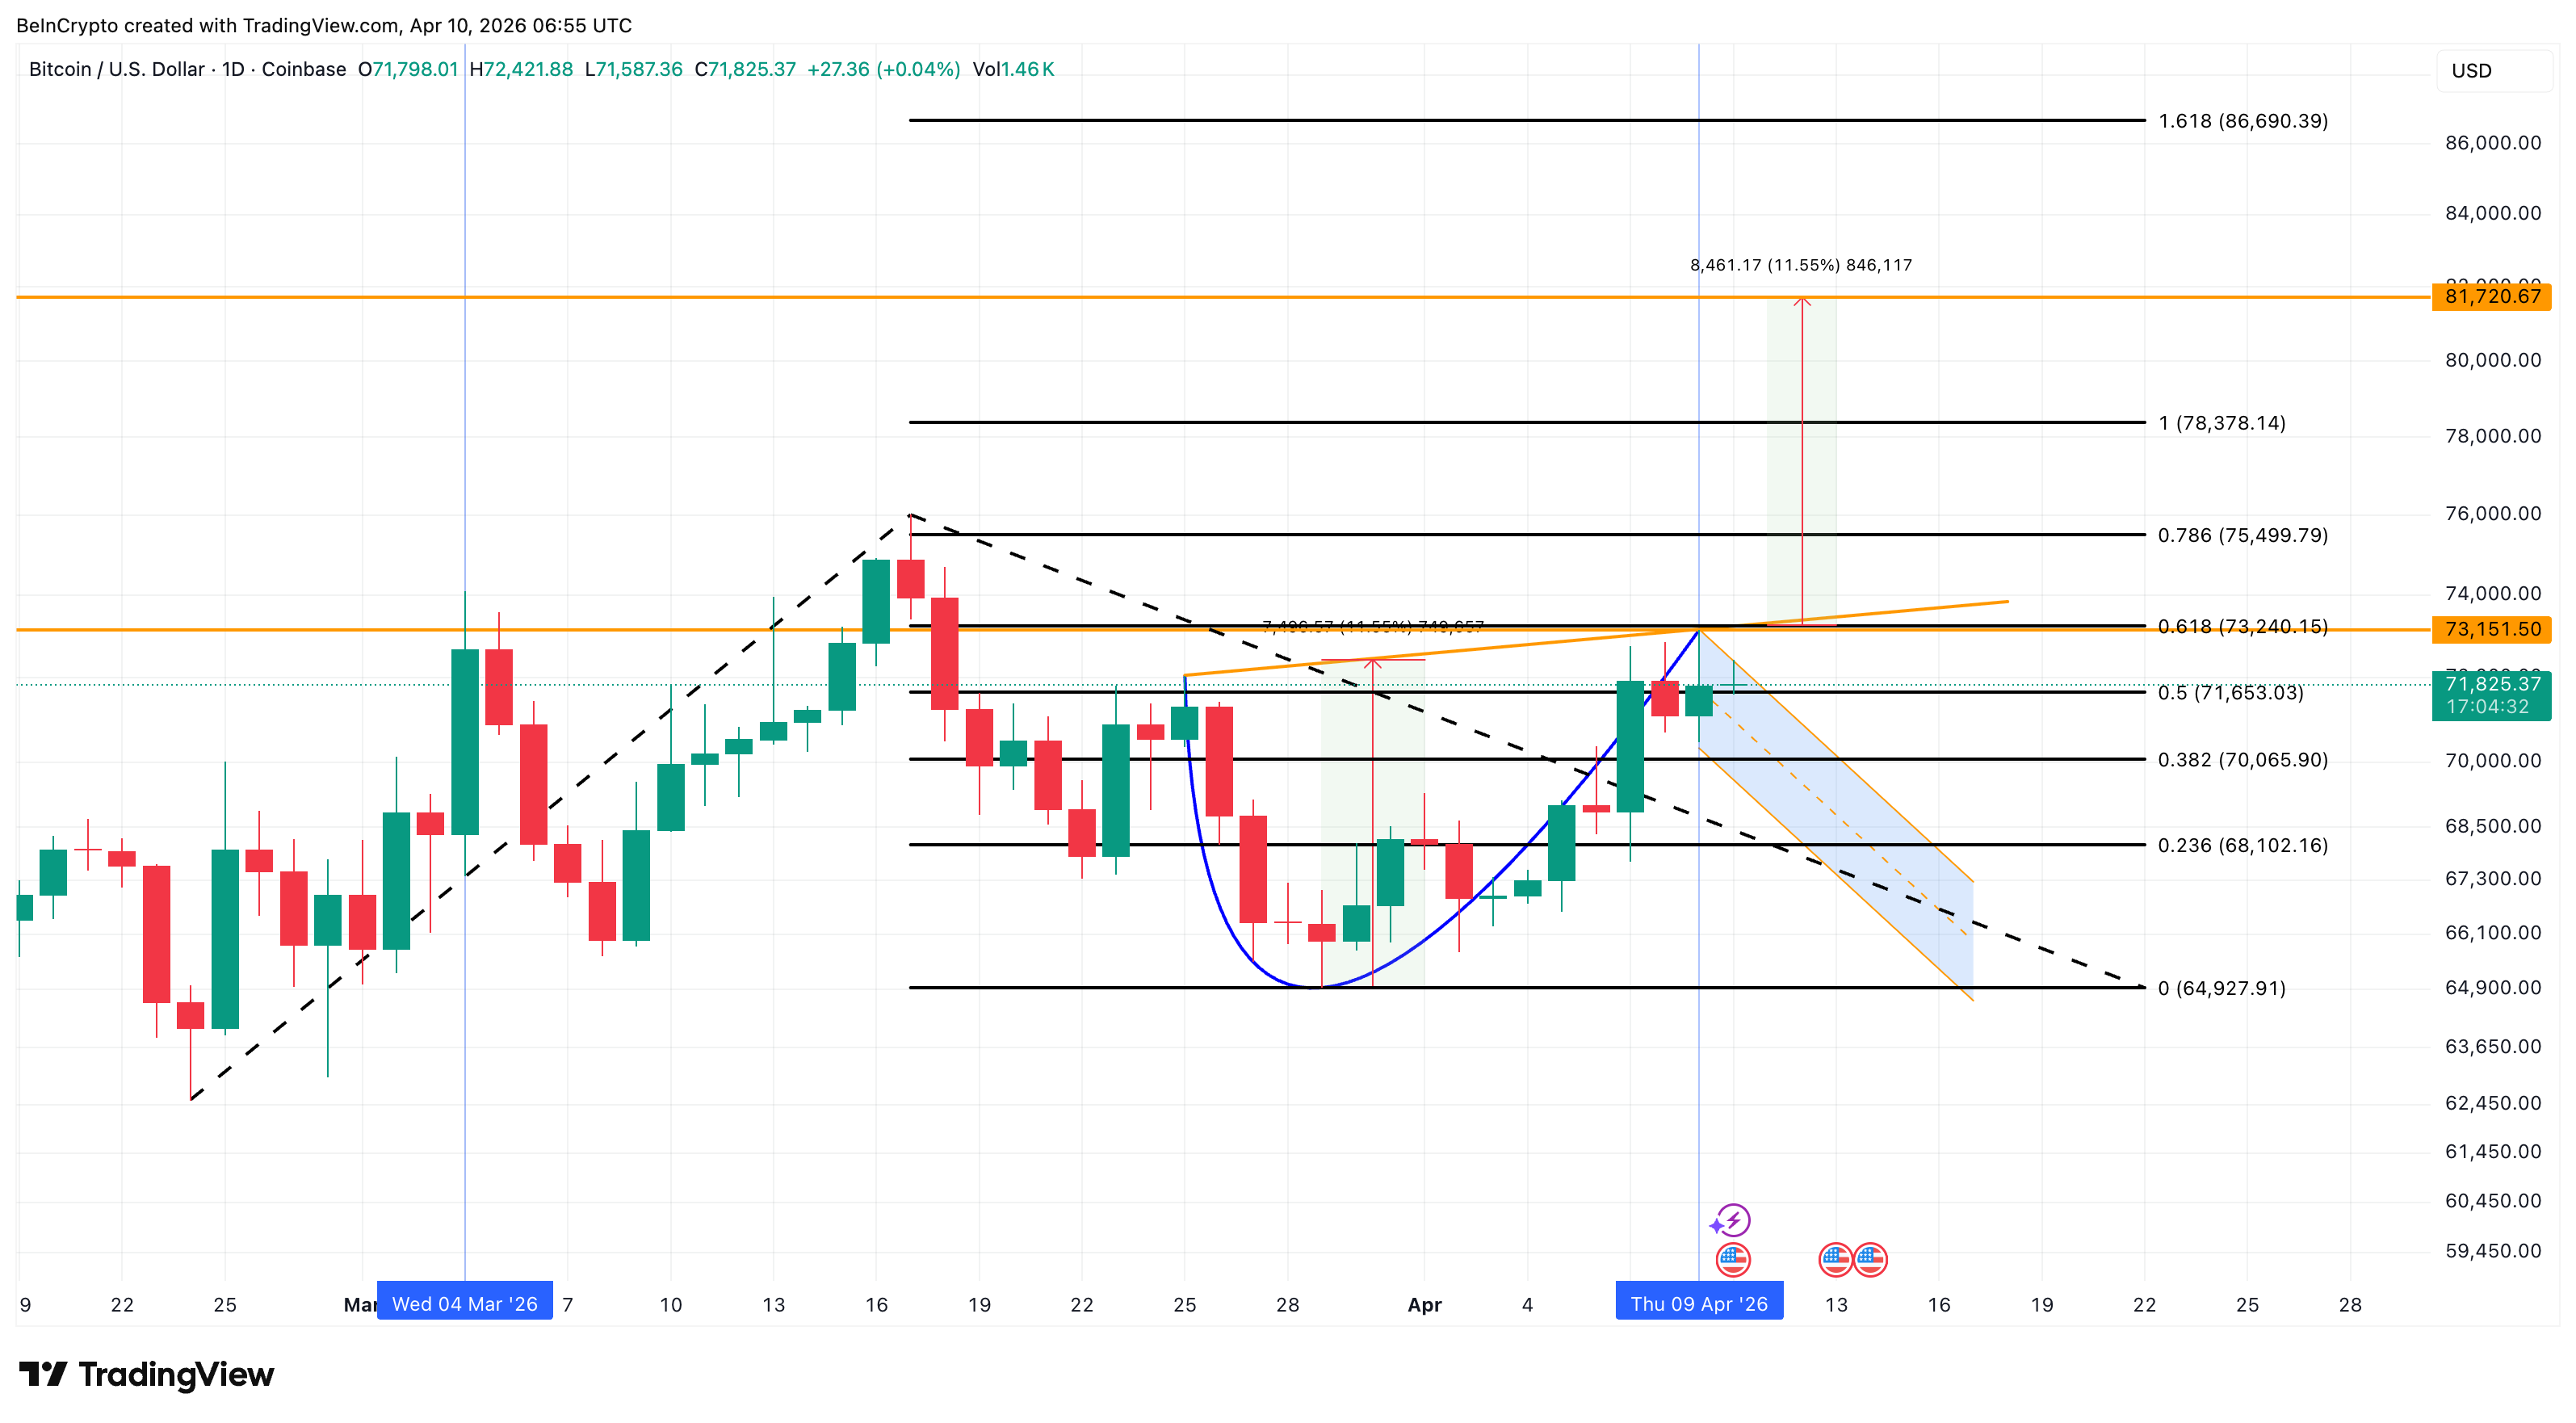
A daily close above $73,240 activates the $81,720 target and aligns structure with momentum. A rejection keeps BTC trapped below its neckline for now. And in the absence of massive leverage and clear directional bias, BTC could then continue trading in a range.
The post Bitcoin Price Builds Its First Breakout Setup of April, but One Metric Dropped Over 50% appeared first on BeInCrypto.

TLDR:
- Ethereum 7-day SMA for total transfer count has crossed 1.3M, matching its mid-February ATH.
- ETH price remains near $2,100, creating a bullish divergence from record-high on-chain activity.
- DeFi protocols, Layer 2 solutions, and smart contracts are driving the surge in transfer volume.
- Rising gas consumption accelerates ETH burns, tightening supply and adding long-term price support.
Ethereum network activity has reached a new all-time high, with the 7-day Simple Moving Average for total transfer count surpassing 1.3 million.
This level was last recorded in mid-February. At the same time, ETH’s price continues to trade near $2,100, well below historical highs.
The contrast between record on-chain usage and subdued price action has drawn growing attention from market watchers who see the gap as a meaningful mid-term signal.
On-Chain Data Confirms Robust Network Utility
The return to all-time high transfer counts reflects a network that is expanding in actual use. Data shows that Ethereum is being actively transacted upon, not simply held as a passive asset. This distinction carries weight when assessing the blockchain’s fundamental health.
DeFi protocols, Layer 2 scaling solutions, and broader smart contract activity are largely behind the surge. Each of these categories contributes meaningfully to the daily volume of transfers recorded on the network. Together, they point to an ecosystem that continues to grow in depth and reach.
On-chain analyst CryptoOnchain shared the data publicly, stating that the ATH in transfer count confirms organic, real-world demand.
The analyst noted that the Ethereum blockchain is being utilized at a peak level across multiple verticals. This kind of activity is widely regarded as a core measure of network health.
Ethereum’s built-in fee-burning mechanism adds another layer to this picture. As transfer volumes rise, gas consumption increases, and more ETH is removed from the circulating supply. This process, by design, produces a steady and structural deflationary effect on the asset over time.
Price-Activity Divergence Draws Attention From Analysts
The most closely watched aspect of the current data is the gap between ETH’s price and its on-chain activity. Transfer counts are at an all-time high, yet the price remains well below its previous peaks. Analysts refer to this setup as a bullish divergence, where fundamentals outpace market valuation.
Historically, price and on-chain utility have tended to converge over time. When network usage expands at a faster pace than price, recoveries have followed in subsequent periods. Analysts are monitoring this current divergence closely as ETH holds near the $2,100 range.
CryptoOnchain further noted that the network’s intrinsic utility is growing faster than its current market valuation. The analyst added that if the high-transfer-count trend continues, a price move toward those fundamentals remains likely in the mid-term. This view is grounded entirely in on-chain data, not speculative projections.
The accelerating burn rate tied to high gas consumption also adds a supply-side dynamic worth tracking. As more ETH is burned through increased activity, the circulating supply continues to tighten. Traders and analysts are watching both the transfer data and supply metrics for continued directional signals.

Crypto World
Zoomex Launches $150,000 BTC Airdrop Campaign, Giving Users a Chance to Earn Their First Bitcoin


As Bitcoin market activity continues to gain momentum and trading opportunities expand, global crypto derivatives exchange Zoomex has officially launched its “April BTC Airdrop Celebration” campaign. With a total reward pool of $150,000, the initiative is designed to make market participation more accessible and help users capture opportunities in the current BTC cycle.
Compared to traditional campaigns that often involve complex rules or high capital requirements, Zoomex places a stronger emphasis on simplicity and execution. The participation process has been streamlined into clear, actionable steps, allowing users to get started with minimal friction.
Lower Barriers to Entry: Helping Users Earn Their First BTC
Unlike many industry campaigns with complicated structures, this initiative follows a “simple and direct” approach, enabling users to participate with minimal learning curve:
- New users can receive rewards upon registration and deposit
- First-time depositors can unlock up to $850 in BTC airdrops
- Additional trading challenges offer ongoing opportunities to earn rewards
By simplifying the process and lowering entry barriers, Zoomex aims to address a common challenge among users—getting started. The campaign is designed to help users move from observation to participation without unnecessary complexity.
Enhanced Rewards: Introducing the BTC Mystery Box Mechanism
In addition to base airdrop rewards, Zoomex has introduced a “BTC Mystery Box” feature, with an additional prize pool of up to $300,000.
Users can unlock mystery boxes by completing tasks or participating in trading activities, with each box offering a chance to receive additional BTC rewards. This element of unpredictability not only enhances engagement but also increases the potential upside for participants.
From a design perspective, the mechanism encourages continued participation while expanding the overall reward experience.
Making Trading Easier to Start: From Complexity to Simplicity
In today’s market, the challenge for many users is not a lack of opportunities, but the absence of a clear and accessible way to begin.
Through this campaign, Zoomex simplifies the core journey—registration, deposit, and trading—into a more intuitive flow. With a unified account system and USDT-based trading, users can start trading without the need for asset transfers or complex configurations.
Fernando, Marketing Director at Zoomex, commented:
“Many users are not unwilling to trade—they’re held back by complicated processes.”
“Instead of adding more features, we focus on removing steps, so users can start their first trade more naturally.”
“Once users complete their first trade, continued engagement tends to follow more organically. That’s the core idea behind how we design both our product and campaigns.”
About ZOOMEX
Founded in 2021, Zoomex is a global cryptocurrency trading platform with over 3 million users across more than 35 countries and regions, offering 700+ trading pairs. Guided by its core values of “Simple × User-Friendly × Fast,” Zoomex is also committed to the principles of fairness, integrity, and transparency, delivering a high-performance, low-barrier, and trustworthy trading experience.
Powered by a high-performance matching engine and transparent asset and order displays, Zoomex ensures consistent trade execution and fully traceable results. This approach reduces information asymmetry and allows users to clearly understand their asset status and every trading outcome. While prioritizing speed and efficiency, the platform continues to optimize product structure and overall user experience with robust risk management in place.
As an official partner of the Haas F1 Team, Zoomex brings the same focus on speed, precision, and reliable rule execution from the racetrack to trading. In addition, Zoomex has established a global exclusive brand ambassador partnership with world-class goalkeeper Emiliano Martínez. His professionalism, discipline, and consistency further reinforce Zoomex’s commitment to fair trading and long-term user trust.
In terms of security and compliance, Zoomex holds regulatory licenses including Canada MSB, U.S. MSB, U.S. NFA, and Australia AUSTRAC, and has successfully passed security audits conducted by blockchain security firm Hacken. Operating within a compliant framework while offering flexible identity verification options and an open trading system, Zoomex is building a trading environment that is simpler, more transparent, more secure, and more accessible for users worldwide.
For more info: ZOOMEX Website | X | Telegram | Discord
The post Zoomex Launches $150,000 BTC Airdrop Campaign, Giving Users a Chance to Earn Their First Bitcoin appeared first on BeInCrypto.

Binance co-founder Changpeng “CZ” Zhao shared a long-range optimism for crypto and blockchain, arguing they will become an invisible layer of everyday infrastructure by 2031. In a recent appearance on Scott Melker’s Wolf of All Streets podcast, Zhao said that while new use cases will continue to emerge, the technology should fade from the conversation as it becomes ubiquitous in daily life. “I’m hoping that we don’t talk about crypto as crypto in five years, just like we don’t talk about the internet anymore,” he said, adding that in five years he expects to be using crypto rather than discussing the technology itself.
Beyond his own timeline, Zhao tied the future of crypto to broader adoption trends, AI-driven acceleration, and national policy choices. The discussion touched on a cascade of forecasts from research firms and industry figures that paint a picture of a rapidly expanding ecosystem where stablecoins, tokenization, and AI-enabled tooling could reshape how finance and data markets operate.
Key takeaways
- Long-run vision: CZ envisions a future where crypto is ubiquitous and no longer discussed as a separate technology, much like the everyday use of the internet.
- Growing adoption and outsized market forecasts: DemandSage cites hundreds of millions of crypto users by the end of the decade, while ARK Invest and others project multi-trillion-dollar outcomes for digital assets in the 2030s.
- Stablecoins and tokenization on the path to scale: Chainalysis and Citi highlight potential surges in stablecoin volumes and cross-border/tokenized post-trade activity amid a broader shift in market infrastructure.
- AI as a catalyst for development: Zhao sees AI accelerating blockchain development and adoption, with crypto playing a key role in AI-enabled ecosystems.
- Policy and geography as competitive levers: Switzerland’s crypto-friendly stance and UAE’s AI-led adoption, alongside US leadership in AI infrastructure, frame a fragmented but converging global landscape.
The optimistic trajectory: 2030 and beyond
The interview sits within a chorus of expectations about crypto’s role in the global economy. DemandSage estimates that 559 million people worldwide will be using crypto in 2026, suggesting a broad base of participants that could fuel further institutional interest and product innovation. Meanwhile, Ark Invest has painted a bold future: a January report argues digital assets could grow into a $28 trillion market by 2030, underscoring a view that the asset class may reach a scale comparable to major financial sectors today.
Other voices add to the optimism. Reeve Collins, co-founder of Tether, has suggested a future where stablecoins become a standard medium of exchange and possibly even a foundation for most currencies by 2030. In parallel, Chainalysis has estimated that stablecoin volumes could reach as much as $1.5 quadrillion by 2035, illustrating a potential trajectory for on-chain liquidity and cross-border settlement. A Citi survey of banks and asset managers last September found that a significant share expect about one-tenth of the global post-trade market turnover to be settled in stablecoins and tokenized securities within five years, signaling a shift in how markets operate at scale.
For investors, these forecasts translate into upside potential across a spectrum of players—from wallet providers and exchanges to tokenization platforms and custodians. Yet they also raise questions about how quickly infrastructure, regulatory clarity, and off-chain data networks can keep pace with a demand signal that is already being built now.
AI as a speed supersonic for blockchain
Beyond macro adoption, Zhao highlighted AI as a key accelerant for blockchain development. He argued that the speed at which developers can write code and deploynew features will accelerate as AI agents become more integrated with crypto tooling. He has previously urged the crypto community to emphasize utility over token incentives, a stance he reiterated as AI-driven capabilities begin to reshape development cycles and product timelines.
The notion that AI could turbocharge blockchain aligns with broader industry observations. A March discussion around AI agent-enabled tokens touched on the tension between rapid innovation and meaningful utility. If AI-assisted approaches can lower friction in building decentralized applications and automating complex on-chain tasks, the resulting productivity gains could help scale networks and improve user experiences at a pace that outstrips traditional software development cycles.
Geopolitics, adoption climates, and who leads the pack
As adoption widens, the geographic and regulatory landscape remains diverse. Signzy ranked Switzerland as the most crypto-friendly country in a January evaluation, while Arkham highlighted Switzerland as a top innovating jurisdiction. The country’s regulatory posture and ecosystem maturity have been cited as favorable for early-stage and mature crypto projects alike, reinforcing the view that policy environments will matter as much as technology in determining which regions become crypto hubs.
Separately, a Microsoft AI report placed the United States at the forefront of AI infrastructure and frontier model development. Yet the study also noted that usage and practical deployment can lag behind in some regions; it singled out the United Arab Emirates as a standout in actual AI usage, underscoring how digitized, resource-rich economies can leapfrog into higher productivity with AI-enabled capabilities. The broader takeaway: national strategy and industrial policy around AI and blockchain will significantly influence who wins in a fast-evolving tech stack.
Industry observers are watching how these dynamics intersect with crypto’s evolution. The United Arab Emirates’ leadership in AI deployment and Switzerland’s crypto-friendly climate illustrate two distinct but complementary paths toward broader adoption: one anchored in public-facing, consumer-ready digital economies and the other in a regulated, institutional-friendly environment that can attract liquidity and innovation. Investors and builders will be looking for policy clarity, interoperability standards, and scalable on-ramp/off-ramp options as barriers to entry continue to shrink in many markets.
As Zhao’s long horizon suggests, the next phase of crypto’s story may be less about headlines and more about the practical integration of crypto rails into everyday infrastructure. With demand signals pointing toward substantial growth and institutional interest likely to intensify, the outcomes will depend on how quickly ecosystems can deliver secure, compliant, and user-friendly experiences at scale.
What remains uncertain, and what readers should watch next, is how quickly policymakers harmonize global standards around stablecoins, tokenized assets, and on-chain data governance; how commercial and technical ecosystems onboard mainstream users; and how AI-enabled tooling will shape the pace and direction of development across different jurisdictions. The coming years will reveal whether the industry can translate these optimistic forecasts into durable, real-world infrastructure that supports real economic activity.
Key Highlights
- SpaceX recorded a deficit approaching $5 billion during 2025, per The Information’s reporting
- Annual sales exceeded $18.5 billion throughout the year
- The deficit encompasses xAI, the AI venture from Elon Musk that SpaceX purchased in February 2025
- The aerospace company submitted confidential IPO documents in March 2026
- SpaceX aims for a public market valuation exceeding $1.75 trillion
Elon Musk’s aerospace venture SpaceX recorded a deficit approaching $5 billion throughout 2025, based on reporting from The Information, which cited individuals with knowledge of the financial data. Reuters was unable to independently confirm these numbers, and SpaceX declined to provide commentary.
The aerospace firm generated sales surpassing $18.5 billion throughout 2025. This represents an increase compared to the $15 billion to $16 billion in sales documented during the previous year, a period when the company logged approximately $8 billion in earnings.
The transition from profitability to deficit marks a dramatic financial shift. During 2024, SpaceX maintained robust earnings performance. The 2025 financial picture presents a contrasting narrative.
A primary driver behind the deficit involves SpaceX’s purchase of xAI, Elon Musk’s artificial intelligence company. The transaction concluded in February 2025, and xAI’s financial performance is now consolidated within SpaceX’s comprehensive results.
xAI was established by Musk during 2023. The company develops the Grok AI conversational platform. Integrating a venture of this magnitude into SpaceX’s accounting would inevitably impact profitability metrics.
SpaceX currently ranks as the planet’s most prolific launch services provider. The firm operates both Falcon 9 and Falcon Heavy launch vehicles, while advancing development of the Starship platform designed for deep-space exploration.
The organization has articulated objectives to enable interplanetary transportation. Additionally, it has revealed intentions to construct and operate artificial intelligence computing facilities in orbital space.
IPO Plans Target Historic $1.75 Trillion Market Cap
SpaceX submitted confidential paperwork for a U.S. public market debut in March 2026. The company seeks a market capitalization surpassing $1.75 trillion should it move forward with the share offering.
This would position it among the most substantial initial public offerings ever recorded if the listing proceeds at that valuation level. No specific timeline for the public market debut has been announced.
Sales Expansion Continues Despite Financial Loss
Notwithstanding the net deficit, sales figures expanded on an annual basis. The $18.5 billion total for 2025 compares positively against the $15 billion to $16 billion documented during 2024.
This revenue expansion demonstrates the underlying business operations are growing. Starlink, SpaceX’s orbital internet connectivity platform, has served as a significant contributor to that revenue stream.
SpaceX maintains tens of millions of Starlink customers worldwide. The network functions throughout more than 100 nations and persistently expands its user base.
The firm’s launch services division maintains robust activity levels. SpaceX executes more orbital missions than any competing commercial entity or governmental space agency globally.
The 2025 deficit primarily stems from the xAI purchase rather than challenges within the core launch and satellite divisions. The Information’s analysis did not separate xAI’s specific impact on the aggregate loss calculation.
SpaceX submitted its IPO documentation under confidential filing procedures, indicating complete financial disclosures have not yet been released through an official public prospectus.

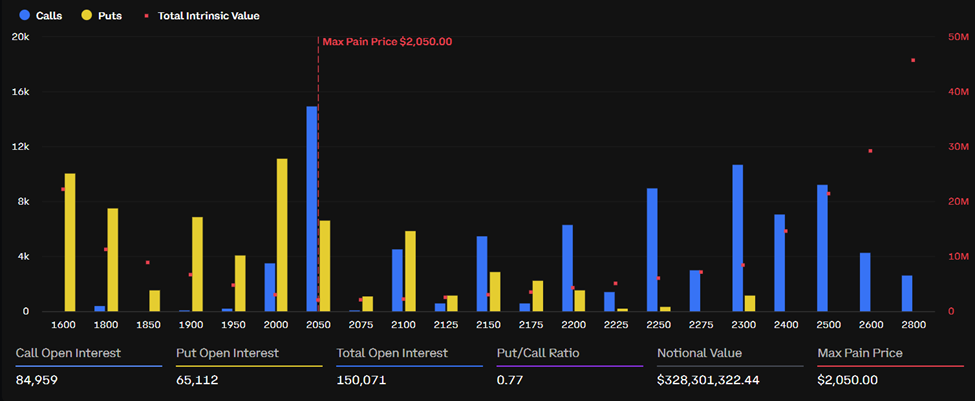
Around 26,700 Bitcoin (BTC) options contracts expire on Friday, April 10, carrying a notional value of roughly $1.9 billion. Another 151,500 Ethereum (ETH) contracts also settle today, worth approximately $332 million.
The combined expiry adds up to over $2.2 billion. However, the event is relatively small compared to the record $27 billion quarterly settlement in late 2025 and is unlikely to move spot prices on its own.
BTC Options Show Renewed Optimism Above $70,000
This week’s batch of BTC contracts has a put/call ratio of 0.71, indicating more bullish long positions than bearish shorts. Max pain sits around $69,000, according to Deribit, well below the current spot price near $71,759.
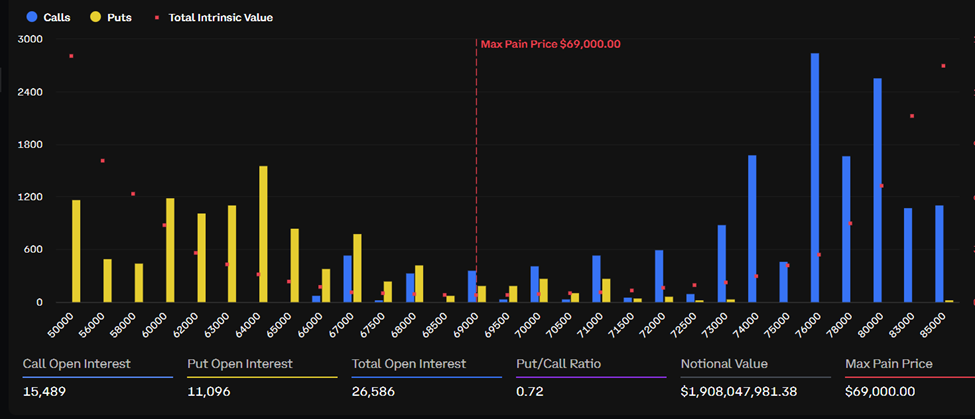
Open interest remains highest at the $80,000 strike on Deribit, with $1.6 billion in bullish bets now dominant.
Total BTC options open interest across all exchanges has pulled back to $34 billion following the end of the Q1 expiry cycle.
Traders responded to this week’s rebound by buying short-term call options and rolling put positions to higher strike prices. That repositioning reflects a more constructive outlook following BTC’s recovery above $70,000.
“Judging by key options indicators, the rebound above $70,000 has clearly boosted market sentiment, primarily by alleviating fears of a black swan-induced crash, rather than reflecting expectations of sustained price gains,” wrote analysts at Greeks.live.
ETH Derivatives Flash Rare Bullish Signal
On the Ethereum side, max pain sits at $2,050 with a put/call ratio of 0.77. Total ETH options open interest across exchanges stands near $6.6 billion.
Beyond the expiry itself, CryptoQuant analyst Darkfost flagged a recovery signal in ETH derivatives. The Taker Buy Sell Ratio on Binance has moved back into positive territory, with a monthly average around 1.016. The metric has held above 1 for several consecutive days.
This reading has not appeared since 2023. Binance accounts for over 37% of total ETH open interest, making it a key venue for reading futures positioning.
A ratio above 1 means aggressive buy orders outpace sells, signaling buyer dominance on perpetual contracts.
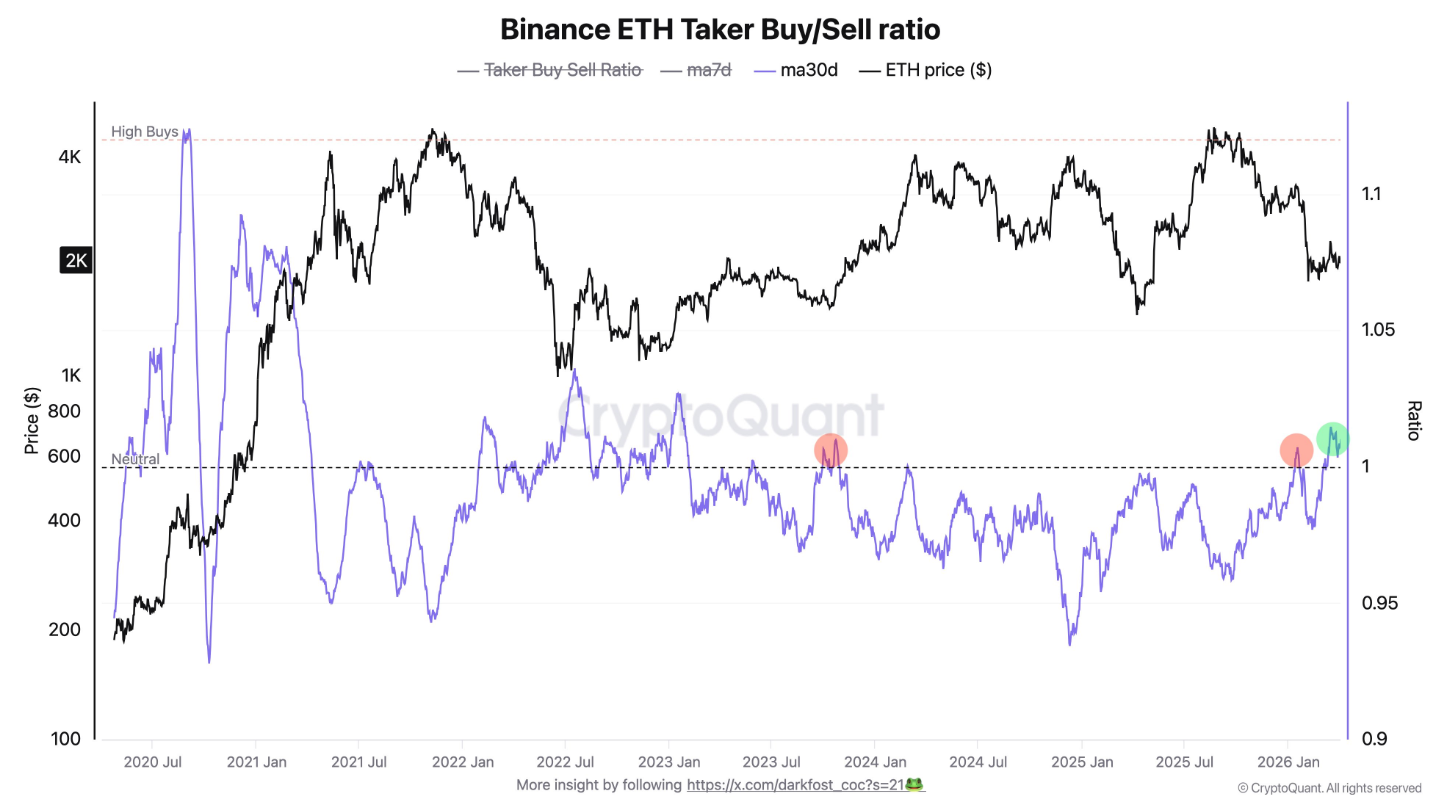
Importantly, the shift is happening gradually and without excessive spikes. That kind of steady buildup tends to be healthier in derivatives markets, which are often prone to rapid imbalances and liquidation cascades.
Combined with $90 billion added to total crypto market capitalization since Monday, the signal offers a cautiously constructive note heading into the weekend.
The post $2.2 Billion in Crypto Options Expire Today as a Hidden Ethereum Signal Resurfaces appeared first on BeInCrypto.

- XRP price has slipped after failing to hold the $1.38 resistance level.
- Momentum stays weak as volume and buying pressure remain low.
- Price is compressed between $1.32 support and $1.39 resistance.
XRP slipped back after briefly pushing toward $1.38, marking another failed attempt to break higher.
Notably, XRP has spent the past several days moving between roughly $1.32 and the upper resistance zone near $1.35–$1.39.
But each push higher has struggled to attract enough buying pressure to sustain a breakout, and as a result, the market remains stuck in a tight range, with neither bulls nor bears fully in control.
Weak momentum keeps upside in check
One of the biggest issues for XRP right now is the lack of momentum.
Even with the impressive gains, the strength behind those gains is limited. Indicators are hovering around neutral levels, showing that buyers are not stepping in aggressively.
Volume has also been inconsistent, and in some cases, it has even declined during upward moves. That is usually a warning sign that the rally may not last.
This weakness becomes even more noticeable when compared to the broader market.
Bitcoin has been leading recent gains, lifting many altcoins along with it and while XRP has followed this trend, it has not shown much independent strength of its own.
That matters because externally driven rallies tend to be fragile.
If Bitcoin slows down or pulls back, XRP could quickly lose support and fall back into its lower range.
Without a strong internal catalyst, it is difficult for XRP to break away from this pattern.
A market in compression, not in trend
While momentum remains weak, there is another side to the story that cannot be ignored.
XRP’s supply on exchanges appears to be tightening, suggesting that more holders are choosing to keep their tokens rather than sell.

At the same time, there is very little leverage in the market. Traders are not taking large speculative positions, which reduces the chances of sudden, exaggerated moves in either direction.
This combination creates what would be termed a compression phase, since the price is not moving much, volatility is shrinking, and participation is relatively low.
XRP breakout potential vs downside risk
The current setup leaves XRP at a crossroads. On one hand, the tightening supply and improving broader sentiment suggest that a breakout is possible.
On the other hand, the lack of momentum and weak participation make it difficult to trust any move higher without confirmation.
If XRP manages to hold above the $1.28–$1.31 support zone, another attempt at testing the $1.35–$1.39 resistance zone is likely.

And a decisive push above $1.39, supported by stronger trading activity, could shift sentiment and push the price towards the multi-month resistance at $1.43.
However, the downside risk is just as important. A break below the $1.32–$1.33 support zone could lead to a quicker drop, with analysts highlighting $1.28 as the next support level to watch.
If selling pressure increases further, deeper support near $1.13 could come into focus.
For now, the market is not trending but rather preparing for its next move.
The pullback from $1.38 highlights the lack of strength, but it also reinforces how tightly price is coiling, and the longer XRP remains in this range, the more meaningful the eventual breakout or breakdown is likely to be.

Geopolitical tensions in the Middle East had remained the primary macro driver for the gold market over recent weeks; however, on 8 April the situation shifted sharply as the United States and Iran agreed to a temporary two-week ceasefire, including the reopening of the Strait of Hormuz and a pause in military strikes. The easing of acute tensions triggered a sharp decline in oil prices and a return of risk appetite across global markets, weighing on demand for safe-haven assets. As a result, gold retreated from intraday highs near 4,850.
That said, the durability of the agreement remains uncertain. Reports of localised strikes in the region continue to keep market participants on edge, preventing a full dismissal of Iranian-related risks. Additional influence comes from macroeconomic data—particularly US inflation—whose interpretation in the context of Federal Reserve rate expectations continues to shape dollar dynamics. Structural support from central banks persists, with China continuing to increase its gold reserves, while Malaysia and South Korea have resumed purchases after an extended pause.
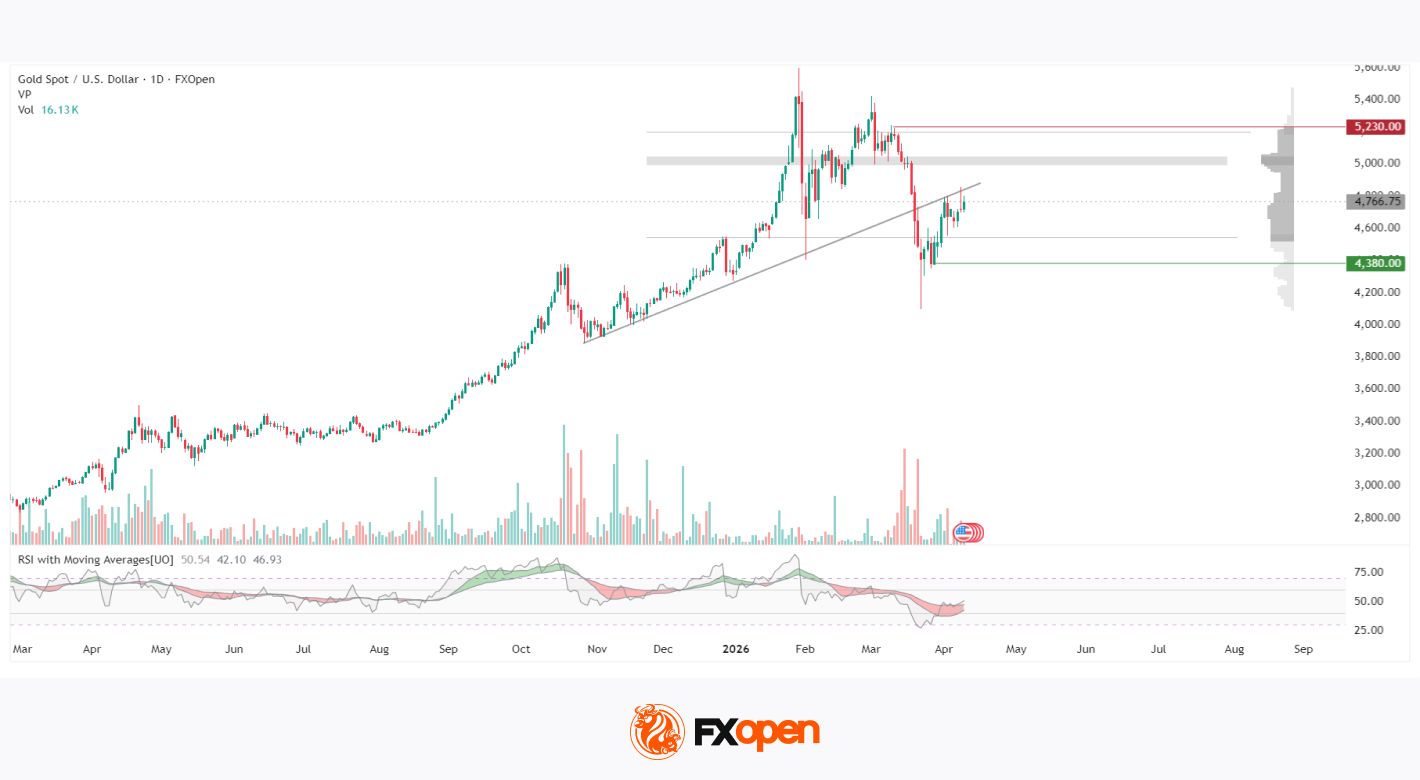
Technical Outlook
On the daily chart of XAU/USD, a clear two-phase structure is evident. An uptrend that began in March 2024 drove prices to a record high in the 5,595–5,600 range by late January 2026, followed by a sharp and impulsive decline. Notably, the peak in vertical volume occurred not at the price high, but during the subsequent sell-off in March 2026, indicating a climactic phase of selling rather than buying.
The low of that move was recorded near 4,100, from which price rebounded to current levels around 4,766. The horizontal volume profile reveals a dense cluster in the 4,990–5,050 zone, marking the point of control (POC) where trading activity has been most concentrated. This area acts as a natural resistance to further upside. The next significant level above lies at 5,230.
The ascending trend line originating from autumn 2025 was broken to the downside in March 2026 and no longer serves as support for buyers. It may now act as an additional resistance near the 5,000 level.
The lower boundary of the current range is located around 4,380. The RSI and moving averages stand at 50.54 / 42.10 / 46.93, with the RSI hovering near the neutral 50 level and remaining below both upward-sloping moving averages, signalling a lack of confirmed directional momentum.
Summary
Following the completion of an active corrective phase, gold has stabilised below the POC zone, while the RSI remains near neutral levels without a clear directional bias. The current trading range—4,380 on the downside and 5,230 on the upside—continues to define the market structure, as geopolitical developments and Federal Reserve rhetoric shape short-term price dynamics.
Start trading commodity CFDs with tight spreads (additional fees may apply). Open your trading account now or learn more about trading commodity CFDs with FXOpen.
This article represents the opinion of the Companies operating under the FXOpen brand only. It is not to be construed as an offer, solicitation, or recommendation with respect to products and services provided by the Companies operating under the FXOpen brand, nor is it to be considered financial advice.
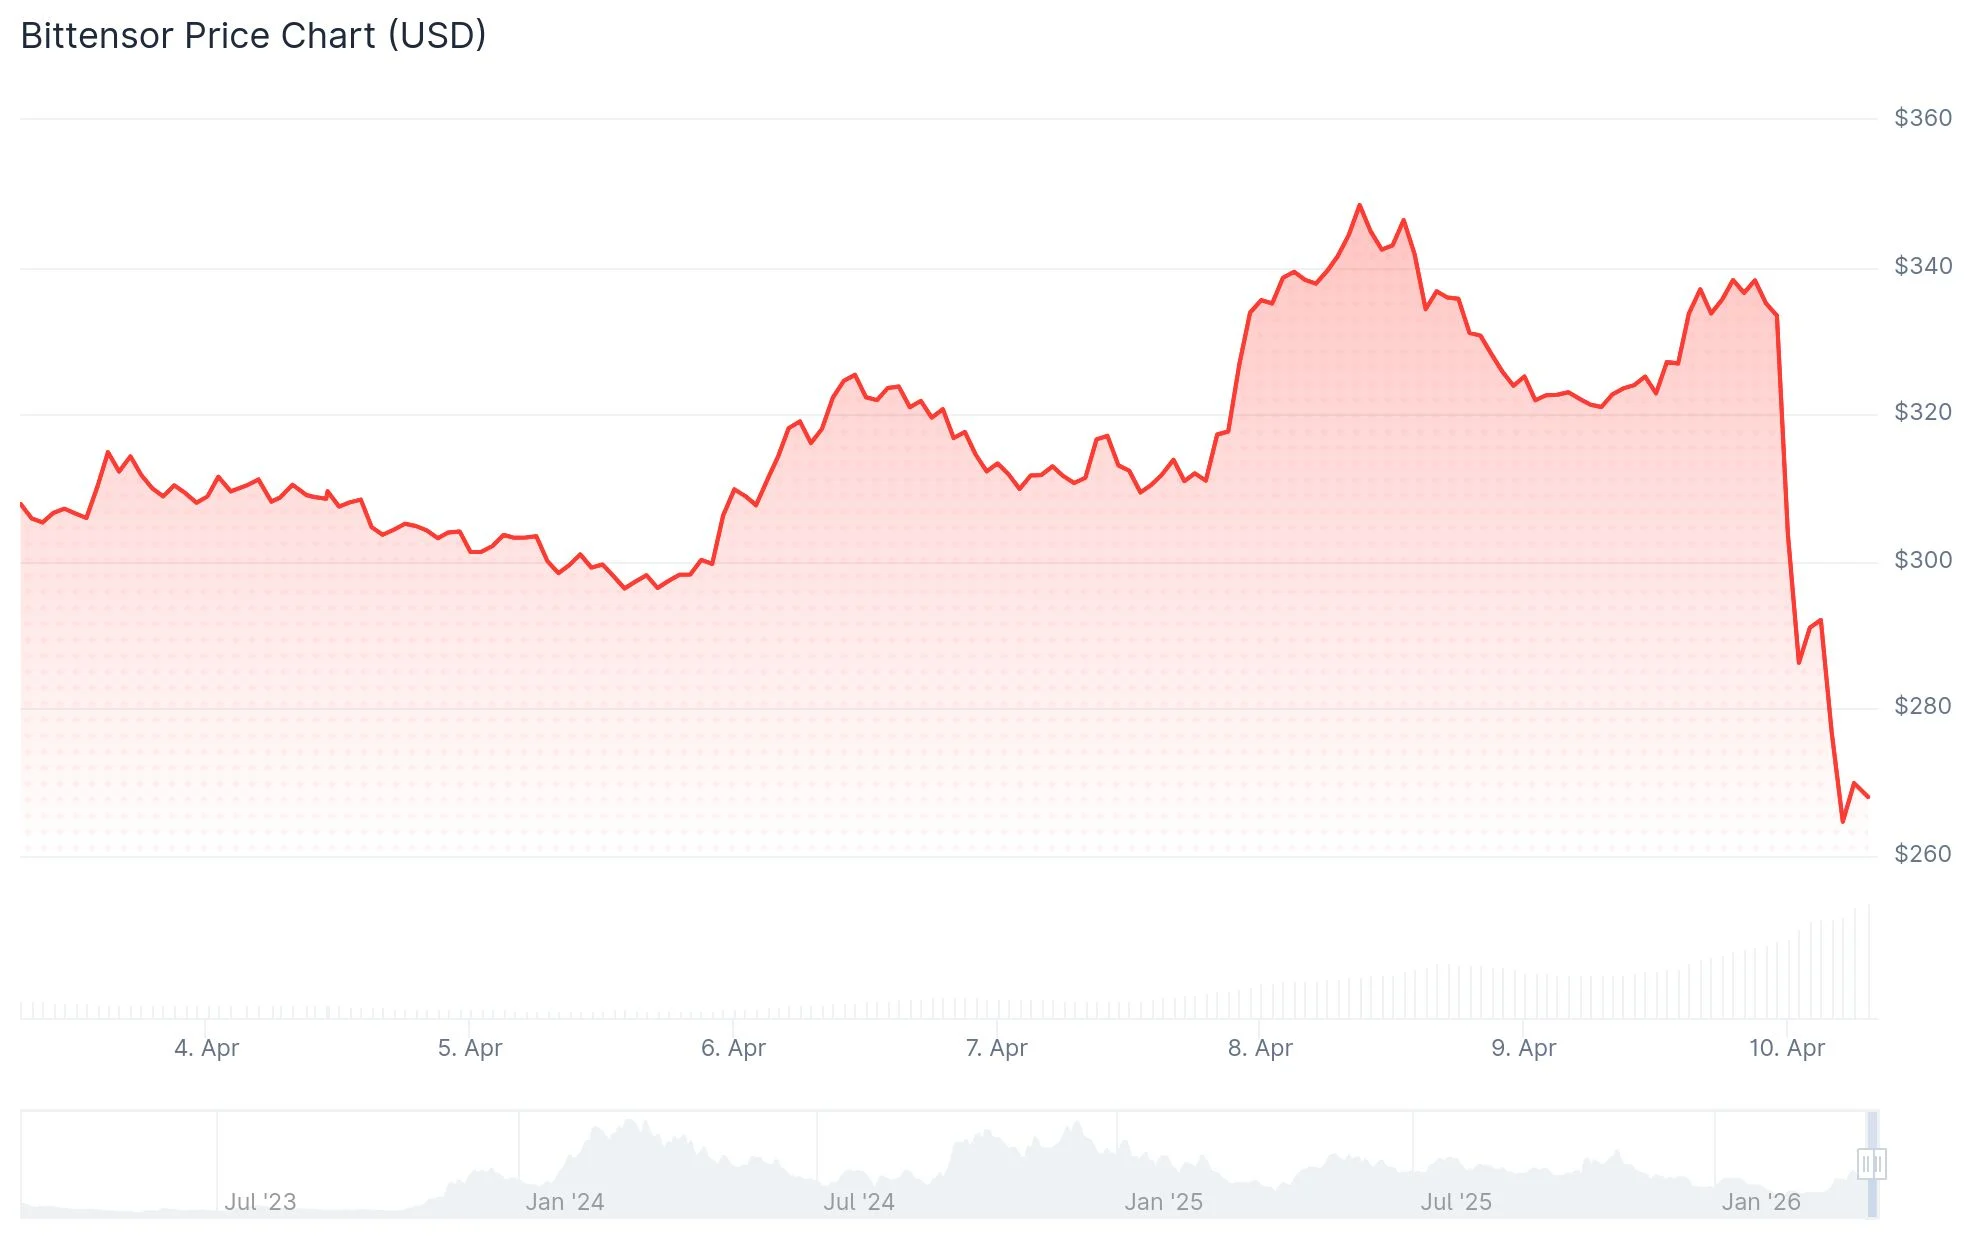
Key Highlights
- Bittensor’s TAO token plummeted over 18% following Covenant AI’s departure announcement
- Sam Dare, Covenant AI’s founder, leveled accusations of centralized governance against Bittensor co-founder Jacob Steeves
- Claims include suspended emissions, revoked moderation privileges, and deprecated subnet infrastructure
- TAO currently hovers between $263 and $292, trading beneath its 200-day moving average with $250 as critical support
- Derivatives market shows nearly 1% decline in open interest to $392.59 million, with significant liquidations across major exchanges
The Bittensor network experienced a significant blow on April 10, 2026, as its native TAO token shed more than 18% of its value within a single day. This dramatic downturn wiped out gains from a previous rally that had pushed prices up over 100%, with the catalyst being Covenant AI’s decision to withdraw from the ecosystem.

As one of the network’s most prominent participants, Covenant AI managed three distinct subnets: Templar (SN3), Basilica (SN39), and Grail (SN81). Their departure represents a substantial loss for the protocol’s operational infrastructure.
In a scathing public disclosure, Sam Dare, who founded Covenant AI, directly challenged the decentralization claims of Bittensor, specifically targeting co-founder Jacob Steeves for what Dare characterizes as autocratic network management.
“The network functions under a triumvirate framework—three people controlling the multisig for protocol upgrades. This is marketed as distributed governance to the community. That’s misleading. This is decentralization in name only,” Dare stated in his announcement.
According to Dare’s allegations, Steeves halted token emissions to Covenant’s operational subnets, removed their administrative access to community communication platforms, forcibly deprecated their subnet systems, and executed calculated token liquidations designed to create financial strain.
Steeves “wields ultimate authority over the triumvirate, opposes any substantive power-sharing arrangements, and implements protocol modifications at will, bypassing established procedures and collaborative decision-making,” Dare asserted.
Complete Liquidation of TAO Position
Following the announcement, Dare liquidated his entire position in the network. Blockchain analysis from taosats revealed he sold more than 37,000 TAO tokens from his personal wallet, creating immediate downward price pressure on the asset.
While severing ties with the [[LINK_START_2]]Bittensor[[LINK_END_2]] ecosystem, Covenant AI confirmed it would maintain its research division, proprietary models, and ongoing development efforts. The organization indicated forthcoming announcements regarding new initiatives. “Decentralized, permissionless artificial intelligence training isn’t exclusive to Bittensor. It represents a technological frontier our team remains committed to exploring,” the company stated.
At press time, TAO was fluctuating in the $263 to $292 range. Throughout the 24-hour period, the token reached a low of $262.51 and peaked at $341. Transaction volume surged by 156% during this timeframe.
Critical Price Levels Under Watch
Well-known market analyst Cheds Trading observed that TAO has broken below its 200-day moving average and is approaching the 50-day moving average positioned at $250. The Relative Strength Index (RSI) declined to 41, suggesting additional downward momentum could be imminent.
The Covenant-72B model developed by Covenant AI had previously served as a major catalyst for TAO’s bullish performance. When NVIDIA CEO Jensen Huang mentioned the model during an appearance on the All-In Podcast, the endorsement contributed to TAO’s subsequent 90% price surge.
Derivatives market data from CoinGlass indicated that Bittensor futures open interest contracted by nearly 1% to $392.59 million in just one hour. The most substantial selling activity occurred on OKX, Gate, Bitget, Hyperliquid, and LBank exchanges. At the time of analysis, neither Binance nor Bybit had reflected comparable adjustments.
Following Covenant AI’s withdrawal, TAO is currently priced around $263 with derivatives open interest standing at $392.59 million.

ASX has best week since 2022 despite ceasefire strain

Commodity Currencies on the Rise: Market Focus Shifts to US and Canadian Data

Taylor Swift Wedding Details Leak Despite NDAs


-

 Fashion7 days ago
Weekend Open Thread: Spanx – Corporette.com
-

 Business4 days ago
Three Gulf funds agree to back Paramount’s $81 billion takeover of Warner, WSJ reports
-

 Sports5 days ago
India men’s 4x400m and mixed 4x100m relay teams register big progress | Other Sports News
-

 Business6 days ago
Expert Picks for Every Need
-

 Tech2 days ago
How Long Can You Drive With Expired Registration? What Florida Law Says
-

 Business5 days ago
No Jackpot Winner, Prize to Climb to $231 Million
-

 Fashion4 days ago
Massimo Dutti Offers Inspiration for Your Summer Mood Board
-

 Fashion3 days ago
Let’s Discuss: DEI in 2026
-
Politics7 days ago
Wings Over Scotland | The quality of mercy
-

 Crypto World2 days ago
Bitcoin recovers as US and Iran Agree a Ceasefire Deal
-

 Business5 days ago
Akebia Therapeutics, Inc. (AKBA) Discusses Pipeline Progress and Strategic Focus on Kidney Disease Treatments at R&D Day – Slideshow
-

 Crypto World21 hours ago
Canary Capital Files SEC Registration for PEPE ETF
-

 Fashion7 days ago
Frugal Friday’s Workwear Report: Hammered Metallic Button Sweater Vest
-

 Politics6 days ago
The UK should not pay a penny in slavery reparations
-

 Tech4 days ago
Haier is betting big that your next TV purchase will be one of these
-

 Fashion7 days ago
Tory Burch’s Spring 2026 Campaign Goes on a Getaway
-

 Fashion7 days ago
Weekly News Update, 4.3.26 – Corporette.com
-

 NewsBeat6 days ago
Kemi Badenoch talks ‘spring cleaning’ Reform defections
-

 Tech4 days ago
Samsung just gave up on its own Messages app
-
 Fashion7 days ago
Philip Jones Kids Jewellery collection – Genuine 925 sterling silver
You must be logged in to post a comment Login