

Crypto World
What is a bonding curve? Memecoin pricing explained


Before a memecoin reaches a normal exchange, its price is not set by buyers and sellers meeting in a market. It is set by a formula. That formula is the bonding curve, and it is the engine behind nearly every Solana memecoin launch. Here is how a bonding curve works, why launchpads use it, and why understanding it is the difference between trading and reacting late.
Summary
- A bonding curve is a mathematical formula that sets a token’s price automatically based on how much of its supply has been bought, so the price rises as people buy and falls as they sell.
- It lets a token launch with instant liquidity and no pre-funded pool, because buyers trade against the curve’s contract rather than against other traders.
- On the leading Solana launchpad, a token sells along its curve until it “graduates,” at which point its accumulated liquidity moves to a normal exchange and the curve is left behind.
- Curves come in shapes, mainly linear and exponential, that determine how violently the price moves and how brutally late buyers are punished.
- A bonding curve is a pricing mechanism, not a safety mechanism, and the large majority of tokens launched on curves lose most of their value within days.
A bonding curve is a mathematical pricing formula that sets a token’s price automatically based on how much of its supply has already been bought, so that the price rises as people buy and falls as people sell, without needing the traditional matching of buyers and sellers in an order book or a pre-funded pool of liquidity. That definition contains the whole idea, but its consequences are profound, because the bonding curve is what made the modern memecoin explosion possible. In an ordinary market, a token’s price emerges from buyers and sellers placing orders that meet at an agreed price, which requires liquidity to exist before trading can happen. A bonding curve removes that requirement.
It lets a brand-new token trade from the very first moment, with its price determined by a formula rather than by a market, and with liquidity created automatically as people buy. This is why a person with no technical skill and a small amount of money can launch a coin that is instantly tradable, and it is why tens of thousands of new tokens can appear every day. The bonding curve is the mechanism underneath all of it. Because the bonding curve governs how a memecoin behaves in its earliest and most volatile phase, understanding it is the single most useful piece of technical knowledge for anyone trying to make sense of memecoin launches, even from a safe distance.
This guide explains what a bonding curve is and how trading against one works, why launchpads adopted the model, how it operates in practice on the dominant Solana launchpad including the all-important moment of graduation, the different curve shapes and why they matter, a worked example that traces a buy through the curve, the uses of bonding curves beyond memecoins, and the risks the curve does and does not protect against. The point is not to encourage trading these tokens, most of which lose nearly all their value, but to make the mechanism legible, because a person who understands the curve can at least see what is happening when a fresh token rockets and collapses, instead of reacting late to forces they cannot name. The curve is the rule of the game, and knowing the rule is the beginning of not being its victim.
What a bonding curve actually is
Start with how trading against a bonding curve differs from trading in a normal market, because the distinction is the key to everything. In a conventional exchange, when you buy a token, you are buying it from another person who is selling, and the price is whatever buyers and sellers agree on through their orders. With a bonding curve, there is no counterparty on the other side; you are trading against a smart contract that follows a formula. When you buy, you send the network’s currency, on Solana that is SOL, to the bonding curve contract, and the contract issues you tokens at a price determined by the formula, then moves the price up the curve.
When you sell, you send your tokens back to the contract, which removes them from circulation and returns SOL to you at the formula’s current price, then moves the price down the curve. The price is purely a function of how far along the curve the supply has been bought; more buying pushes it up, more selling pulls it down, automatically and without any human market-maker. The reason this is called a bonding curve is that the price follows a curve plotted against the supply sold. As more of the token’s supply is purchased and moves out along the curve, each successive token costs more than the last, so the price climbs as the coin sells.
Crucially, the currency that buyers send in does not go to a seller; it stays locked in the contract, where it serves as the token’s liquidity, the pool of value that backs the ability to sell tokens back later. This is how a bonding curve creates liquidity automatically: every purchase adds to the locked pool, so the token is tradable from its first moment without anyone having to fund a liquidity pool in advance. That self-contained quality, a contract that prices the token, holds the liquidity, and handles both buying and selling by formula, is what makes the bonding curve such a powerful launch mechanism. It collapses everything a normal token launch requires, smart-contract deployment, liquidity provision, market-making, into a single automated curve that anyone can use.
Why launchpads use bonding curves
The appeal of the bonding curve to a launchpad, and to the people launching coins, comes down to removing barriers, and seeing why clarifies the model’s role. Traditionally, issuing a token that people could actually trade was involved: a developer had to write and deploy a smart contract, then pre-fund a liquidity pool with a meaningful amount of capital so the token had something to trade against, since without liquidity a token cannot be bought or sold at a stable price. This required both technical skill and money up front, which kept token creation in the hands of relatively few. The bonding curve demolishes both barriers.
Because the curve provides liquidity automatically as people buy, no one has to pre-fund a pool, and because the launchpad handles the contract, no one has to write code. A creator needs only a name, an image, a ticker, and a tiny amount of the network’s currency to cover a creation fee. This is why bonding-curve launchpads turned token creation into a one-click activity and unleashed the flood of memecoins now defining parts of Solana. The model also delivers what the platforms call a fair launch, in the sense that every buyer enters through the same curve from the same starting point, with no presale or insider allocation funded in advance, so the earliest public buyer and the latest both interact with the same automated pricing.
One launchpad even folds in a measure against the oldest memecoin scam by having creators buy their own tokens through the same curve as everyone else at launch, rather than secretly hoarding a huge allocation to dump later, which levels the starting field somewhat even though it does not remove all risk. The bonding curve, then, is the technology that made memecoin creation cheap, instant, and open to anyone, which is simultaneously the source of its creative energy and the reason the space is flooded with low-quality and predatory tokens. The same mechanism that empowers a hobbyist empowers a scammer, because the curve does not care who is using it. The fees around that system also matter, which is why the fees layered on each curve trade became a central debate for memecoin launchpads.
How it works on the leading launchpad
To see the bonding curve in action, it helps to follow how it operates on the dominant Solana launchpad, where the mechanics are well defined. When a coin is created there, it is issued with a large fixed supply, commonly 1 billion tokens, and a major portion of that supply, around 800 million tokens, is placed on the bonding curve to be sold. As buyers send the network’s currency to the curve, they receive tokens and the price rises along the curve, climbing as more of those 800 million are purchased. In the early phase, the coin exists only on the curve, not on any normal exchange, so all of its trading happens against the formula.
Some launchpads add gamified milestones to this phase; one highlights a coin prominently on its homepage once the coin reaches a certain threshold of buying, which functions as free visibility that can attract more buyers and accelerate the climb. The pivotal event in a curve’s life is graduation, and understanding it is essential. A coin graduates when enough of its curve supply has been bought to reach a set threshold, often described as around a particular market-cap level. At graduation, the liquidity that has accumulated in the curve, the pool of currency buyers sent in, migrates out of the curve and into a normal liquidity pool on a decentralized exchange, where the token then trades like a conventional market with buyers and sellers instead of against the curve.
On the leading launchpad, the accumulated liquidity moves to its associated exchange and the liquidity-pool tokens are burned, which is meant to assure traders that no one controls and can withdraw that liquidity. Reaching graduation typically requires the curve to fill with a meaningful amount of the network’s currency, and migrating costs a small additional amount in fees, so a coin whose creator cannot or will not push it over the line can stall on the curve indefinitely, a state traders sometimes call limbo. Graduation is a meaningful milestone because it signals a coin attracted enough buying to reach a normal market, but as the risk section stresses, it is emphatically not a guarantee of safety. Once graduation happens, the next question is where liquidity goes after graduation, because the token leaves the formula-driven phase and enters a pool-based market.
Curve shapes and why they matter
Not all bonding curves are the same shape, and the shape determines how the price behaves, which has direct consequences for anyone trading on it. The two broad types are linear and exponential curves, and the difference is intuitive once you picture it. A linear curve raises the price by a steady increment for each unit of supply sold, so the price climbs in a straight, predictable line. To use a simple illustration that explainer sources cite, with a linear formula where the price starts at $1 and rises by a fixed step, the first token might cost $1 and the hundredth token $11, a smooth and modelable progression.
Because the increase is steady, a linear curve is easier to reason about: a trader can estimate how much the price will move as they buy, and can scale into a position with some idea of their average entry and the slippage they will incur. An exponential curve behaves very differently and more dangerously for latecomers. On an exponential curve, the price does not just rise; it accelerates, so each additional unit of supply pushes the price up by a larger amount than the last. This creates powerful incentives to buy early, because the earliest buyers get in before the acceleration, and it punishes late buyers brutally, because by the time social attention arrives and a crowd rushes in, the price may already have moved far up the steepening curve.
Latecomers pay dramatically more and have far less room for the price to rise further before they are underwater. The practical lesson is that the curve’s shape is itself information a trader should read: a linear curve allows methodical, sized entries, while an exponential curve rewards speed and savagely penalizes the momentum traders who arrive after the supply has already climbed. Notably, on the leading launchpad, linear-style curves have been associated with higher survival rates than fixed-price launches, because the automated, progressive pricing resists the instant dumps that plague other launch formats. The shape of the curve, in short, is not a technicality; it is a map of where the danger lies, including why curve entries move against you when the formula changes the price as demand arrives.
A worked example: tracing a buy through the curve
To make the mechanics concrete, follow a single buyer through a bonding curve, using simplified numbers for clarity. Imagine a fresh coin on a launchpad with a linear curve, early in its life, where only a small fraction of the 800 million curve tokens have been bought, so the price per token is still very low. A buyer, call her the early entrant, sends a modest amount of SOL to the curve contract. The contract issues her a large number of tokens at the current low price and nudges the price up the curve as her purchase moves the supply further along.
Because she bought early on a curve that has barely moved, her tokens are cheap and her average entry price is low. The currency she sent stays locked in the contract as liquidity. Now imagine the coin starts trending. A wave of new buyers sends SOL to the same curve, each purchase moving the supply further along and ratcheting the price higher.
A later buyer, the latecomer, arrives after the coin has been featured and hyped, when much of the curve supply has already been bought. He sends the same amount of SOL the early entrant did, but because the price has climbed far up the curve, he receives far fewer tokens at a much higher average price. If the curve is exponential, the gap is even more extreme, because the price accelerated as the crowd bought in. Should the hype fade and buyers start selling back to the curve, the price slides back down it, and the latecomer, who paid the high price, is underwater long before the early entrant is.
This is the core dynamic of bonding-curve trading laid bare: the curve mechanically rewards those who buy when the supply is low and punishes those who buy after attention has already pushed the price up. The early entrant’s advantage is not skill but position on the curve, and the latecomer’s disadvantage is structural. The example shows why, in this arena, timing relative to the curve matters more than the quality of the coin, and why so many people who chase a trending token arrive precisely when the curve has already made the trade dangerous. For a cultural view of that behavior, trading the curve in practice is what traders call life in the trenches.
Bonding curves beyond memecoins
Although memecoins are where most people encounter bonding curves, the mechanism is a general tool with legitimate uses, and recognizing that gives a fuller picture. The core idea, pricing a token by formula against its supply and providing liquidity automatically, is useful anywhere a project wants continuous, demand-driven issuance instead of a single fixed launch event. Some projects use bonding curves so that demand determines access and pricing over time, letting a token be issued gradually as people buy in, instead of forcing everything through one launch moment. This continuous-issuance model has appeared in corners of crypto beyond memecoins, including in social applications where the curve priced access to a creator or community, with one well-known social-token experiment matching the curve mechanism to its product in a way many later copycats did not.
The honest framing is that the bonding curve is a neutral piece of financial engineering whose character depends entirely on what it is attached to. On its constructive side, it solves a real problem: it lets a project bootstrap liquidity and discover price without a pre-funded pool or a centralized market-maker, which is genuinely useful for certain launch and issuance designs. On its speculative side, the same mechanism can price anything, including tokens with no purpose, and it works mechanically even when it works economically against the people buying. As one analysis put it, a bonding curve can price anything, but it cannot create lasting demand for something nobody wants to hold once the launch excitement fades.
That is the crux. The curve is excellent at manufacturing a price and a tradable market out of nothing, which is exactly why it powers both legitimate continuous-issuance designs and the endless churn of disposable memecoins. The technology is the same; the outcomes diverge based on whether there is any real reason to hold the token after the novelty wears off. Most of the time, in the memecoin context, there is not, even when a curve launch that went parabolic briefly makes the mechanism look like a wealth machine.
Risks: the curve is a mechanism, not a safety net
The most important thing to understand about a bonding curve is what it does not do, because misreading its protections is how people get hurt. A bonding curve sets a price and provides liquidity; it does not make a token safe, valuable, or likely to succeed. The hard data on this is sobering. Analyses of Solana memecoin launches have found that the large majority of tokens launched on bonding curves, on the order of 80% or more, lose more than 90% of their value within about a week, often tied to creators or insiders dumping once the curve phase ends and conditions change.
So the default expectation for a fresh curve launch should be a temporary opportunity at best and a near-certain loss at worst, not a durable asset. The curve’s automated pricing does nothing to change the fact that most of these tokens have no purpose and no reason for anyone to hold them once the initial excitement fades. Several specific risks deserve naming. Creator and insider dumping is common: once a curve completes or conditions shift, those holding large early positions may sell into the buyers who arrived later, collapsing the price.
Whale-driven distortion is another: a large buyer can push the price quickly up the curve to create the appearance of demand, then unwind into the crowd that follows. Graduation, despite feeling like a milestone, is not safety; a graduated coin trading on a normal exchange can still collapse if hype fades, whales sell, or new buyers stop arriving, and post-graduation liquidity can be thin. The curve’s shape compounds these dangers, with exponential curves punishing latecomers especially hard. And the broader environment is one in which, by some estimates, the overwhelming majority of launchpad tokens are scams, pump-and-dumps, or jokes with no lasting viability.
The clear-eyed conclusion is that a bonding curve is a clever pricing and liquidity mechanism, not a protective one, and that understanding the curve should make a person more cautious, not more confident. Knowing how the curve works lets you see the trap; it does not disarm it. The only reliable protection is to treat curve-launched tokens as high-risk speculation, to check holder concentration, liquidity, and curve shape before doing anything, and to never commit money you cannot afford to lose entirely.
Frequently asked questions
What is a bonding curve in simple terms?
A bonding curve is a formula that sets a token’s price based on how much of its supply has been bought, so the price rises as people buy and falls as they sell. Instead of trading against other people in a market, you trade against a smart contract that follows the formula: you send currency and receive tokens at the curve’s current price, which then moves up. The currency you send stays locked in the contract as the token’s liquidity. This lets a brand-new token be tradable instantly, with no pre-funded liquidity pool and no order book, which is why bonding curves power the one-click memecoin launches common on Solana
How does a token graduate from a bonding curve?
A token graduates when enough of its curve supply has been bought to reach a set threshold, often described around a particular market-cap level. At that point, the liquidity accumulated in the curve, the currency buyers sent in, migrates out of the curve into a normal liquidity pool on a decentralized exchange, where the token then trades like a conventional market between buyers and sellers instead of against the curve. On the leading Solana launchpad, the liquidity-pool tokens are burned at graduation so no one can withdraw that liquidity. Reaching graduation requires the curve to fill with a meaningful amount of currency, and a coin that never gets there can stall on the curve indefinitely.
What is the difference between linear and exponential curves?
The difference is how fast the price rises. A linear curve raises the price by a steady, fixed increment for each unit of supply sold, so the price climbs in a predictable straight line, which makes it easier to estimate slippage and scale into a position. An exponential curve accelerates, raising the price by a larger amount with each unit sold, so the price rises faster and faster. Exponential curves strongly reward early buyers and brutally punish late ones, because by the time a crowd arrives, the price may have already climbed steeply, leaving latecomers paying far more with much less upside.
Does a bonding curve make a token safe?
No. A bonding curve is a pricing and liquidity mechanism, not a safety mechanism. It sets a price and provides liquidity, but it does nothing to make a token valuable or likely to succeed. Analyses of Solana launches found that the large majority of bonding-curve tokens, around 80% or more, lose over 90% of their value within about a week, often when creators or insiders dump after the curve phase. Graduation is not safety either, since a graduated coin can still collapse.
Why do launchpads use bonding curves?
Because they remove the two big barriers to launching a tradable token: technical skill and upfront capital. Normally a creator would have to deploy a smart contract and pre-fund a liquidity pool so the token had something to trade against. A bonding curve eliminates both, because it provides liquidity automatically as people buy and the launchpad handles the contract, so a creator needs only a name, image, ticker, and a tiny fee. This turned token creation into a one-click activity and unleashed the flood of memecoins on Solana.
Can bonding curves be used for things other than memecoins?
Yes. The bonding curve is a general tool for any project that wants continuous, demand-driven token issuance instead of a single fixed launch, because it lets demand determine pricing and access over time while providing liquidity automatically. It has been used beyond memecoins, including in social applications where a curve priced access to a creator or community. The mechanism itself is neutral financial engineering; its character depends on what it is attached to. It can support legitimate continuous-issuance designs, and it can equally price tokens with no purpose.
This article is educational information, not financial advice. Descriptions of bonding-curve mechanics, launchpad behavior, and failure statistics reflect reporting available as of June 29, 2026, and can change. Tokens launched on bonding curves are extremely high-risk and the large majority lose most or all of their value. Nothing here encourages trading such tokens. Verify any specific platform’s mechanics independently and consult a qualified professional before making any decision.

Following the US dollar’s notable strength last week, European currencies have entered a period of consolidation. Investors and market participants have temporarily reduced trading activity ahead of a series of key macroeconomic releases from the euro area, the UK and the US, which could determine the next direction for EUR/USD and GBP/USD. At the same time, markets continue to monitor developments in the Middle East, as easing geopolitical tensions have somewhat reduced demand for safe-haven assets, allowing investors to shift their focus back to economic fundamentals.
Investor sentiment has also been supported by reports suggesting that the US and Iran may be close to reaching an agreement to halt mutual strikes and resume negotiations. The restoration of shipping through the Strait of Hormuz has reduced concerns over disruptions to global oil supplies and contributed to greater stability across financial markets. Nevertheless, ongoing disagreements over the situation in the Strait of Hormuz and conflicting statements from Iranian officials indicate that geopolitical risks have not yet fully subsided.
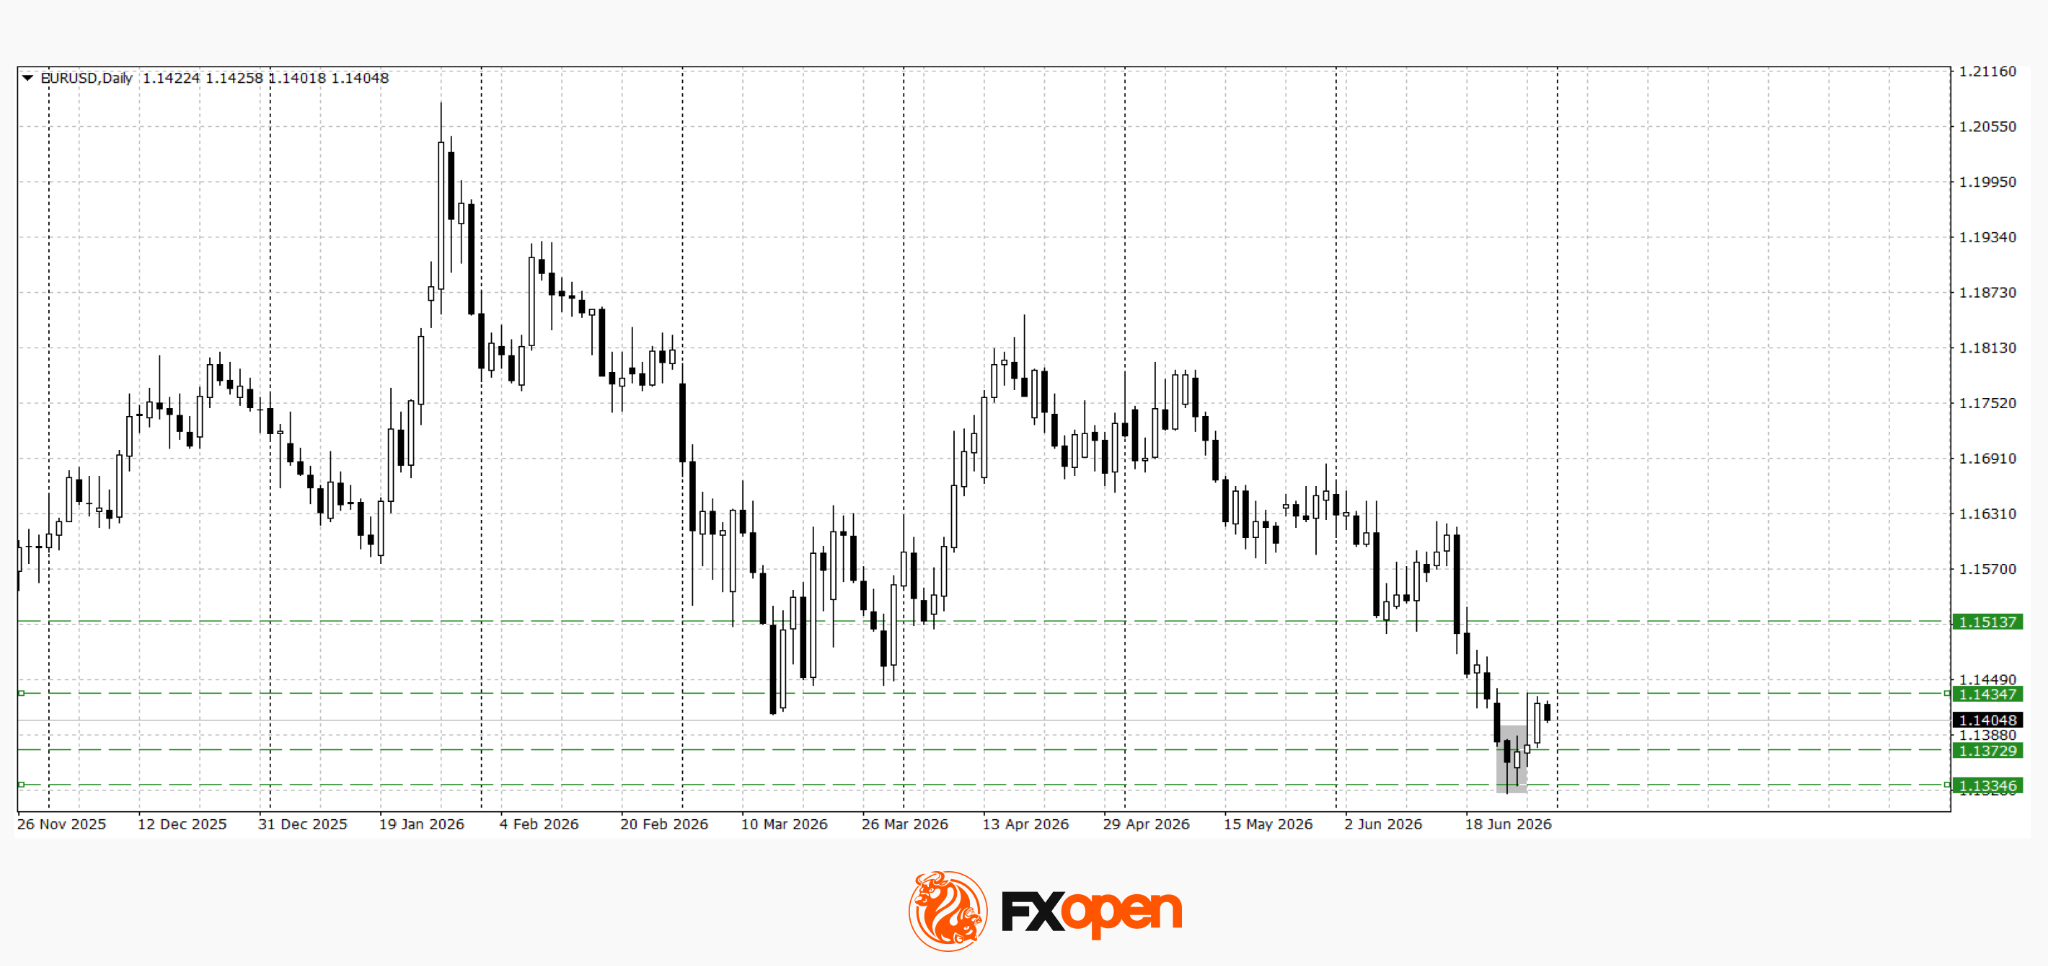
EUR/USD
Following a test of the March low, a bullish Piercing Line candlestick pattern formed on the daily timeframe. Technical analysis suggests that EUR/USD is trading within a sideways range between 1.1340 and 1.1430. Price action around these boundaries, together with the incoming macroeconomic data, should provide further clues regarding the pair’s next directional move.
Key events for EUR/USD:
- Today at 09:45 (GMT+3): France CPI.
- Today at 15:00 (GMT+3): Germany CPI.
- Today at 17:00 (GMT+3): US JOLTS Job Openings.

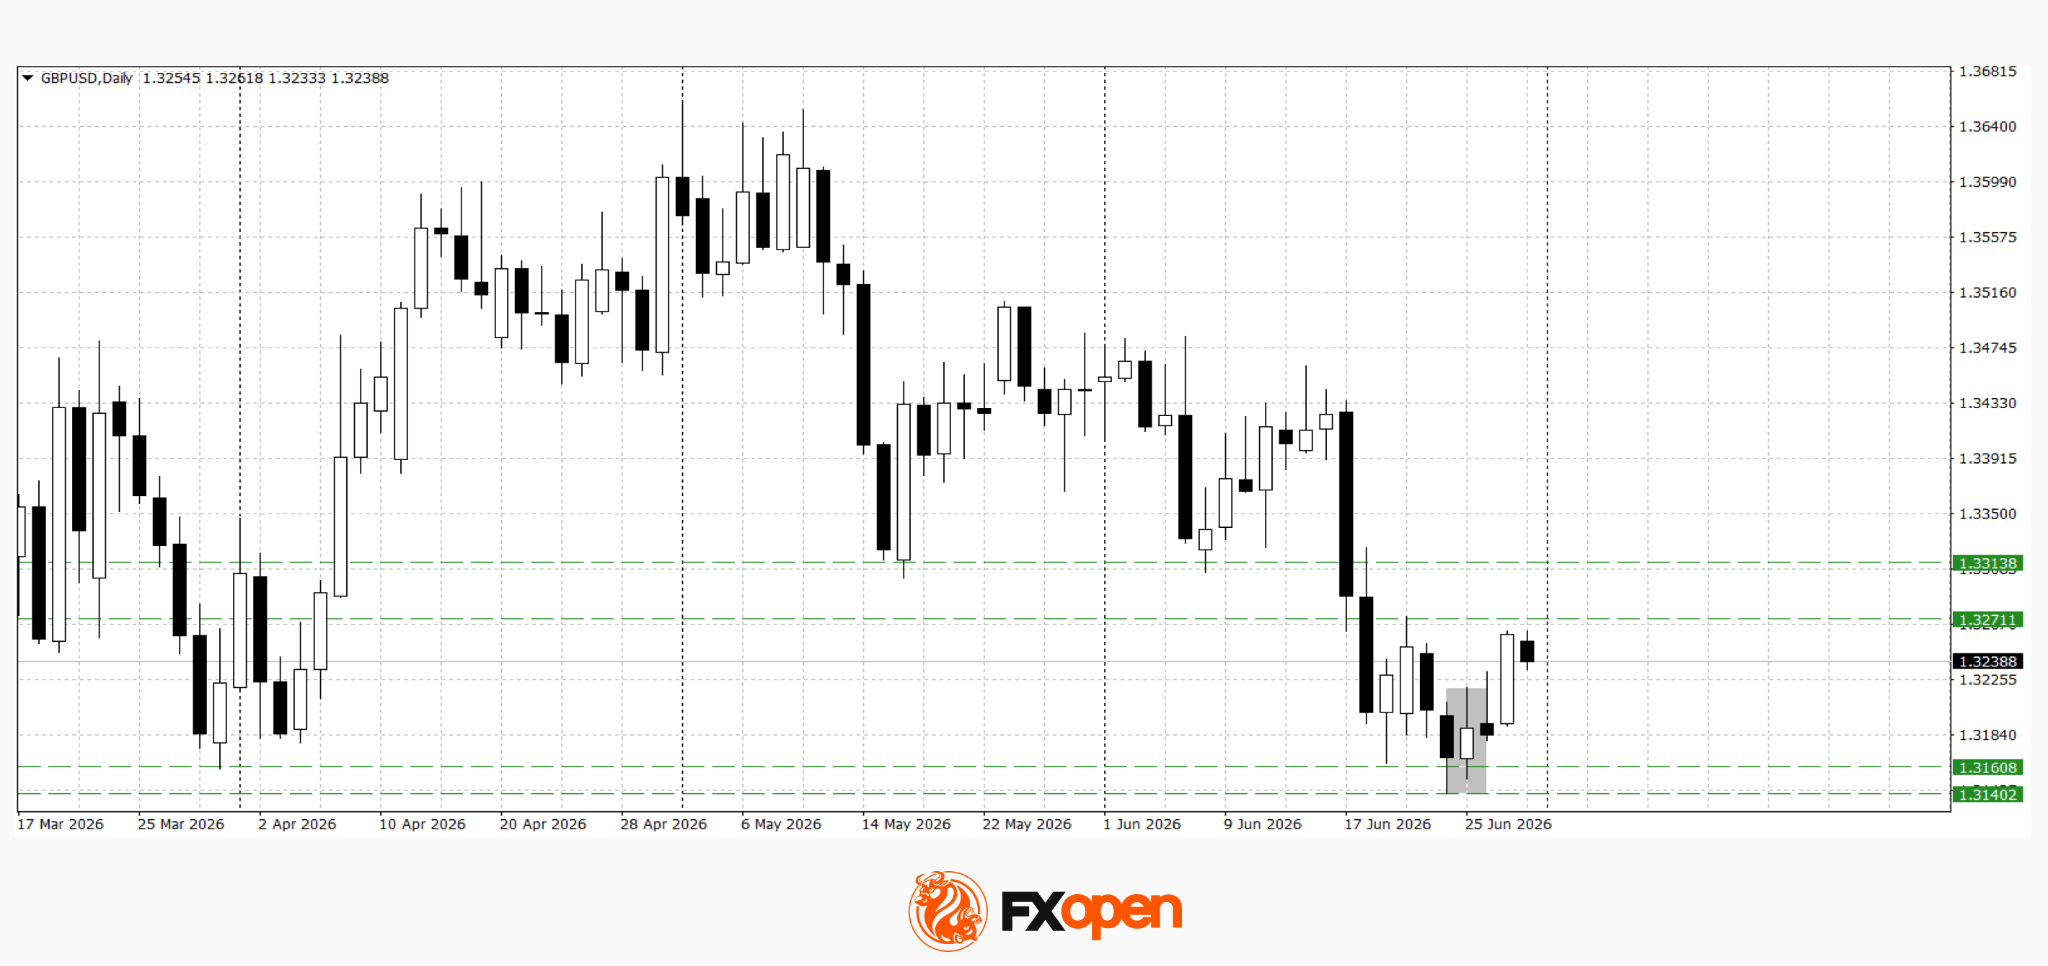
GBP/USD
After testing this year’s March low at 1.3160, sterling buyers regained the initiative and formed a bullish Piercing Line candlestick pattern. The pair has since rebounded towards 1.3270, although any further upside is likely to depend on incoming macroeconomic data. Technical analysis suggests the pair may retest the 1.3270 level. A decisive break and close above this resistance could pave the way for further gains towards 1.3300–1.3310, while rejection from current resistance may trigger a decline back towards the 1.3140–1.3160 area.
Key events for GBP/USD:
- Today at 09:00 (GMT+3): UK GDP.
- Today at 13:40 (GMT+3): Speech by Bank of England Financial Policy Committee member Sarah Breeden.
- Today at 17:00 (GMT+3): US CB Consumer Confidence Index.
Following the sharp moves seen in recent sessions, the foreign exchange market has entered a wait-and-see mode. The release of key economic data on both sides of the Atlantic is likely to determine whether the current consolidation becomes the starting point for a recovery in European currencies or gives way to a renewed strengthening of the US dollar.
Trade over 50 forex markets 24 hours a day with FXOpen. Take advantage of low commissions, deep liquidity, and spreads from 0.0 pips (additional fees may apply). Open your FXOpen account now or learn more about trading forex with FXOpen.
This article represents the opinion of the Companies operating under the FXOpen brand only. It is not to be construed as an offer, solicitation, or recommendation with respect to products and services provided by the Companies operating under the FXOpen brand, nor is it to be considered financial advice.
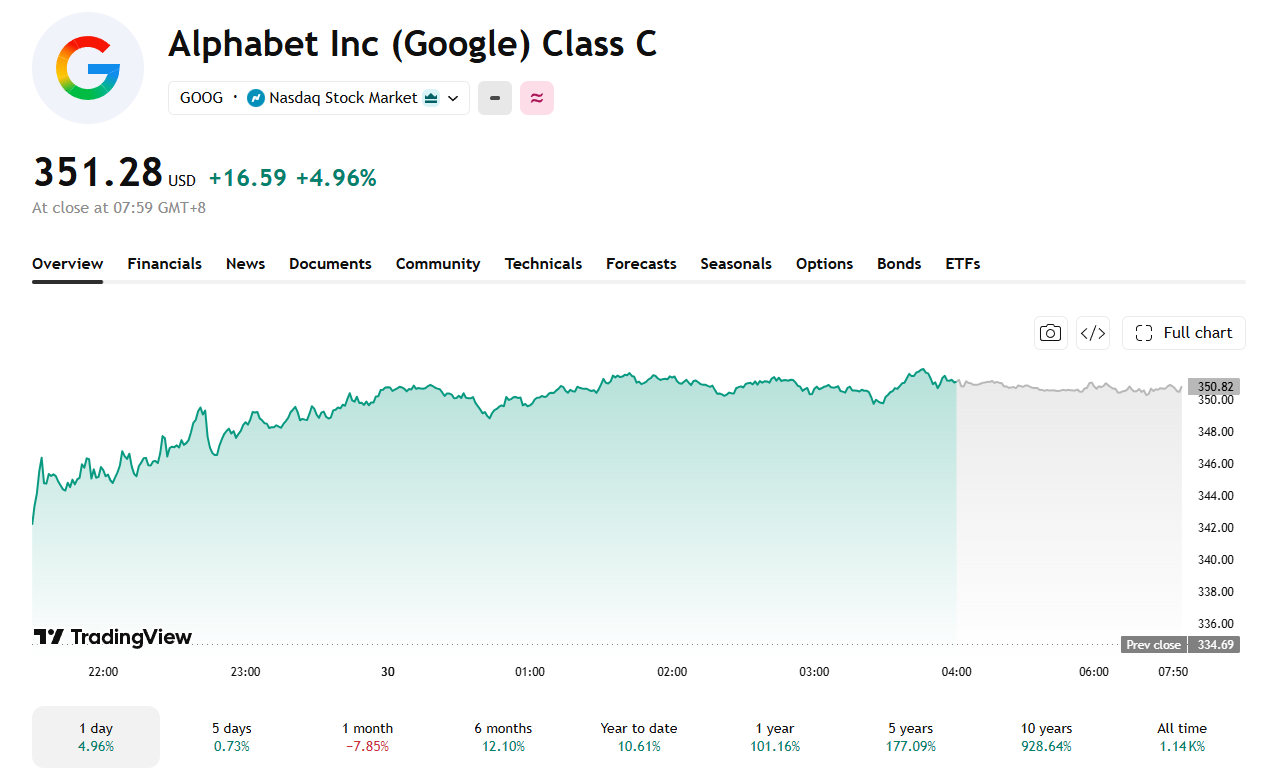
The Dow Jones Industrial Average (DJIA) closed above 52,000 for the first time on Monday, June 29, powered by Alphabet’s blue-chip debut and a broad rally in semiconductor stocks.
The index gained 306.63 points, or 0.59%, to finish at 52,182.74. The S&P 500 rose 1.18% to 7,440.43, and the Nasdaq Composite surged 2.07% to 25,820.14.
Alphabet’s Dow Debut Lifts Sentiment
Alphabet (GOOGL) climbed nearly 5% on its first session as a Dow member after replacing Verizon in the index. The addition carries more symbolic weight than mechanical impact, as the stock already sits in the S&P 500 and Nasdaq 100, limiting forced fund buying from the change.

Despite Monday’s pop, Alphabet is still on pace for its worst month since February of last year, with six of the past seven weeks ending in negative territory. Investor concerns center on AI execution, with Nvidia chip stock flows drawing renewed attention across the sector as compute access tightens.
Semis and Geopolitics Drive the Broader Move
The VanEck Semiconductor ETF gained more than 3%, led by Astera Labs, KLA, and Applied Materials, which rose roughly 16%, 12%, and 11%, respectively.
Macro relief also played a role. The US and Iran agreed to pause hostilities and allow commercial vessels to transit the Strait of Hormuz freely.
Brent and West Texas Intermediate climbed slightly, as traders weighed whether the ceasefire would hold. BeInCrypto previously covered how Iran’s oil ceasefire deals move crude and downstream inflation expectations.
Whether the rally extends into a shortened week ahead of the July 4 holiday will depend on whether the Iran ceasefire holds and if semiconductor momentum carries through.
The post Dow Closes Above 52,000 for First Time as Alphabet Debuts appeared first on BeInCrypto.


U.S. spot bitcoin ETFs lost a net $231 million on Monday, with BlackRock’s IBIT accounting for $300 million of outflows that other funds partly offset, including $50 million into ARKB and $35 million into GBTC, per SoSoValue data.
The outflow lands as risk appetite elsewhere is surging. Wall Street’s technology rally spread into Asia on Tuesday, with the MSCI Asia Pacific index up 1% on the year’s final trading day after a semiconductor rebound helped the S&P 500 snap a five-session losing streak. The Asian benchmark is on track for its biggest quarterly gain in almost 17 years.
South Korea’s Kospi, which crashed 10% in a single session earlier this month, climbed 2.1% to extend its lead as the world’s best-performing major benchmark this year. Samsung is up more than 100% this quarter, and SK Hynix has gained almost 240% since April. The yen slid to its weakest level against the dollar since 1986, a sign investors are funding the AI trade by borrowing in yen.
Bitcoin ETFs are not participating in that capital rotation, however. The same AI infrastructure spending fueling record quarters in Seoul and Tokyo is the trade competing for the dollars that might otherwise flow into bitcoin, a dynamic that has run through the month’s coverage of SpaceX, Anthropic and the chip sector.

Key Highlights
- BitMine acquired 27,084 ETH in the past week, marking its fourth-smallest weekly accumulation this year, pushing total reserves to 5.7 million ETH.
- US-based spot Ethereum ETFs experienced their seventh consecutive week of net redemptions, shedding $273.3 million in the steepest weekly decline since January.
- Sharplink re-entered the market after an eight-month hiatus, acquiring 39,196 ETH valued at $62.4 million across three consecutive days.
- Ethereum has declined approximately 50% year-to-date and approaches the possibility of recording three consecutive quarterly losses.
- Derivatives markets reveal $4.09 billion in short positions compared to $1.31 billion in long positions, highlighting prevailing bearish sentiment among traders.
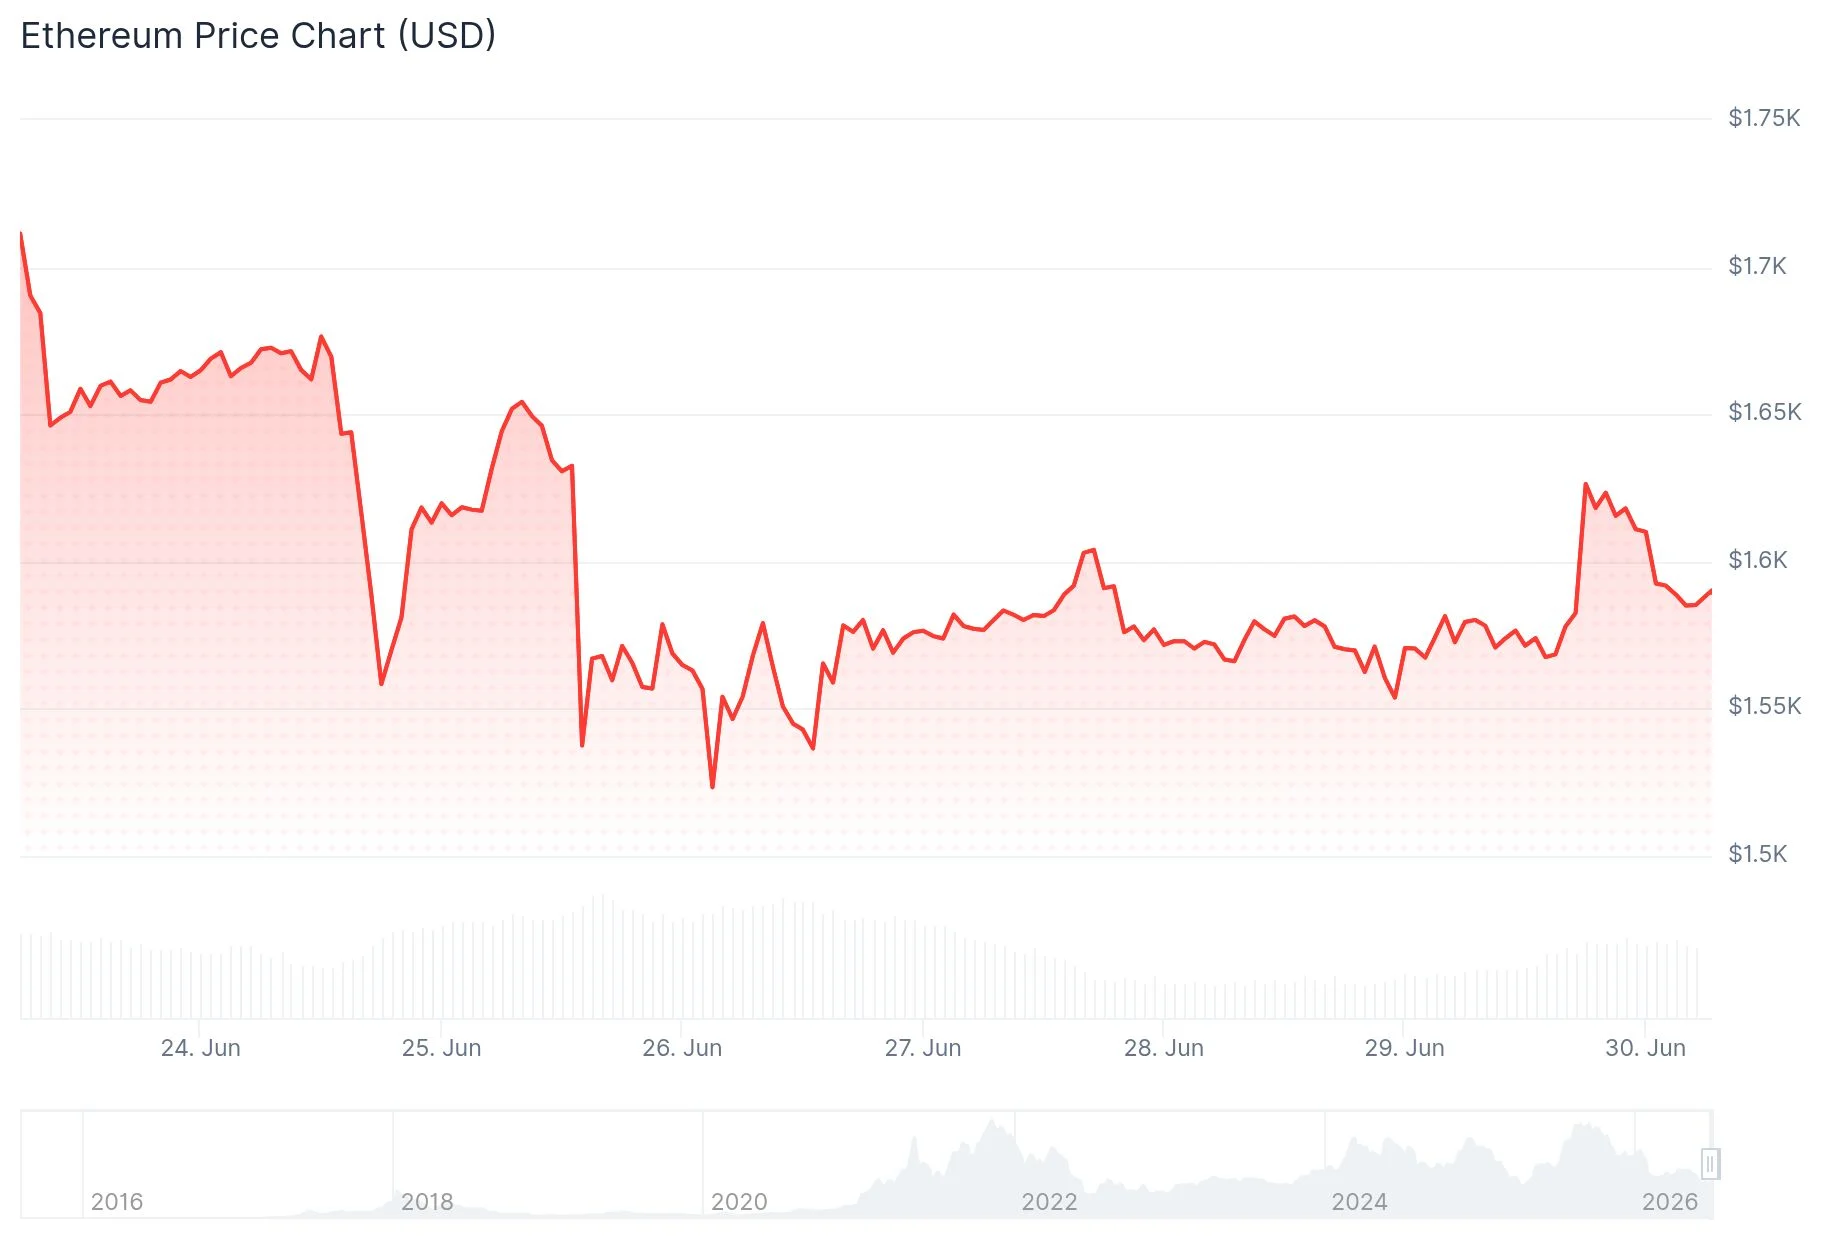
Ethereum’s market value hovers around $1,580 as the blockchain network contends with diminishing corporate accumulation and persistent outflows from investment vehicles. The cryptocurrency has found it difficult to maintain critical price thresholds throughout June.
BitMine Immersion, holding the distinction of being the largest institutional ETH holder, acquired 27,084 ETH during the previous week. This transaction elevated the company’s aggregate holdings to 5.7 million ETH, representing approximately $9.22 billion in value. The purchase volume represents one of the company’s most modest weekly acquisitions this year.
Simultaneously, BitMine allocated 160,480 ETH to its staking infrastructure. The firm’s staked portfolio now encompasses 4.879 million ETH, producing approximately $211 million in annual staking rewards.
BitMine Chairman Thomas Lee attributed the reduced acquisition pace to end-of-quarter “window dressing” activities. He observed that market participants frequently reduce exposure to underperforming assets during quarterly closings, regardless of positive fundamental developments.
Investment Fund Redemptions Accelerate
US spot Ethereum exchange-traded funds registered their seventh straight week of negative net flows. These investment vehicles experienced redemptions totaling $273.3 million over the past week, representing the most substantial weekly decline since January, based on SoSoValue tracking data.
BlackRock’s iShares Ethereum Trust experienced the largest redemptions among ETF providers. The trend demonstrates retail and institutional fund investors reducing allocations while certain corporate treasuries maintain their accumulation strategies.
This divergence has generated an atypical market dynamic. Corporate balance sheet strategies continued adding ETH exposure while traditional fund investors redirected capital to alternative investments.
Sharplink, another prominent institutional ETH holder, re-initiated purchases following an eight-month dormant period. Blockchain analytics from Lookonchain documented the company’s acquisition of 39,196 ETH valued at $62.4 million through three separate transactions during the previous week.
Arkham Intelligence data identified the initial purchase batch through FalconX on Thursday. Sharplink executed additional transactions on Friday, complemented by substantial over-the-counter trades throughout the weekend.
As of June 21, Sharplink maintained holdings of 876,285 ETH, establishing its position as the second-largest public corporate ETH holder after BitMine. The company has not publicly addressed the rationale behind resuming its accumulation strategy.
Quarter-End Performance and Derivatives Market Positioning
Ethereum has experienced a decline approaching 50% since the beginning of January. This downturn temporarily allowed Tether’s USDt stablecoin to surpass ETH in overall market capitalization during the past week.
Cryptocurrency analyst Max Crypto highlighted in a social media post that ETH approaches the possibility of recording three consecutive quarterly losses for the first time in its history. He characterized this pattern as a structural concern extending beyond temporary price volatility, prompting market observers to monitor whether the asset can prevent a fourth consecutive negative quarter.
Derivatives market information from CW indicated that high-leverage short positions on ETH totaled $4.09 billion. Long positions registered $1.31 billion on the identical platform, suggesting that speculative traders anticipate continued downward price movement.
From a technical perspective, ETH trades beneath its 20-day, 50-day, and 100-day Exponential Moving Averages, which range between $1,670 and $2,004. The Relative Strength Index currently registers 35, while the Stochastic indicator stands at 26, both metrics indicating persistent downward momentum with minimal signals of reversal.
Market analyst Daan Crypto Trades remarked on social platform X that Ethereum has been unable to successfully recapture previous support zones. He indicated that a recovery above $1,750 would represent the initial indication of bullish strength on extended timeframes, whereas a breach below the current $1,500 support level, which has provided a floor on two prior occasions, could trigger a decline toward April 2025 price lows.
Near-term resistance levels for ETH are positioned at $1,626, followed by additional barriers at $1,670 and $1,741. Support zones are established near $1,524, with a secondary support foundation at $1,404.

Key Takeaways
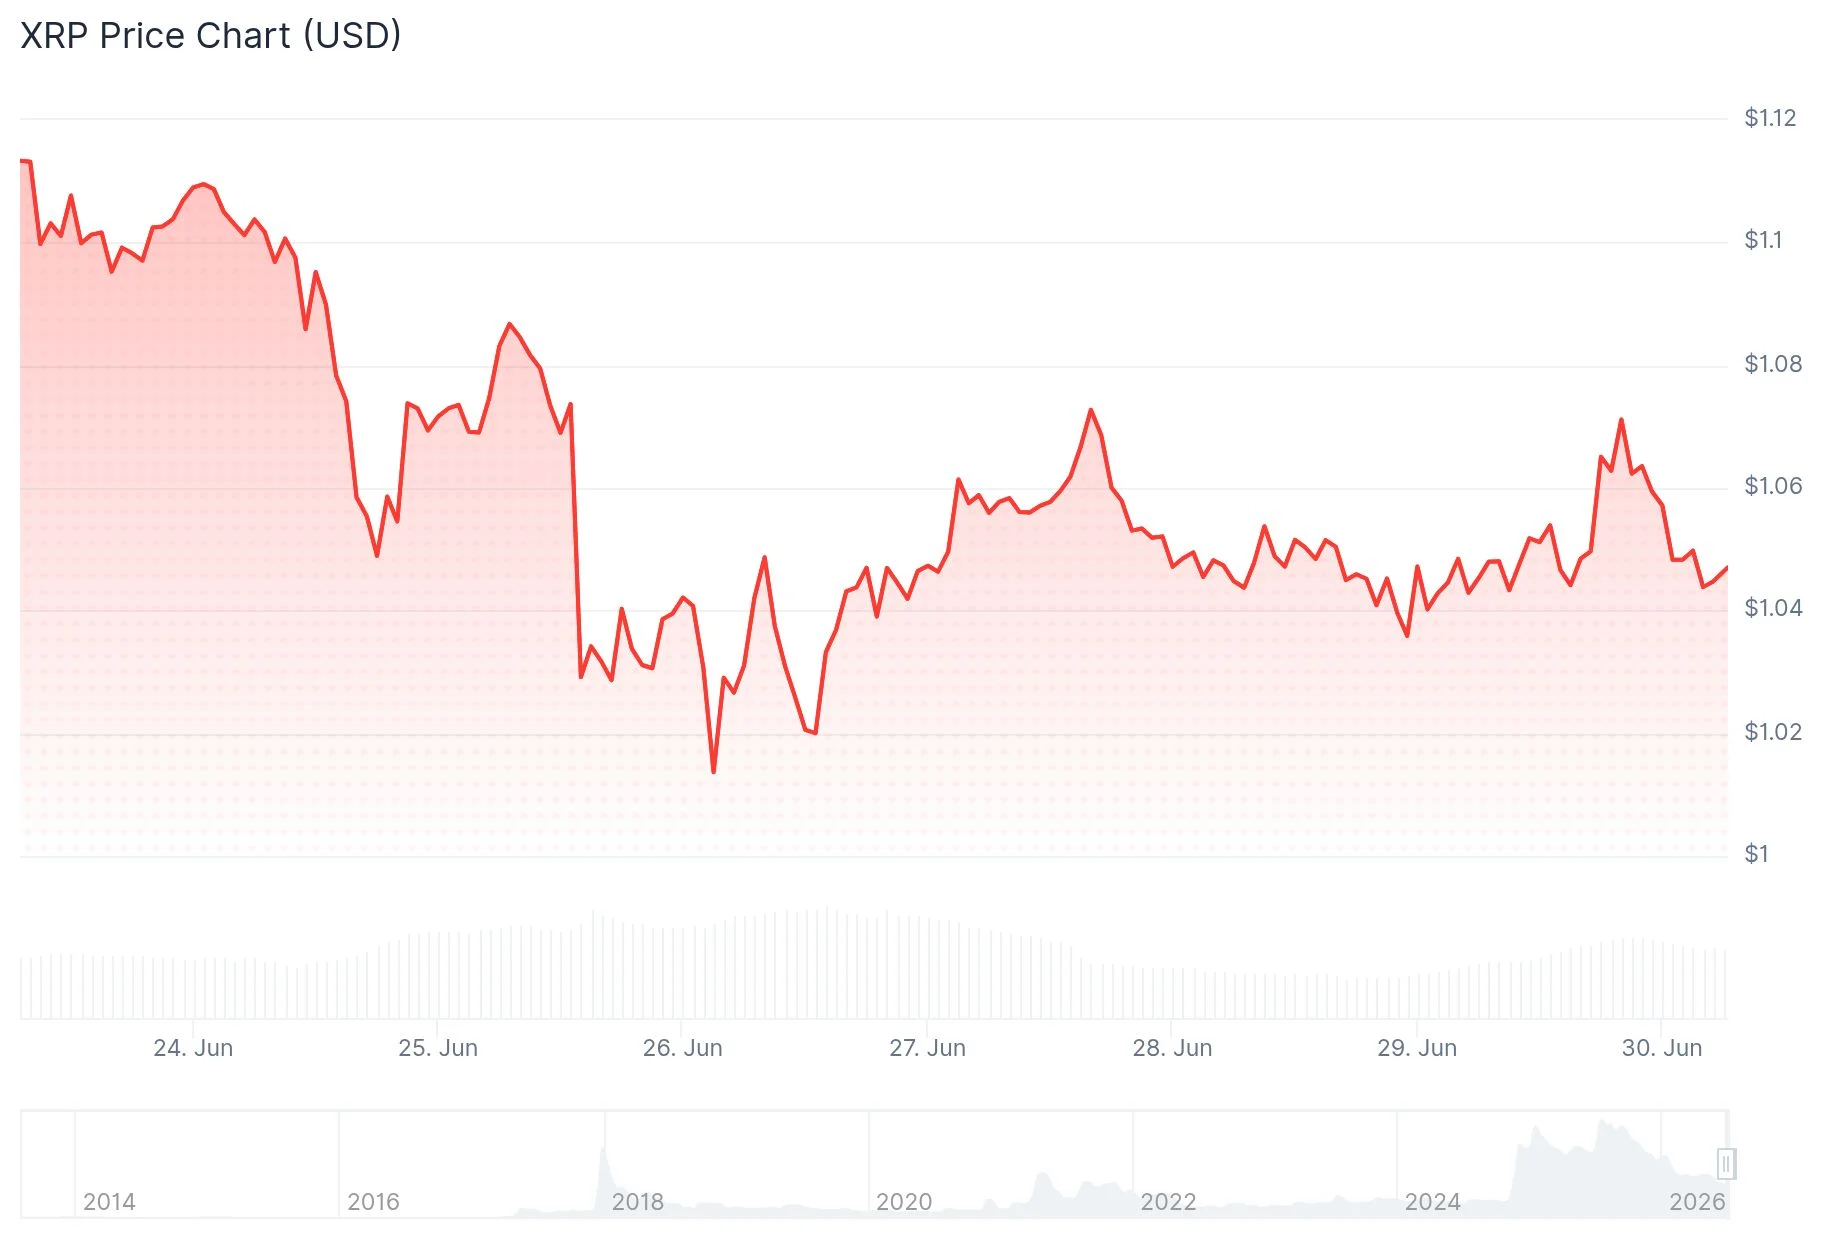
- XRP currently hovers around $1.05, maintaining stability above the critical $1 threshold following a June 25 dip to $1.01—the lowest level in 19 months.
- Tokens flowing out of exchanges increased dramatically, jumping from 40.7 million to approximately 123 million XRP within days, suggesting potential accumulation by holders.
- Spot XRP ETFs recorded their eighth consecutive week of positive inflows, bringing total cumulative inflows to approximately $1.47 billion.
- Network engagement surged with daily active addresses climbing 72% over a two-week period, moving from 23,000 to nearly 39,500.
- Derivatives open interest contracted sharply from 1.3 billion to under 150 million, indicating a significant deleveraging event.
XRP maintains its position around the $1.05 level following a challenging June performance. The digital asset touched approximately $1.01 on June 25, marking its lowest valuation in 19 months, yet purchasing pressure has successfully defended the psychologically important $1.00 threshold in subsequent trading sessions.

While price action has remained subdued, the underlying XRP Ledger has demonstrated notable vitality. The blockchain recorded 4,941 newly created wallets within a 24-hour window, representing the most significant single-day expansion in wallet creation observed over the past three months.
Concurrently, daily active addresses have experienced substantial growth. The metric expanded from approximately 23,000 on June 14 to nearly 39,500 by June 27, reflecting a 72% increase within a fortnight.
Token Movement and Institutional Capital Flow
Blockchain analytics reveal an accelerating trend of tokens being withdrawn from centralized exchanges. The exchange net position change metric shifted from roughly 40.7 million XRP on June 22 to approximately 123 million XRP several days afterward, representing an increase of nearly 200%.

Such withdrawal patterns typically indicate that holders are moving assets into self-custody rather than positioning for immediate sales. Meanwhile, institutional appetite for XRP exposure continues unabated.
Spot XRP exchange-traded funds have maintained positive net inflows for eight consecutive weeks. Total cumulative inflows now approach $1.47 billion, with an additional $22.99 million recorded during the week ending June 26.
Notably, on June 26, XRP-focused ETFs attracted $15.6 million in capital while bitcoin-based products experienced $444.5 million in withdrawals and ethereum funds recorded $12.9 million in outflows.
The derivatives market has undergone significant consolidation. Open interest across primary trading venues declined from a peak exceeding 1.3 billion to beneath 150 million, eliminating substantial speculative positioning that accumulated during XRP’s previous upward movement.
Market intelligence firm Santiment Intelligence highlighted this divergence between price weakness and growing network participation in a recent analysis. The firm observed that new wallet creation and optimistic market sentiment are materializing even as price threatens the $1 level, with sentiment analysis revealing 3.7 positive comments for each negative one—the highest ratio in three months.
Critical Technical Zones Under Observation
XRP has remained confined within a descending price channel throughout the past year. The 20-period exponential moving average, which tracks near-term momentum, currently aligns with the upper boundary of this channel in the $1.18 to $1.22 range.
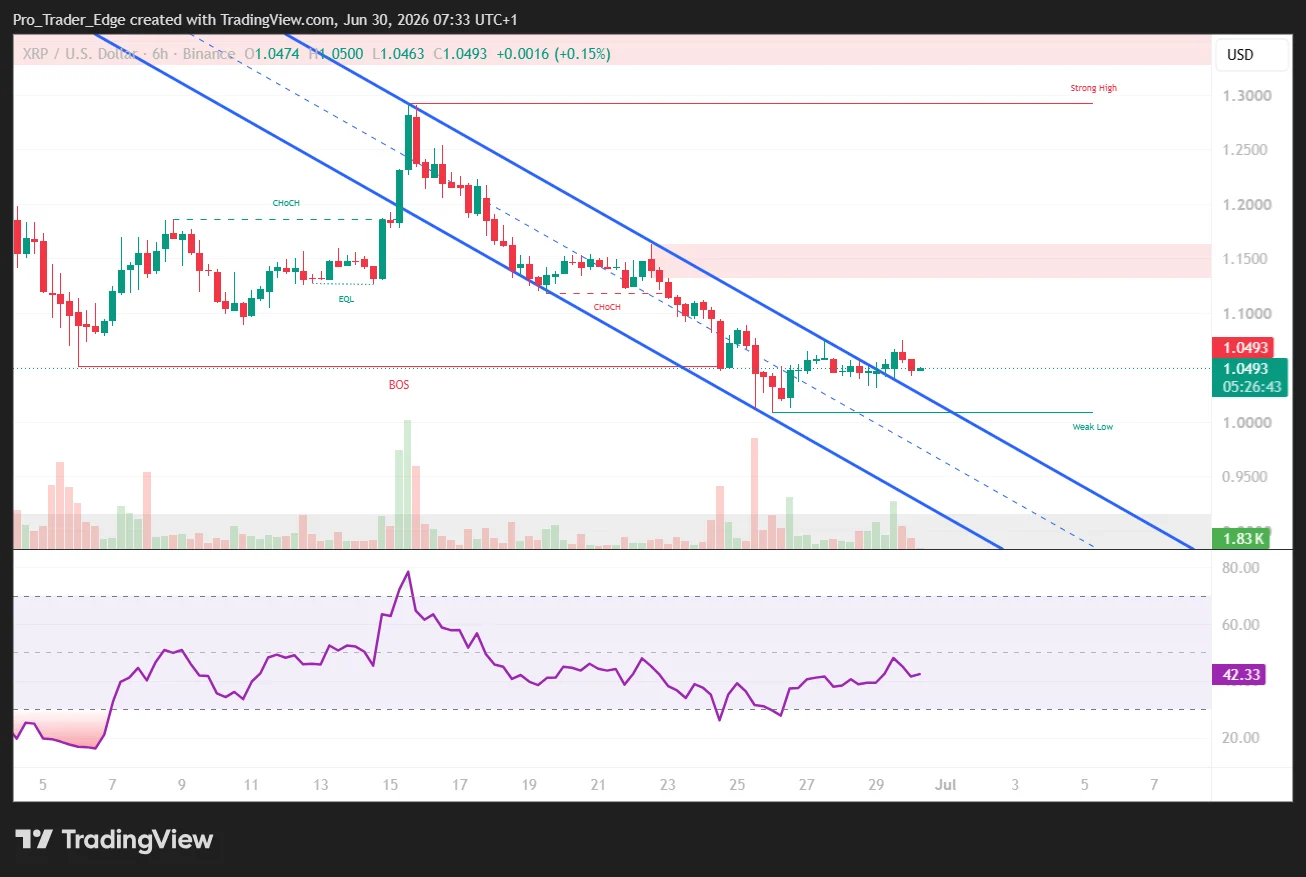
This region also coincides with a Fibonacci retracement level at $1.178 and a concentration of approximately 22.8 million XRP in cost basis distribution between $1.18 and $1.19. An additional 27.4 million XRP are positioned between $1.21 and $1.22.
These price zones represent areas where previous purchasers may attempt to exit positions at breakeven, establishing resistance. A decisive move above $1.18 followed by $1.22 would push XRP beyond its established downtrend into more neutral technical territory.
For downside protection, immediate support is established near $1.02. A violation of this level could potentially trigger a decline toward $0.87, according to Fibonacci extension analysis.
In the near term, market participants are monitoring $1.06 as initial resistance, followed by the $1.09 to $1.10 zone where previous recovery attempts have encountered selling pressure. A sustained move above $1.20 would represent the first meaningful indication of a potential trend reversal.
The 4-hour relative strength index has recovered to 46 after entering oversold territory, though it remains below the neutral 50 threshold. Price action recently consolidated within a $1.03 to $1.06 range, with peak trading volume occurring on June 29 at 17:00 UTC when 86.5 million XRP were exchanged.


The pickup began about 18 months ago, before MiCA’s first rules took effect, she said. Stablecoin regulations began applying about a year ago, and crypto-asset service providers have been working through a transition period before the July 1, 2026, deadline. After that date, firms relying on legacy national regimes will no longer be able to provide MiCA-regulated services in the EU.
The inquiries come from entrepreneurs frustrated by bureaucracy and regulatory burdens in Europe.
“They’re not just some random guys,” she said. “They’re former founders or current founders, somebody with multiple exits, somebody with years of experience in crypto.”
The deadline is already reshaping the competitive landscape. Binance, the world’s largest cryptocurrency exchange by trading volume, withdrew its MiCA application in Greece last week and notified EU users it would suspend some services while seeking another regulatory route. The company said it remains committed to Europe.
“Our ambitions in Europe remain the same, and we are confident we will secure a MiCA licence in the coming months,” Binance said in a statement to CoinDesk on Thursday.
Rivals are trying to capitalize. OKX and Coinbase (COIN) announced bonuses of up to 8% of total deposits and transfers for new users the following day.
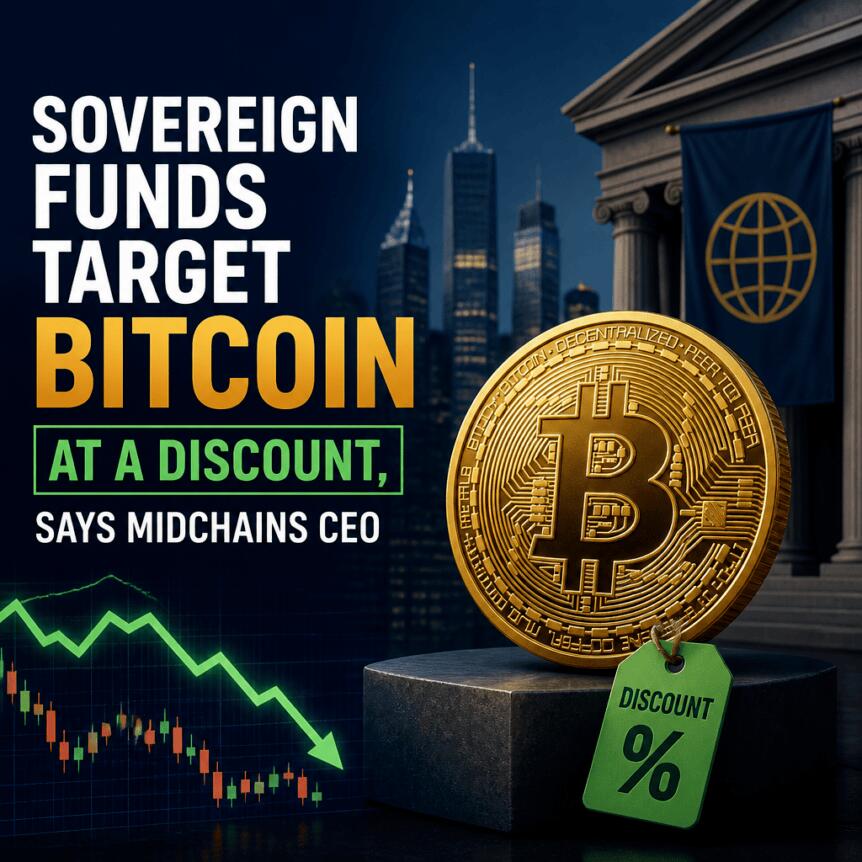
Sovereign wealth funds are reportedly increasing exposure to spot Bitcoin, a development MidChains CEO Basil Al Askari said may reflect growing institutional interest at current price levels. Speaking on Cointelegraph’s “Chain Reaction” podcast on Monday, Al Askari said he could confirm at least one—and potentially two—in the coming weeks—sovereign wealth funds accumulating spot Bitcoin.
While retail participation has slowed, Al Askari pointed to stronger momentum from institutions and corporates, arguing that the present price environment is functioning as an “entry level” for larger funds that can wait through long accumulation cycles.
Key takeaways
- MidChains CEO Basil Al Askari says one, possibly two, sovereign wealth funds are accumulating spot Bitcoin, potentially in the coming weeks.
- Al Askari frames the current price level as attractive “entry level” positioning for mega funds with long time horizons.
- He expects the effect on markets to be gradual rather than a rapid cascade, but sees it as a clear signal to other institutions.
- Coinbase institutional strategy head John D’Agostino earlier said institutional buyers view the dip as an opportunity, particularly among UAE family offices and sovereign-linked investors.
- Despite spot Bitcoin ETF outflows in the U.S., corporate treasuries—especially Strategy—continue adding to BTC holdings.
Sovereign funds add spot Bitcoin exposure
Al Askari’s remarks center on state-backed capital moving into Bitcoin at a time when retail demand appears to be cooling. A sovereign wealth fund is typically a government-owned investment pool funded by national reserves, so the implication is less about short-term trading and more about long-term allocation decisions.
To help contextualize the scale of that player base, the article notes sovereign wealth funds collectively control more than $13 trillion globally, citing Visual Capitalist. Al Askari described these allocations as experiments for institutions that may have been waiting for a more compelling price to begin building positions.
Importantly for investors, he argued that this type of activity is unlikely to trigger an immediate, dramatic repricing. Instead, it can act as a confidence signal—encouraging other institutions that view larger funds as leaders to “start to get involved.”
Why a “long horizon” matters for Bitcoin supply dynamics
Al Askari suggested the strategic value of such accumulation lies in Bitcoin becoming “more and more scarce” over time as larger holders with longer investment horizons lock in supply. In his view, the key mechanism is not just who buys, but how long they plan to hold.
That distinction matters because it reframes the narrative from near-term momentum to liquidity and available float over extended periods. If more institutional capital transitions from sporadic exposure to sustained accumulation, the market’s effective supply can tighten gradually—potentially influencing volatility and depth even when short-term flows look mixed.
“I do think this is what will happen, is that over the longer term period, we’ll start to see Bitcoin becoming more and more scarce as a result of larger holders with much longer time horizons on their holding periods as far as looking at investments.”
ETFs see U.S. outflows even as corporate treasuries buy
The broader picture is mixed across investor segments. According to the source, sustained U.S. spot Bitcoin ETF outflows have totaled more than $4.1 billion so far this month, referencing Cointelegraph coverage of ETF flow performance and noting that Bitcoin ETF outflows are exceeding that threshold.
At the same time, corporate treasuries—particularly Strategy—continue accumulating. The article states that Strategy has scooped up 3,657 BTC this month, pointing to Cointelegraph reporting on the company’s reserve purchases.
This divergence—ETF outflows on one side and corporate accumulation on the other—can be read as a shift in where new demand is showing up. When exchange-traded product flows weaken but corporate balance-sheet demand persists, it suggests the marginal buyer may be changing rather than demand disappearing altogether.
Institutional “discount buying” and sovereign-linked appetite
Coinbase’s head of institutional strategy, John D’Agostino, previously weighed in on how institutional investors interpret the current market. In a CNBC interview earlier this month, D’Agostino said the “dip” is being welcomed by institutional investors, adding that he had just returned from the Middle East and observed that UAE family offices and sovereign-linked investors were not unhappy to buy at a discount.
The remarks underscore a practical reality for large-scale allocation: for patient capital, drawdowns can improve entry terms and reduce the risk of buying at potentially overextended levels. For traders, it also highlights that short-term market declines may not deter longer-term participants—especially those able to execute steadily rather than chase trends.
Known sovereign examples: Mubadala and Bhutan
The source highlights specific sovereign-related examples to illustrate the pattern. It notes that Abu Dhabi’s Mubadala Investment Company invested $437 million in BTC via BlackRock’s iShares Bitcoin Trust (IBIT) shares in February 2025. It also points to Bhutan’s Druk Holding and Investments as an early and more direct sovereign holder, while stating that the company has been selling some BTC this year, referencing Cointelegraph coverage of those sales.
Taken together, these examples point to a broader institutional learning curve: sovereign entities have already tested mechanisms for gaining Bitcoin exposure, and the current phase may be characterized by more deliberate scaling and timing—potentially shifting from ETF vehicles toward spot accumulation, as Al Askari suggested.
For readers, the next thing to watch is whether ETF outflows remain elevated as corporate and sovereign-related buyers continue adding, and whether Al Askari’s “one, possibly two” additional sovereign funds materialize publicly in the weeks ahead. That will help clarify whether this is a one-off window for discounted entries—or the start of a more durable institutional accumulation cycle.
Crypto exchange users in Australia will soon face stricter rules on all transfers as the country’s travel rule is set to come into force on Wednesday, aligning it with similar rules in the EU, US and UK.
From July, all crypto sent and received on locally-regulated crypto exchanges will require users to provide additional information, such as the name of the person the crypto is being sent to or received from, and the name of the platform.
Gabby Lewis, the head of fraud and financial crime at Swyftx, told Cointelegraph that for most exchange users, “the impact should be very limited. They’ll provide the required details once, and then these will be saved for future use.”
The rules are set to bring Australia in line with other countries that have implemented the travel rule for years, which the Financial Action Task Force, an international policy-making body, first extended to crypto in 2019.
Crypto users have long expressed concern that the rule would impact the anonymity of the technology and the risks of data linking crypto transfers to personal information being leaked.
However, Lewis said that the “travel rule isn’t crypto-specific. It already applies across financial services and has been implemented in areas including Singapore, the United States, New Zealand and the UK. Australia is now following suit.”
The rule aims to prevent money laundering, terrorist financing and scams by increasing the traceability of crypto transfers. It will be enforced by the Australian Transaction Reports and Analysis Centre (AUSTRAC), the country’s financial intelligence agency.
Transfers from a regulated crypto exchange to a self-custodial address, such as a cold storage wallet, will also prompt a user to verify and declare that they are the owner of that address.
“We’re generally talking about a quick confirmation that the wallet is theirs,” Lewis said. “The additional steps mainly come into force for transfers that involve another party or another exchange.”
Australia’s travel rule has no minimum value threshold, meaning a transfer of any size will require an exchange to gather information, aligning it with countries including France, the Netherlands and Japan that have no minimum.
Source: Sam Green
Other countries have set minimum reporting thresholds, such as the US, which only collects information on transfers starting at $3,000.
Some crypto exchanges operating in Australia have already begun to implement the travel rule, such as Kraken, which started on March 31, and CoinJar, which started on Tuesday.
Related: Australia passes digital asset bill bringing crypto platforms under licensing
Crypto users online have recently given mixed reactions to the rule, which the Australian parliament passed into law in 2024.
“With these new rules, you can forget about sending crypto anonymously,” a Reddit user wrote earlier this month.
“New travel rule is insane,” another Reddit user wrote earlier in June. “Thinking of moving everything to cold storage instead now.”
In response, one Reddit user said that “the regulated platforms were never anonymous.”
“This is less of a problem than you’re making it out to be unless you’re involved in activities the authorities would be interested in already,” another user wrote.
Magazine: Crypto scammers face death, Aussie CGT makes Asian hubs attractive: Asia Express


Self-exiled Chinese billionaire Miles Guo has been sentenced to 30 years in a U.S. prison after being convicted in a fraud scheme that prosecutors said stole more than $1 billion from investors through multiple ventures, including cryptocurrency.
Summary
- Miles Guo was sentenced to 30 years in a U.S. prison and ordered to forfeit $889 million after his fraud conviction.
- Prosecutors said the scheme raised more than $1 billion from investors through multiple ventures, including the Himalaya Exchange and Himalaya Coin.
- The sentencing comes as crypto related financial crime continues to face tighter enforcement in both the United States and China.
According to multiple media reports, U.S. District Judge Analisa Torres handed down the sentence on Monday and ordered Guo, also known as Guo Wengui, to forfeit $889 million in restitution.
The sentencing follows a July 2024 jury verdict that found Guo guilty on nine fraud and conspiracy charges after prosecutors accused him of raising money from hundreds of thousands of online followers through false investment promises tied to businesses under his control.
Crypto scheme formed part of fraud case
Federal prosecutors had alleged that Guo attracted investors by presenting himself as a critic of the Chinese Communist Party after fleeing China more than a decade ago, while using that reputation to promote fraudulent investment opportunities.
According to the U.S. Department of Justice, one of those ventures was the Himalaya Exchange, a cryptocurrency ecosystem that collected more than $262 million from victims. The department said Guo later spent investor funds on luxury assets, including a mansion and high end vehicles.
Earlier court filings from the DOJ said Guo orchestrated a scheme that defrauded thousands of investors of more than $1 billion after his arrest in March 2023.
At the sentencing hearing, the Associated Press reported that Guo told the court he came to the United States “to destroy the CCP.” AP also reported that Judge Torres said Guo had preyed on supporters seeking democracy in China and had continued to deny causing financial harm.
SEC case remains part of wider enforcement action
Separate from the criminal prosecution, the U.S. Securities and Exchange Commission charged Guo and his financial adviser, William Je, in March 2023 over an alleged fraud that raised hundreds of millions of dollars through an unregistered crypto asset known as H Coin, or Himalaya Coin.
According to the SEC complaint, Guo falsely claimed the token was backed by gold and assured investors they would be reimbursed for any losses. The regulator also accused Guo and Je of diverting investor funds to finance luxury purchases, including a mansion and a Ferrari, while seeking permanent injunctions, civil penalties and the recovery of alleged illegal gains.
The SEC and DOJ announced their actions on the same day in March 2023, with the Justice Department filing a 12-count indictment that included securities fraud, wire fraud, investment fraud and money laundering charges against Guo. William Je was also charged with obstruction of justice, while authorities said they seized about $634 million held across 21 bank accounts linked to the investigation.
Guo is also known for his association with former Donald Trump strategist Steve Bannon. In 2020, the pair announced the New Federal State of China initiative, describing it as an effort to overthrow the Chinese government.
Elsewhere, Chinese authorities have also stepped up enforcement against cryptocurrency-related financial crimes.
China’s Supreme People’s Procuratorate said on June 25 that prosecutors had charged more than 1,200 people for drug related money laundering cases between January 2025 and May 2026, including schemes involving cryptocurrencies.
The disclosure came as China announced a death sentence for a convicted drug trafficker found to have laundered more than 48 million yuan, or about $7 million, through cryptocurrency as part of a cross-border narcotics operation.

The US Supreme Court ruled 5-4 on June 29 that President Donald Trump cannot remove Federal Reserve Governor Lisa Cook, for now. Still, the decision preserves the Fed’s independence at the worst possible time for Bitcoin.
The ruling locks in a hawkish Fed that has already eliminated rate cut expectations for 2026 and put hikes back on the table. High rates keep pressure on zero-yield assets like Bitcoin, and Monday’s decision removes one of the few near-term paths to a more dovish board.
A Hawkish Fed Just Got More Secure
Cook’s survival matters for rate policy. Trump wanted her gone so he could, instead, install a governor more open to rate cuts. The court blocked that move.
The timing stings for crypto markets. The June Federal Open Market Committee meeting eliminated rate cut projections for 2026 entirely and put hikes back on the table. Bitcoin ETF outflows continued through June as investors rotated away from zero-yield assets.
BTC dropped below $60,000 on Monday, meaning it is now down more than 50% from its all-time high.
Monday’s ruling locks in the Warsh-led, hawkish Fed, at least until lower courts resolve the underlying case. Trump cannot sidestep that by firing governors at will.
“This was never about mortgage documents … It was an attempt to remove me on a manufactured pretext because I refused to bow to political pressure.”
— Lisa Cook, Federal Reserve Governor, statement
What Case Does Trump Have Against Cook?
The case against Cook centers on allegations from FHFA Director Bill Pulte, who accused her of mortgage fraud in August 2025. Pulte claims Cook listed two properties, one in Michigan and one in Georgia, as primary residences within weeks of each other in 2021, notably before she joined the Fed board.
Cook’s attorney called the claim baseless, saying it rests on a single ambiguous reference in one mortgage document.

Cook and her allies argue that the timing reveals the real motive. Trump moved to fire her after months of pressuring the Fed to cut rates faster, and Cook had voted to hold rates steady. Ultimately, the court said no to the firing.
Yet, the fact that this case reached the Supreme Court at all is proof of concept. As Trump’s appointment of Warsh showed, political pressure on the Fed does not require firing anyone. It just requires choosing the right chair.
The post Supreme Court Blocks Trump From Firing Governor Leaving Bitcoin with Hawkish Fed appeared first on BeInCrypto.

Cloudflare: Too Expensive, Too Little Room For Error

European Currencies Enter Consolidation Ahead of Key Macroeconomic Data
All 9 Live-Action Batman Actors, Ranked


-
 Sports7 days ago
Two goals and an assist by sheer aura: Cristiano Ronaldo just entered the World Cup chat
-

 Fashion4 days ago
Weekend Open Thread: Staud – Corporette.com
-

 Politics4 days ago
The House | Manchesterism won’t survive the painful trade-offs unless it gets citizens on board
-

 Politics4 days ago
Potential 2028er World Cup attendee leaderboard
-

 News Videos2 days ago
MAJOR BITCOIN & MARKET UPDATE!!!! (MUST WATCH ASAP!!!)
-

 Business4 days ago
Asia stock markets slide as tech shares slump
-

 Tech4 days ago
A Look At A Gaggle Of Transputer Boards
-

 Crypto World6 days ago
Securitize Wraps Roubini's SEC-Registered ETF as Dubai VARA Digital Security
-
Crypto World6 days ago
Bitcoin (BTC) Dips Below $62K, Ethereum (ETH) Plunges 6% Daily: Market Watch
-
 Crypto World5 days ago
Dell (DELL) Shares Tumble Over 5% Following Analyst Downgrade to Hold
-

 Crypto World3 days ago
Coinbase, Circle Deepen Crypto Stock Losses Despite Resilient S&P 500
-
Business6 days ago
Entergy settles forward sale agreements, raises $672 million in cash proceeds
-

 Crypto World3 days ago
Kraken's xStocks Opens Bending Spoons IPO Registration to EEA Retail
-

 Sports3 days ago
FIH Pro League: India defeat Pakistan 7-1, register biggest win of campaign | Other Sports News
-

 Tech2 days ago
Bluekit phishing kit adopts browser-in-the-middle for login theft
-
 Crypto World4 days ago
Bitcoin Sparks $600M Hourly Liquidations With $65,000 Set To Become Resistance
-

 Tech3 days ago
Russian hackers now target Signal backup recovery keys
-
 Crypto World4 days ago
Hyperliquid Named on Singapore MAS Investor Alert Register
-

 Crypto World4 days ago
RTX holders must register wallets before token distribution begins
-
 Crypto World5 days ago
Ripple and SBI launch RLUSD in Japan after JFSA approval
You must be logged in to post a comment Login