
Crypto World
What Is a Change of Character (CHoCH) in Trading? Definition, Signals, and Examples
In Smart Money Concept (SMC) trading, recognising when market momentum shifts can mean the difference between catching a trend reversal and holding a losing position. The Change of Character (CHoCH) is a price action pattern that can signal these pivotal moments when the balance between buyers and sellers tips. Unlike continuation patterns that confirm ongoing momentum, a CHoCH alerts traders to prepare for directional changes.
This article explores how to identify CHoCH patterns on a chart, explains how they differ from similar concepts like Break of Structure and Market Structure Shift, and demonstrates their practical application through real trading examples.
Takeaways
- CHoCH is a concept that signals potential trend reversals in Smart Money Concept trading. This pattern has two forms: bullish CHoCH and bearish CHoCH. A bullish CHoCH occurs when price breaks above a recent lower high in a downtrend, while a bearish CHoCH happens when price falls below a recent higher low in an uptrend, indicating possible momentum shifts.
- A CHoCH is usually compared to a Break of Structure (BOS). However, these concepts are opposite. BOS confirms trend continuation by breaking in the direction of the existing trend, whereas CHoCH signals a potential reversal by breaking against the prevailing trend.
- Another common pattern the CHoCH is compared to is a Market Structure Shift (MSS). However, MSS is a higher-confluence CHoCH that includes additional confirmation signals like a lower high (bearish) or higher low (bullish) before the break, plus strong displacement.
- Change of Character patterns can be found across all timeframes, from intraday to weekly charts, with higher-timeframe signals generally carrying more significance.
Understanding Breaks of Structure
Before delving into concepts like Change of Character (CHoCH) traders should understand the Breaks of Structure (BOS) pattern. A BOS in trading signifies a continuation within the current trend and is marked by a clear deviation from established swing points that indicate previous highs and lows.
In the context of an uptrend, a BOS is identified when the price exceeds a previous high without moving below the most recent higher low. This action confirms that the upward momentum is still strong and likely to continue as buyers push the market to new heights.
Similarly, in a downtrend, a BOS occurs when prices drop below a previous low without breaking the prior lower high, suggesting that sellers remain in control and the downward trend is set to persist.
By recognising these points where the market extends beyond its former bounds, traders can confirm that the current trend is robust and act accordingly. This foundational concept of BOS may not only help in assessing trend strength but also sets the stage for understanding more complex patterns like CHoCH, where the focus shifts from trend continuation to potential trend reversals.
CHoCH Trading Meaning

In trading, a Change of Character (CHoCH) is a concept that reflects a potential shift in market dynamics, often indicating a reversal from the prevailing trend. It may help traders discern when the momentum is shifting, offering a strategic point to consider adjusting their positions.
A CHoCH occurs when there’s a noticeable deviation in the market’s price trend. For example, in a bullish trend characterised by a series of higher highs and higher lows, a CHoCH is indicated by the price failing to set a new high and subsequently falling below a recent higher low. This suggests that buyers are losing control, and a bearish trend could be emerging.
Similarly, during a bearish trend marked by lower highs and lower lows, a bullish CHoCH would occur if the price unexpectedly breaks above a recent lower high. This break indicates that sellers are losing their grip, and a bullish trend may be starting.
The Significance of CHoCHs Across Timeframes
The fractal nature of financial markets means that patterns and behaviours recur across various timeframes, each providing unique insights and implications for trading. Understanding CHoCHs in different timeframes may help traders align their strategies with both short- and long-term trend shifts. This is known as multi-timeframe analysis.
In intraday trading, where decisions are made on lower timeframes (like minutes or hours), a CHoCH can signal a possible short-term trend reversal. For example, if a currency pair in a downtrend on a 15-minute chart suddenly posts a higher high, this could indicate a weakening of the bearish momentum, suggesting a potential bullish reversal.
Traders might use this information to close short positions or to consider a long position, capitalising on the emerging upward trend. These short-term CHoCHs allow traders to respond quickly to market changes, potentially securing returns before larger market shifts occur.
Conversely, CHoCHs observed on higher timeframes, such as daily or weekly charts, are particularly significant because they can indicate a shift in the broader market trend that might last days, weeks, or even months. Such changes can then be used by both long and short-term traders to adjust their positioning and directional bias.
How Is Change of Character Identified?
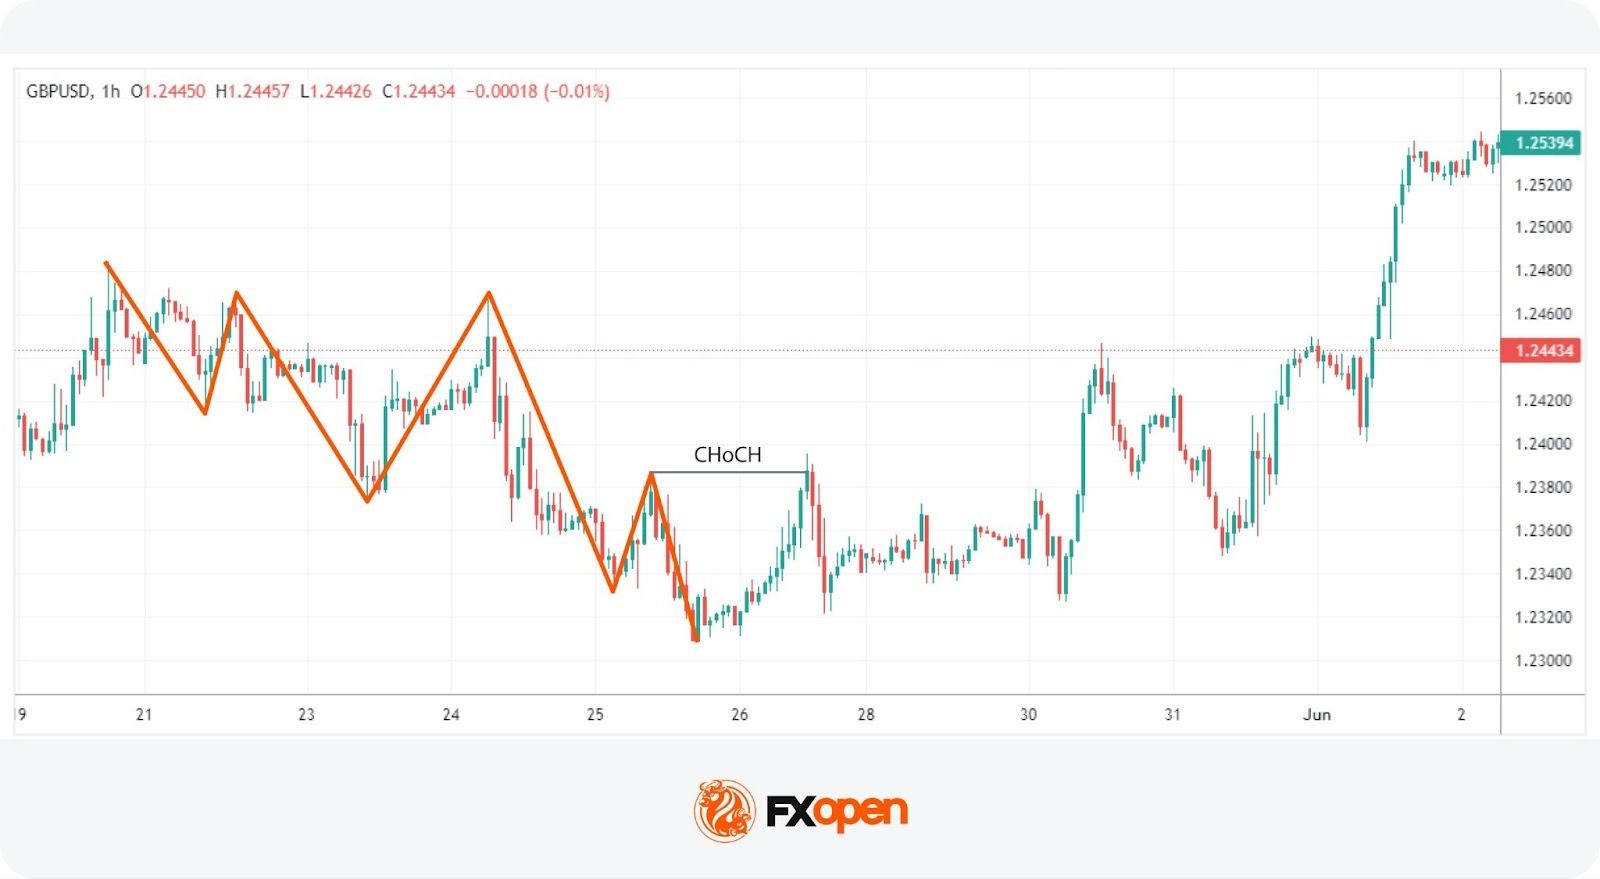
The initial step to identify a CHoCH in trading involves clearly defining the existing trend on a specific timeframe. This is done by marking the significant swing highs and lows that delineate the trend’s progress. These points should represent somewhat meaningful retracements in the price, providing clear markers of trend continuity or potential reversal points.
According to the Smart Money Concept (SMC) theory, the integrity of an uptrend is maintained as long as the price does not trade through the most recent significant higher low. Conversely, a downtrend is considered intact if the price does not surpass the most recent significant lower high. Therefore, traders focus their attention on these critical points.
To identify a CHoCH, traders watch for a break in these crucial high or low points. For instance, in an uptrend, a bearish CHoCH is indicated when the price achieves a higher high but then reverses to descend below the previous significant higher low.
Similarly, in a downtrend, a bullish CHoCH occurs when the price drops to a lower low before reversing to break above the previous significant lower high, setting a new high. Both types of breaks signal a potential reversal in the trend direction.
To try and spot your own CHoCHs, you can head over to FXOpen’s TickTrader platform to access real-time charts and numerous market analysis tools.
Application of CHoCH
CHoCHs should be integrated with other aspects of the SMC framework. This includes the use of order blocks and imbalances, which are important components in identifying potential reversals.
Order Blocks and Imbalances
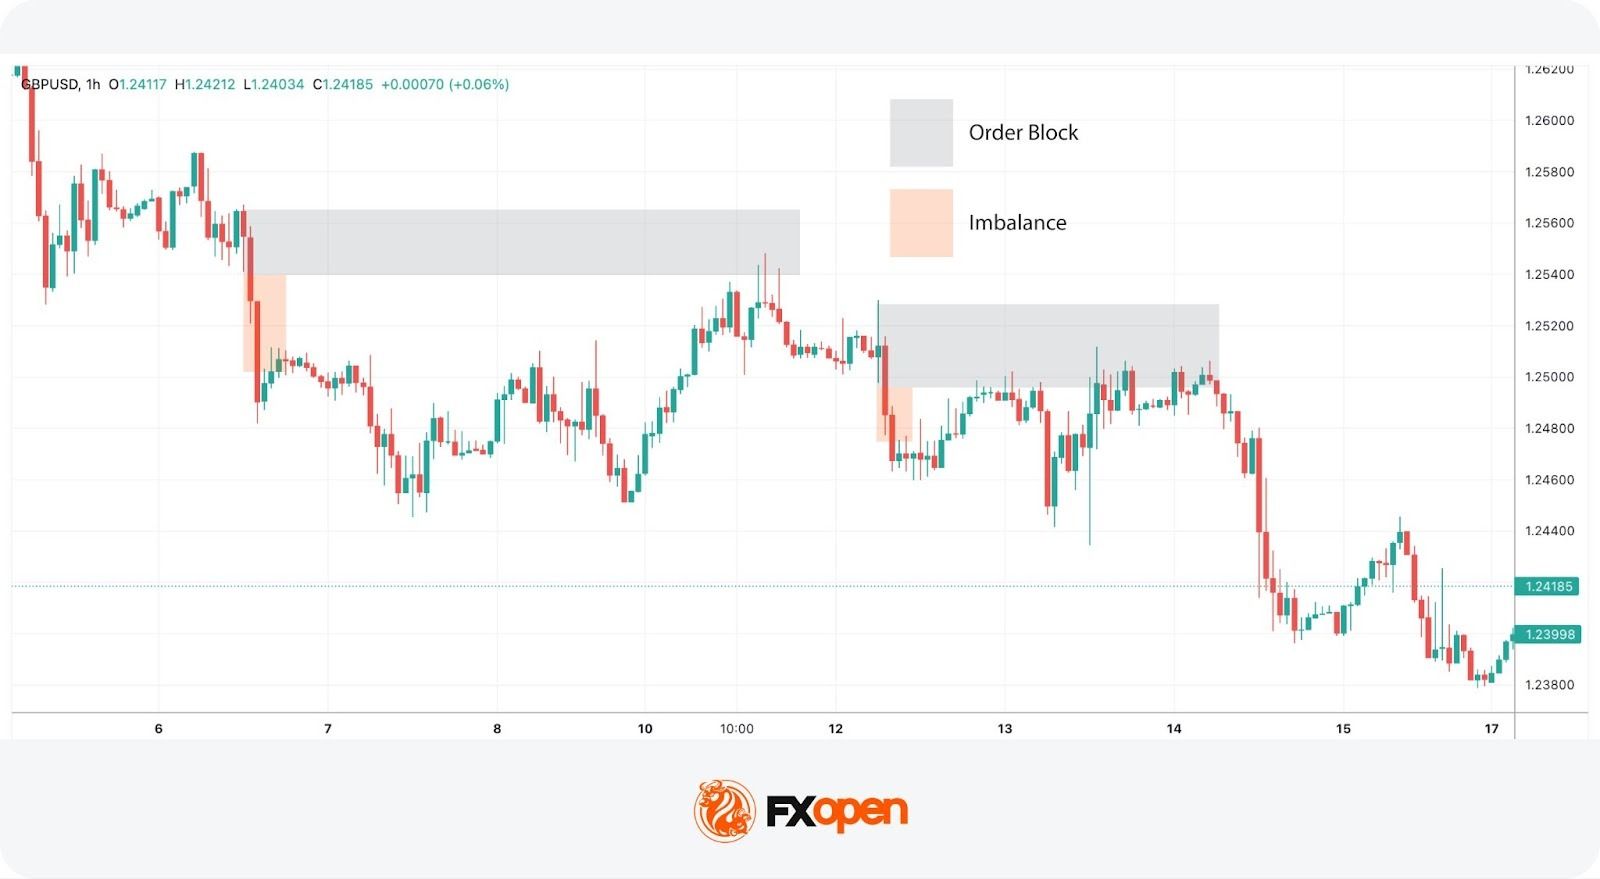
An order block is essentially a substantial consolidation area where significant buying or selling has occurred, and prices often revisit these zones before reversing. These blocks can be seen as levels where institutional orders were previously concentrated.
An imbalance, also known as a fair value gap, occurs when the price moves sharply up or down, leaving a zone that has not been traded extensively. Price often returns to these gaps to ‘fill’ them, establishing equilibrium before a potential reversal happens.
In practice, traders can look for a sequence where the price first approaches an order block and begins to fill any existing imbalances. This setup increases confidence in a potential reversal. As the price meets these criteria and a CHoCH occurs, this indicates that the influence of the order block is likely to initiate a price reversal.
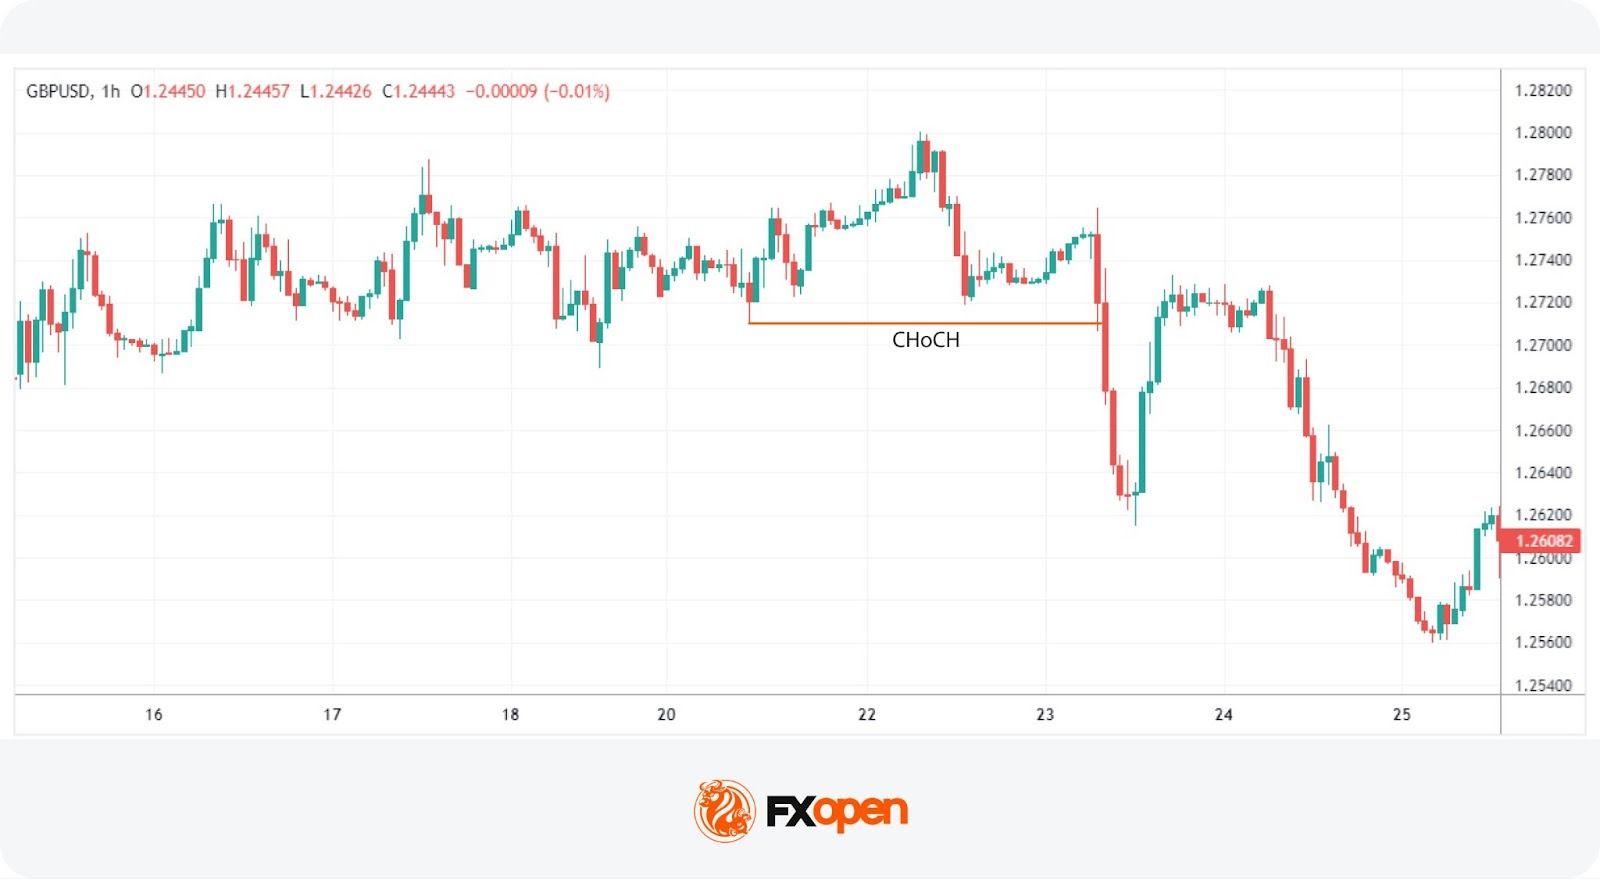
Practical Example on GBP/USD
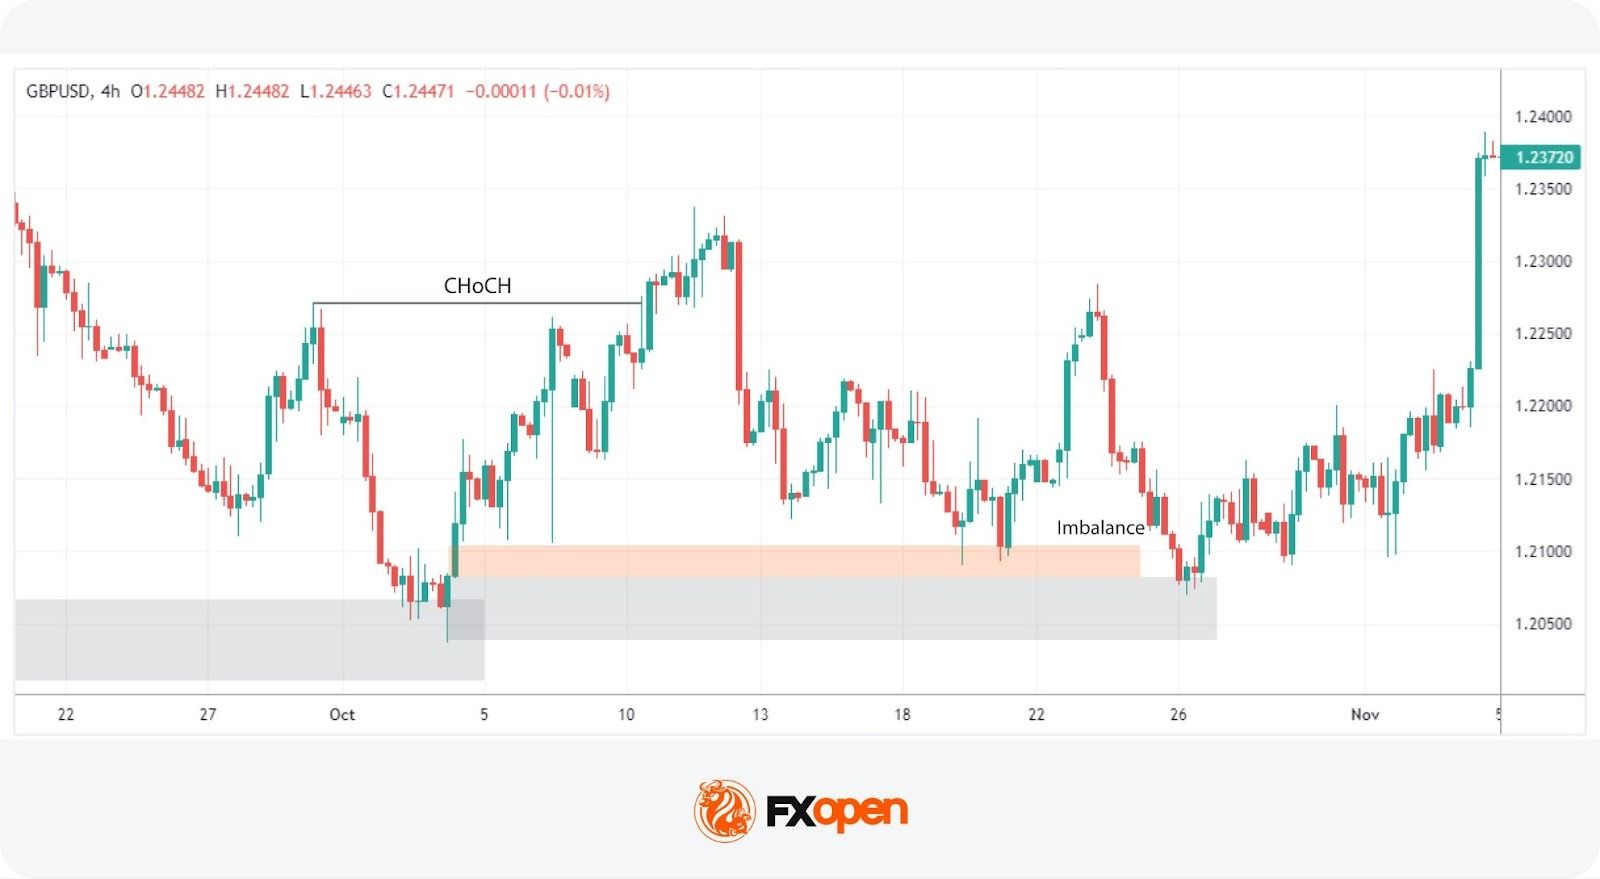
Consider the 4-hour chart of the GBP/USD pair above. We see the pair encounter an order block on the left, one that’s visible on the daily chart. As the price interacts with this block, it begins to retrace, attempting to fill the imbalance but moves away. Eventually, the price completes the fill of the imbalance and meets the previously established order block.
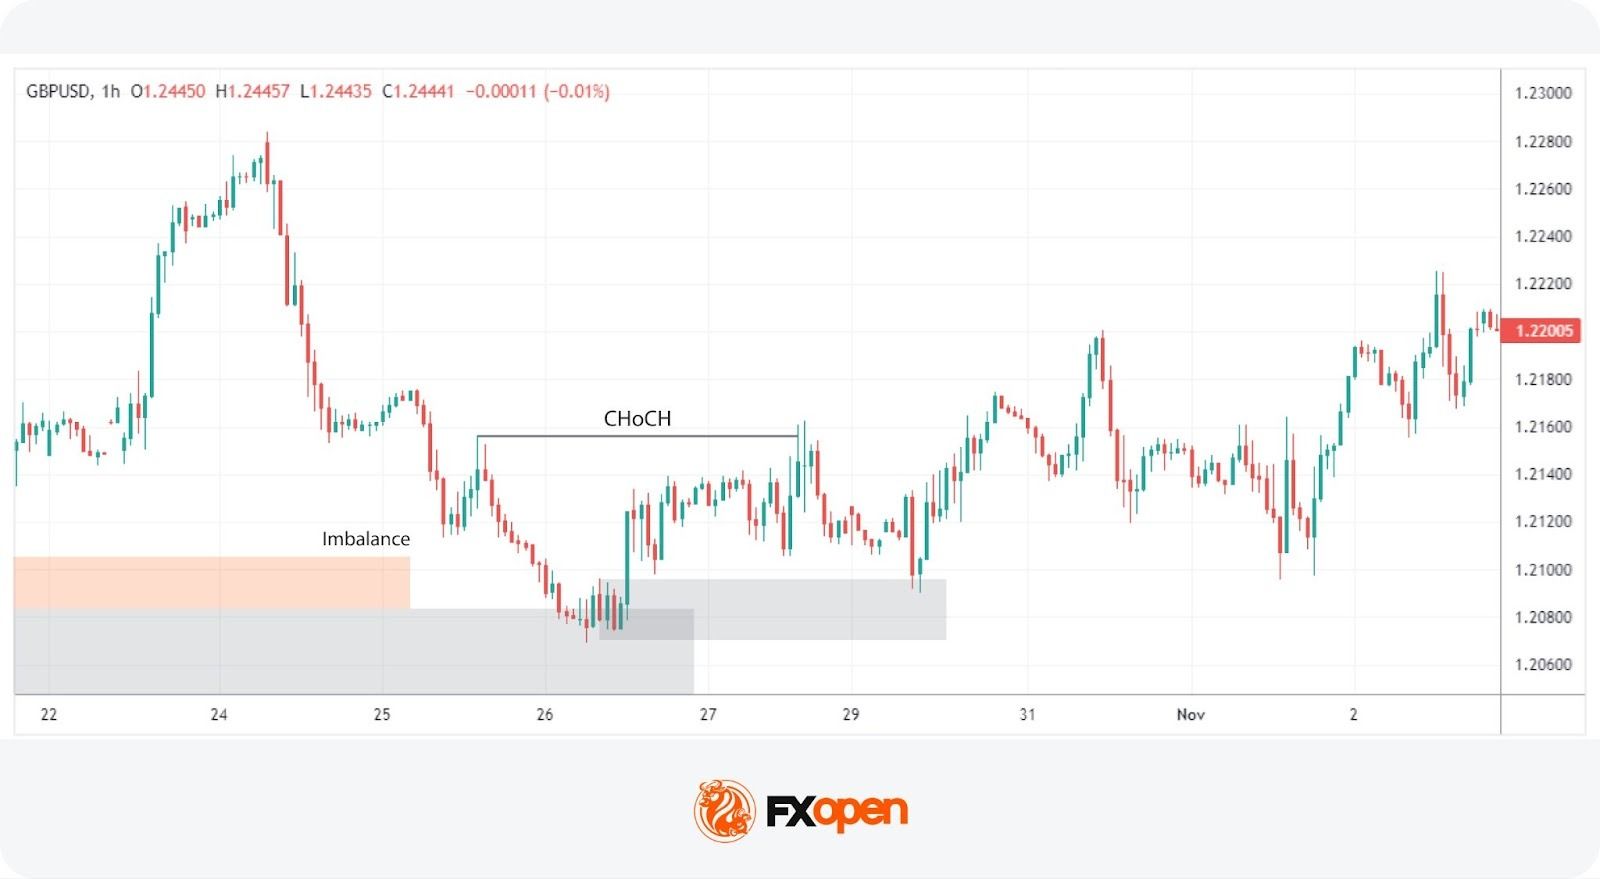
Switching to a 1-hour timeframe, this scenario unfolds similarly. After reaching the order block on the 4-hour chart, another CHoCH occurs, signalling the start of a new uptrend. This lower timeframe CHoCH, following the meeting of the order block, corroborates the potential for a reversal initiated by the higher timeframe dynamics.
This example illustrates how CHoCHs can be utilised across different timeframes, tying back to the fractal nature of markets discussed earlier. By recognising these patterns and understanding their interaction with order blocks and imbalances, traders can strategically position themselves to capitalise on potential market reversals, aligning their trades with deeper market forces at play.
Change of Character vs Market Structure Shift
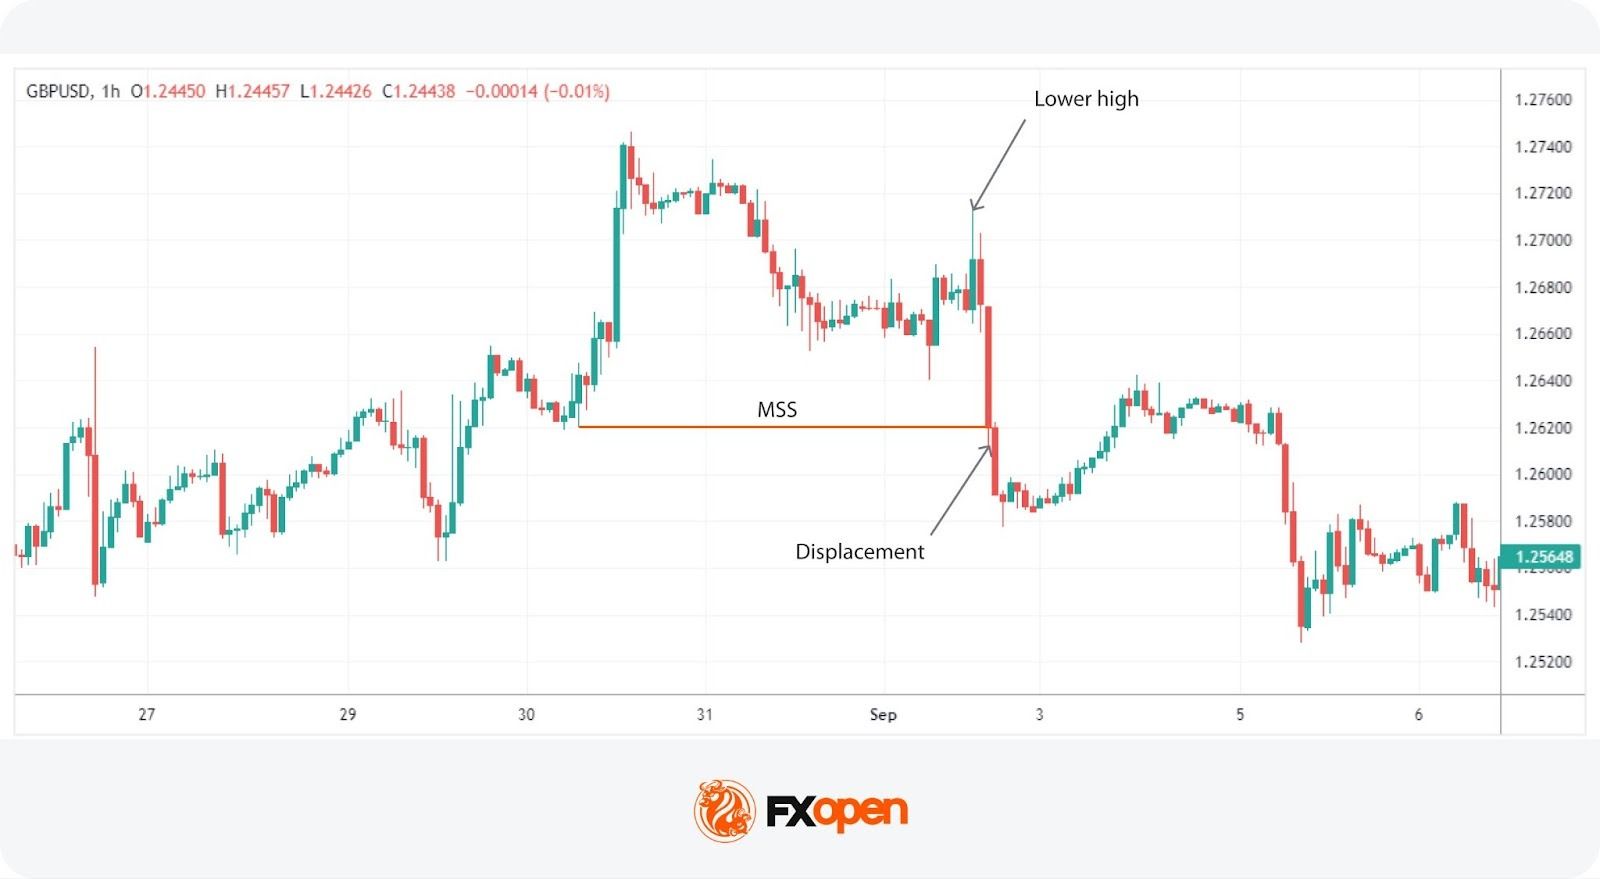
A Market Structure Shift (MSS) is a specific type of Change of Character that includes additional signals suggesting a potential trend reversal. Unlike a straightforward CHoCH that typically indicates a trend is shifting but may also be a false break, an MSS can be seen as a higher confluence CHoCH. An MSS occurs after the market first makes a key movement contrary to the established trend—forming a lower high in an uptrend or a higher low in a downtrend—without plotting a higher high or lower low.
Following these preliminary signals, an MSS is confirmed when there is a decisive break through a significant swing point accompanied by a strong displacement (i.e. impulse) move, creating a CHoCH in the process. This sequence not only reflects that the prevailing trend has paused but also that a new trend in the opposite direction is establishing itself.
Due to these additional confirmations, an MSS can offer added confirmation for traders, indicating a stronger likelihood that a new, sustainable trend has begun. This makes the MSS particularly valuable for traders looking for more substantiated signals in their trading strategy.
The Bottom Line
The Change of Character (CHoCH) is one of the popular Smart Money concepts, offering traders valuable insight into potential market reversals. By learning to identify CHoCH patterns, traders can align their strategies with institutional order flow. However, as with any trading tool, CHoCH isn’t used in isolation but combined with other market analysis techniques.
To test different trading approaches, you can consider opening an FXOpen account and access a wide range of financial assets, low commissions*, and tight spreads* (*additional fees may apply).
FAQ
What Is CHoCH in Trading?
In trading, CHoCH is a technical observation that signifies a change in the trend’s character, where the price movement breaks from its established pattern of highs and lows, suggesting a potential reversal or substantial shift in the market’s direction.
What Is CHoCH in SMC Trading?
In Smart Money Concept (SMC) trading, a Change of Character (CHoCH) refers to a clear shift in market behaviour that indicates a potential reversal of the prevailing trend. This concept is used by traders to detect early signs of a momentum shift that might lead to significant changes in price direction, enabling strategic adjustments to their trading positions.
What Is a CHoCH in the Market Structure?
A CHoCH in market structure is identified when there is an observable deviation from established price patterns — specifically when new highs or lows contradict the current trend. It signifies that the previous market sentiment is weakening, and a new opposite trend may be starting, prompting traders to reassess their strategies.
How Is CHoCH Identified on a Price Chart?
Identifying a CHoCH involves monitoring significant swing highs and lows for breaks that are contrary to the existing trend. For instance, in an uptrend, a CHoCH would be indicated by a failure to reach a new high followed by a drop below the recent higher low, suggesting a shift to a bearish outlook.
What Is ChoCH vs BOS in Trading?
While both CHoCH and Break of Structure (BOS) are critical in assessing market dynamics, they serve different purposes. CHoCH indicates a potential trend reversal by highlighting a significant change in the price pattern. In contrast, a BOS indicates a continuation of the current trend by showing the price surpassing previous significant highs or lows, reinforcing the ongoing direction.
This article represents the opinion of the Companies operating under the FXOpen brand only. It is not to be construed as an offer, solicitation, or recommendation with respect to products and services provided by the Companies operating under the FXOpen brand, nor is it to be considered financial advice.


Why is Crypto Up? BTC just bounced above $67,000 from a $65,000 low, a 1.1% run on the day, clinging to gains that look thin against a backdrop of six consecutive red monthly closes.
March has been a grind. Bitcoin ranged from $65,000 on March 2 to a high of $75,000 on March 17, before sliding back to $68,000 by March 23 as U.S.-Iran geopolitical tensions amplified sell pressure. A record $14+ billion in options expiry compounded the volatility, forcing liquidations across the board.
Robinhood’s prediction market for BTC price shows contract activity concentrated at sub-$57,300 levels, a quiet but telling signal of where crowd sentiment actually sits. ETF inflows remain a counterweight, but geopolitical risk is winning the narrative for now. That tension between institutional demand and macro fear sets up a price structure that deserves close attention.
Discover: The best crypto to diversify your portfolio with
Really, Why is Crypto Up? Can Bitcoin Break $120K or Is This A Dead Cat Bounce?
At $67,000, Bitcoin holds a 2.5% gain over 30 days, a move that looks impressive until you stack it against the six red months. The short-term picture is murkier. The March low at $65,000 end of last week, driven by tension-led selling, now serves as the key structural support.
Resistance sits at the $74,400 March high, with it also acting as the psychological ceiling that traders are watching in real time.
Momentum is consolidating rather than accelerating. Volume has not confirmed the weekly uptick, and the slight intraday jump suggests buyers aren’t pressing hard. Rising Treasury yields continue to drain risk appetite, capping upside for speculative assets across the board.
#BTC is showing a key structural signal: — KriptoHolder
Price is rising while Open Interest is declining.
This indicates that the move is not driven by new long positions, but by short liquidations.
• Short squeeze is active
• The market is moving up by clearing out short positions
• Spot… https://t.co/iguy1aboCc pic.twitter.com/KwWEk78NYo
 (@kriptoholder) March 30, 2026
Three scenarios are in play. BTC could hold above $65,000 into the weekly close, ETF flows accelerate, and a push back toward $72,000 becomes viable within days. A rangebound chop between $65,000 and $68,000 could also persist through April as macro uncertainty lingers. But a daily close below $69,000 would invalidate the near-term bullish structure entirely, reopening a retest of March lows.
Extreme Fear sentiment, as flagged by multiple analysts, remains a drag that technical levels alone cannot override.
Discover: The best pre-launch token sales
LiquidChain Targets Early-Mover Upside as Bitcoin Tests Key Levels
Six red months compress capital and patience simultaneously. Traders holding blue-chip positions through this drawdown are questioning whether the next leg up rewards spot holders or whether early-stage infrastructure plays capture more asymmetric upside at this point in the cycle.
LiquidChain ($LIQUID) is a Layer 3 infrastructure project positioning itself as the cross-chain liquidity layer, fusing Bitcoin, Ethereum, and Solana liquidity into a single execution environment. Developers deploy once and access all three ecosystems through a Unified Liquidity Layer, Single-Step Execution, and Verifiable Settlement architecture.
A new layer emerges. Only a few see it first. — LiquidChain (@getliquidchain) March 24, 2026
The future is LiquidChain  ⟁https://t.co/vqvBcdSj94 pic.twitter.com/R7ZeZ0NPGl
That’s a direct response to the fragmentation that makes cross-chain DeFi unnecessarily expensive and slow. The presale is priced at $0.0144, with more than $600K raised to date, early-stage by any measure, especially with 1700% APY rewards as a bonus.
For traders navigating a market that keeps delivering red closes, researching LiquidChain may be worth the time before the presale price moves.
This article is not financial advice. Crypto assets are highly volatile. Always conduct your own research before investing.
The post Why Is Crypto Up? Six Straight Red Months Despite Today’s Bounce appeared first on Cryptonews.


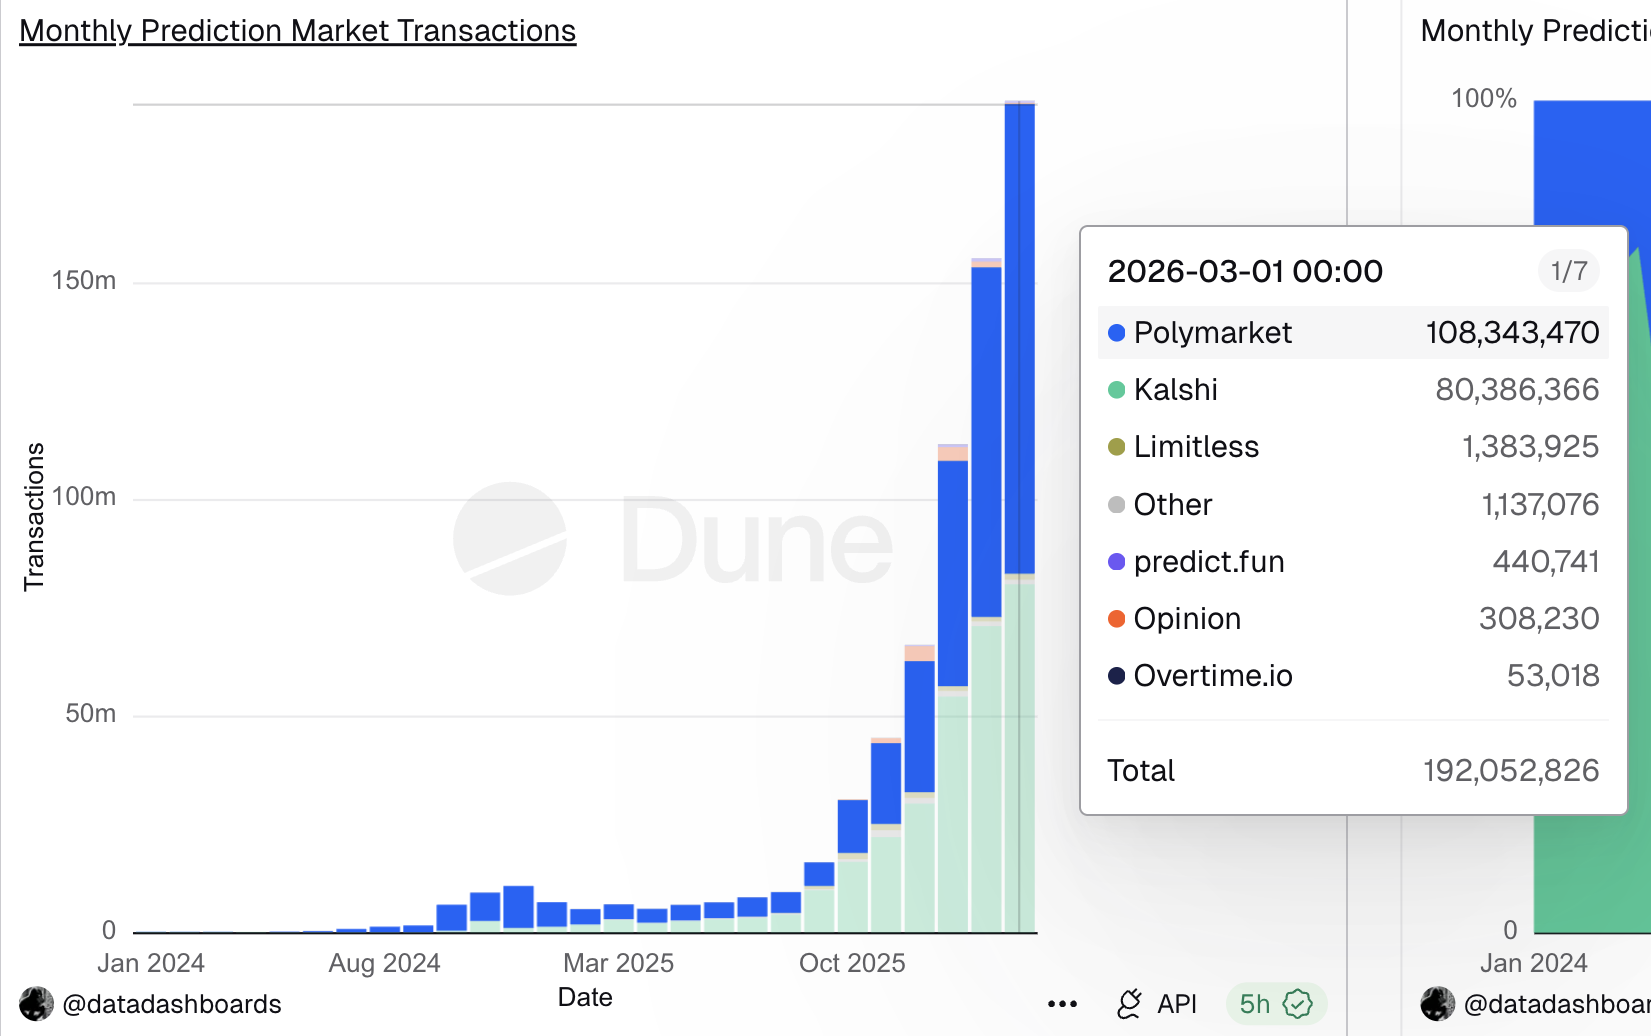
Prediction market usage hit record levels in March, supported by improved accessibility and favourable regulatory developments amid rising interest in political and geopolitical event contracts.
Summary
- Prediction market transactions crossed 191 million in March, with trading volume rising to about $23.9 billion, reflecting a sharp jump from last year.
- Geopolitical and macroeconomic events now drive most activity, while crypto-related markets account for a smaller share of overall trading.
According to a report published by TRM Labs, the prediction market sector has expanded rapidly as Google Finance integrations and increased visibility of live odds across mainstream media.
Prediction markets are platforms that allow users to trade on the outcomes of future events by buying and selling contracts tied to real-world developments.
These markets are now being “increasingly used as real-time indicators of geopolitical and macroeconomic events,” TRM Labs said, adding that their growth has been supported by improved accessibility, evolving regulatory clarity, and integration with mainstream platforms.
Data from Dune Analytics shows that the total number of transactions hit over 191 million in March so far, marking an increase of more than 2,800% from the same period last year.
Meanwhile, monthly notional trading volume stood at roughly $23.9 billion in March, up from $1.9 billion at the same time last year, but still below January’s all-time high by about 12%.
Monthly unique wallets also tripled to around 840,000 by February 2026, a trend that reflects what TRM described as “a broad expansion of the participant base,” rather than just larger bets from existing users.
Much of this activity is being driven by geopolitical events and macroeconomic developments, according to TRM Labs, which now dominate trading volumes across platforms.
“Crypto-native topics, while prevalent, now represent a smaller share of overall activity,” the report added.
On Polymarket, the highest-volume contracts as of Monday were centered on U.S. political outcomes, including party nominations for the 2028 presidential race, and geopolitical questions such as whether Israeli Prime Minister Benjamin Netanyahu will remain in office through year-end.
Growth in the sector has been accompanied by increased scrutiny, with Kalshi and Polymarket facing concerns tied to insider trading and compliance with state gambling laws.
Several U.S. states have launched enforcement actions, arguing that certain event-based contracts resemble unlicensed betting products under local regulations.
How platforms navigate these regulatory challenges and concerns around market integrity will shape the future growth of the sector, according to TRM Labs.
Polymarket and Kalshi have already announced measures to introduce trading guardrails and strengthen market integrity, but the broader regulatory outlook remains unresolved for now.

The bitcoin market has been stuck in a rut for over a month, and investors chasing yields may be partly to blame.
Since mid-February, BTC has traded in a range centred on $70,000. Some observers say counteracting forces have been at play. The Iran war-led haven demand has been supporting BTC around $65,000, while rising U.S. Treasury yields have been holding back big gains beyond $75,000.
But another factor appears to have been quietly keeping bitcoin trapped in its range, and it’s tied to investors using call options to generate additional yield on top of their spot market holdings.
“Throughout Q1, institutional participants have been systematically overwriting calls at higher strikes to harvest premium in a down/sideways market. That activity transferred significant gamma exposure to dealers, who have been hedging by buying into dips and selling into rallies to maintain delta neutrality,” James Harris, CEO at Tesseract, the MiCA-licensed, multi-strategy digital asset manager.
Options are derivative contracts that give you the right to buy or sell the underlying asset, in this case, BTC, at a preset price at a later date. A call option gives the right to buy and represents a bullish market bet. A put option offers protection against price slides in BTC.
Think of it like reserving a concert ticket today for a small fee. You can buy it later at the reserved price, even if the ticket goes up, or sell your reservation to someone else for a profit. The ticket seller, meanwhile, keeps the small fee.
That’s essentially what traders have been doing—they’ve become the ticket sellers. By selling call options, they collect premiums (the fee) while covering the call buyer on potential BTC price rallies. And they do this against their existing bitcoin holdings. That’s called the covered call strategy, a way of generating additional yield on top of spot holdings.
Now you might be wondering: what does this have to do with bitcoin’s range play? The answer lies in knowing that traders have been shorting, or selling, these calls to market makers – the firms that take the other side of these option trades.
By selling these calls, traders have left market makers with a position called positive gamma, which essentially means the market makers are forced to buy BTC as prices fall and sell BTC as prices rise to stay hedged. The result? A range-bound price action.
In other words, yield hunting by investors has been indirectly influencing market inflows in ways that limit price swings.
This also explains the decline in the bitcoin 30-day implied volatility index, BVIV, which stands in contrast to spikes in similar indices tied to equities, bonds and oil. The BVIV has declined 5% to 56% this month.
“The effect has been a mechanical suppression of realised volatility — the DVOL index has compressed by roughly six points this week despite the macro backdrop,” Harris said.
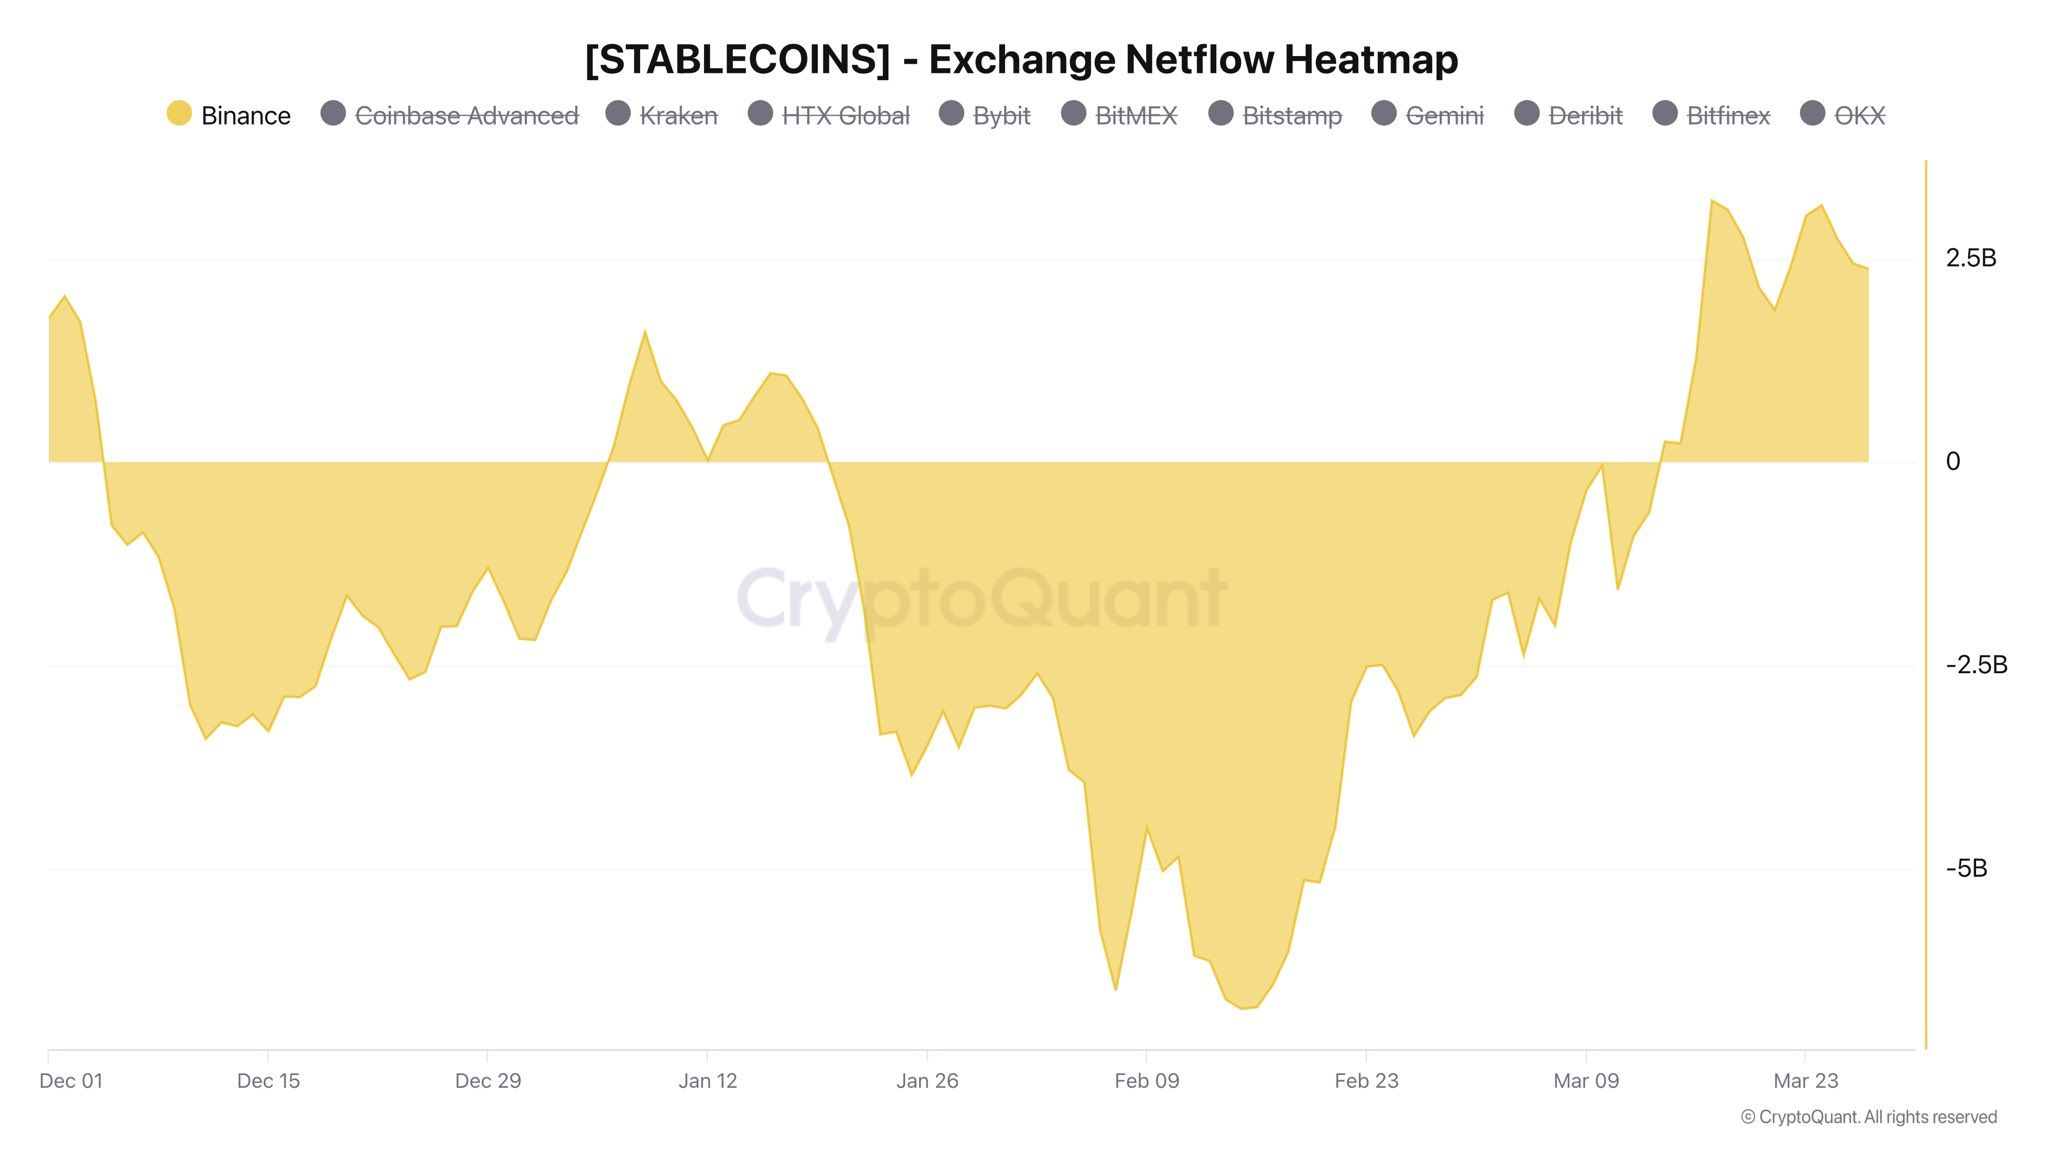
Stablecoin netflows on Binance have turned positive, marking a notable shift in market liquidity.
Analyst Darkfost noted that the exchange, which consistently leads global crypto trading volumes, has moved from recording net stablecoin outflows to net inflows of $2.4 billion.
The reversal follows earlier periods of heavy withdrawals, including $3.4 billion on December 11 and $6.7 billion on February 15.
Follow us on X to get the latest news as it happens
Liquidity Is Back on Binance, but Where Are the Traders?
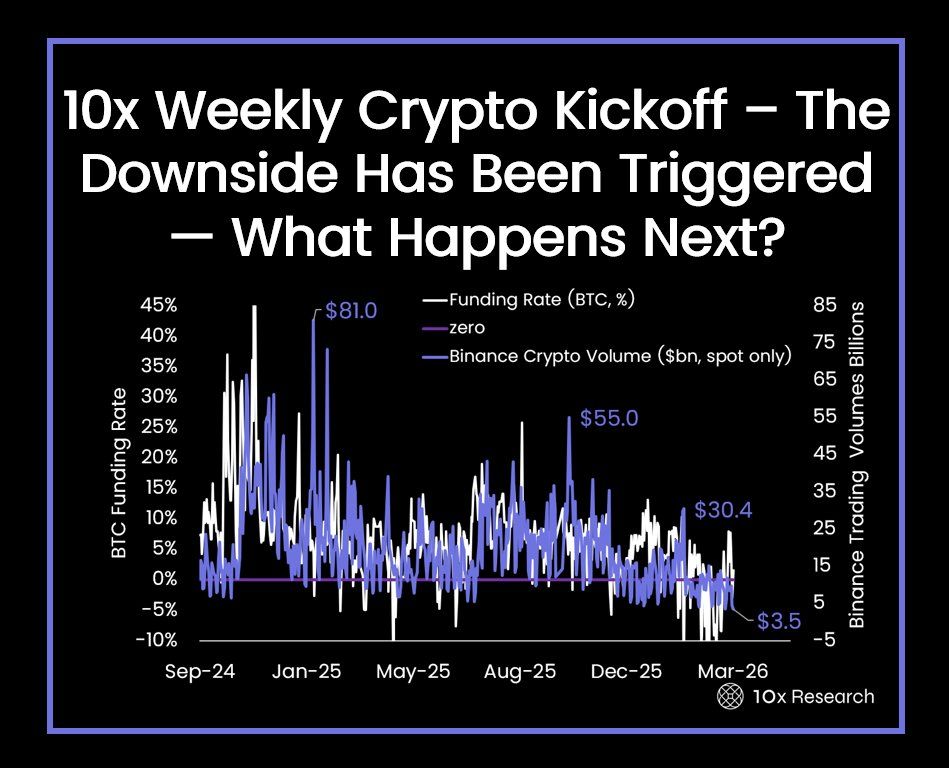
Stablecoins are widely viewed as deployable capital within the crypto ecosystem, and inflows to exchanges often indicate that traders are preparing to enter positions. However, actual spot trading activity tells a very different story.
Research firm 10x Research flagged that spot trading volume on Binance has fallen considerably since the beginning of 2025, dropping from $81 billion to just $3.5 billion.
This creates a notable disconnect. Investors are moving stablecoins onto exchanges, yet they are not converting that capital into positions. In effect, liquidity is building, but risk appetite has yet to follow.
“Liquidity support is fading, and as a new gamma profile takes shape, a move through key levels could amplify volatility and trigger outsized price reactions. This is not a market to be complacent in; low liquidation activity and weak volumes mask underlying fragility,” the analysts wrote.
The stance comes amid rising geopolitical tensions and mounting macroeconomic concerns over a potential recession. The ongoing US-Israel war involving Iran has rattled markets, sending oil prices sharply higher while putting pressure on equities.
“The crypto market is not spared, even though it has shown relative resilience over the past few weeks,” Darkfost said.
Thus, the shift from heavy outflows to renewed inflows suggests that capital is re-entering the market. However, until trading activity picks up, the data points to a market defined more by caution than conviction.
Subscribe to our YouTube channel to watch leaders and journalists provide expert insights
The post $2.4 Billion Stablecoin Inflows Hit Binance, But Traders Stay on the Sidelines appeared first on BeInCrypto.
Bittensor (TAO), the decentralized AI network token, has staged a dramatic recovery from its February lows, and on-chain data suggests the rally may have real legs.
CryptoQuant data tracking 90-day Spot Taker Cumulative Volume Delta (CVD), a metric measuring the balance between aggressive buyers and sellers on spot exchanges, shows a sustained flip toward buy-side dominance since the $154 floor.
Follow us on X to get the latest news as it happens
The chart reveals weeks of consistent green bars replacing what had been months of sell-dominant red, indicating that real spot buyers have been steadily absorbing supply.
The token is now trading around $330. Its price rose more than 20% over the past week alone, and its market capitalization has climbed back to approximately $3.17 billion.
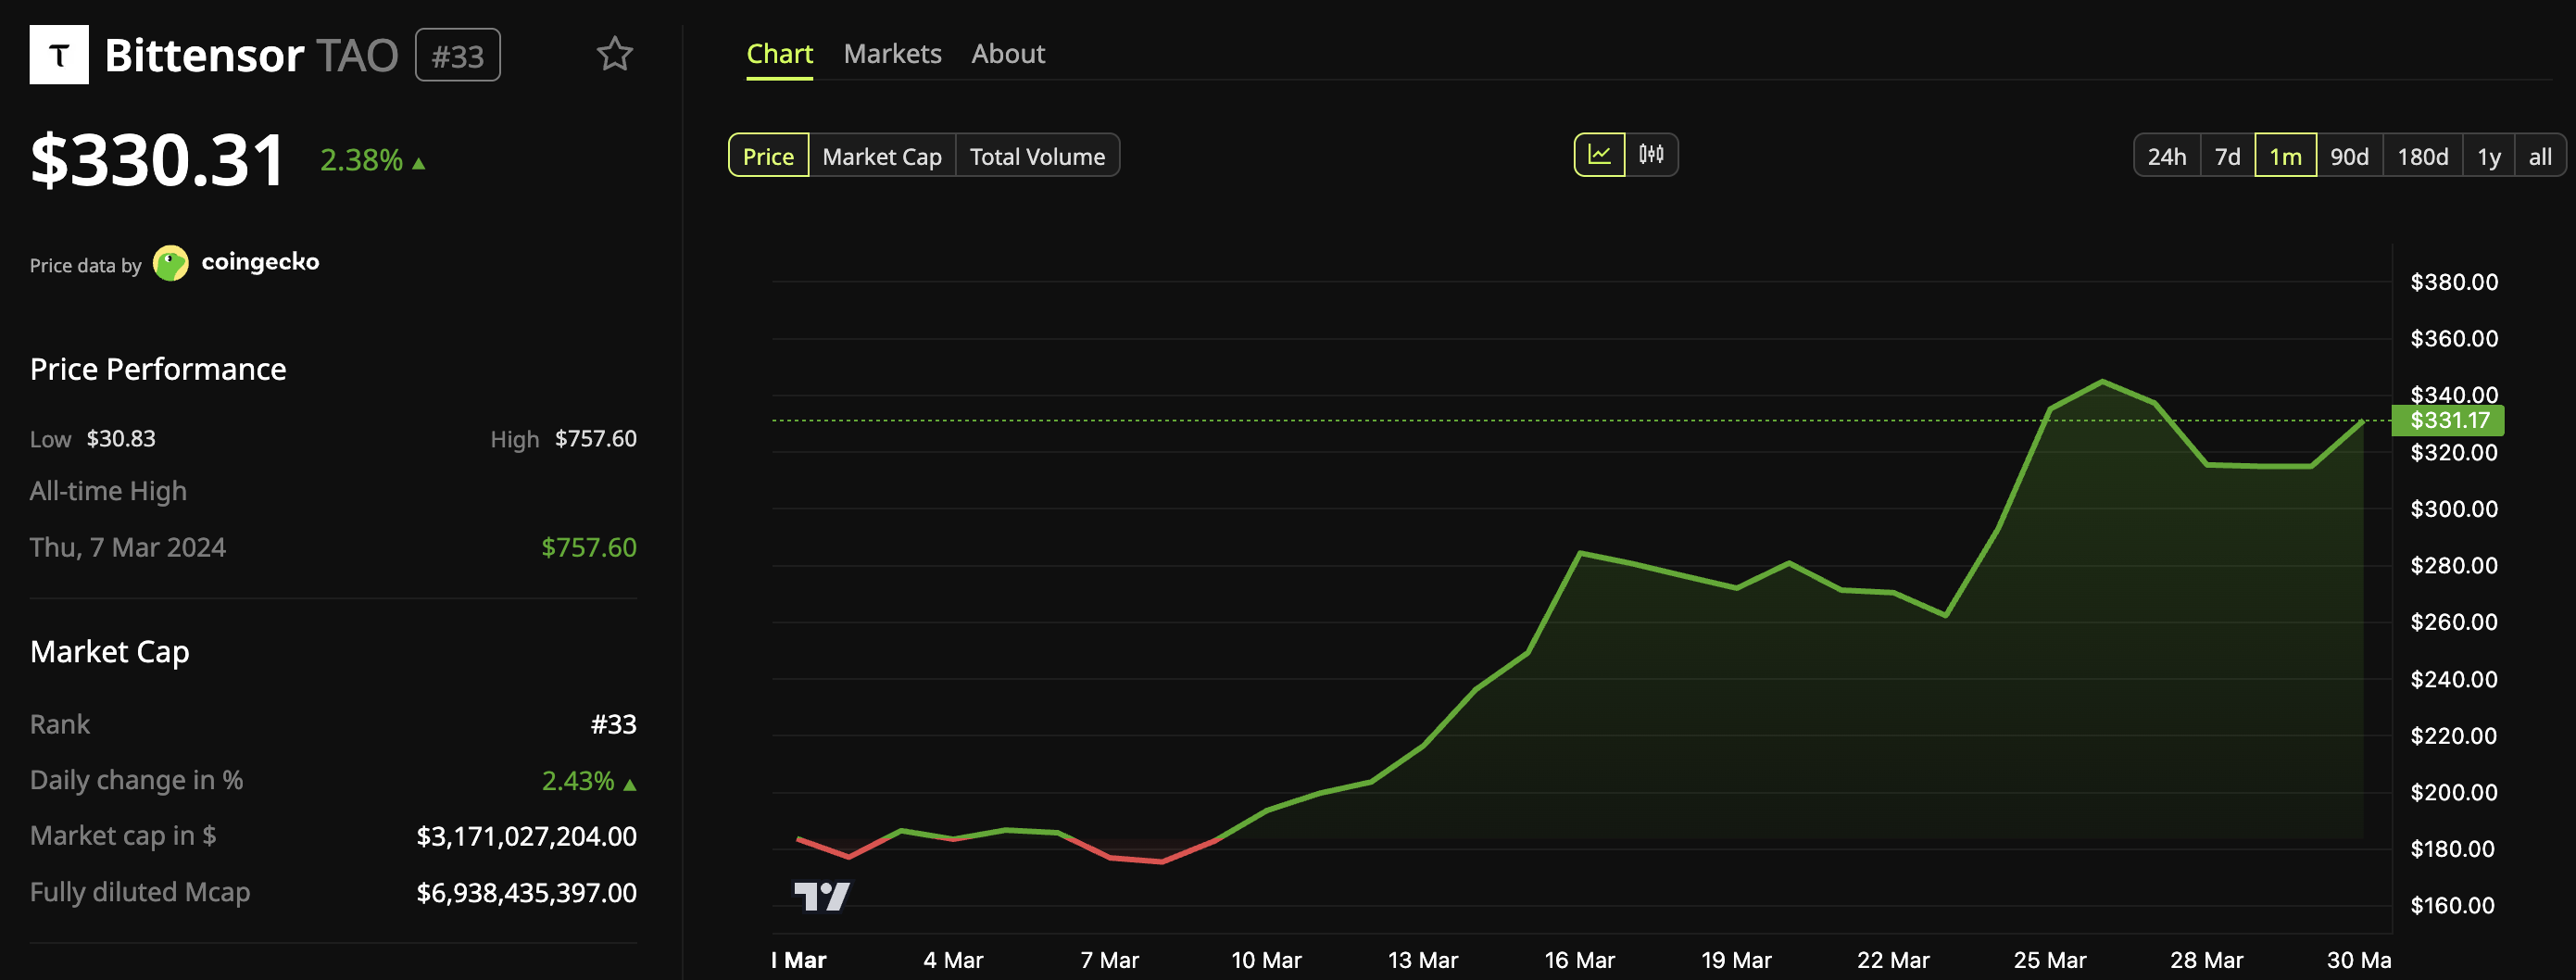
The broader Bittensor ecosystem has also benefited. According to CoinGecko data, the total market capitalization of subnet tokens has collectively surged to $1.4 billion. Nearly every token in the network has posted double-digit gains over the past 30 days.
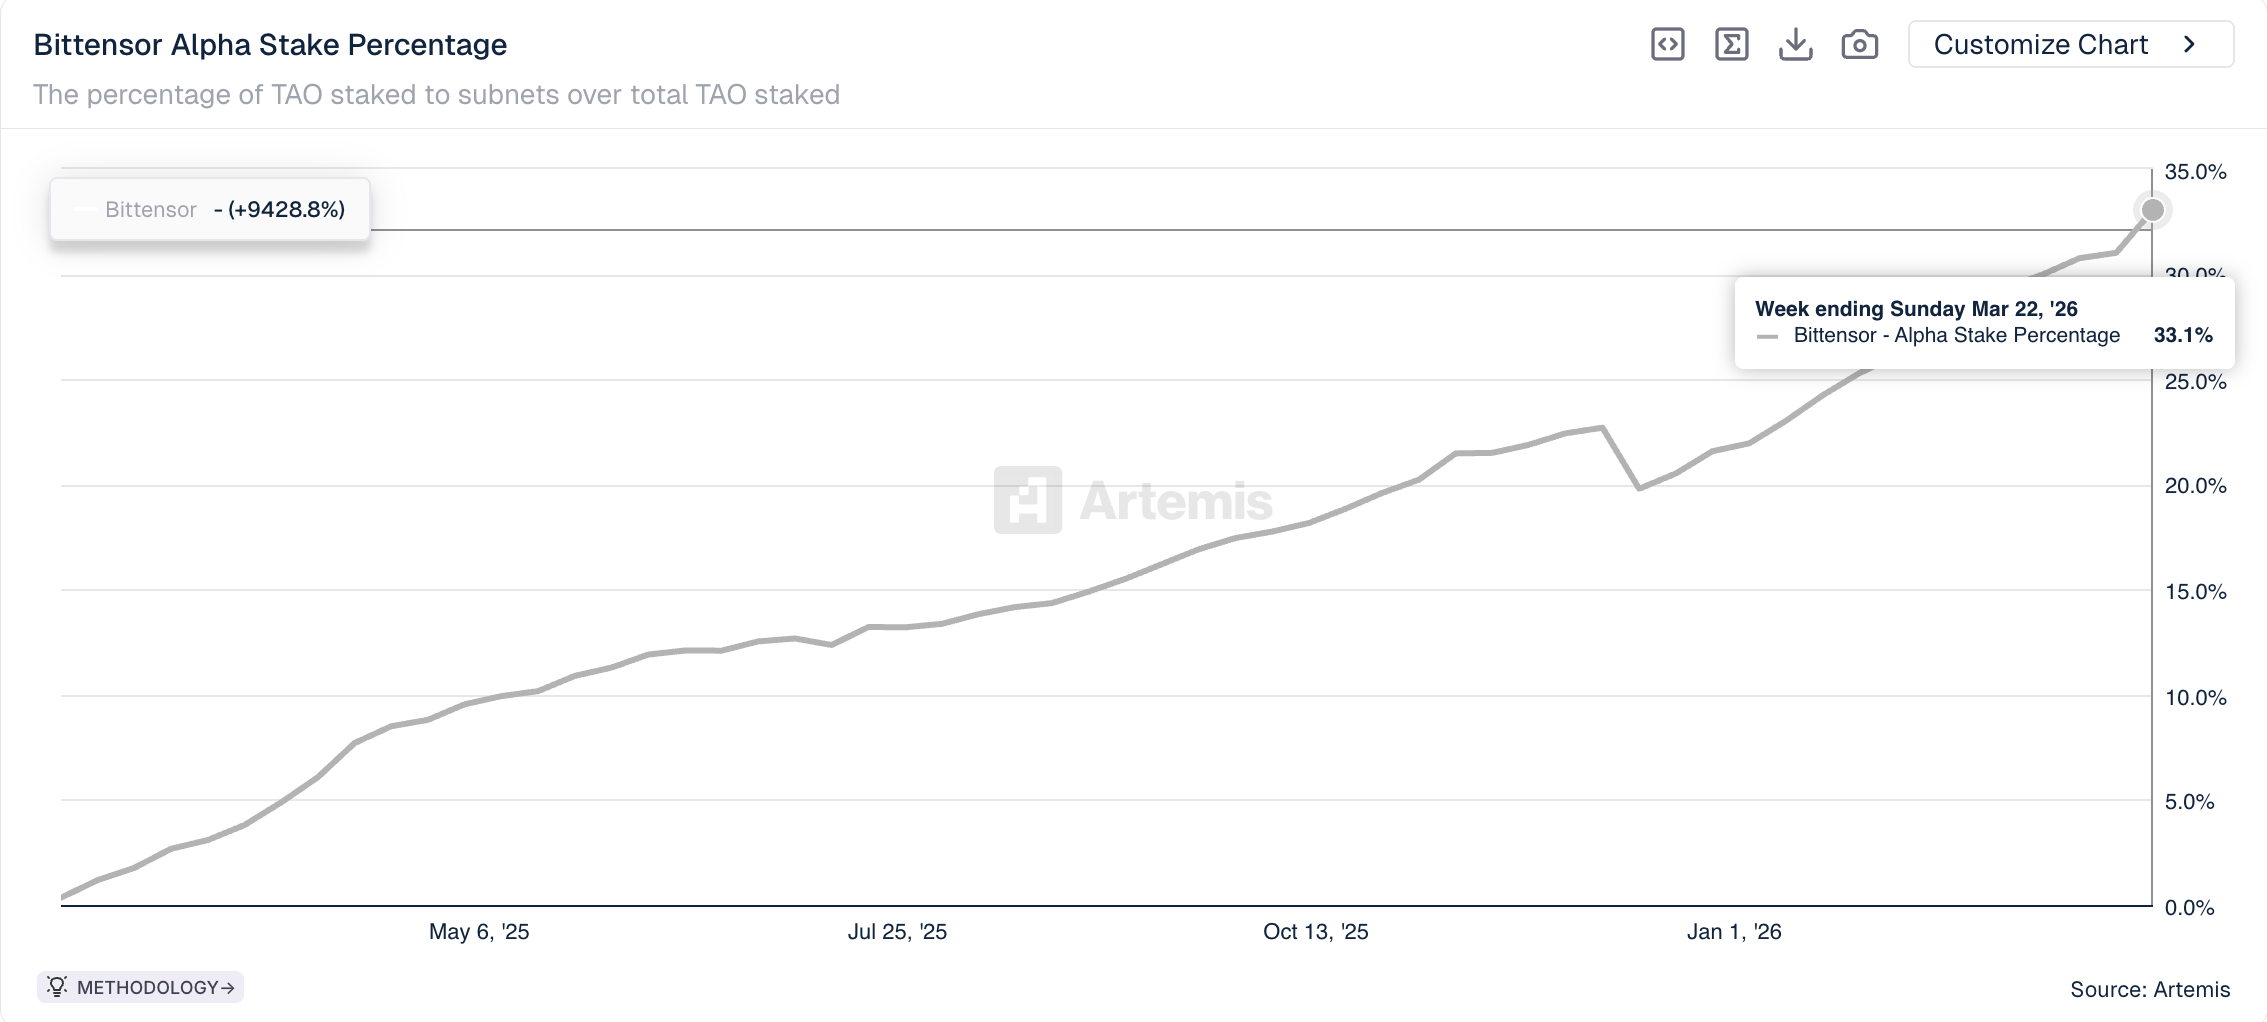
Meanwhile, the percentage of TAO staked to subnets relative to total TAO staked has exceeded 33%, reflecting growing confidence in the subnet economy.
Despite the bullish backdrop, CryptoQuant analyst Maartunn noted that all segments of Bittensor trading activity, including spot volumes, futures volume, and retail participation, are heating up simultaneously.
“When everything heats up at once… risk increases,” he wrote.
The observation does not necessarily predict an imminent reversal. Nonetheless, it suggests the current rally may be in a zone where downside risk increases.
The post Bittensor (TAO) Demand Looks Real and Risky at the Same Time: Here’s Why appeared first on BeInCrypto.
Prediction market transactions surpassed 192 million in March 2026. This represents an all-time record as volume and user growth continued to accelerate year over year.
The figures, tracked by Dune, reflect a sector that has shifted from a niche use case into a multibillion-dollar financial market.
Follow us on X to get the latest news as it happens
The number of monthly users grew to a record high of 865,411, a roughly 118% increase from 396,642 in March 2025.
Monthly notional trading volume for prediction markets reached roughly $23.89 billion so far in March, a roughly 1,107% year-over-year increase. Nonetheless, it remains around 10.7% below January’s all-time high of $26.7 billion.
BeInCrypto’s exclusive analysis found that sports, crypto, and politics lead weekly volume on Polymarket. On Kalshi, the exotics category overtook politics in late February to secure a position among the top three categories by weekly volume according to Dune data.
The behavioral data also suggests a structural shift. On Polymarket, over 57% of users trade less than $100 per position.
The average active participant executes roughly 25 trades per day. That frequency mirrors patterns seen in retail stock trading rather than traditional betting.
Subscribe to our YouTube channel to watch leaders and journalists provide expert insights
Despite the growth, prediction markets face increasing regulatory scrutiny. Lawmakers have introduced multiple bills in March alone, ranging from curbing insider trading to banning war-related contracts.
The post Prediction Markets Hit New Milestones in March Despite Growing Regulatory Scrutiny appeared first on BeInCrypto.
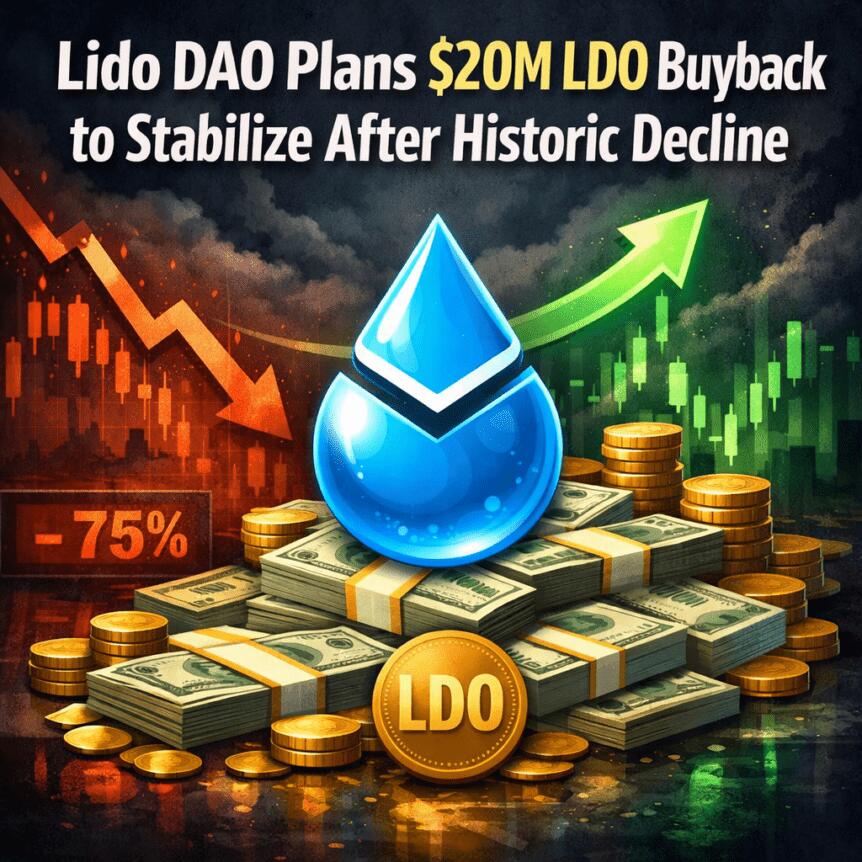
Lido DAO’s decentralized autonomous organization is weighing a one-off $20 million buyback of its governance token, LDO, in a bid to address a pronounced price dislocation relative to Ether. The plan would swap 10,000 stETH tokens from the treasury for LDO, with proponents arguing that the governance token is undervalued given the protocol’s fundamentals.
The proposal, submitted on Friday, outlines a staged approach: the treasury would acquire up to 10,000 stETH in smaller batches of 1,000 and swap each batch for LDO. Lido argues this move could restore alignment between LDO’s market price and the underlying health of the protocol, a gap it says has widened to historically large levels. As part of the process, each batch would require tokenholder approval, and results would be reported before the next tranche proceeds.
“This is not a routine fluctuation. It represents one of the most significant dislocations between LDO’s market price and its underlying protocol fundamentals in the token’s history.”
The time to act comes as LDO sits at an extended discount to Ether. Lido DAO notes LDO trades at about 0.00016 ETH, roughly 63% below its two-year median. At the same time, Lido remains the dominant force in Ethereum’s liquid staking market, holding about 23.2% of staked Ether, according to Dune Analytics data. That leadership has not come without controversy; previous assessments flagged the potential centralization risks tied to a single protocol’s dominance in securing a large share of the network’s staking.
Price and market metrics underscore the scale of the challenge. LDO is currently trading around $0.30, down about 95.9% from its peak near $7.30 in August 2021. Its market capitalization sits near $255 million, placing it around the 141st-largest token by value. The plan’s proponents argue that the proposed buyback could shore up sentiment by demonstrating active governance-driven capital allocation tied to the protocol’s real-world performance.
Key takeaways
- The Lido DAO proposal would execute a one-off $20 million buyback by swapping up to 10,000 stETH from the treasury for LDO, in batches of 1,000 stETH each, using limit orders or dollar-cost averaging to manage volatility.
- Approval for each batch would be required from tokenholders, and results would be disclosed after every tranche before proceeding.
- LDO trades at a steep discount to ETH (approximately 0.00016 ETH per LDO, about 63% below the two-year median), despite Lido’s leadership in Ethereum’s liquid staking sector.
- Lido’s dominance has been cited in the past as a potential centralization risk for the network, though the current governance move focuses on price alignment and treasury management.
- Revenue and fee dynamics in 2025 show Lido’s take rate rising to 6.1% even as staking fees declined, with total staking revenue dipping amid a broader market retrenchment.
Mechanics, governance, and investor considerations
The proposed buyback plan hinges on a staged governance process. If approved, Lido would execute batches of 1,000 stETH each, swapping them for LDO until the 10,000-stETH target is reached. The strategy emphasizes price discipline: Lido intends to use limit orders or a dollar-cost averaging approach to smooth entry and avoid abrupt price moves. Each batch would require a new round of tokenholder approvals, and the DAO would report results after every step to maintain transparency and accountability.
The broader context includes a look at Lido’s earnings trajectory. In 2025, Lido’s revenue declined by about 23% to roughly $40.5 million, driven largely by a drop in staking fees to about $37.4 million. Despite the revenue dip, the protocol’s take rate—defined as the percentage of staked ETH rewards retained as fees—improved from about 5% to just over 6% in 2025. Lido argues that the core fundamentals remain robust even amid a wider market pullback and a 13% cost improvement in 2025 versus 2024.
The idea of a buyback is not entirely new within Lido’s ecosystem. In November, a member proposed an automated buyback mechanism to support LDO’s price, but that proposal has not been implemented. The current plan reframes the concept as a one-off, governance-driven initiative tied directly to the treasury’s assets and the DAO’s long-term interests.
Implications for holders and the broader ecosystem
If the proposal advances, the immediate effect could be a temporary lift in LDO’s trading dynamics, especially if the market interprets the buyback as a signal that the DAO is willing to put treasury-backed resources toward balancing token price with protocol fundamentals. For investors, the move highlights a visible attempt to align incentives between token economics and the platform’s operational strength, particularly given Lido’s entrenched position in Ethereum staking and its influence on validator economics.
However, the plan also introduces governance risk and execution risk. The need for multiple rounds of tokenholder approvals means outcomes will be contingent on community sentiment and turnout. Moreover, the market’s reaction will hinge on how the buyback intersects with broader SEC-like scrutiny, market liquidity conditions, and the pace at which LDO could absorb new supply without dampening demand for the token’s governance role.
Looking ahead, observers will be watching whether the DAO proceeds with the proposed schedule, how each batch performs relative to market conditions, and whether this approach invites further debates about token economics, centralization concerns, and the resilience of Ethereum’s staking architecture as it evolves post-merge.
Readers should monitor Lido DAO’s governance votes and the market’s reaction to any announced results from each tranche, as these steps will illuminate how the community weighs treasury-backed interventions against the need to maintain decentralization and protocol integrity in a challenging macro environment.


The war just got bigger. Bitcoin briefly got smaller.
Bitcoin dipped to $65,112 early Monday morning, its lowest level since the February crash, before recovering to $67,402 as Asian markets opened.
The 24-hour range of $65,112 to $67,389 reflects a market that sold hard on overnight escalation headlines and found buyers near $65,000, a level that hasn’t been tested since the war’s opening weekend five weeks ago.
Ethereum recovered 2% to $2,044, Solana gained 0.9% to $83.48, and XRP added 1.4% to $1.35. The 24-hour green across the board masks a rougher weekly picture though. BTC is still down 1% on the week, ETH 0.9%, XRP 1.9%, and SOL 3.7%. Tron is the one name sitting in green, up 2.6% in a day and 4.6% on the week, quietly outperforming the entire majors complex.
The escalation this time came from multiple directions simultaneously. Iran-backed Houthi forces entered the conflict, opening a new front beyond the direct U.S.-Israel-Iran theater. Additional U.S. troops arrived in the Middle East, fanning fears of a ground operation.
The Wall Street Journal reported Trump is weighing a military operation to extract uranium from Iran, though no decision has been made. And Iran attacked two aluminum production sites in the region, sending the metal up as much as 6% and extending the war’s economic damage beyond oil and into industrial commodities.
Brent crude rose 2.5% to around $115 a barrel, now up roughly 90% year-to-date. Asian equities fell sharply, with South Korea’s benchmark down 3.2% on a technology stock selloff and Japan’s Nikkei dropping 3.4%. S&P 500 futures pared losses and were trading roughly flat, suggesting some stabilization after the initial reaction.
The $65,112 low matters technically. That level is within range of the $64,000 low from Feb. 28, the day the war started. Bitcoin has spent five weeks building a pattern of higher lows on each escalation, from $64,000 to $66,000 to $68,000 to $69,400 to $70,596.
Monday’s dip below $66,000 is the first time in weeks the floor has moved lower rather than higher. Whether it recovers and re-establishes the uptrend or marks the beginning of a break below the range that has held since the war began is the question for the rest of the day.
Meanwhile, oil at $115 and aluminum spiking on direct attacks on production facilities means the inflationary impact is broadening beyond energy into industrial supply chains. That makes the Fed’s position even harder and the rate cut timeline even more distant.
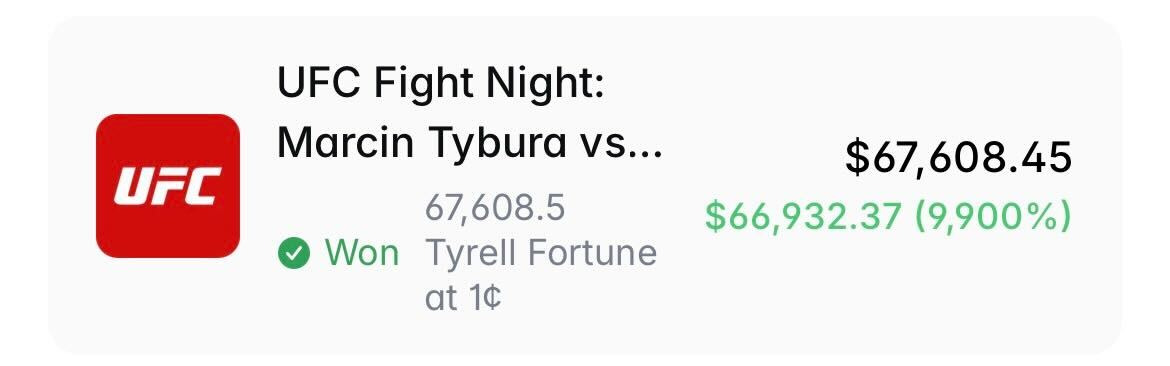
A Polymarket trader turned $676 into $67,608 on Saturday by capitalizing on a rare mistake during a UFC heavyweight bout, where the wrong fighter was initially announced as the winner.
The trader, known as LlamaEnjoyer on Polymarket and Verrissimus on X, watched the live fight between Tyrell Fortune and Marcin Tybura and suspected that a mistake may have been made when UFC presenter Bruce Buffer announced Tybura as the winner.
During that time, Polymarket shares for Fortune fell to one cent, and LlamaEnjoyer was able to place the $676 bet moments before Buffer corrected himself and declared Fortune the winner.
LlamaEnjoyer profited roughly $67,000 from the UFC’s brief blunder, allowing him to capture a near 100x return.

The incident shows the speed at which odds on prediction markets can whipsaw during live events.
Related: NYSE parent ICE completes new $600M investment in Polymarket
LlamaEnjoyer almost lost $100,000 initially
Speaking about the incident, the Polymarket trader said they almost put $100,000 on Tybura at 99 cents, presumably once the initial decision was made before realizing that something “was off.”
“Cancelled my order, scooped up 1c shares instead. the UFC corrected the winner seconds later. easiest 100x ever.”
The trader said they placed the trade before a UFC commentator said “We have a mistake,” meaning that they made the bet within 50 seconds of Tybura being incorrectly declared the winner.
29-28
29-28
30-27WHAT JUST HAPPENED? 😅
Marcin Tybura defeats Tyrell Fortune via unanimous decision! ☝️#UFCSeattle | Stream TNT Sports on HBO Max pic.twitter.com/PqlRwBYdTD
— UFC on TNT Sports (@ufcontnt) March 28, 2026
“There’s no way Tybura won that fight,” LlamaEnjoyer said.
Prediction markets have become one of the hottest use cases in crypto, with trading volumes clocking more than $10.4 billion so far in March, marking a tenfold increase from March 2025.
Over 865,000 users have placed bets on prediction markets like Polymarket, Kalshi and Opinion so far in March, spanning a wide range of events, from sports and politics to financial results, culture and more.
Magazine: IronClaw rivals OpenClaw, Olas launches bots for Polymarket — AI Eye


Lido’s decentralized autonomous organization has proposed a one-off buyback of its governance token to support price levels amid a prolonged downturn.
Summary
- Lido DAO has proposed a one-off buyback of up to 10,000 stETH, about $20M, to accumulate LDO amid what it calls a significant valuation gap.
- The token is trading roughly 63% below its two-year median against Ether and remains down 95.9% from its all-time high.
According to a governance proposal submitted by the Lido Ecosystem Operations team, the plan would allocate up to 10,000 stETH from the DAO’s treasury for Lido DAO to accumulate LDO (LDO). At current prices, the allocation is valued at nearly $20 million.
Framing the move as a response to mispricing, the DAO said it “represents one of the most significant dislocations between LDO’s market price and its underlying protocol fundamentals in the token’s history.”
If approved, the proposal would be executed in smaller batches of 1,000 stETH, up to a total of 10,000 stETH, with plans to use limit orders or adopt a dollar cost averaging strategy to avoid market volatility.
Token holders, however, have the right to review every tranche, as each batch would require separate approval before further execution.
Lido DAO also highlighted the LDO to ETH ratio, which it said was at “historically depressed levels,” trading at a steep discount to Ether, with its current ratio roughly 63% below its two year median.
Even though Lido remains in the top spot of the Ethereum liquid staking market with a market share of about 23%, according to Dune Analytics data, LDO price has fallen 95.9% from its $7.30 high.
In its latest update, the protocol reported a decline of 23% to $40.5 million in 2025, but the foundation argues that core performance remains strong despite the drop in revenue.
For instance, it noted that Lido’s rewards were down approximately 20% over the same period, while its costs improved 13% year over year. Its take rate has also increased from 5% to 6.11%.
“That dislocation is not justified by a proportional deterioration in protocol performance,” the DAO said.
Why Is Crypto Up? Six Straight Red Months Despite Today’s Bounce

Duke’s March collapses under Jon Scheyer are no longer a fluke

How To Use The Two-Foot Rule For A Clutter-Free Garage

Smart energy pays enters the US market, targeting scalable financial infrastructure

Why Israel is blocking foreign journalists from entering

Bitcoin: We’re Entering The Most Dangerous Phase

How Much Money Does He Make Flipping This Mercedes? #shorts #reselling #flipping #money

“This time it’s yo’ money”: Trump’s signature to be added to U.S. paper currency

How and WHAT to invest in! #investing #stockmarket #money #finance #recession #inflation #wallstreet
-
 NewsBeat5 days ago
Manchester United reach agreement with Casemiro over contract clause amid transfer speculation
-

 News Videos4 days ago
Parliament publishes latest register of MPs’ financial interests
-

 Sports7 days ago
Gary Kirsten Accuses Pakistan Cricket Board Of ‘Interference’, Mohsin Naqvi Responds
-

 Sports7 days ago
Remo Stars and Kano Pillars Strengthen Survival Hopes in NPFL
-

 NewsBeat2 days ago
The Story hosts event on Durham’s historic registers
-

 Business3 days ago
Instagram, YouTube Found Responsible for Teen’s Mental Health Struggle in Historic Ruling
-

 News Videos7 days ago
Ch 9 Financial Management Part 1 | Detailed One Shot | Class 12 Business Studies Boards 2026
-
 NewsBeat5 days ago
Tesco is selling new Cadbury Dairy Milk bar and people can’t wait to try it
-
 Entertainment7 days ago
Cynthia Bailey Dishes on ‘RHOA’ Season 17, Discusses Kandi
-

 Tech6 days ago
Samsung will soon let you control smart home devices from your car’s dashboard
-
 Entertainment1 day ago
Lana Del Rey Celebrates Her Husband’s 51st Birthday In New Post
-
 NewsBeat7 days ago
Colombian military plane with 110 soldiers onboard crashes following takeoff
-

 Business6 days ago
More women enter wealth management, but few in advisory roles: study
-

 Fashion6 days ago
Does It Matter What You Wear When You’re Laid Off and Looking?
-

 Fashion7 days ago
Fringe Bags for the Season
-

 Business6 days ago
Late-paying firms face multimillion-pound fines under new crackdown
-

 NewsBeat5 days ago
Entrepreneurs Forum survey reveals optimism in North East
-

 Sports5 days ago
Fantasy Baseball Week 1 Preview: Top sleeper hitters for both five- and 12-day period led by Munetaka Murakami
-

 Politics6 days ago
How Media Platforms Balance Performance and Accessibility in Image Delivery
-
 NewsBeat6 days ago
NASA Artemis II Astronauts enter 14-Day quarantine as moon rocket reaches launchpad
You must be logged in to post a comment Login