
Crypto World
What Is the Right White Label Tokenization Platform for You?
Tokenization at enterprise scale is fundamentally an architectural decision. While market conversations often emphasize speed of deployment, the true determinant of long-term viability lies in the structural integrity of the underlying white label tokenization platform.
Smart contract modularity, compliance logic programmability, interoperability layers, custody integrations, and upgrade mechanisms collectively define whether the system can withstand regulatory evolution and transaction scale. Selecting white label tokenization software without evaluating its contract architecture and governance design introduces systemic limitations that compound over time.
The decision framework must therefore begin at the infrastructure layer — not the user interface.
What Is a White-Label Tokenization Engine?
A white-label tokenization engine is a pre-built, customizable blockchain-based infrastructure that enables organizations to issue and manage tokenized assets under their own brand. A white-label tokenization engine is faster to market than a custom-built solution, but still allows for customization and configuration of compliance.
Core capabilities include:
- Token issuance and lifecycle management
- Compliance rule enforcement
- Investor onboarding and KYC integration
- Governance and voting modules
- Smart contract management
- Asset reporting dashboards
When supported by robust white label tokenization development services, such platforms allow enterprises to retain strategic control while minimizing infrastructure risk.
Why the Choice of Tokenization Engine Impacts Long-Term Scalability
Enterprises looking to establish themselves in regulated digital asset markets will find that scalability is about much more than just transaction throughput; it also includes aspects such as regulatory elasticity, architectural modularity, liquidity enablement, operational automation, and ecosystem interoperability.
In this case, the white label tokenization platform will become your programmable underpinning that helps determine if growth will be seamless or stifled by the architecture of your tokenization platform infrastructure
Choosing robust enterprise white label tokenization solution will allow you to scale without having to continually re-build your infrastructure to support the new level of growth. Instead, scalability will be part of the smart contract architecture, governance logic and integration stack from the very beginning.
1. Regulatory Elasticity and Compliance Automation
Regulatory environments are dynamic. Jurisdictional policies evolve, disclosure requirements expand, and investor eligibility criteria shift over time. A technically mature white label tokenization software solution must therefore incorporate a configurable compliance rule engine rather than static rule sets.
Scalable compliance architecture should support:
- Jurisdiction-based transfer restrictions
- Role-based investor permissions
- Whitelisting and blacklisting logic embedded at contract level
- Automated dividend and reporting triggers
- On-chain audit trail generation
When compliance is deeply integrated into smart contract logic, enterprises can scale across borders without redeploying infrastructure. Organizations leveraging robust white label tokenization development services benefit from programmable regulatory adaptability instead of reactive redevelopment cycles.
2. Modular Smart Contract Architecture and Upgradeability
Long-term scalability depends on modularity. Monolithic contract deployments restrict flexibility and introduce systemic risk during updates. A future-ready white label tokenization platform must employ structured contract patterns such as proxy upgrade mechanisms, modular deployment layers, and governance-controlled upgrade pathways.
Scalable architecture includes:
- Separation of logic and storage contracts
- Version-controlled contract upgrades
- Governance-based modification approvals
- Emergency pause and recovery mechanisms
- Deterministic permission hierarchies
A capable white label tokenization platform development company ensures that upgradeability does not compromise security, enabling protocol evolution without disrupting active tokenized assets.
3. Multi-Asset and Multi-Chain Interoperability
Enterprises rarely tokenize a single asset class. Over time, expansion into real estate, debt instruments, equity, structured funds, or commodities becomes a strategic objective. The selected enterprise white label tokenization solutions framework must therefore support multi-asset issuance under a unified infrastructure.
Scalability requires:
- Compatibility with multiple token standards
- Configurable token economics models
- Cross-chain deployment capability
- API-driven interoperability with exchanges and custodians
- Bridge mechanisms for liquidity routing
An interoperable white label tokenization software stack prevents vendor lock-in and supports ecosystem expansion without structural redesign.
4. Liquidity and Secondary Market Enablement
Token scalability is incomplete without liquidity scalability. The ability to integrate secondary trading platforms, digital custodians, and automated settlement layers determines whether tokenized assets achieve sustainable market participation.
A scalable white label tokenization platform should enable:
- Transfer restriction logic aligned with exchange standards
- Custodial wallet compatibility
- Atomic settlement automation
- Fractional ownership models
- Yield distribution and dividend automation
Well-architected white label tokenization development services embed liquidity readiness within the core system rather than retrofitting it later.
5. Performance Engineering and Infrastructure Scaling
As investor participation increases, transaction volume grows. Scalability must extend to system performance, including gas optimization, throughput management, and infrastructure redundancy.
Enterprise-grade enterprise white label tokenization solutions incorporate:
- Layer-2 compatibility or sidechain deployment options
- Gas-efficient contract design
- Cloud-native infrastructure orchestration
- Horizontal scaling capability
- Disaster recovery and failover mechanisms
Without these controls, operational strain increases as adoption grows.
6. Data Orchestration and Reporting Scalability
Institutional markets demand transparency. As asset portfolios expand, reporting complexity intensifies. A scalable white label tokenization software framework must integrate:
- Real-time dashboard analytics
- Automated investor statements
- Regulatory reporting exports
- On-chain/off-chain data synchronization
- Event-driven accounting automation
Data orchestration scalability ensures compliance continuity and investor confidence during growth phases.
7. Governance and Operational Automation
As ecosystems grow, manual oversight becomes inefficient. A technically advanced white label tokenization platform should support automated governance mechanisms, including:
- On-chain voting modules
- Role-based administrative controls
- Multi-signature authorization flows
- Smart contract-based distribution automation
When governance logic is programmable, operational expansion does not proportionally increase administrative complexity.
Transform Your Asset Digitization Vision into Production-Ready Infrastructure
Step-by-Step Decision Framework for Enterprises
To select a white label tokenization platform, organizations need to evaluate the overall architecture, not just conduct a vendor comparison. Because both regulatory and other operational factors affect the issuance of tokenized assets, organizations must evaluate the depth of their infrastructure, as well as its compliance programmability, integration capabilities and upgrade options in order to implement properly.
Organizations must evaluate the criteria listed below when evaluating enterprise white label tokenization solutions for scalable enterprise implementations.
Step 1: Define Asset Class and Jurisdictional Scope
Before evaluating vendors, enterprises must clarify:
- Type of asset (real estate, funds, bonds, commodities)
- Target investor profile
- Operating jurisdictions
- Licensing requirements
Different assets require different compliance logic and token standards. A scalable white label tokenization platform must accommodate multi-asset issuance under varying regulatory environments.
Step 2: Evaluate Compliance and Governance Architecture
Compliance must be programmable. Enterprises should assess whether the platform supports:
- KYC/AML integration
- Investor accreditation verification
- Transfer restrictions
- Dividend and distribution automation
- Voting and governance modules
The strongest white label tokenization development services integrate compliance into smart contract logic rather than treating it as a manual overlay.
Step 3: Assess Smart Contract Architecture and Security
Security is non-negotiable. Key evaluation criteria include:
- Third-party audited smart contracts
- Modular architecture
- Multi-signature controls
- Role-based administrative permissions
- Incident response mechanisms
A credible white-label tokenization platform development company should demonstrate a strong audit history and transparent security documentation.
Step 4: Examine Integration and API Infrastructure
Tokenization does not operate in isolation. Enterprises must verify:
- API accessibility
- Banking and payment gateway integration
- Custodian connectivity
- ERP and CRM compatibility
- Reporting and analytics dashboards
A well-structured white label tokenization software solution integrates seamlessly into existing financial infrastructure.
Step 5: Review Customization Flexibility
White-label does not mean rigid. Evaluate:
- Branding capabilities
- UI/UX customization
- Token economics configuration
- Investor portal personalization
- Workflow modification flexibility
Customization ensures differentiation in competitive markets.
Step 6: Analyze Scalability and Performance
Infrastructure must support growth. Key technical considerations:
- Transaction throughput
- Gas optimization mechanisms
Cloud deployment flexibility - Load balancing architecture
- Disaster recovery systems
An enterprise-grade engine must support large investor volumes without performance degradation.
Must-Have Features in an Enterprise White-Label Tokenization Platform
A production-ready white label tokenization platform must go beyond basic issuance functionality and deliver infrastructure-grade capabilities aligned with regulatory compliance, security resilience, and institutional scalability. Enterprise adoption depends on how deeply the white label tokenization software embeds automation, governance logic, and interoperability within its core architecture.
- Multi-Asset Issuance Support – Enables structured token creation across diverse asset classes within a unified infrastructure.
- Configurable Compliance Engine – Embeds programmable transfer restrictions, investor eligibility rules, and jurisdictional controls directly into smart contracts.
Role-Based Governance Management – Implements hierarchical access controls and on-chain voting mechanisms for structured decision-making. - Automated Dividend and Yield Distribution – Streamlines financial payouts through smart contract-triggered settlement logic.
- Custodial Wallet Integration – Ensures compatibility with institutional-grade custody providers for secure asset management.
- Secondary Market Readiness – Supports compliant token transfers and exchange integrations to facilitate liquidity.
- Real-Time Reporting Dashboards – Provides synchronized on-chain and off-chain data visibility for regulatory and investor reporting.
- Smart Contract Upgradeability – Allows controlled protocol evolution without disrupting active tokenized assets.
Cost of a White-Label Tokenization Platform: What Enterprises Should Expect
The cost of implementing a white label tokenization platform varies significantly depending on architecture depth, compliance complexity, and customization scope. Enterprises must evaluate cost across multiple dimensions rather than focusing solely on licensing fees.
1. Platform Licensing or Base Infrastructure Cost
This includes core smart contract frameworks, admin panels, and issuance modules.
2. Customization & Integration Cost
- UI/UX personalization
- Custody integration
- API development
- Compliance configuration
Advanced white label tokenization development services increase upfront cost but reduce long-term re-engineering expenses.
3. Security & Audit Expenses
Smart contract audits, penetration testing, and compliance validation are non-negotiable for enterprise-grade deployments.
4. Infrastructure & Cloud Hosting
Costs depend on blockchain selection, transaction volume, and deployment model (public, private, or hybrid).
5. Ongoing Maintenance & Upgrade Costs
Includes contract updates, regulatory modifications, technical support, and feature enhancements.
Building Future-Ready Tokenization Infrastructure
Selecting the right white label tokenization platform is a long-term infrastructure decision that directly influences regulatory agility, liquidity scalability, governance automation, and ecosystem expansion. Enterprises that approach this evaluation with architectural rigor — assessing smart contract modularity, compliance depth, interoperability, and upgrade pathways — position themselves to build resilient and future-ready digital asset frameworks.
As a leading white label tokenization platform development company, Antier delivers enterprise-grade tokenization infrastructure engineered for security, configurability, and regulatory alignment. With deep expertise in blockchain architecture, compliance-driven smart contracts, and scalable deployment models, Antier empowers financial institutions, asset managers, and fintech innovators to launch and scale institutional tokenization ecosystems with confidence.
For organizations seeking a strategically aligned tokenization partner, Antier provides the expertise and infrastructure required to transform asset digitization into sustainable market advantage.
Frequently Asked Questions
01. What is a white-label tokenization engine?
A white-label tokenization engine is a customizable blockchain-based infrastructure that allows organizations to issue and manage tokenized assets under their own brand, offering faster market entry and compliance configuration.
02. Why is the choice of tokenization engine important for long-term scalability?
The choice of tokenization engine impacts long-term scalability by ensuring that the architecture supports not just transaction throughput but also regulatory elasticity, operational automation, and ecosystem interoperability.
03. What core capabilities does a white-label tokenization engine provide?
Core capabilities include token issuance and lifecycle management, compliance rule enforcement, investor onboarding and KYC integration, governance modules, smart contract management, and asset reporting dashboards.

Crypto World
Anthropic Hits $30 Billion Run Rate as Enterprise Demand and Compute Deals Reshape AI Race

TLDR:
- Anthropic’s annualized revenue jumped from $9B at end-2025 to over $30B by early April 2026, a near-vertical climb.
- Enterprise clients spending $1M+ annually doubled from 500 to 1,000 in under two months following the Series G raise.
- Anthropic secured multiple gigawatts of next-gen TPU capacity through a three-way deal with Google and Broadcom for 2027.
- Claude is now the only frontier AI model available across AWS Bedrock, Google Cloud Vertex AI, and Microsoft Azure Foundry.
Anthropic’s annualized revenue has crossed $30 billion in early April 2026, marking a dramatic acceleration from just $9 billion at the end of 2025.
The AI company has also secured a landmark compute agreement with Google and Broadcom for multiple gigawatts of next-generation TPU capacity.
Enterprise adoption of Claude has doubled in under two months. The company is now positioned as a critical infrastructure provider for some of the world’s largest corporations.
Enterprise Growth Drives Revenue Surge
Anthropic’s revenue growth has followed a nearly vertical trajectory over the past year. The company reported roughly $1 billion in annualized revenue in late 2024. That figure climbed to $9 billion by year-end 2025, then jumped to $14 billion just two months ago.
Today, the run rate stands above $30 billion before the second quarter has even begun. Earlier internal forecasts projected $18 billion for all of 2026, a target the company has already surpassed as a run rate.
When Anthropic closed its Series G round in February at a $380 billion valuation, it reported 500 business customers each spending over $1 million annually. That number has since doubled to more than 1,000 enterprise customers at the same spending threshold.
Eight of the Fortune 10 companies are currently running critical workloads on Claude. That level of penetration among the world’s most powerful corporations reflects growing institutional trust in the platform.
Compute Strategy Expands Across Platforms
Anthropic announced a new agreement with Google and Broadcom for multiple gigawatts of next-generation TPU capacity expected online starting in 2027. The company published a statement noting the deal represents its most substantial compute commitment to date.
Anthropic trains and runs Claude across AWS Trainium chips via Project Rainier, Google TPUs manufactured by Broadcom, and NVIDIA GPUs across multiple data centers.
Claude is currently the only frontier AI model available on all three of the largest cloud platforms — Amazon Web Services Bedrock, Google Cloud Vertex AI, and Microsoft Azure Foundry.
This multi-chip approach allows Anthropic to match workloads to the most suitable hardware, reducing bottlenecks and improving resilience. The strategy also protects against supply chain disruptions that have affected other AI providers.
Back in December, Broadcom’s CEO revealed that a mystery customer had placed a $10 billion custom chip order, later disclosed to be Anthropic.
That was followed almost immediately by another $11 billion order in the same quarter. Broadcom CEO Hock Tan has since projected close to $100 billion in AI chip revenue for 2027, with Anthropic cited as a primary driver.
Anthropic’s internal forecast for 2027 had called for $55 billion in annual revenue. Given the current growth rate, that projection no longer appears far-fetched.


Key takeaways
- Bitcoin is holding near $69K as Iran-related geopolitical tensions keep markets cautious.
- Rising oil prices and inflation concerns are limiting upside, but strong ETF inflows and institutional support are helping BTC stay resilient.
Bitcoin is trading sideways near the $69,000 mark as investors remain cautious amid escalating geopolitical tensions tied to the conflict in Iran.
The leading cryptocurrency briefly pushed above $70,000 on Monday—its first move past that level since March—but failed to sustain momentum.
Geopolitics dominate market sentiment
The ongoing situation in Iran continues to shape global risk appetite. U.S. President Donald Trump has warned of severe consequences if a deal to reopen the Strait of Hormuz is not reached by the Tuesday 20:00 ET deadline.
Iran has rejected a proposed 45-day ceasefire, instead calling for a permanent end to hostilities alongside the removal of sanctions.
For Bitcoin, this macro backdrop is significant—higher oil prices tend to support inflation, push Treasury yields higher, and reinforce expectations that the Federal Reserve will keep interest rates elevated for longer.
Despite the current situation, Bitcoin has held up better than some traditional markets. While it has not staged a breakout, its ability to maintain levels above $65,000 suggests underlying support from positioning and institutional demand.
Meanwhile, Gold has lost more than 10% of its value as investors scale back expectations for Federal Reserve rate cuts this year.
Flows into spot Bitcoin ETFs have been a key factor. After four consecutive months of outflows, March saw $1.2 billion in net inflows. Momentum has continued into April, with spot ETFs recording $471.3 million in inflows in a single day—the largest since February.
These inflows have helped keep Bitcoin’s price, although resistance near $76,000 continues to cap upside.
For Bitcoin to break higher, a clear catalyst is likely required. A confirmed ceasefire between the U.S. and Iran could be pivotal, particularly if it drives oil prices below $100 per barrel and alleviates inflation concerns.
Technical forecast: Bitcoin eyes the $70k resistance once again
The BTC/USD 4-hour chart remains bearish and efficient as Bitcoin continues to defend the $65,000 support level.
The price has recovered from this low and is testing resistance around 69k, the 50-day EMA, and the lower band of the rising channel.
The RSI of 61 on the 4-hour chart is above the neutral level, indicating a growing bullish bias. The MACD lines are also above the zero line, adding further confluence to the bullish narrative.
Buyers will need to rise above $69,000 to bring $74,000 into focus, the mid-point of the rising channel and the falling trendline resistance dating back to October’s $126,000 record high.

A surge above the $74,000 resistance level would allow BTC to test the March high of $76,000 in the near term.
However, failure to rally higher would see the bears push the price towards the $65,000 support level once again.
Key Highlights
-
XRP attracts record $119M, dominating weekly digital asset investment flows
-
Ethereum suffers continued decline with $52M withdrawal amid policy concerns
-
Bitcoin records $107M inflows while bearish positioning expands significantly
-
Swiss markets dominate global flows as American investor appetite weakens
-
Economic data triggers late-week reversal in cryptocurrency investment momentum
Cryptocurrency investment products attracted $224 million in fresh capital over the past week, representing a short-lived bounce following previous withdrawals. However, macroeconomic headwinds dampened enthusiasm as the week concluded. XRP emerged as the clear winner while Ethereum’s outflow streak extended.
XRP Commands Investment Flows with Record Weekly Performance
[[LINK_START_0]]XRP[[LINK_END_0]] captured the lion’s share of investment activity, pulling in $119.6 million during the week. This represented the digital asset’s most impressive showing since late December 2025. The momentum persisted even as broader cryptocurrency markets displayed vulnerability. Year-to-date, XRP has accumulated $159 million in net inflows.
The impressive performance followed sustained investor interest after the introduction of spot XRP exchange-traded products in American markets. These investment vehicles enhanced accessibility and facilitated continuous capital movement into the asset. Consequently, XRP now represents approximately seven percent of aggregate assets managed across cryptocurrency funds.
European financial centers played a significant role in driving XRP’s success. Switzerland emerged as the top contributor with more than $157 million in capital inflows, while Germany and Canada also participated strongly. This geographic distribution indicated evolving capital deployment strategies across international cryptocurrency markets.
Bitcoin Displays Conflicting Trends as Investor Sentiment Splits
Bitcoin attracted $107.3 million in new investments, demonstrating modest revival following earlier capital withdrawals. However, monthly performance remained in negative territory, with cumulative outflows reaching $145 million. This divergence underscored persistent indecision regarding the asset’s trajectory.
Inverse bitcoin products drew $16 million in capital, revealing heightened pessimistic positioning among certain market participants. Simultaneously, American spot bitcoin exchange-traded funds contributed minimally to overall flows. These contradictory indicators exposed a fundamental divide in investor outlook.
Meanwhile, Solana accumulated $34.9 million in inflows, extending its positive momentum throughout the current year. Its aggregate inflows now constitute roughly ten percent of total managed assets. This reliable performance reinforced broader portfolio diversification trends within digital asset investment products.
Ethereum Suffers Substantial Withdrawals Amid Legislative Uncertainty
Ethereum maintained its negative trajectory, experiencing $52.8 million in weekly capital flight. This followed an even larger $222 million exodus the preceding week. The asset’s year-to-date outflows have now reached $327 million.
Legislative ambiguity surrounding the Digital Asset Market Clarity Act continued exerting downward pressure on Ethereum-focused investment vehicles. The proposed legislation remained gridlocked in the Senate due to disputes regarding stablecoin yield components. This impasse negatively impacted sentiment toward Ethereum’s ecosystem positioning.
Ethereum’s fundamental importance to stablecoin infrastructure heightened its vulnerability to regulatory developments. This strategic exposure amplified pressure on capital movements during periods of policy ambiguity. Ethereum stood out as the poorest performer among leading cryptocurrency assets.
Broader economic conditions also shaped overall investment product activity throughout the period. Robust American retail sales figures reinforced projections of continued restrictive monetary policy. This evolution diminished risk tolerance and prompted modest withdrawals as the week closed.
Simultaneously, rising crude oil valuations and receding interest rate reduction expectations intensified market headwinds. These dynamics interrupted early-week positive momentum across digital asset investment vehicles. Ultimately, the weekly recovery proved incomplete and varied substantially across geographic regions and individual assets.
Ether treasury companies may need to use liquid staking and other active yield strategies if they want to offer investors something beyond the staking rewards already available through listed Ether products, Kean Gilbert, head of institutional relations at Lido, told Cointelegraph at ETHCC 2026.
Liquid staking lets Ether (ETH) holders stake their tokens while receiving a transferable token that can still be deployed elsewhere in decentralized finance (DeFi).
Gilbert said strategies such as posting ETH as collateral and borrowing against it could help treasury companies generate higher returns than passive staking products.
US-listed staked ETH products now include the REX-Osprey ETH + Staking ETF, launched in September 2025, Grayscale’s Ethereum Staking ETF and Ethereum Staking Mini ETF, and BlackRock’s iShares Staked Ethereum Trust ETF, introduced on March 12.
Issuer disclosures show different staking economics across Ether products, making direct yield comparisons difficult. Grayscale’s ETHE page showed 2.26% net staking rewards as of April 6, while Grayscale’s ETH page showed 2.56% as of April 2. Native ETH staking was yielding about 2.72% annually, according to Staking Rewards.
Related: Bitmine paper loss nears $8.8B as Ether slump tests cyclical thesis
Still, Jimmy Xue, co-founder and chief operating officer of quantitative yield platform Axis, said Ether treasury companies do not necessarily need to beat staked Ether products on headline yield because they are different investment vehicles.
“A staked ETH ETF is a passive vehicle. A DAT trading at a meaningful mNAV premium is promising something a passive ETF structurally cannot deliver, which is active, dynamic deployment of spot inventory across opportunities as they arise.”
“The mNAV premium investors pay reflects confidence in management’s ability to put that treasury to work,” Xue said, adding that basis trading is a major yield source for treasury companies.

Public filings show liquid staking adoption
Public disclosures show several Ether treasury firms using staking or liquid-staking-related strategies, though the level of detail varies by company.
Sharplink Gaming, the second-largest corporate Ether holder, has generated 14,516 ETH (around $30.8 million) in staking rewards as of March. It derived 33% of these rewards from liquid staking and 66% from native staking, according to a March 1 filing with the US Securities and Exchange Commission.
Sharplink reported a $734 million net loss for 2025, largely driven by the sharp crypto market downturn in the second half of the year.

BTCS Inc., the 10th-largest Ether treasury company by returns, has also staked a part of its Ether holdings through the liquid staking protocol Rocket Pool. Out of its total 29,122 ETH holdings, the company has liquid staked 4,160 ETH ($8.8 million) through Rocket Pool nodes, according to a July 2025 SEC filing.
Cointelegraph has approached BitMine, SharpLink and The Ether Machine for comment on the role of liquid staking in their strategies.
Magazine: Sharplink exec shocked by level of BTC and ETH ETF hodling — Joseph Chalom

Phone logs obtained by federal prosecutors in Argentina show seven calls between President Javier Milei and entrepreneur Mauricio Novelli – one of the architects of the LIBRA crypto token, on the same night in February 2025 that Milei posted the now-infamous promotion on X, directly contradicting Milei’s public claim of no connection to the coin’s launch.
Recovered notes from Novelli’s phone outline a $5 million deal structure tied to Milei’s official endorsements, including payments contingent on Milei naming Hayden Davis of Kelsier Ventures as a cryptocurrency advisor.
The documents place Milei inside the deal’s mechanics, not outside them.
- The Core Evidence: Argentine federal prosecutors have obtained phone logs showing seven calls between Milei and Novelli before and after his February 14, 2025, X post promoting $LIBRA at 7:01 pm local time.
- The Financial Trail: A deleted note recovered from Novelli’s phone describes a $5 million arrangement with an individual identified as “H” – likely Davis – including $1.5 million upon Milei announcing Davis as a crypto advisor.
- The Scale of Losses: An estimated 114,410 wallets lost funds in the $LIBRA collapse, with total investor losses ranging from $251 million to $400 million; only 36 wallets cleared more than $1 million in profit.
- Milei’s Legal Status: Milei is named as a person of interest in the ongoing federal probe but has not been formally charged; he has not publicly responded to the call logs or recovered documents.
- Obstruction Signal: Milei dissolved Argentina’s Investigation Task Unit (UTI) via Decree 332/2025 in May 2025 – after the UTI had forwarded insider trading findings to prosecutors.
- What to Watch: Argentina’s Chamber of Deputies begins questioning government officials on April 8, 2026; any move toward formal charges or new forensic disclosures from that session will be the next inflection point in this investigation.
Discover: The Best Crypto Presales Live Right Now
What the Phone Logs Actually Show – and Why Milei “No Connection” Defense No Longer Holds
Milei posted about LIBRA crypto at 7:01 pm Argentina time on February 14, 2025. The seven documented calls to Novelli occurred in the hours immediately before and after that post – a timeline that prosecutors are now treating as evidence of coordination, not coincidence.
The contents of the calls remain unknown, but the pattern of contact alone is legally significant: it establishes proximity between Milei and the token’s operators at the precise moment of maximum promotional impact.
The recovered deleted note from Novelli’s phone goes further. Forensic analysis of the document – dated October-November 2024 – describes a three-tranche payment structure: $1.5 million upfront to “H,” $1.5 million upon Milei’s public announcement of Davis as an advisor, and $2 million in blockchain and AI advisory contracts involving both Milei and his sister Karina Elizabeth Milei.

Milei met Davis at Casa Rosada on January 30, 2025, posting a selfie on X that same day and describing him as a cryptocurrency advisor – the precise trigger for the second $1.5 million tranche outlined in Novelli’s note.
Computer experts confirmed that the 44-character $LIBRA contract code Milei included in his February promotional post was not publicly available online prior to the post, meaning Milei had access to insider technical data before the token launched publicly.
WhatsApp audio messages reviewed as part of the investigation also reference recurring payments made to Milei during his time as a congressman, with specific sums reportedly allocated to Karina Milei as well.
Novelli allegedly brokered regulatory favors in exchange, including tax exemptions, suggesting the financial relationship predates the $LIBRA launch by years. Milei’s dissolution of the UTI via Decree 332/2025 in May 2025, after that body had already forwarded insider trading findings to prosecutors, adds an obstruction dimension that investigators are unlikely to set aside.
Explore: The Best Pre-Launch Token Sales With Asymmetric Upside Potential
The post New Evidence Emerges in Argentina President Milei’s Libra Token Probe appeared first on Cryptonews.


A Nobel Prize–winning physicist who helped build Google’s quantum computers warned that Bitcoin may be among the earliest real-world targets of the technology.
In an interview with CoinDesk, John M. Martinis said recent Google research showing how a quantum computer could break bitcoin encryption in minutes should be taken seriously.
“I think it’s a very well-written paper. It lays out where we are right now,” Martinis said, referring to Google’s latest work on quantum threats to cryptography. “It’s not something that has zero probability; people have to deal with this.”
READ: A simple explainer on what quantum computing actually is, and why it is terrifying for bitcoin
The Google paper outlines how a sufficiently advanced quantum computer could derive a bitcoin private key from its public key, potentially within minutes, dramatically reducing the computational barrier that currently secures the network, Martinis highlighted, adding this is one of the issues that must be taken most seriously..
READ: Here’s what ‘cracking’ bitcoin in 9 minutes by quantum computers actually means
While the idea of quantum computers breaking encryption is often framed as distant or theoretical, Martinis said one of the first practical applications may be far more immediate.
Lowest hanging fruit for quantum computers
“It turns out that breaking cryptography is one of the easier applications for quantum computing, because it’s very numeric,” he said. “These are the smaller, easier algorithms. The low-hanging fruit.”
That places bitcoin, which relies on elliptic curve cryptography, directly in the line of fire, Martinis suggested, confirming what the Google paper warns.
Unlike traditional financial systems, which can migrate to quantum-resistant encryption standards, bitcoin faces a more complex challenge. Its decentralized structure and historical design make upgrades slower and more contentious, the Nobel Prize winner said.
“You can go to quantum-resistant codes” in banking and other systems, Martinis said. “Bitcoin is a little bit different, which is why people should be thinking about this right now.”
The concern centers on a specific vulnerability window. When a bitcoin transaction is broadcast, its public key becomes visible before it is confirmed onchain, Martinis explained. A powerful quantum computer could, in theory, use that window to derive the corresponding private key and redirect funds before final settlement, he noted.
However, Martinis cautioned against assuming the threat is imminent. Building a quantum computer capable of executing such an attack remains one of the hardest engineering challenges in modern science.
“I think it’s going to be harder to build a quantum computer than people are thinking,” he said, pointing to major hurdles in scaling, reliability and error correction.
No reason for inaction
Estimates for when cryptographically relevant quantum machines could emerge vary widely. Martinis suggested a rough five- to ten-year window, but warned that uncertainty is not a reason for inaction.
“Given the serious consequences, you deal with it. You have time, but you have to work on it,” he said.
The warning highlights a growing shift inside the quantum research community, where scientists are increasingly flagging risks to existing cryptographic systems while withholding sensitive technical details — a strategy borrowed from traditional cybersecurity disclosure practices.
For bitcoin developers and investors alike, the message is becoming harder to ignore.
“The crypto community has to plan for this,” Martinis said. “It’s a serious issue that has to be dealt with.”
Martinis is a 2025 Nobel Prize–winning physicist recognized for his work on macroscopic quantum phenomena and is widely known for leading Google’s quantum hardware program, including the 2019 “quantum supremacy” experiment. He is currently CTO and co-founder of Qolab, a hardware company developing utility-scale superconducting quantum computers.


After topping $70,000 on Monday, bitcoin has pulled back to the $68,000 area as time draws near for President Trump’s Tuesday deadline for Iran to reopen the Strait of Hormuz.
“A whole civilization will die tonight, never to be brought back again,” said Trump in a Tuesday morning Truth Social Post. “I don’t want that to happen, but it probably will,” he continued. “We will find out tonight, one of the most important moments in the long and complex history of the world.”
Alongside declines in crypto, U.S. stock index futures are poised to open lower, led by the Nasdaq 100’s 0.65% decline. WTI crude oil is higher by 1.7% to $114.22 per barrel.
Tempering declines across markets were comments from vice president J.D. Vance, who — while reiterating the 8 pm ET deadline — said the military objectives of the Iran war have been completed.
Disclosure: This article does not represent investment advice. The content and materials featured on this page are for educational purposes only.
Crypto presales gain traction as investors position early for the next market cycle.
Summary
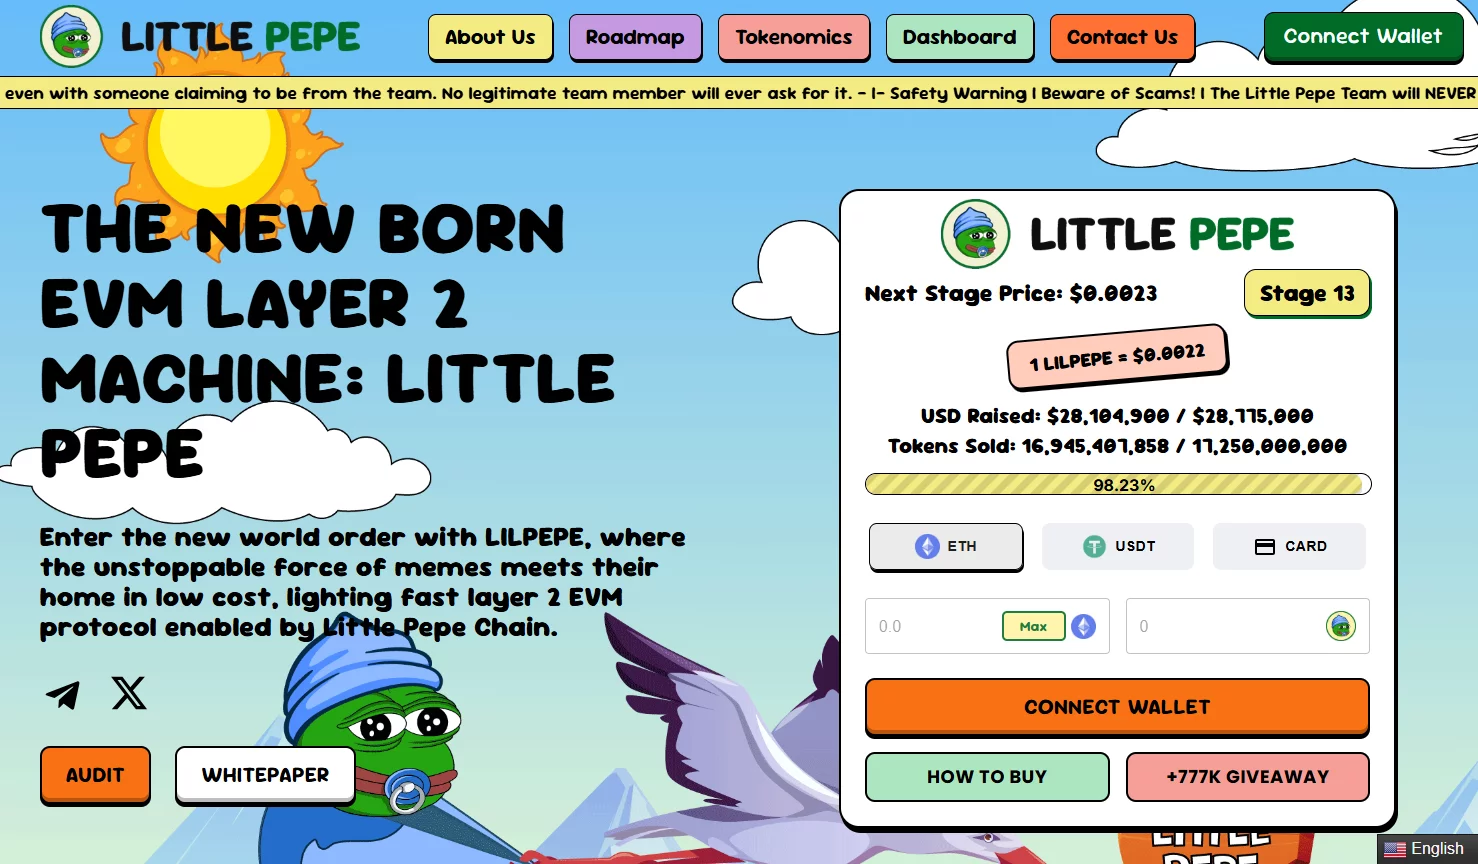
- Little Pepe (LILPEPE) presale surpasses $28 million in Stage 13, approaching next price tier at $0.0023
- LILPEPE leverages Layer 2 Ethereum tech, zero-tax trades, staking, DAO governance, and meme-based rewards
- Presale investors in 2026 eye Little Pepe for high early-stage growth and community-driven crypto utility
As the crypto market gets ready to take its next big leap, presale projects are gaining significant traction from investors. This is because, at such an early stage, they tend to have the greatest growth potential, particularly when they have a strong story behind them. The 2026 crypto cycle is on the horizon, and finding growing presales early on could be the key to making the most of them.
Little Pepe (LILPEPE)

One of the most advanced projects in terms of presale is Little Pepe (LILPEPE). The project has already secured more than $28 million in funding and is currently in Stage 13, nearing completion. The current price of each token is $0.0022, and in the next stage, each token will cost $0.0023.
The project has a fixed total token supply of 100 billion tokens, out of which 26.5 billion is allocated for the presale. The project is based on a Layer 2 blockchain technology compatible with Ethereum and has zero tax trades, sniper bot protection, staking rewards, DAO governance, and a meme launchpad. The project also has some amazing giveaways and rewards that increase community engagement and participation.
ApeMars (APRZ)
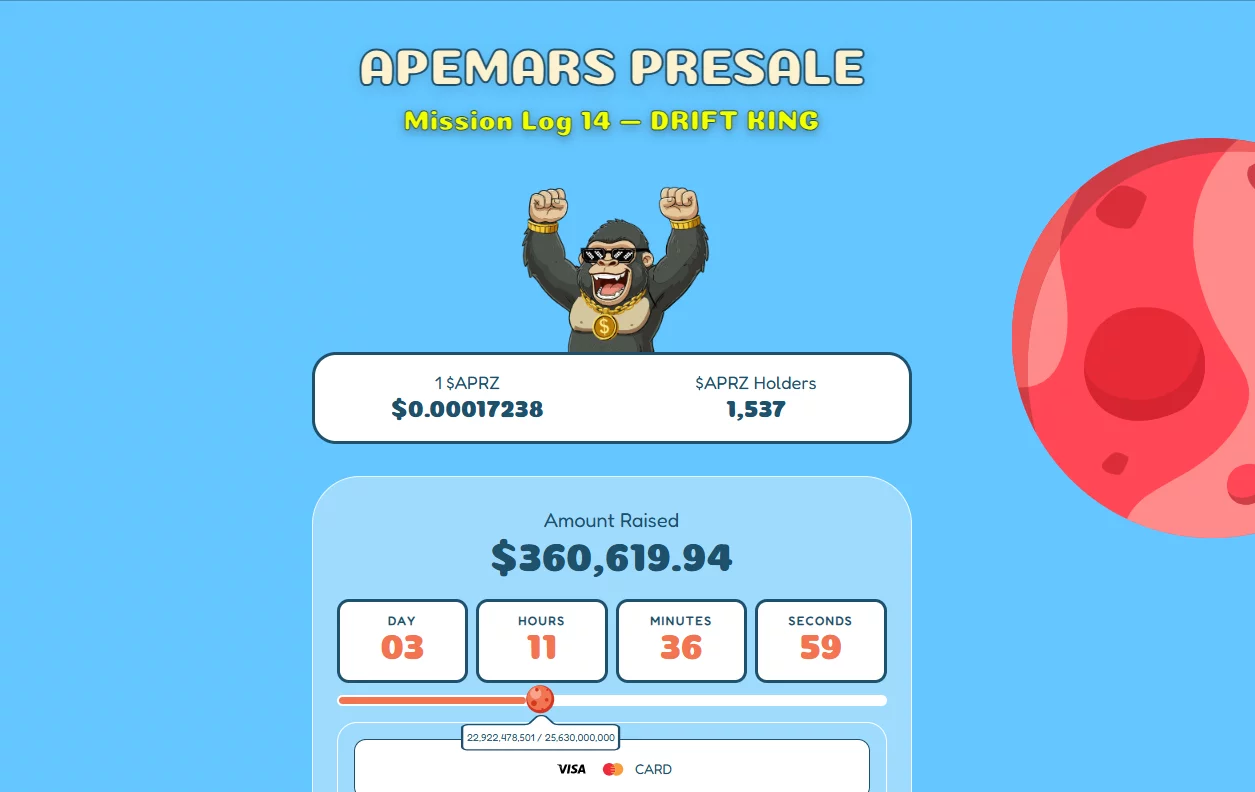
ApeMax is a new presale project that stands out from the rest due to its ‘Boost to Earn’ mechanism. The presale stage is divided into different stages. The presale stage 14 has gathered more than $360,619. The APRZ token is sold for $0.00017238 per token. The project is significant due to its focus on early token use cases, allowing investors to use the tokens right away. The total token supply is also a key feature of ApeMax.
Bitcoin Hyper (HYPER)
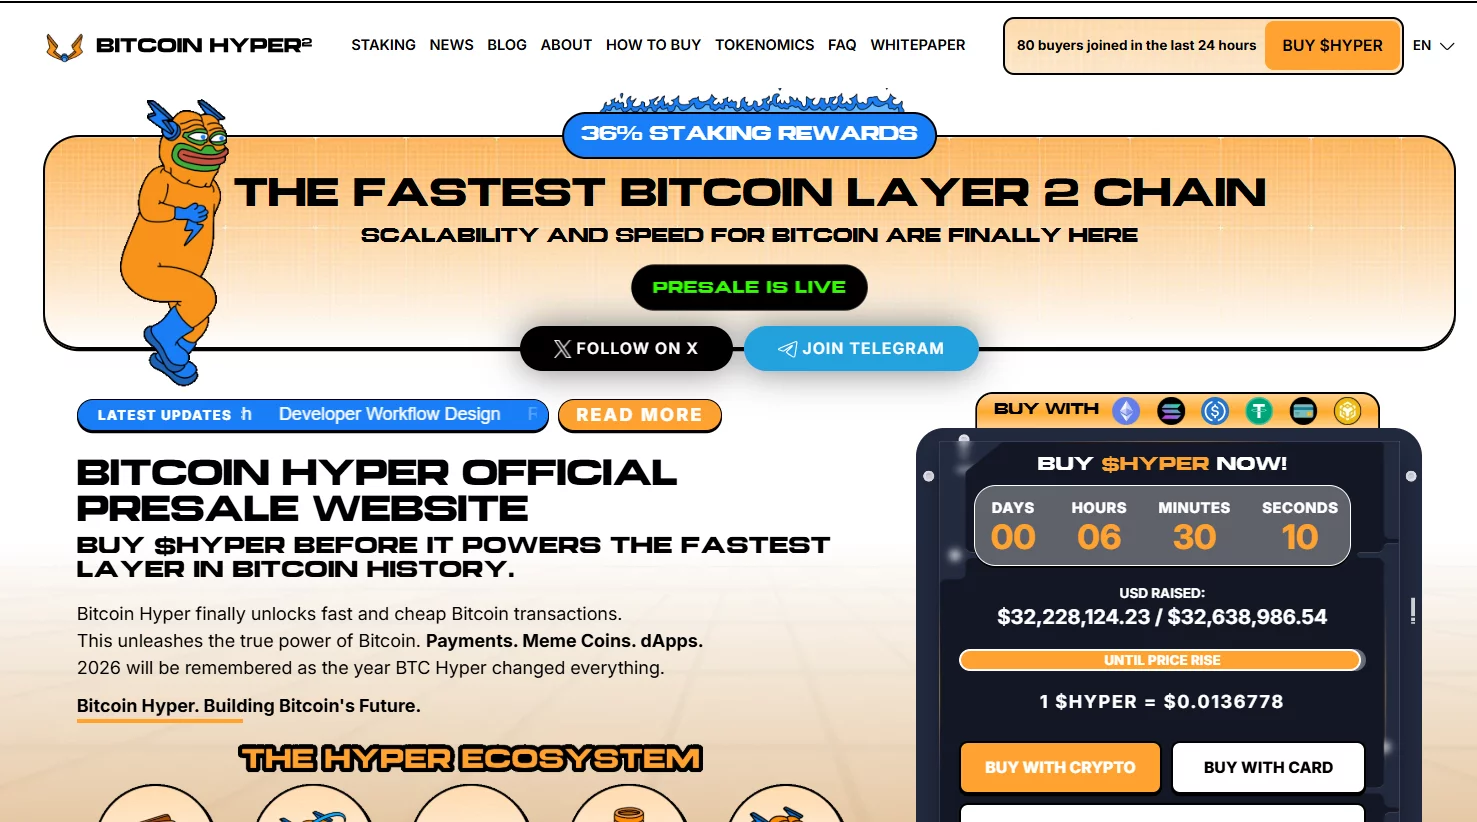
Bitcoin Hyper is one of the largest presales in the current market. It seeks to add the much-needed scalability to the Bitcoin blockchain. So far, the project has managed to raise over $32.2 million. It is trading at the early stages of the micro-cap level, with each token costing $0.0136778. It is expected to rise with the phases. It is one of the utility-driven presales heading into 2026, considering its aim to add Bitcoin to the Defi space using smart contracts.
Maxi Doge (MAXI)
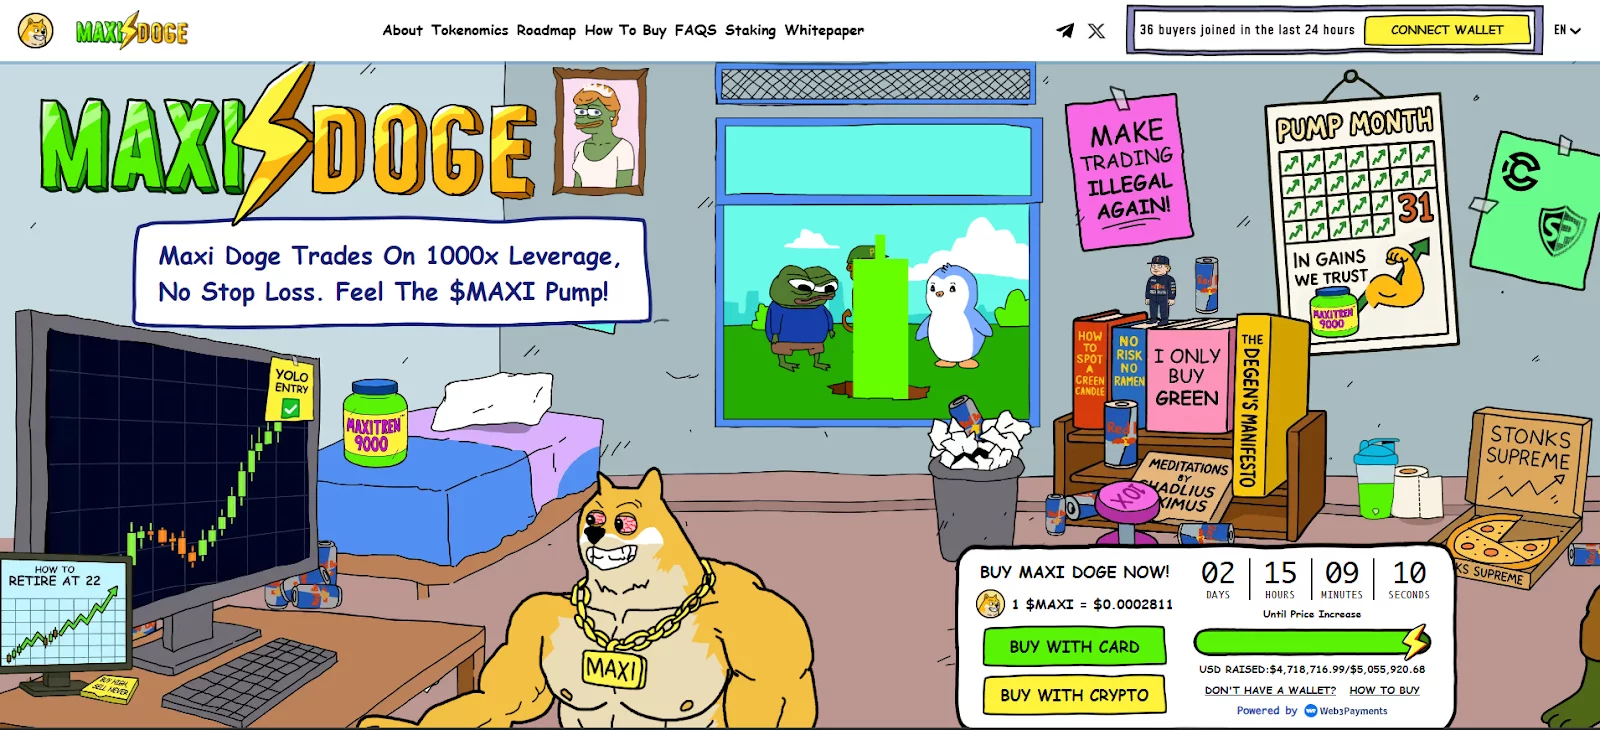
Maxi Doge is a meme-driven presale project focused on high-energy community engagement and staking rewards. The presale has already raised approximately $4.7 million, reflecting growing retail participation. The current token price is around $0.0002811, with incremental increases planned across presale phases. While exact total supply figures vary, the project includes large staking pools (over 10 billion tokens allocated) and reward mechanisms designed to incentivize early holders.
DogeBall (DOGEBALL)
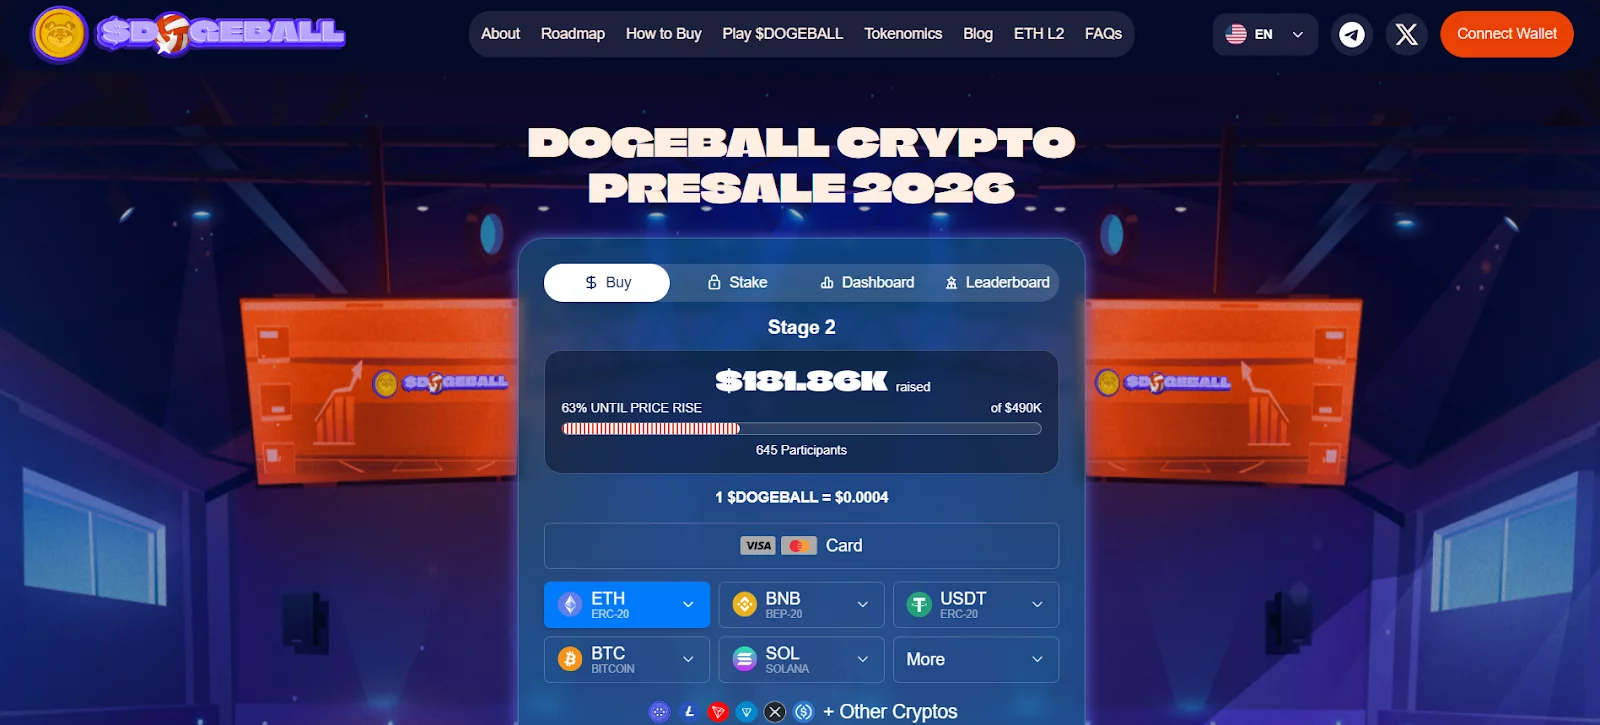
DogeBall is a new presale project, which is still in development, with a concept involving meme culture and a sports/gaming-based ecosystem. The project has a series of stages in its presale, with currently priced at $0.0004 in its presale stage 2, which will increase in later stages. The funding is still in development, but the project is getting attention due to its unique niche and community-based concept, making DogeBall a new and promising contender in the presale space for 2026.
Early presales could define the next winners
As the crypto market continues to head into a new boom in 2026, presale projects are a significant focus for high-growth opportunities. Although all these tokens have different characteristics, Little Pepe stands out due to its impressive funding milestone and presale growth. Presale projects are essential for investors who want to gain access to new and promising projects early.
For more information about Little Pepe, visit the official website, X, and Telegram.
Disclosure: This content is provided by a third party. Neither crypto.news nor the author of this article endorses any product mentioned on this page. Users should conduct their own research before taking any action related to the company.


Samsung Electronics’ shares got a nice boost on Tuesday morning after the company predicted a record-breaking quarter fueled by the massive boom in AI hardware. The stock jumped as much as 4.8% during the day before settling into a 1.76% gain by the close.
Summary
- Samsung Electronics shares rose after forecasting record Q1 profit, driven by strong AI memory demand.
- Operating profit is projected at 57.2 trillion won, more than eight times higher year over year and above analyst estimates.
- Supply chain risks tied to Middle East tensions could disrupt chip materials like helium and weigh on the outlook if prolonged.
According to its early estimates, Samsung is looking at an operating profit of roughly 57.2 trillion won, which is about $37.8 billion, for the first quarter. To put that massive figure in perspective, it is more than eight times what the company made during the same time last year.
If these numbers hold, it will set a brand new quarterly record for the company. The projected profit is nearly triple their previous all-time high and easily crushed the 42.3 trillion won that analysts were originally expecting.
The revenue side looks just as impressive. Samsung expects sales to hit about 133 trillion won, which is a nearly 70% jump year over year. This would also mark the first time the company’s quarterly revenue has ever crossed the 100 trillion won threshold.
MS Hwang, a research analyst at Counterpoint Research, told CNBC that Samsung’s latest numbers are so huge that they are now rivaling the scale of global Big Tech giants.
The strong outlook is largely tied to demand for high-bandwidth memory, or HBM, a critical component used in accelerators from companies like NVIDIA and AMD that power artificial intelligence workloads. Expansion of data centers and rapid growth in AI model training have significantly increased memory requirements, tightening supply and pushing prices higher.
Industry projections suggest memory prices tied to data center applications will continue rising in the coming months. Samsung’s earnings trajectory shows how deeply the AI boom has translated into financial performance, with memory chips forming the core of its profit engine.
Demand for HBM has surged over the past year, leading to supply shortages across the memory market and driving sharp increases in both pricing and shipment volumes. Hwang noted that commodity memory prices could rise by more than 50% in the second quarter, with tight supply conditions expected to persist.
Samsung is also looking to regain its footing in the high-bandwidth memory segment after ceding early leadership to domestic rival SK Hynix, which was quicker to supply advanced AI memory.
Samsung’s Device Solutions division, which houses its memory chip business, accounted for 39% of total revenue and 57% of operating profit in 2025, underlining the segment’s importance to overall earnings.
The company is set to release its full earnings report later this month. While current projections point to strong performance, external risks remain.
Geopolitical risks in focus
Rising tensions in the Middle East are starting to disrupt semiconductor supply chains, with shipments of key materials such as helium facing delays.
The U.S.–Israel conflict involving Iran has raised concerns about access to these inputs, which are essential for chip production, increasing the risk of operational challenges for major manufacturers like Samsung Electronics and SK Hynix.
“If the Middle East conflict ends quickly, it will not significantly impact profits. However, if it persists for several months or longer, it will lead to severe consequences,” Hwang said.
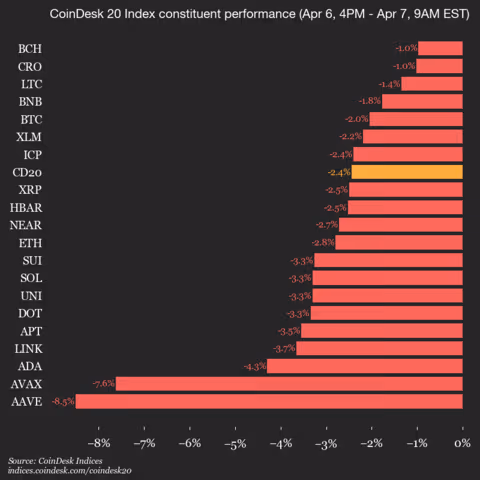
CoinDesk Indices presents its daily market update, highlighting the performance of leaders and laggards in the CoinDesk 20 Index.
The CoinDesk 20 is currently trading at 1917.55, down 2.4% (-47.87) since yesterday’s close.
All 20 assets are trading lower.

Leaders: BCH (-1.0%) and CRO (-1.0%).
Laggards: AAVE (-8.5%) and AVAX (-7.6%).
The CoinDesk 20 is a broad-based index traded on multiple platforms in several regions globally.
Anthropic Hits $30 Billion Run Rate as Enterprise Demand and Compute Deals Reshape AI Race

The House | Swimming is a life-saving skills

Cycling: 19-year-old Paul Seixas earns first World Tour victory – Sports


-

 NewsBeat5 days ago
Steven Gerrard disagrees with Gary Neville over ‘shock’ Chelsea and Arsenal claim | Football
-

 Business5 days ago
No Jackpot Winner and $194 Million Prize Rolls Over
-

 Fashion4 days ago
Weekend Open Thread: Spanx – Corporette.com
-

 Crypto World6 days ago
Gold Price Prediction: Worst Month in 17 Years fo Save Haven Rock
-

 Business2 days ago
Three Gulf funds agree to back Paramount’s $81 billion takeover of Warner, WSJ reports
-

 Sports3 days ago
India men’s 4x400m and mixed 4x100m relay teams register big progress | Other Sports News
-

 Business3 days ago
Expert Picks for Every Need
-

 Business5 days ago
Login and Checkout Issues Spark Merchant Frustration
-

 Sports7 days ago
Tallest college basketball player ever, standing at 7-foot-9, entering transfer portal
-

 Crypto World7 days ago
Bitcoin enters the public bond market as Moody’s gives a first-of-its-kind crypto deal a rating
-
Crypto World7 days ago
Bitcoin stalls below key resistance as technical signals skew bearish
-

 Tech5 days ago
Commonwealth Fusion Systems leans on magnets for near-term revenue
-
Business2 days ago
No Jackpot Winner, Prize to Climb to $231 Million
-

 Politics7 days ago
Starmer’s centre has collapsed, and the left was right all along
-

 Crypto World6 days ago
Ripple rolls out enterprise crypto treasury platform for corporates
-

 Fashion1 day ago
Massimo Dutti Offers Inspiration for Your Summer Mood Board
-
Crypto World7 days ago
AI Memory Rout Wipes 9% Off Nvidia Stock: Chart Says More Pain Ahead
-

 Crypto World6 days ago
Why It’s Partnering, Not Issuing
-

 Tech7 days ago
Oakcastle MP300 review: the super-cheap MP3 player that can
-

 Politics7 days ago
Rupert Lowe has his dog shot, don’t forget
You must be logged in to post a comment Login