

Crypto World
What KOSPI’s Decline Means for South Korea’s Crypto Markets
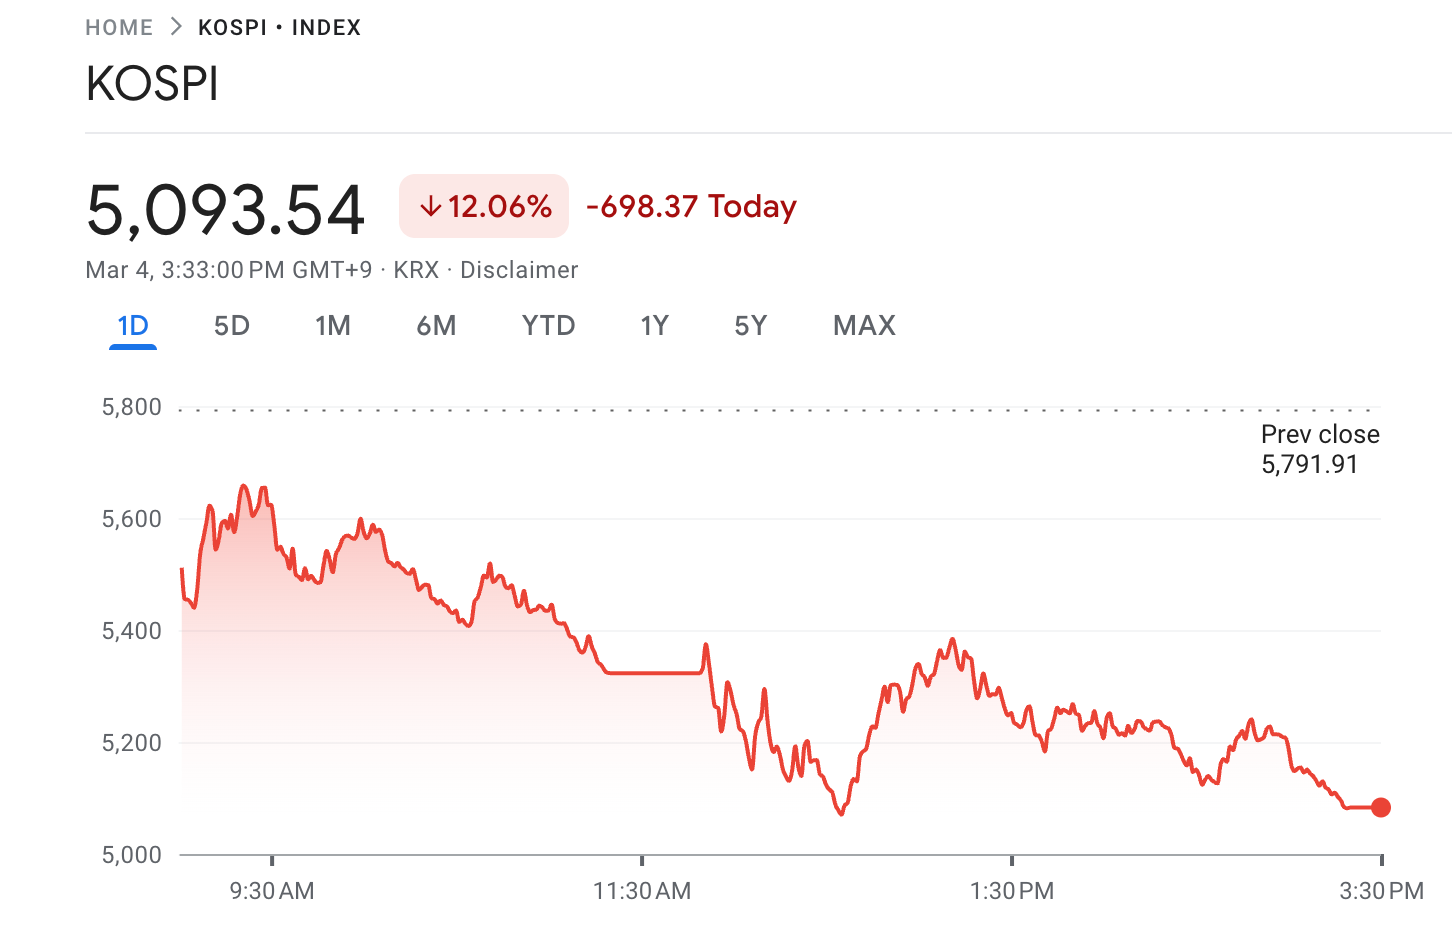
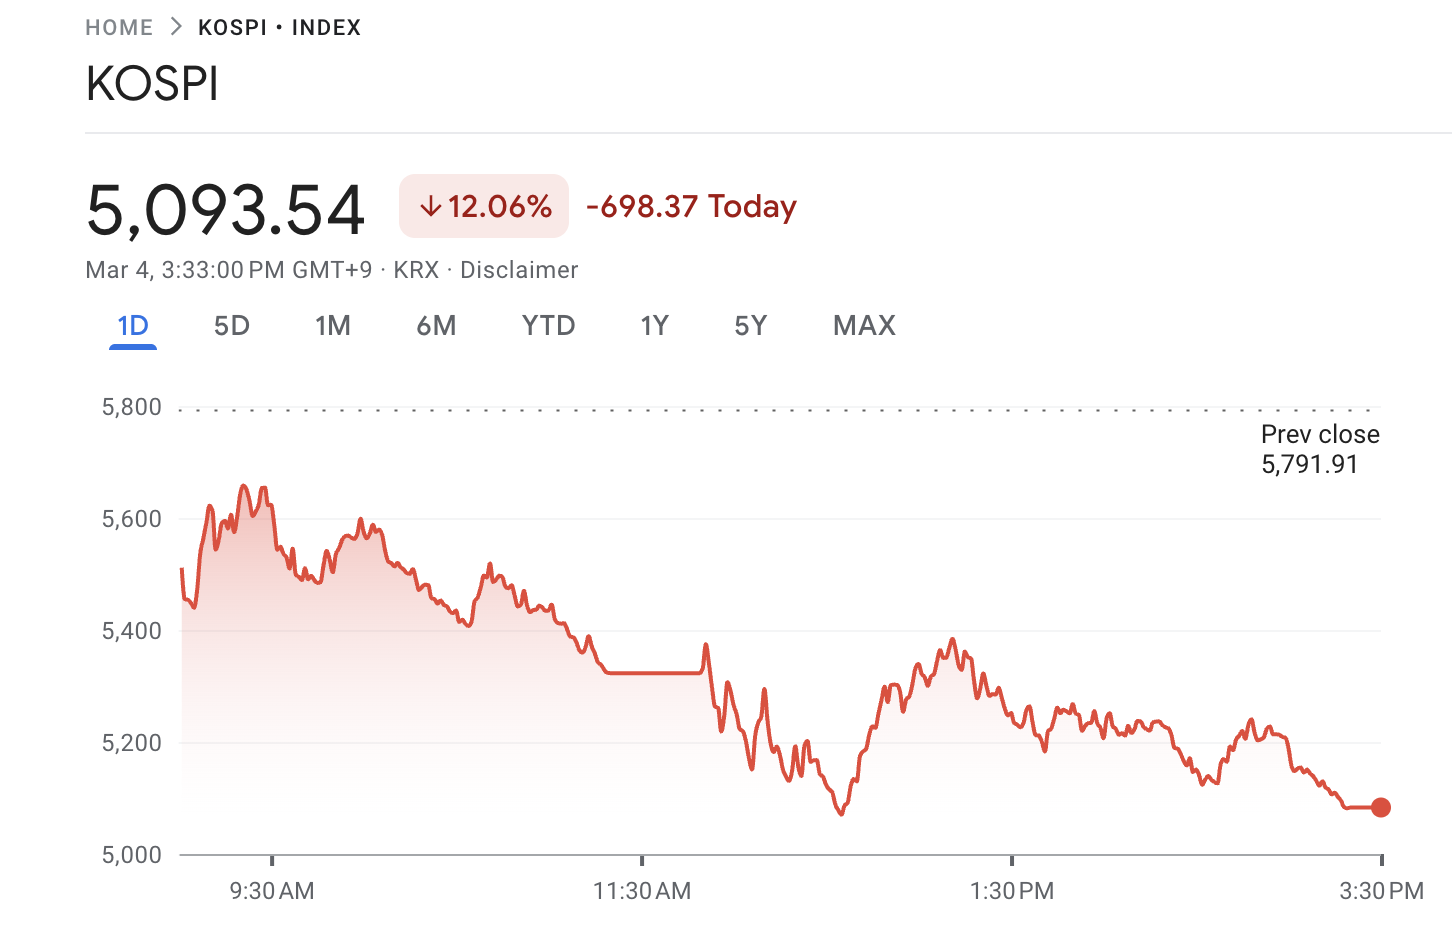
South Korea’s benchmark stock index posted its steepest single-day decline on record, as geopolitical tensions from the widening US-Israel-Iran conflict rattled markets.
Despite the dip in equities, traders focused on fresh crypto exchange listings, with newly listed tokens posting double-digit gains even as broader market sentiment deteriorated sharply.
Korean Stock Market Under Pressure Amid Geopolitical Tensions
According to Google Finance data, the Korea Composite Stock Price Index (KOSPI) plunged more than 12% on Wednesday. In addition, Korea Securities Dealers Automated Quotations (KOSDAQ) saw losses exceeding 10%.
“Seoul KOSPI officially ends down 12.06%, biggest daily percentage loss on record,” market analyst David Scutt posted.
Follow us on X to get the latest news as it happens
Channel News Asia reported that the Korean Stock Exchange imposed a temporary trading halt on Wednesday morning after both the KOSPI and KOSDAQ indices dropped by more than 8%.
Besides South Korea, Japan, Hong Kong, and China’s stock markets dipped on Wednesday, driven largely by escalating global tensions. The ongoing crisis has led to a sharp spike in oil prices. Meanwhile, the closure of the Strait of Hormuz has further heightened concerns.
Asian economies are especially vulnerable to disruptions in energy supplies from the Middle East. Many of them rely heavily on crude oil imports from Gulf states.
Japan and South Korea are particularly exposed. 87% of Japan’s and 81% of South Korea’s total energy consumption comes from imported fossil fuels.
Why KOSPI’s Performance Matters For Crypto
The latest decline in the KOSPI follows a 7.2% drop on Tuesday, marking its worst two-day performance in decades. The index is now approaching the 5,000 level, a threshold that carries symbolic significance beyond being just a round number.
During this election, President Lee Jae-myung outlined his “KOSPI 5,000” vision and pledged to boost the stock market.
“I don’t think Kospi 5000 is that difficult. If you believe in me, you should take a greater interest in the stock market,” he said.
Notably, on the final trading day before the June 3 presidential election, the KOSPI closed at 2,698.97. Over the next eight months, it surged by approximately 85%, crossing the 5,000 mark for the first time in January 2026.
The stock market rally had real consequences for crypto. As equities rose, liquidity from Korean retail investors shifted away from crypto, with many moving their funds into stocks.
BeInCrypto reported in November that crypto trading volumes had dropped by over 80%. Moreover, according to the Bank of Korea’s Financial Stability Report, the turnover in Korea’s crypto market reached 157%, compared to the global figure of 112%, as retail investors increasingly sought short-term profits.
Crypto Listings Defy Broader Market Turmoil
This drop in equities sharply contrasts with developments in South Korea’s digital asset sector. While stocks fell, new altcoins on South Korean exchanges saw strong demand.
CoinGecko highlighted that Definitive Finance’s EDGE token posted strong gains after its Upbit listing.
Furthermore, Centrifuge’s CFG token rallied 21.6% following its listing on Bithumb. The performance of these tokens suggests South Korean crypto investors may still have an appetite for digital assets, even when traditional markets suffer.
However, it remains unclear if this enthusiasm is sustainable. Exchange listings often drive initial excitement and volume that can inflate prices, regardless of broader market sentiment.
The main question is whether these gains reflect a true shift from stocks to crypto, or if they’re simply driven by short-term speculation. Moreover, if the KOSPI selloff deepens and Korean retail sentiment turns decisively negative, capital that had rotated into equities may not automatically return to crypto. A sustained risk-off mood could suppress inflows across both asset classes.


Bitcoin is navigating a delicate chart landscape as traders weigh the risk of a protracted bear cycle against the possibility of a renewed bounce. After a March rally, market watchers say a sustained move higher will require a meaningful bullish catalyst to overcome persistent resistance and the weight of the larger trend. The asset touched monthly highs near $73,000 as geopolitical tensions underscored a broader risk-off tone, yet the path forward remains uncertain amid technical signals that historically precede retracements in bear markets.
Key takeaways
- A weekly death cross—where shorter-term momentum crosses below longer-term moving averages—remains on track to confirm further downside unless a major bullish catalyst materializes.
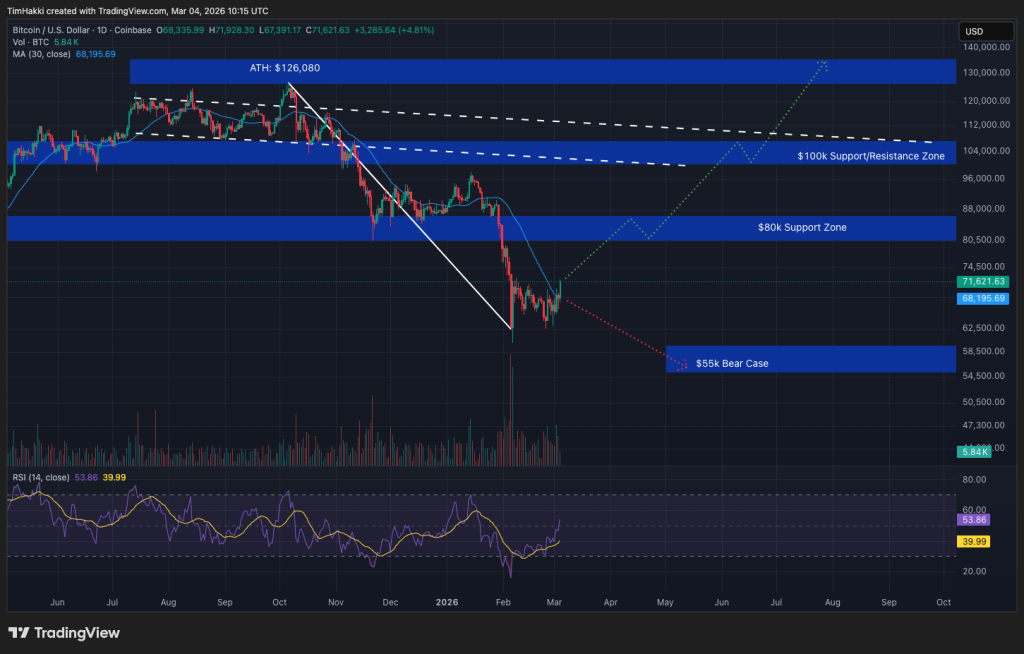
- Key overhead resistance sits in the mid-$70,000s, with psychological resistance around $75,000 and technical resistance near the 50-day simple moving average around $76,350.
- Nearby levels include the 21-day SMA near $67,550, while the 21-week and 100-day SMAs sit near $88,000 and $87,300 respectively, defining longer-range tension points.
- Longer-term expectations for the bear market point to a bottom at or below $50,000, though timing remains contested and depends on external catalysts and market momentum.
- Market sentiment remains sensitive to macro factors and regional developments, translating into continued volatility even as the market tries to establish a clearer directional bias.
Tickers mentioned: $BTC
Sentiment: Bearish
Market context: The current setup mirrors a broader regime where liquidity and risk appetite are closely tied to macro cues and geopolitical risk. While occasional rallies spark talk of a new cycle, technicians emphasize that a durable shift requires sustained demand above key moving-average thresholds and a clean weekly close that confirms a change in trend rather than a temporary squeeze.
Why it matters
The looming death cross, a classic sign of potential downside in traditional market analysis, has traders watching the weekly chart for a potential inflection. If the cross confirms, it could signify a shift in momentum away from the recent bounce and toward a renewed leg lower. In that scenario, buyers would need to muster not just price strength but also conviction across timeframes to reassert control before the market slips further.
Beyond the technical read, the narrative around BTC remains tethered to external catalysts. The market has shown that headlines and macro developments can inject volatility even when chart patterns appear instructive. In the current environment, a decisive move higher would likely require a confluence of fundamental catalysts—such as positive developments in adoption, clearer regulatory signaling, or a surge in institutional demand—that can sustain a breakout beyond the mid-$70,000s. Until such catalysts emerge, the chart suggests that a period of consolidation or another test of support could define the near term.
Historically, the death cross has coincided with periods of drawdown or volatility, but it is not a guaranteed predictor of direction. Traders, therefore, emphasize risk management, looking for confirmation across multiple signals rather than relying on a single technical event. In this light, the market’s resilience around support zones—should price dip again—will be a critical test of whether buyers are accumulating for a more durable reversal or simply attempting to stall a broader decline.
What to watch next
- Next weekly close: Watch whether BTC sustains levels above or around the 21-week/100-week moving averages to assess the strength of the longer-term trend.
- Immediate resistance around $75,000 and the 50-day SMA near $76,350: A convincing breakout above these marks would be needed to alter the short-term narrative.
- Support tests: A pullback toward or below the 21-day SMA around $67,550 could indicate whether bulls are building a base for a larger move or if sellers regain control.
- Timescape & key technical levels: Monitor the interaction with notable levels, such as the Timescape Level around $71,300, for potential reversals or accelerations in price action.
- External catalysts: Keep an eye on macro developments, regulatory signals, or significant on-chain activity that could alter risk sentiment and liquidity in the market.
Sources & verification
- Keith Alan, cofounder of Material Indicators, X update noting continued price weakness beyond lower timeframes and highlighting key level references.
- TradingView price data for BTCUSD, including the 21-day SMA and other moving-average levels used to anchor near-term analysis.
- Cointelegraph coverage referencing the potential bottom around $50,000 and the looming weekly death cross as part of the longer-term bear-market narrative.
- Historical context around the 21-week and 100-week SMAs and their role in shaping crossovers and potential trend shifts.
Rewritten Article Body
Bitcoin at a crossroads as weekly death cross looms and bears watch carefully
Bitcoin (CRYPTO: BTC) is negotiating a pivotal juncture as traders weigh whether a renewed leg lower is on the horizon or whether a bullish catalyst could reverse the current momentum. The asset flirted with monthly highs in the low-to-mid $70,000s, a level that has repeatedly tested bulls’ resolve in a market that remains sensitive to macro risk appetite and geopolitical headlines. The interplay of short-term momentum and long-term trend signals has created a scenario where a single daily candle could tilt expectations toward either sustained consolidation or a renewed surge—provided buyers muster the necessary conviction and volume to invalidate the bears’ case.
On the technical front, the market is watching for confirmation of a death cross that could signal a deterioration in momentum on a broader horizon. The setup involves the convergence of shorter- and longer-term averages in a way that historically precedes renewed downside pressure when not offset by a corresponding bullish catalyst. Traders point to the looming cross between the 21-week and 100-week SMAs as a potential precursor to the next leg down, a pattern that would reinforce a cautious stance unless buyers reassert themselves with a fundamental driver or a sustained breakout.
From a price-action standpoint, BTC has encountered a dense wall of resistance around the mid-$70,000s. The round-number psychology of $75,000 adds a psychological layer to the technical challenge, while the 50-day SMA near $76,350 introduces a second hurdle for a near-term breakout. The chart literature suggests that even if a bounce materializes, the market would need to secure a clear break above these milestones to shift the bias decisively away from a risk-off stance that has dominated sentiment in recent weeks.
Analysts emphasized the importance of the immediate price structure and the reaction to key levels. For instance, discussions around the 21-day SMA—roughly around $67,550—highlight the possibility of a test of near-term support if selling pressure intensifies. Such a test would be more than a routine retest; it could reveal whether the market is accumulating for a larger move or capitulating to a renewed wave of selling pressure. The balance between support and resistance in this zone is a microcosm of the broader struggle between buyers seeking a durable bottom and sellers pressing for lower prices in anticipation of more favorable entry points.
The broader market context cannot be ignored. Periods of heightened geopolitical tension, coupled with macro uncertainty, tend to compress liquidity and amplify price swings across crypto markets. In such environments, even patterns that are traditionally considered indicators of trend shifts must be interpreted against the backdrop of trader risk appetite and the availability of funds for leverage and financing. The presence of a potential death cross adds a layer of caution, but it does not by itself determine inevitability. A sustained positive catalyst—from institutional interest to regulatory clarity or meaningful adoption signals—could still catalyze a repricing that defies the immediate chart signal.
Within this framework, market participants are watching for a sequence of confirmations rather than relying on a single data point. The price level around $71,300, often cited in Timescape-era analyses, serves as a marker for whether the market is merely consolidating or preparing for a genuine breakout. The path forward may hinge on whether bulls can absorb selling pressure and maintain bid support at critical moving averages, allowing price to advance toward the next set of technical obstacles and perhaps establish a new foothold above the $75,000 threshold.
Beyond the charts, the narrative around Bitcoin remains influenced by external catalysts that can abruptly shift risk sentiment. Notably, the market’s sensitivity to developments in the broader financial ecosystem—ranging from regulatory signals to shifts in macro liquidity—means that even a technically fragile scenario can flip if a transformative event unfolds. In such moments, traders tend to recalibrate quickly, reassessing whether the current range represents a temporary pullback or the onset of a more meaningful downturn.
Ultimately, the question facing market participants is whether the bear-market thesis will hold in the near term or whether the combination of resistance, a potential death cross, and macro caution will be overridden by a potent, confidence-affirming catalyst. For now, the balance of evidence leans toward caution: the presence of tight ranges and overlapping moving averages suggests that a decisive breakout will require more than a routine swing; it will demand a convincing expansion of demand that can sustain price beyond the crossings and into a new structural regime.

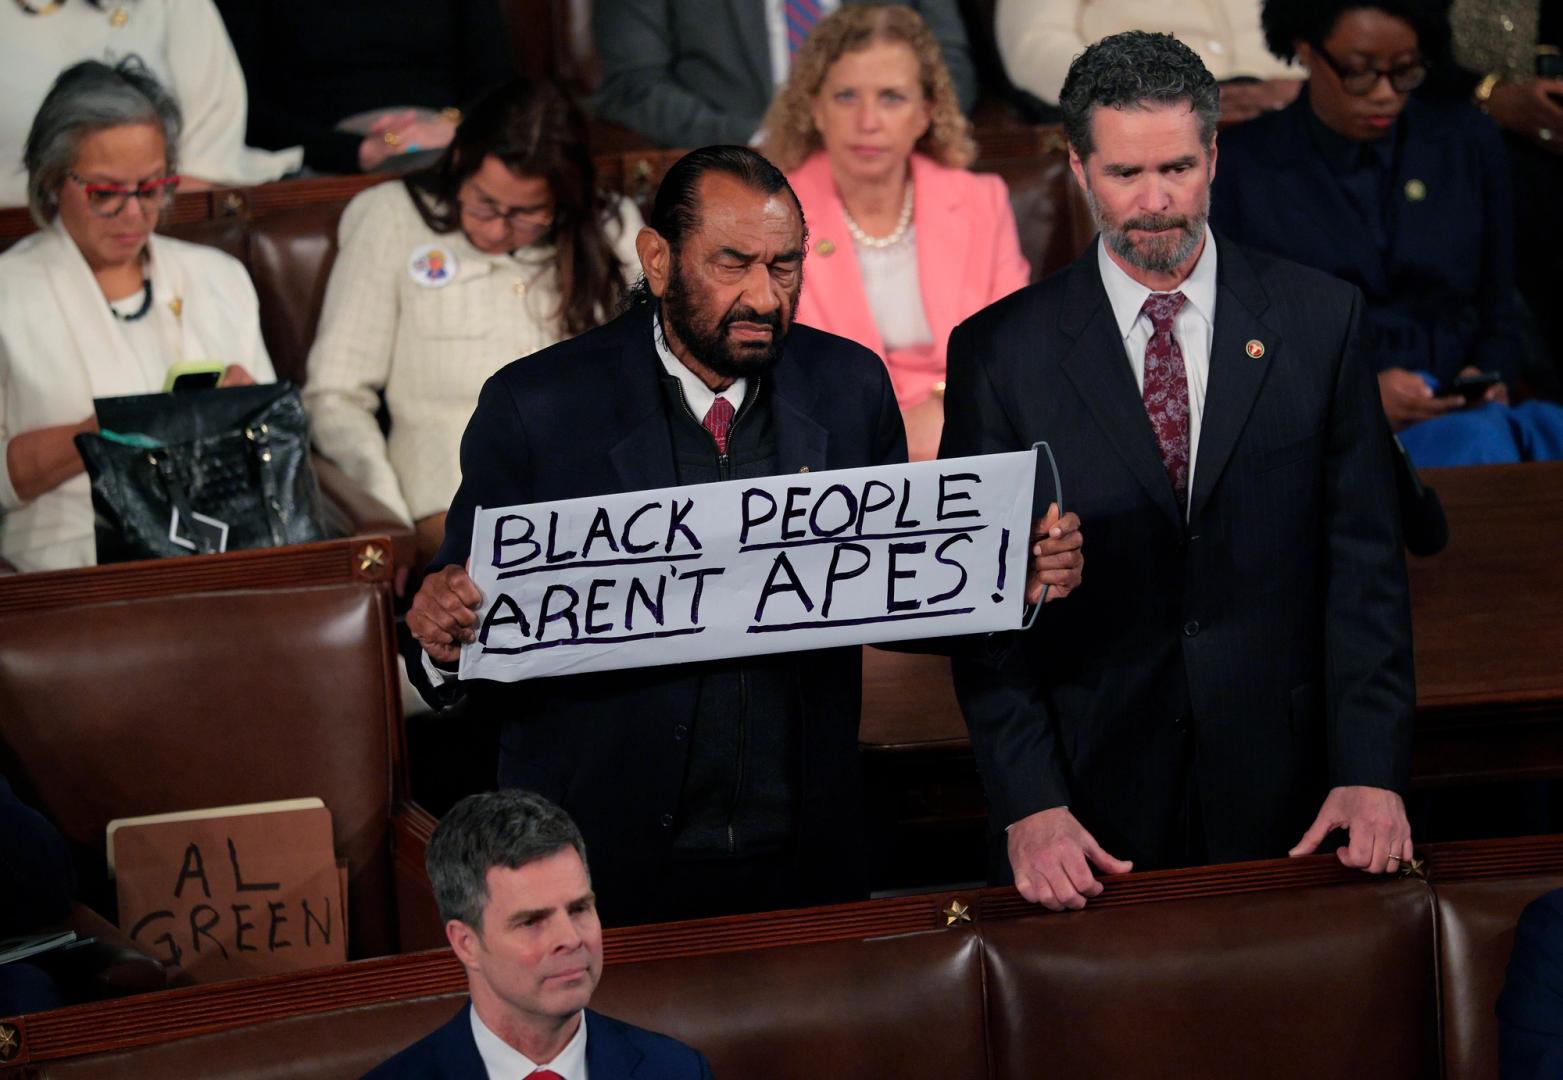
The crypto industry’s campaign-finance arm, the Fairshake political action committee, is already grinding out wins in the opening primaries of the 2026 U.S. congressional midterms, having supported several lower-profile candidates while also opposing a prominent, longtime congressman in Texas, Al Green.
A former Department of Justice lawyer backed by President Donald Trump, Jessica Steinmann, secured a dominant victory with almost 70% of the vote in the Republican primary for Texas’ 8th District, according to state voting results. Among several candidates supported by Fairshake in Tuesday’s contests, she was given the most, with more than $750,000 reported in the most recent Federal Election Commission filings.
Her campaign website described her as “a strong supporter of digital assets, blockchain technology, and financial innovation that expands economic freedom,” and her primary win in a Republican-leaning district bodes well for a potential general-election victory in November.
“Voters responded to her commitment to strengthening the economy through innovation, and ensuring that emerging technologies, like crypto, create jobs and prosperity in her community,” Fairshake said in a statement released after the primaries. With Steinmann and several other winners in these primaries, Fairshake will already count on some likely additions to its pro-crypto allies after the general election.
One of Fairshake’s biggest Tuesday tests — its attempt to knock a veteran Texas Democrat, Green, from his seat — appears to be heading toward a runoff. Green has been among the more vocal Capitol Hill opponents of the crypto sector, voting against legislation and earning an “F” grade from advocacy group Stand With Crypto. But after Fairshake opposed Green with $1.5 million in ads, the longtime lawmaker trailed his Democratic opponent, pro-blockchain Christian Menefee, in the newly redrawn congressional district both incumbents were forced to pursue. Since neither candidate took more than half the vote, they head to a later runoff.
Also in Texas, Fairshake backed Republicans Chris Gober in the 10th, a conservative lawyer who founded Lex Politica to focus on political litigation and government investigations, and Trever Nehls in the 22nd, an Army veteran and Trump loyalist who is seeking to replace his identical twin brother in the seat. Gober won with more than 50% of the vote in a crowded field, and Nehls got 76%. Both districts have have been Republican-dominated, giving Fairshake’s candidates a good chance to win the general election.
The super PAC had also supported Representative French Hill, the Arkansas Republican who is chairman of the House Financial Services Committee and the political tip of the spear in crypto legislation in the House of Representatives. Hill, supported with more than $400,000 in Fairshake ads, easily won his primary with 77%.
In North Carolina, the PAC backed a freshman incumbent, Republican Representative Tim Moore, who won 83% of the vote. His crypto voting record won him an “A” rating from Stand With Crypto, and Fairshake put more than $80,000 into his race.
The crypto industry’s top PAC (and its two PAC affiliates) had $193 million on-hand at the start of the campaign season. Fairshake is by far the sector’s dominant conduit for campaign contributions, so large that it’s among the biggest PACs in the country, rivaling even the political parties’ own campaign arms.
When it weighs into an election, it doesn’t do so to influence voters’ views on crypto. The ads Fairshake buys — without direct coordination with campaigns — make purely political arguments on behalf of or opposing a candidate, with no mention of digital assets. In the 2024 elections, it supported 53 candidates that are currently serving in Congress.
Read More: Crypto PAC Fairshake seeks to force resistant Texas Democrat Al Green from U.S. House
Key takeaways
-
Founders Fund fully exited ETHZilla after previously holding a 7.5% stake. SEC filings show that Peter Thiel-linked entities had reduced their ownership to zero by the end of 2025, signaling a decisive retreat from an Ether-focused public treasury strategy.
-
ETHZilla’s pivot from biotech to an Ether treasury strategy was aggressive. After raising $425 million and later seeking $350 million through convertible bonds, the company accumulated over 100,000 ETH, positioning itself as a leveraged equity proxy for Ether exposure.
-
Debt-driven models can force crypto sales at unfavorable times. ETHZilla’s sale of 24,291 ETH in December 2025 to meet debt obligations highlighted a structural weakness. Leverage combined with crypto volatility can trigger asset liquidation during downturns.
-
Ether treasury strategies carry more operational complexity than Bitcoin treasuries. Ether-focused models often pursue staking and DeFi yields, introducing smart contract, liquidity and counterparty risks that Bitcoin “hold-only” treasury models typically avoid.
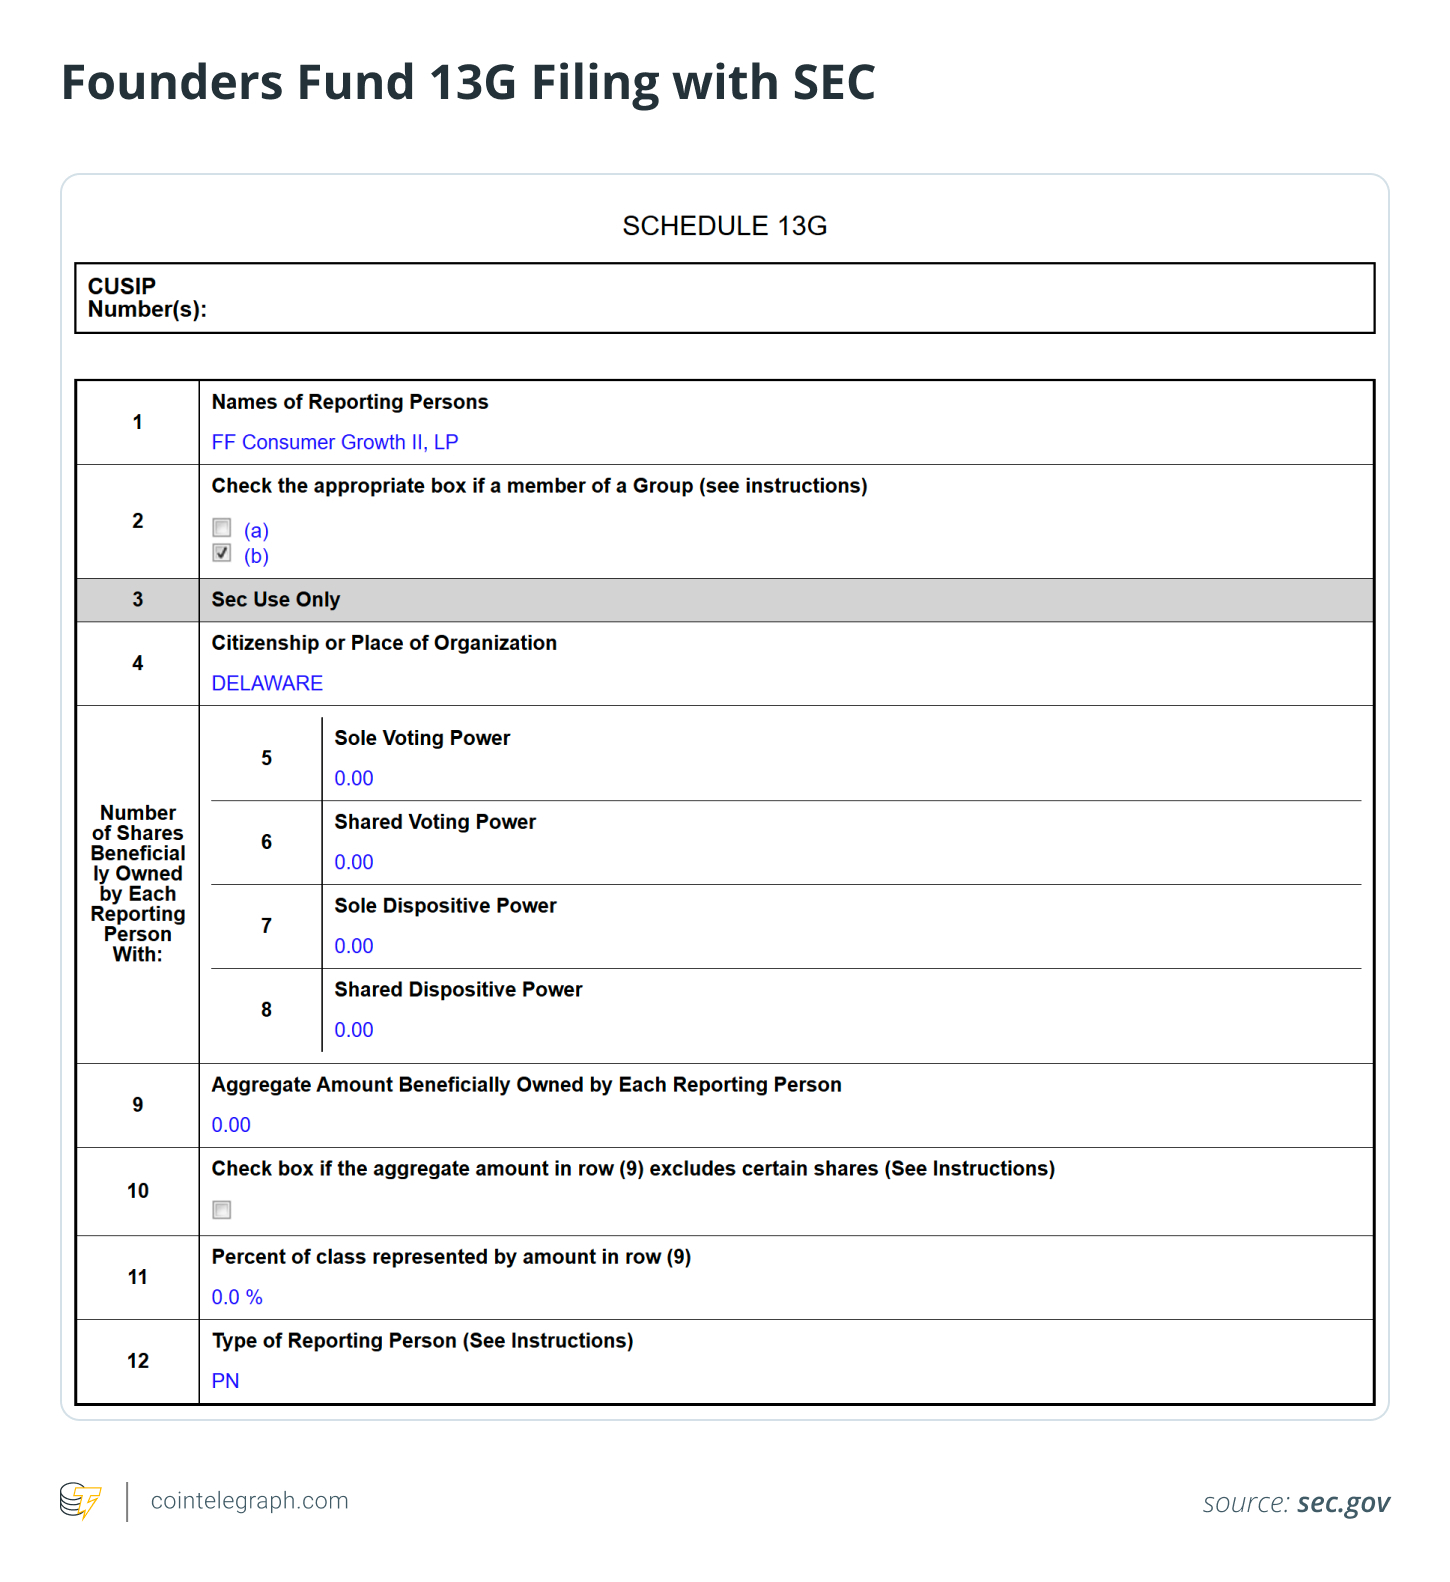
Peter Thiel, the renowned contrarian billionaire investor and co-founder of PayPal and Palantir, has a long history of bold, unconventional bets. A US Securities and Exchange Commission (SEC) filing revealed that Thiel-linked Founders Fund entities exited ETHZilla after disclosing a 7.5% stake in 2025. ETHZilla is an Ether-focused digital asset treasury company.
The sale underscores broader market pressures on Ether treasury models, as ETHZilla’s stock has fallen sharply from its summer 2025 highs amid falling Ether (ETH) prices. This comes at a time when investor enthusiasm for leveraged or equity-wrapped crypto exposure appears to be waning.
This article examines why Thiel’s Founders Fund exited ETHZilla and analyzes the risks of leveraged Ether treasury models, debt-driven balance sheets and forced asset sales. It explores what the move signals about volatility, capital discipline and the sustainability of public crypto treasury strategies.
ETHZilla: From biotech to Ether treasury
In July 2025, biotech company 180 Life Sciences made a bold shift, raising $425 million to launch an Ether-focused treasury strategy and rebranding as ETHZilla. It positioned itself as a publicly traded vehicle for gaining exposure to Ether, with plans to build up its Ether holdings and deploy them in decentralized finance (DeFi) protocols and tokenized asset initiatives.
Just two months later, ETHZilla sought to secure an additional $350 million through convertible bonds to expand its reserves and support further projects. Reports indicated that the company held over 100,000 ETH on its balance sheet at one stage.
The idea behind the endeavor was straightforward: Secure funding, buy and hold Ether, generate potential returns through staking or DeFi activities and offer public shareholders leveraged exposure to Ether’s growth.
However, the strategy faced significant challenges as market conditions deteriorated.
Did you know? In September 2022, Ethereum transitioned from proof-of-work (PoW) to proof-of-stake (PoS) in an event known as “the Merge,” reducing its energy consumption by more than 99%. It is one of the most ambitious upgrades ever attempted on a live blockchain.
ETHZilla’s pivotal sale and Peter Thiel’s exit
As crypto markets retreated from their earlier highs, ETHZilla began reducing its Ether position.
In December 2025, ETHZilla sold 24,291 ETH, generating roughly $74.5 million at an average price of about $3,068 per coin. The stated purpose of the sale was to meet debt repayments. Following the transaction, its Ether holdings reportedly fell to around 69,800 ETH.
The sale of ETH marked a pivotal turning point for the company.
For a company built around an Ether treasury, being forced to offload ETH to cover debt highlighted a fundamental vulnerability. Combining leverage with crypto’s volatility can trigger the sale of holdings at any time. A strategy originally designed for patient, long-term accumulation can quickly transform into a scramble to stabilize the balance sheet.
Not long afterward, Thiel’s Founders Fund reduced its ownership in ETHZilla to zero, fully exiting its position by the end of 2025, according to SEC filings.

What a schedule 13G exit signals and what it doesn’t
A Schedule 13G filing signals passive investment. An amendment reporting zero shares simply means the filer no longer holds enough to meet the disclosure threshold.
These filings, however, do not reveal the reasons behind the change. They offer no insight into whether the sale stemmed from routine portfolio adjustments, risk reduction, valuation concerns or broader doubts about the Ether treasury approach itself.
Timing also matters in this case. Founders Fund’s complete exit came shortly after ETHZilla’s partial Ether liquidation amid mounting pressure on similar Ether-centric balance sheet strategies.
Did you know? Before becoming synonymous with contrarian macro bets, Peter Thiel invested $500,000 in Facebook in 2004 for a 10.2% stake, a deal that later became one of Silicon Valley’s largest venture returns.
Bitcoin vs. Ether treasuries: Store of value vs. layers of hidden complexity
While comparisons to Bitcoin (BTC) treasury strategies are inevitable, Ether introduces layers of complexity that Bitcoin treasuries typically avoid.
Heightened volatility amplified by leverage
Ether tends to experience greater price volatility driven by underlying sentiment compared to Bitcoin. This behavior stems from Ether’s role as both a digital asset and the fuel for a programmable blockchain platform. When treasury companies rely on convertible debt or other forms of leverage, drawdowns may trigger forced selling.
Yield pursuit introduces new risks
Bitcoin treasury companies typically follow a straightforward hold-and-appreciate model. Ether-focused companies, on the other hand, often emphasize staking rewards or DeFi yields to enhance returns. However, this approach comes with trade-offs:
What promises higher returns can also increase operational complexity and systemic vulnerabilities.
Greater narrative and perception challenges
Bitcoin treasury players benefit from a “digital gold” narrative rooted in scarcity and store of value appeal. Ether, however, represents a dynamic, evolving ecosystem shaped by network upgrades, gas fee dynamics, shifting regulatory views and competition from other blockchains. This added complexity heightens uncertainty and makes it harder for markets to price the strategy.

Ether accumulators following diverse paths
Not all companies that opted for Ether treasuries reacted similarly to the downturn in crypto markets.
Some of these companies continued to accumulate ETH, trusting that Ether’s long-term network expansion and utility would outweigh near-term price turbulence. Others took the opposite path, liquidating all or a significant portion of their holdings and realizing substantial losses.
This divergence in approaches suggests that the Ether treasury model is not inherently flawed or doomed across the board. Its sustainability depends on factors such as leverage levels, risk controls and resilience to market cycles.
Did you know? Unlike Bitcoin’s simple transaction fee model, Ether uses “gas” to measure computational work. During peak non-fungible token (NFT) booms, users at times paid hundreds of dollars in gas fees just to mint digital collectibles.
Capital structure risks in volatile asset classes
Convertible debt structures can amplify potential gains in bull markets by providing relatively low-cost leverage to acquire additional assets such as Bitcoin, effectively magnifying returns as prices rise.
When companies trade at premiums to their net asset value (NAV), they can issue equity or convertible instruments to raise capital, which boosts holdings and may further enhance upside.
However, in downturns, when equity discounts widen and crypto prices fall, the feedback loop can reverse:
In this kind of bearish environment, even long-term investors with large Ether portfolios may decide to trim or exit positions to limit downside risk.
Opportunity cost and cleaner exposure
Today’s institutional investors have far more direct avenues for gaining Ether exposure than in earlier market cycles. Options include secure direct custody solutions, regulated spot exchange-traded funds (ETFs), staking-enabled products and sophisticated derivatives. These structures can reduce exposure to company-specific operational, execution or governance risks.
By contrast, investing through an equity wrapper around a leveraged crypto treasury strategy adds an extra layer of complexity and uncertainty. This includes exposure to management’s discretionary decisions, funding and refinancing strategies, governance structures and capital allocation priorities, which may diverge from pure asset performance.
Founders Fund is a venture firm historically focused on backing high-growth operating companies with scalable, technology-driven business models. A vehicle centered on a leveraged crypto balance sheet may not align seamlessly with its long-term portfolio strategy or risk preferences. Recent developments, including its complete exit from Ether treasury plays such as ETHZilla amid market pressures, underscore this selective approach to crypto exposure.
Cointelegraph maintains full editorial independence. The selection, commissioning and publication of Features and Magazine content are not influenced by advertisers, partners or commercial relationships.
Key highlights:
-
Byreal CLI enables AI agent trading, farming on Solana DEX
-
Copy Farmer auto-replicates top LP strategies with risk preview
-
Agent skills include pool analysis, swaps, CLMM management
Byreal unveiled its first AI agent skillset Tuesday, launching an open-source CLI designed specifically for autonomous economic actors on its Solana-based decentralised exchange.
The move marks one of the earliest attempts to build DeFi infrastructure natively for machine users rather than just human traders.
The CLI, published as an Openclaw skill, allows AI agents to execute swaps, analyse liquidity pools, manage concentrated liquidity positions and replicate top-performing farming strategies — all without human intervention.
Byreal founder Emily Bao framed the release as a structural pivot: “Byreal is now building for agents. We believe agents will become autonomous economic actors.”
Agent-native farming debuts with Copy Farmer
At the core of the launch is Copy Farmer, Byreal’s liquidity replication system that lets agents scan top liquidity providers, evaluate APRs, volatility and range positioning, then automatically mirror those strategies. Users — or agents — can preview positions before capital deployment, addressing a key risk in automated yield farming.
The CLI architecture rests on three principles:
-
Deterministic execution to eliminate AI hallucination risks
-
Constraint-based skills that convert intent into bounded actions
-
Machine-readable documentation parsed directly by models
Additional skills cover pool analysis (APR modelling, risk scoring), swap execution (AMM + RFQ routing), CLMM position management (tick alignment, fee claiming) and token discovery.
This stack extends beyond trading automation into capital formation — a shift Bao called essential for agent economics.
Machine-first protocols challenge DeFi UX norms
Traditional DEXes prioritise human‑facing interfaces: slick UIs, mobile apps and educational content. Byreal flips this model, treating agents as first‑class users requiring identity, wallet control and permissionless execution.
“Crypto uniquely provides all three,” Bao said. “Trading is only half the system — capital formation and yield deployment matter just as much.”
The release coincides with growing AI agent hype in crypto, but Byreal differentiates by embedding structured farming directly into the conversational layer.
Most agent projects focus on high-frequency trading; Byreal targets LP optimisation — historically 60–70% of DeFi TVL but underserved by automation.
Solana’s speed meets agent scale
Solana’s sub‑second finality and parallel execution make it ideal for agent workloads, where latency compounds across thousands of micro‑decisions.
Byreal’s deterministic CLI ensures capital deployment logic stays separate from natural language processing, minimising protocol‑level risks.
The agent‑native thesis rests on volume projections: protocols optimised for machines today capture tomorrow’s routing layer as agent adoption scales.
Early DEXes like Uniswap prioritised human UX; Byreal bets the next era belongs to machine economics.
Industry observers see parallels to high‑frequency trading’s dominance of TradFi liquidity. If agents claim even 10% of DeFi volume, agent‑native infrastructure becomes table stakes.
Byreal’s open‑source CLI lowers barriers for developers building the agent economy.
KuCoin’s recent PoR leadership underscores transparency demands even as innovation accelerates. Byreal’s launch arrives amid Solana’s derivatives surge, where agent‑driven yield could unlock new capital inflows.
For protocols, the challenge shifts from user acquisition to machine onboarding. Byreal positions itself at this inflection: not just a DEX, but agent infrastructure.
Whether machines eclipse humans remains speculative, but the CLI proves crypto can speak their language.


As crypto assets continue to expand from on-chain trading into everyday spending, payment products are becoming a core pillar of exchange ecosystems. Recently, one of the global leading digital asset trading platforms Gate officially launched the all-new Gate Card, introducing a high-cashback structure, a dual-track tier upgrade system, and elevated spending limits to further differentiate its offering in the crypto payments market.
One of the standout features of the new Gate Card is its cashback rate of up to 5%. Users earn rewards in multiple assets, including BTC, ETH, USDT, or GT, after each purchase. With a card fee of 1%, higher-tier users can fully offset costs and generate additional net returns, with monthly rewards capped at up to 250 USDT.
Unlike traditional payment cards that focus solely on convenience, this design transforms spending into a sustainable reward mechanism, making “spend-to-earn” a tangible reality.
The card’s tier system has also been upgraded with a dual-track progression model. Users can level up either by meeting spending thresholds or by qualifying through their VIP status, without the need to satisfy multiple overlapping conditions. Tier assessments are automated and take effect in the following month, offering a transparent and predictable growth path.
This structure effectively links trading activity with consumption behavior, enhancing retention among higher-tier users while providing a clear upgrade route for entry- and mid-level users.
In terms of benefits, Gate Card adopts a T0–T4 tiered framework, with each level corresponding to different cashback rates and monthly caps. Top-tier users can enjoy up to 5% cashback with a monthly limit of 250 USDT. The progressively increasing benefits strengthen long-term engagement and encourage users to continuously expand activity and asset holdings.
High spending limits further underscore the product’s focus on premium use cases. Gate Card supports single-transaction and daily limits of up to $500,000 and a monthly cap of $1,500,000, with no annual limits for VIP10-VIP14, making it suitable for cross-border payments, large purchases, and capital management. These elevated limits significantly enhance the card’s appeal to high-net-worth users and improve the real-world utility of crypto assets.
In addition, the global coverage has further expanded its application scenarios. Gate Card can be used in over 100 countries and regions, covering approximately 130 million merchants worldwide that accept Visa. It supports both online and offline payments as well as ATM withdrawals. Users can choose between virtual and physical cards, with additional support for Google Pay, enabling seamless mobile and multi-scenario payments.
Overall, the new Gate Card builds a closed-loop growth model centered on trading, spending, and tier progression. Higher tiers unlock greater rewards, which in turn stimulate increased spending and trading activity, reinforcing user engagement and asset retention.
As the crypto industry moves toward broader adoption and real-world integration, payment tools are emerging as a vital bridge between on-chain assets and the global economy. Through its combination of high cashback, generous limits, and structured growth incentives, Gate Card offers a compelling blueprint for crypto payments with stronger yield potential and ecosystem synergy.
Looking ahead, Gate plans to further integrate crypto payments into its broader platform ecosystem, expand global use cases, and accelerate the large-scale adoption of digital assets in everyday life, helping shape a more sustainable growth model for the industry.
About Gate
Gate, founded in 2013 by Dr. Han, is one of the world’s earliest cryptocurrency exchanges. The platform serves over 50 million users with 4,400+ digital assets and pioneered the industry’s first 100% proof-of-reserves. Beyond core trading services, Gate’s ecosystem includes Gate Wallet, Gate Ventures, and other innovative solutions.
For more information, please visit: Website | X | Telegram | LinkedIn| Instagram | YouTube
Disclaimer: This content does not constitute an offer, solicitation, or recommendation. You should always seek independent professional advice before making investment decisions. Note that Gate may restrict or prohibit certain services in specific jurisdictions. For more information, please read the User Agreement via https://www.gate.com/user-agreement.
Crypto World
Coinbase leads crypto stocks higher after Trump signals support for digital asset market structure bill

Shares of Coinbase and other cryptocurrency companies surged Wednesday after President Donald Trump threw his weight behind the industry’s battle against U.S. banks over yield-bearing stablecoins — adding to momentum the firms were already feeling from bitcoin‘s bounce.
Coinbase was last up more than 12%. Other digital asset firms such as Strategy and Circle jumped 9% and nearly 6%, respectively. Meanwhile, shares of JPMorgan Chase and Bank of America fell less than 1%.
“The Genius Act is being threatened and undermined by the Banks, and that is unacceptable,” Trump said late Tuesday in his social media post. “They need to make a good deal with the Crypto Industry because that’s what’s in best interest of the American People.”
Greenlighting firms to issue dollar-pegged digital tokens that offer interest-like returns has been a sticking point of the Clarity Act, a market structure bill for the crypto industry, in the U.S. Congress.
Crypto companies also got a boost as cryptocurrencies staged a comeback. Bitcoin and ether advanced 5% and 6% on Wednesday, respectively.
Why is crypto up today? Crypto progenitor Bitcoin (BTC) just staged a massive V-shaped recovery, reclaiming $71,000 hours after global headlines screamed war.
The weekend dip to $63,000, triggered by intensifying conflict involving Israel, the U.S., and Iran, looked like the start of a risk-off collapse.
It wasn’t. Instead, the market absorbed the shock, flushed the leverage, and kept buying. While traditional markets panicked over blocked supply lines in the Strait of Hormuz, crypto participants saw a discount. That matters. It signals a shift in market resilience that bears did not account for.
Discover: Crypto’s best pre-launch token sales.
Bitcoin Price Action: Institutional Resilience Meets Geopolitical Risk
The drop was sharp, but the recovery was cleaner. When news of the escalation broke, leverage got flushed immediately.
On-chain analysis indicates supply exhaustion from sellers at the $63,000 mark. Exchange flows remained neutral to negative, suggesting coins were moving to cold storage rather than flooding order books. Regional data supports this. Iranian exchange outflows suggest local capital flight seeking safety in digital assets, while global desks treated the geopolitical risk as a liquidity event to fill bids.
Tagus Capital noted in a recent newsletter that Bitcoin is exhibiting “defensive characteristics” despite its high-beta reputation. Where gold retreated after a brief spike, Bitcoin stabilized and reversed. The smart money absorbed the selling pressure. No capitulation.
Bitcoin Price Prediction: $71,000 Reclaimed, Is $75,000 Next?
The chart is painting a clear invalidation of the bear case. Reclaiming $71,000 changes the market structure entirely. The $65,700 level has now flipped from previous resistance to a fortress of support. The V-shape recovery confirms demand at lower levels was stronger than the panic.

If Bitcoin holds above $70,500, the path to $74,000 opens up quickly. Clear that cleanly, and $75,000 is the next logical target. However, if the price loses $69,000, we likely re-test the weekend lows.
The current setup aligns with the VanEck macro bottom thesis, suggesting the $60,000-$63,000 zone was the final shakeout before the next leg up. Momentum indicators on the 4-hour chart have reset, giving bulls room to run.
Discover: The hottest new crypto around.
Market Resilience: Why Crypto Outperformed Gold and Oil
Traditional safe havens reacted predictably to the conflict. Oil jumped 7% on supply fears. Gold added 2%. Yet, Bitcoin’s 12% bounce from the $63,000 lows outpaced them both. This decouples Bitcoin from the “risk-on only” narrative.
While altcoins like Cardano and Dogecoin are lagging behind Bitcoin, the broader crypto price prediction landscape is turning bullish.
Billionaire Ray Dalio recently dismissed Bitcoin’s safe-haven status, yet the market ignored him. Bitcoin gained despite the war escalating. Institutional desks used the weekend gap, when traditional equity markets were closed, to bid on the asset that never sleeps.
The post Why is Crypto Up? Bitcoin Reclaims $71,000 as Market Shrugs Off Middle East Escalation appeared first on Cryptonews.


When airstrikes hit Iran on Feb. 28, crypto outflows from Nobitex spiked 873%, suggesting a “digital bank run” was ongoing. The reality may be more complex.
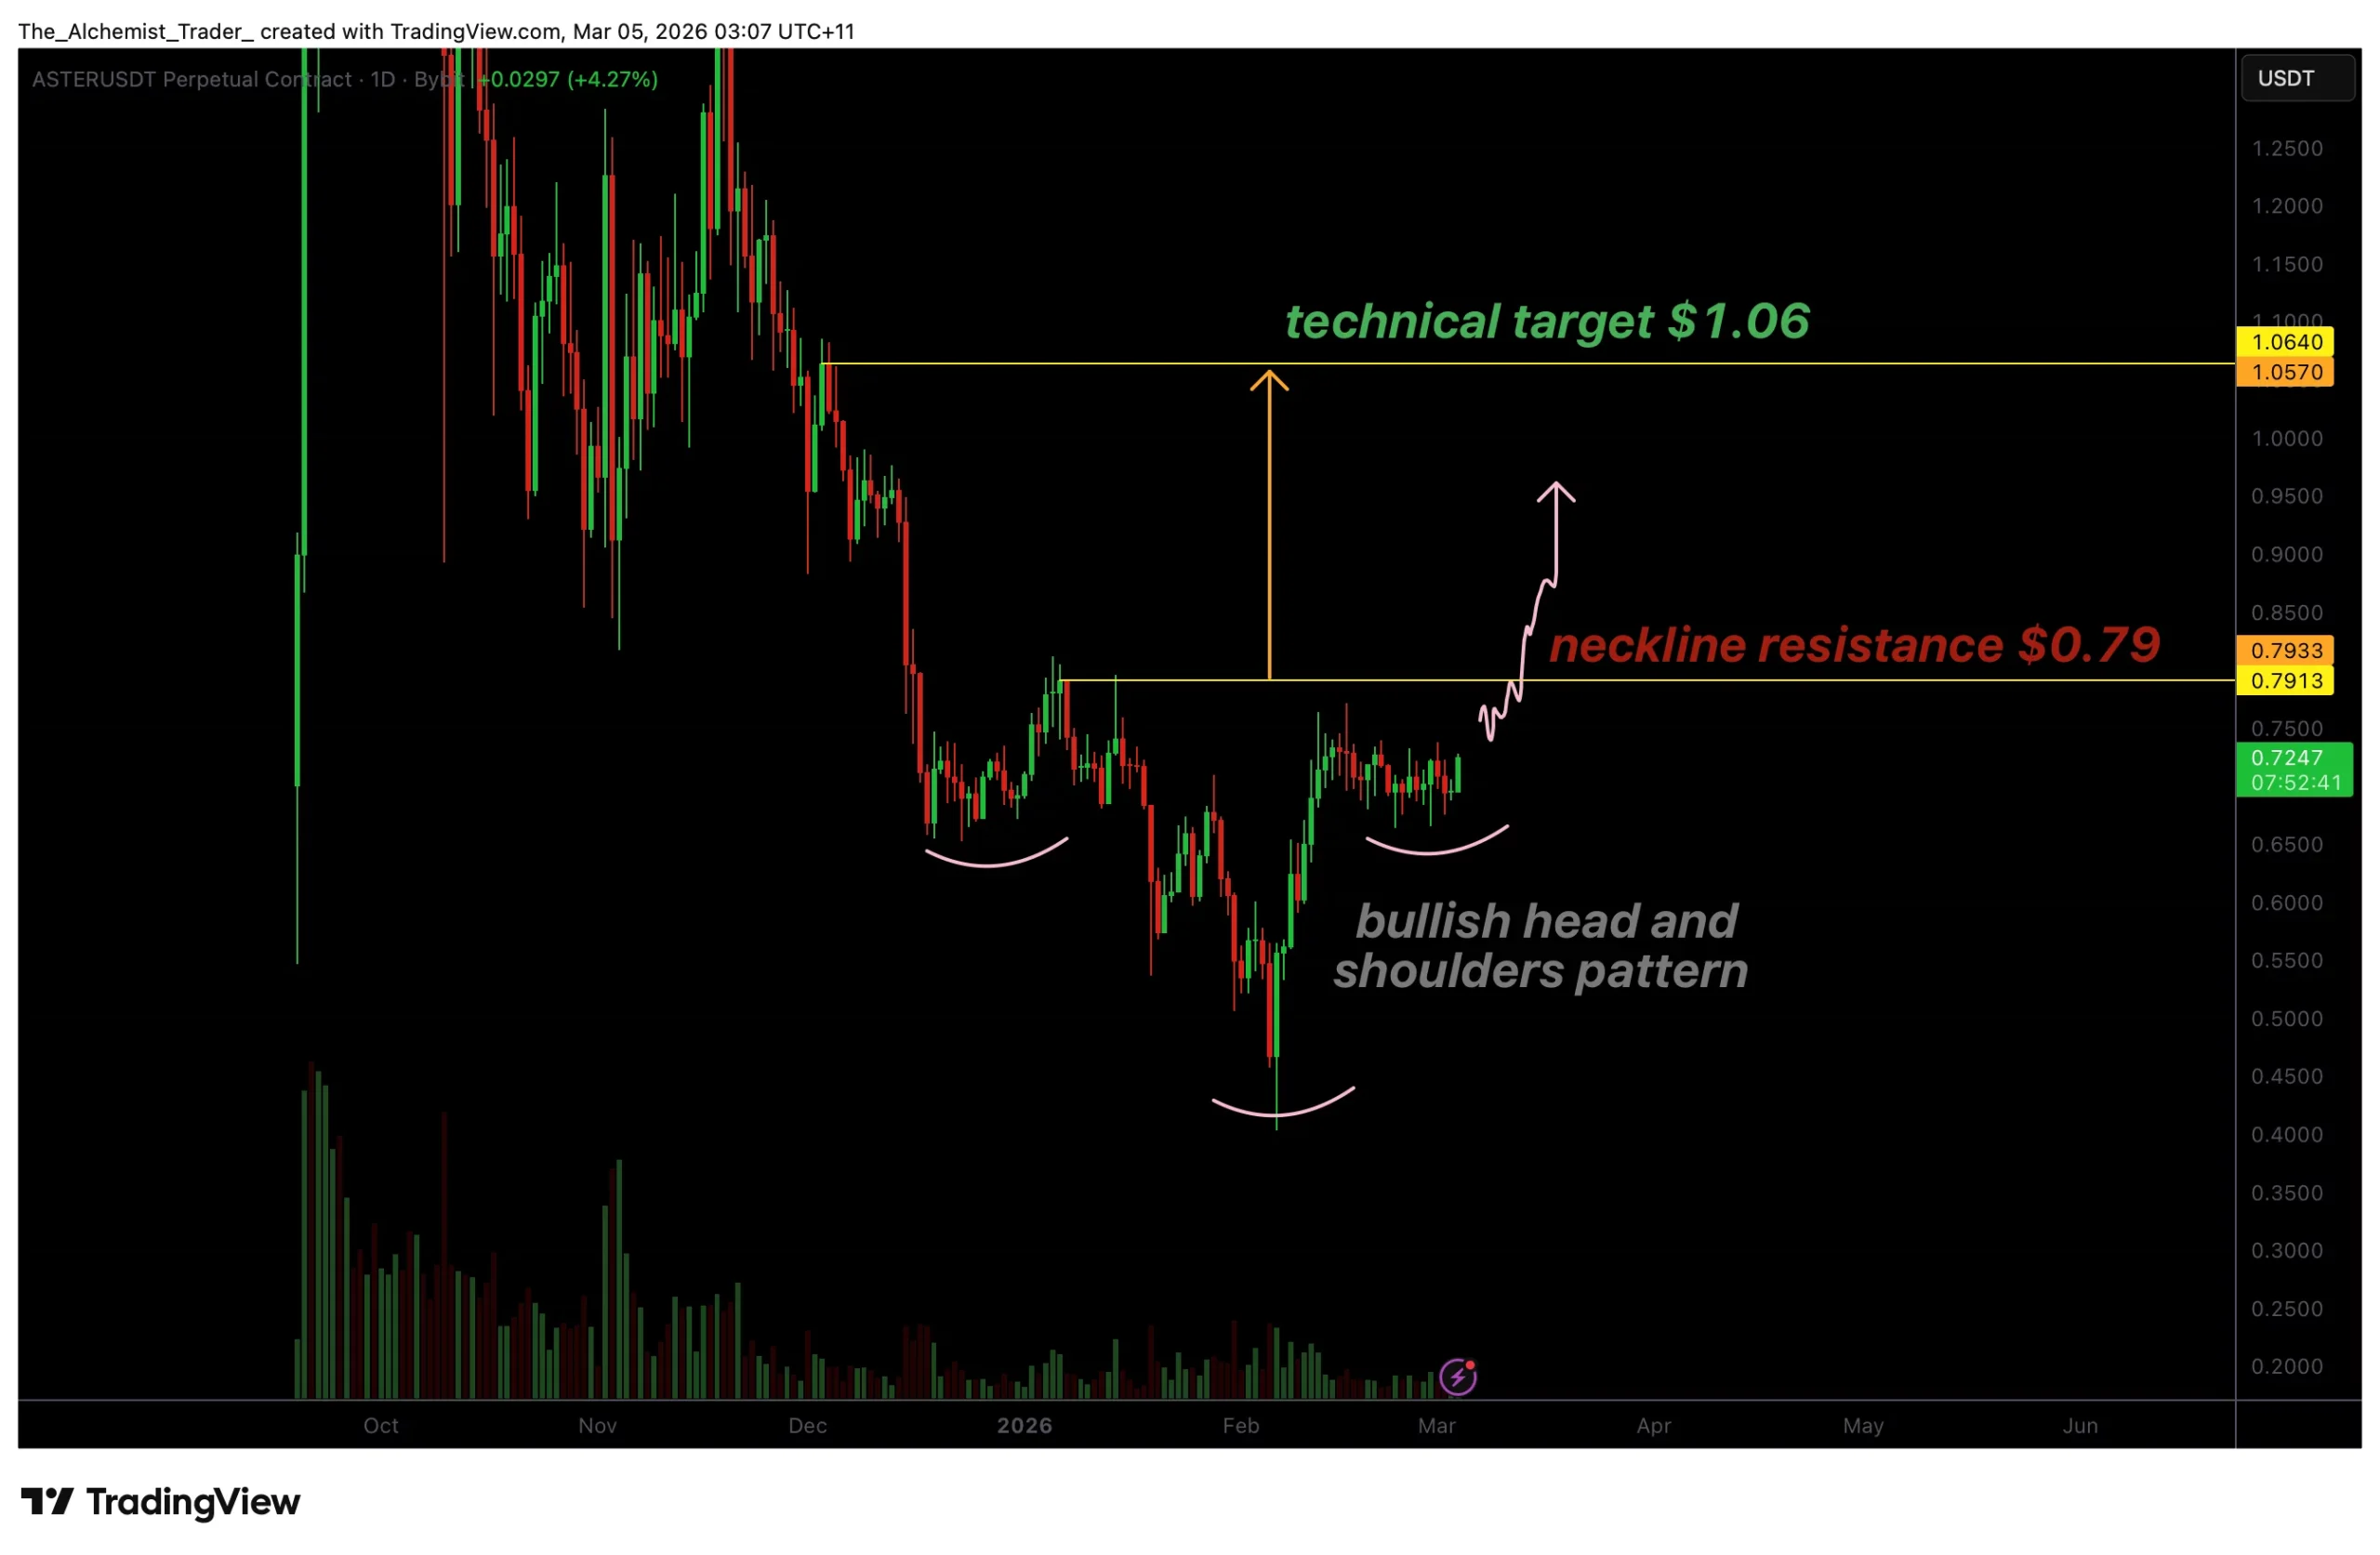
Aster price is forming a potential inverse head and shoulders pattern, signaling a possible trend reversal. A confirmed breakout above $0.79 could trigger a bullish rally toward the $1.06 resistance target.
Summary
- Inverse head and shoulders pattern forming
- $0.79 neckline key breakout level
- Breakout target projected near $1.06
Aster’s (ASTER) recent price action is beginning to show early signs of a structural reversal as a classic technical pattern emerges on the chart. After a prolonged corrective phase, the formation of an inverse head and shoulders pattern suggests that bullish momentum may be building beneath key resistance.
Aster price key technical points
- Bullish Reversal Pattern: Inverse head and shoulders formation developing
- Neckline Resistance: $0.79 acts as the key breakout level
- Technical Target: Breakout projects a move toward $1.06 resistance

Aster’s current price structure closely resembles a classic inverse head and shoulders pattern, one of the most widely recognized bullish reversal formations in technical analysis. The chart shows a clear left shoulder, followed by a deeper head, and a developing right shoulder, indicating that selling pressure may gradually be weakening.
The defining feature of this formation is the neckline resistance, which in this case sits near the $0.79 level. Historically, this region has acted as a strong barrier for price action. Previous attempts to break above this zone resulted in bearish reactions, highlighting the presence of significant supply at this level.
However, repeated tests of resistance often weaken selling pressure over time. Each time the market approaches the neckline, sellers must absorb additional buying demand. Eventually, this process can lead to a decisive breakout if buying pressure becomes strong enough to overwhelm supply.
For the inverse head and shoulders pattern to activate, Aster must break and close above the $0.79 neckline. Confirmation of the breakout would indicate that buyers have regained control of market structure, potentially triggering a new bullish expansion phase.
Once confirmed, the technical target for the pattern sits near $1.06. This projection is calculated by measuring the distance from the head to the neckline and extending that range above the breakout point. Interestingly, this level also aligns with the next high timeframe resistance zone, adding further technical significance to the target.
Volume will play a crucial role in determining whether the breakout can succeed. Bullish continuation patterns typically require a noticeable increase in trading volume to confirm that market participation is expanding. Without strong volume support, breakouts can often fail and revert back into consolidation.
At the moment, the pattern remains unconfirmed, as price is still trading slightly below the neckline resistance. Until the $0.79 level is reclaimed on a closing basis, the inverse head and shoulders formation remains a developing setup rather than an activated signal.
From a market structure perspective, this consolidation beneath resistance may actually strengthen the potential breakout scenario. Prolonged compression below key levels often builds liquidity, which can lead to sharp expansion once the market resolves directionally.
If the breakout occurs with strong momentum, the path toward $1.06 could open quickly as short sellers are forced to cover positions and buyers chase the move higher.
What to expect in the coming price action
Aster is approaching a critical technical inflection point at $0.79. A confirmed breakout above this neckline with strong volume would activate the inverse head and shoulders pattern and project a rally toward the $1.06 resistance zone.
However, failure to break this level could keep price consolidating below resistance until sufficient momentum builds for a decisive move.
A new Bitcoin death cross would ensure continuation of the bear market unless a “major bullish catalyst” appears, per new BTC price analysis.
Bitcoin (BTC) needs a “major bullish catalyst” to avoid canceling out its March rally, says the latest analysis.
Key points:
-
New findings warn that short-term BTC price strength does not remove the risk of the bear market continuing.
-
Bitcoin faces plenty of overhead resistance in the mid-$70,000 zone.
-
A “death cross” formed of two weekly trend lines is still on course to confirm this week.
BTC price caught between multiple trend lines
In an X update on Wednesday, Keith Alan, cofounder of trading resource Material Indicators, warned that BTC price weakness was still present beyond low time frames.

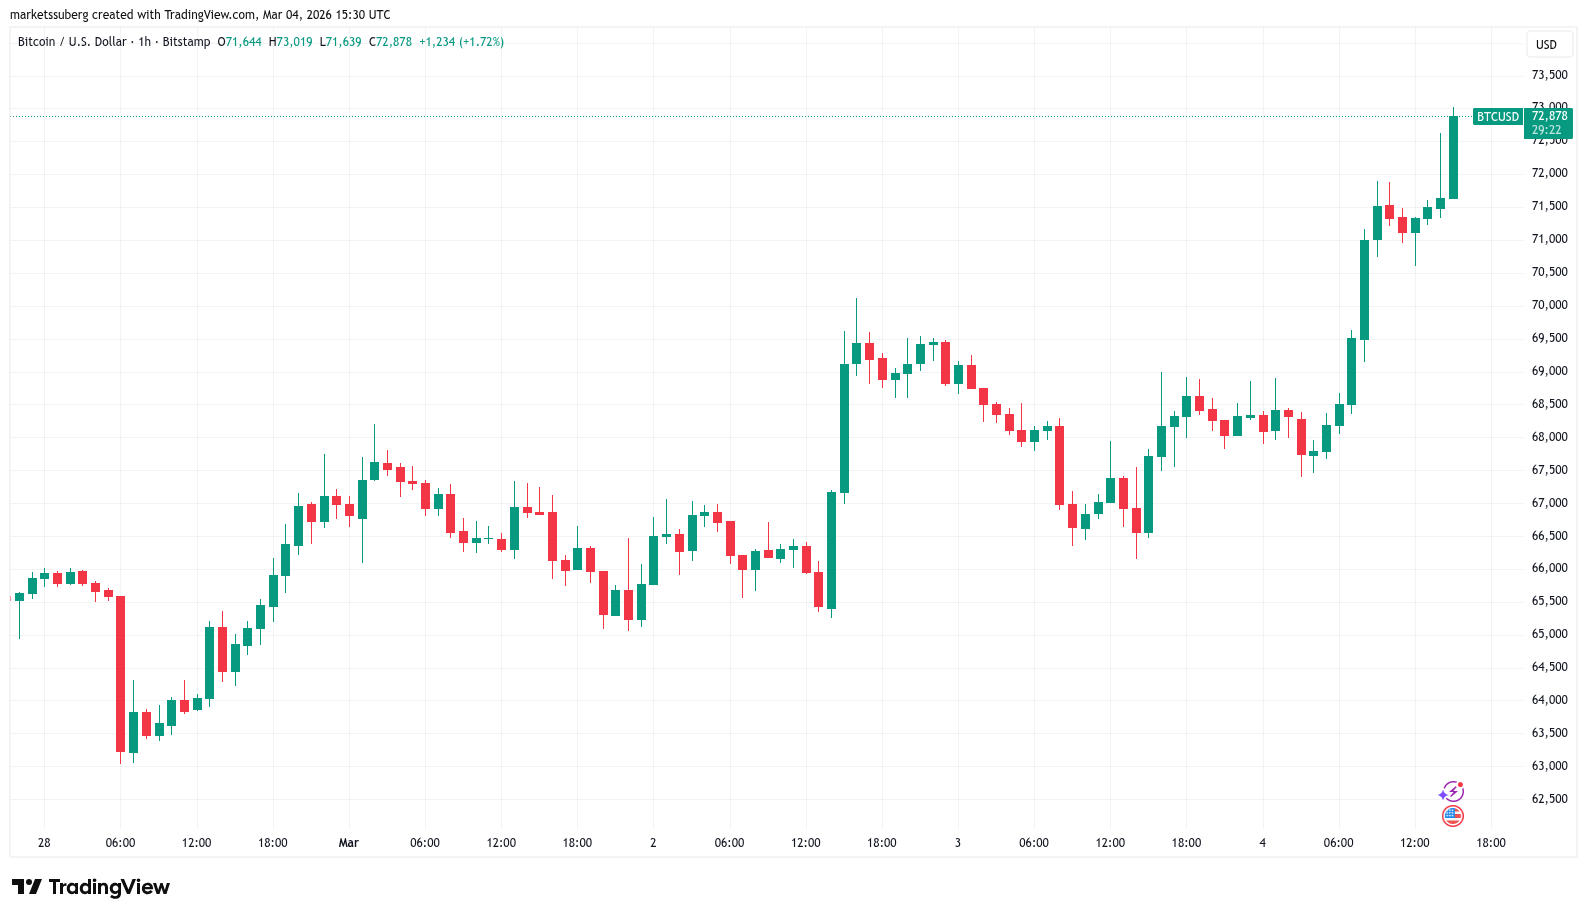
Bitcoin hit monthly highs of $73,019 at the day’s Wall Street open, continuing a rebound that accompanied renewed conflict in the Middle East.
While this quickly led to predictions of a bull market comeback and even new all-time highs, Alan was frank about the BTC price outlook.
“This is an important candle to watch on the $BTC chart,” he summarized.
“On the surface, we’re seeing a short squeeze. From a technical perspective, this D candle is attempting to validate R/S Flips at the 21-Day SMA, the 2021 Top at $69k, and a Timescape Level at $71.3k.”

Alan referred to various key levels near the spot price, including the 21-day simple moving average (SMA) at around $67,550, per data from TradingView.
Also on the radar were the 50-day SMA at $76,350, along with the 21-week and 100-day SMA trend lines at $88,000 and $87,300, respectively.
“If bulls can push price up from here I expect some friction around psychological resistance ~$75k, technical resistance at the $50-Day MA, and the next Timescape Level at $78.3k,” he continued.
“A support test, sooner than later, would be healthy, but I’m not sure that the market is going to make it that easy on us. However this develops, IMO, the longer it takes to grind up, the more durable the rally will likely be.”
Bitcoin death cross still due this weekly candle
As Cointelegraph reported, long-term price expectations for the current bear market favor a bottom at or below the $50,000 mark.
Related: ‘This is not World War III:’ Five things to know in Bitcoin this week
A return to BTC price downside, Alan warned, could come as soon as next week, thanks to a so-called “death cross” involving the 21-week and 100-week SMAs.

A death cross occurs when the former trend line crosses below the latter, implying weaker recent price action compared to the longer-term trend.
“The caveat to that is the simple fact that next week we will print a death cross between the 21 and 100 Week MAs, and that will likely be a precursor to the next leg down unless we get a major bullish catalyst,” he concluded.
This article does not contain investment advice or recommendations. Every investment and trading move involves risk, and readers should conduct their own research when making a decision. While we strive to provide accurate and timely information, Cointelegraph does not guarantee the accuracy, completeness, or reliability of any information in this article. This article may contain forward-looking statements that are subject to risks and uncertainties. Cointelegraph will not be liable for any loss or damage arising from your reliance on this information.

Bitcoin Poised for Next Leg Down as $73K Precedes Death Cross
Valerie Bertinelli reveals she was sexually abused at 11: 'I was just a little girl'

BITCOIN, CRYPTO: HANNO BECCATO (E FERMATO) CHI MANIPOLAVA IL MERCATO?


![[S03:E22] Realiti sebenar Kewangan Rumah Tangga - Aisya Rahman, Perancang Kewangan Bertauliah](https://wordupnews.com/wp-content/uploads/2026/03/1772644504_maxresdefault-80x80.jpg)

-

 Politics6 days ago
ITV enters Gaza with IDF amid ongoing genocide
-

 Politics1 day ago
Alan Cumming Brands Baftas Ceremony A ‘Triggering S**tshow’
-

 Fashion5 days ago
Weekend Open Thread: Iris Top
-

 NewsBeat7 days ago
Cuba says its forces have killed four on US-registered speedboat | World News
-

 Tech4 days ago
Unihertz’s Titan 2 Elite Arrives Just as Physical Keyboards Refuse to Fade Away
-
Sports5 days ago
The Vikings Need a Duck
-
 NewsBeat4 days ago
Dubai flights cancelled as Brit told airspace closed ’10 minutes after boarding’
-

 NewsBeat3 days ago
‘Significant’ damage to boarded-up Horden house after fire
-
 NewsBeat7 days ago
Manchester Central Mosque issues statement as it imposes new measures ‘with immediate effect’ after armed men enter
-
 NewsBeat4 days ago
The empty pub on busy Cambridge road that has been boarded up for years
-

 NewsBeat4 days ago
Abusive parents will now be treated like sex offenders and placed on a ‘child cruelty register’ | News UK
-

 Entertainment2 days ago
Baby Gear Guide: Strollers, Car Seats
-

 Business7 days ago
Discord Pushes Implementation of Global Age Checks to Second Half of 2026
-

 Business6 days ago
Only 4% of women globally reside in countries that offer almost complete legal equality
-
 Tech5 days ago
NASA Reveals Identity of Astronaut Who Suffered Medical Incident Aboard ISS
-
 NewsBeat3 days ago
Emirates confirms when flights will resume amid Dubai airport chaos
-
Politics4 days ago
FIFA hypocrisy after Israel murder over 400 Palestinian footballers
-

 Crypto World6 days ago
From Crypto Treasury to RWA: ETHZilla Retreats and Relaunches as Forum Markets on Nasdaq
-

 NewsBeat2 days ago
Is it acceptable to comment on the appearance of strangers in public? Readers discuss
-

 Tech3 days ago
Viral ad shows aged Musk, Altman, and Bezos using jobless humans to power AI