
Crypto World
What’s behind smart contracts?


by Gonzalo Wangüemert Villalba
•
4 September 2025
Introduction The open-source AI ecosystem reached a turning point in August 2025 when Elon Musk’s company xAI released Grok 2.5 and, almost simultaneously, OpenAI launched two new models under the names GPT-OSS-20B and GPT-OSS-120B. While both announcements signalled a commitment to transparency and broader accessibility, the details of these releases highlight strikingly different approaches to what open AI should mean. This article explores the architecture, accessibility, performance benchmarks, regulatory compliance and wider industry impact of these three models. The aim is to clarify whether xAI’s Grok or OpenAI’s GPT-OSS family currently offers more value for developers, businesses and regulators in Europe and beyond. What Was Released Grok 2.5, described by xAI as a 270 billion parameter model, was made available through the release of its weights and tokenizer. These files amount to roughly half a terabyte and were published on Hugging Face. Yet the release lacks critical elements such as training code, detailed architectural notes or dataset documentation. Most importantly, Grok 2.5 comes with a bespoke licence drafted by xAI that has not yet been clearly scrutinised by legal or open-source communities. Analysts have noted that its terms could be revocable or carry restrictions that prevent the model from being considered genuinely open source. Elon Musk promised on social media that Grok 3 would be published in the same manner within six months, suggesting this is just the beginning of a broader strategy by xAI to join the open-source race. By contrast, OpenAI unveiled GPT-OSS-20B and GPT-OSS-120B on 5 August 2025 with a far more comprehensive package. The models were released under the widely recognised Apache 2.0 licence, which is permissive, business-friendly and in line with requirements of the European Union’s AI Act. OpenAI did not only share the weights but also architectural details, training methodology, evaluation benchmarks, code samples and usage guidelines. This represents one of the most transparent releases ever made by the company, which historically faced criticism for keeping its frontier models proprietary. Architectural Approach The architectural differences between these models reveal much about their intended use. Grok 2.5 is a dense transformer with all 270 billion parameters engaged in computation. Without detailed documentation, it is unclear how efficiently it handles scaling or what kinds of attention mechanisms are employed. Meanwhile, GPT-OSS-20B and GPT-OSS-120B make use of a Mixture-of-Experts design. In practice this means that although the models contain 21 and 117 billion parameters respectively, only a small subset of those parameters are activated for each token. GPT-OSS-20B activates 3.6 billion and GPT-OSS-120B activates just over 5 billion. This architecture leads to far greater efficiency, allowing the smaller of the two to run comfortably on devices with only 16 gigabytes of memory, including Snapdragon laptops and consumer-grade graphics cards. The larger model requires 80 gigabytes of GPU memory, placing it in the range of high-end professional hardware, yet still far more efficient than a dense model of similar size. This is a deliberate choice by OpenAI to ensure that open-weight models are not only theoretically available but practically usable. Documentation and Transparency The difference in documentation further separates the two releases. OpenAI’s GPT-OSS models include explanations of their sparse attention layers, grouped multi-query attention, and support for extended context lengths up to 128,000 tokens. These details allow independent researchers to understand, test and even modify the architecture. By contrast, Grok 2.5 offers little more than its weight files and tokenizer, making it effectively a black box. From a developer’s perspective this is crucial: having access to weights without knowing how the system was trained or structured limits reproducibility and hinders adaptation. Transparency also affects regulatory compliance and community trust, making OpenAI’s approach significantly more robust. Performance and Benchmarks Benchmark performance is another area where GPT-OSS models shine. According to OpenAI’s technical documentation and independent testing, GPT-OSS-120B rivals or exceeds the reasoning ability of the company’s o4-mini model, while GPT-OSS-20B achieves parity with the o3-mini. On benchmarks such as MMLU, Codeforces, HealthBench and the AIME mathematics tests from 2024 and 2025, the models perform strongly, especially considering their efficient architecture. GPT-OSS-20B in particular impressed researchers by outperforming much larger competitors such as Qwen3-32B on certain coding and reasoning tasks, despite using less energy and memory. Academic studies published on arXiv in August 2025 highlighted that the model achieved nearly 32 per cent higher throughput and more than 25 per cent lower energy consumption per 1,000 tokens than rival models. Interestingly, one paper noted that GPT-OSS-20B outperformed its larger sibling GPT-OSS-120B on some human evaluation benchmarks, suggesting that sparse scaling does not always correlate linearly with capability. In terms of safety and robustness, the GPT-OSS models again appear carefully designed. They perform comparably to o4-mini on jailbreak resistance and bias testing, though they display higher hallucination rates in simple factual question-answering tasks. This transparency allows researchers to target weaknesses directly, which is part of the value of an open-weight release. Grok 2.5, however, lacks publicly available benchmarks altogether. Without independent testing, its actual capabilities remain uncertain, leaving the community with only Musk’s promotional statements to go by. Regulatory Compliance Regulatory compliance is a particularly important issue for organisations in Europe under the EU AI Act. The legislation requires general-purpose AI models to be released under genuinely open licences, accompanied by detailed technical documentation, information on training and testing datasets, and usage reporting. For models that exceed systemic risk thresholds, such as those trained with more than 10²⁵ floating point operations, further obligations apply, including risk assessment and registration. Grok 2.5, by virtue of its vague licence and lack of documentation, appears non-compliant on several counts. Unless xAI publishes more details or adapts its licensing, European businesses may find it difficult or legally risky to adopt Grok in their workflows. GPT-OSS-20B and 120B, by contrast, seem carefully aligned with the requirements of the AI Act. Their Apache 2.0 licence is recognised under the Act, their documentation meets transparency demands, and OpenAI has signalled a commitment to provide usage reporting. From a regulatory standpoint, OpenAI’s releases are safer bets for integration within the UK and EU. Community Reception The reception from the AI community reflects these differences. Developers welcomed OpenAI’s move as a long-awaited recognition of the open-source movement, especially after years of criticism that the company had become overly protective of its models. Some users, however, expressed frustration with the mixture-of-experts design, reporting that it can lead to repetitive tool-calling behaviours and less engaging conversational output. Yet most acknowledged that for tasks requiring structured reasoning, coding or mathematical precision, the GPT-OSS family performs exceptionally well. Grok 2.5’s release was greeted with more scepticism. While some praised Musk for at least releasing weights, others argued that without a proper licence or documentation it was little more than a symbolic gesture designed to signal openness while avoiding true transparency. Strategic Implications The strategic motivations behind these releases are also worth considering. For xAI, releasing Grok 2.5 may be less about immediate usability and more about positioning in the competitive AI landscape, particularly against Chinese developers and American rivals. For OpenAI, the move appears to be a balancing act: maintaining leadership in proprietary frontier models like GPT-5 while offering credible open-weight alternatives that address regulatory scrutiny and community pressure. This dual strategy could prove effective, enabling the company to dominate both commercial and open-source markets. Conclusion Ultimately, the comparison between Grok 2.5 and GPT-OSS-20B and 120B is not merely technical but philosophical. xAI’s release demonstrates a willingness to participate in the open-source movement but stops short of true openness. OpenAI, on the other hand, has set a new standard for what open-weight releases should look like in 2025: efficient architectures, extensive documentation, clear licensing, strong benchmark performance and regulatory compliance. For European businesses and policymakers evaluating open-source AI options, GPT-OSS currently represents the more practical, compliant and capable choice. In conclusion, while both xAI and OpenAI contributed to the momentum of open-source AI in August 2025, the details reveal that not all openness is created equal. Grok 2.5 stands as an important symbolic release, but OpenAI’s GPT-OSS family sets the benchmark for practical usability, compliance with the EU AI Act, and genuine transparency.

Iran’s parliament speaker publicly demanded a Lebanon ceasefire and the release of frozen Iranian assets before weekend peace talks in Islamabad can begin.
The statement from Mohammad Bagher Ghalibaf arrived just hours before VP JD Vance departed for Pakistan-brokered negotiations, injecting fresh uncertainty into a fragile diplomatic window.
Bitcoin’s Ceasefire Rally Faces a Test
Bitcoin (BTC) surged 5% to $72,700 on April 7 after President Trump announced a two-week ceasefire with Iran via Truth Social.
The move triggered roughly $595 million in crypto futures liquidations, with short sellers absorbing the bulk of the losses.
As of this writing, BTC traded just shy of $73,000, riding the wave of ceasefire news and easing inflation fears that had weighed on risk assets for weeks.
However, a Bybit and Block Scholes derivatives report released April 10 found that sentiment remains cautious. Options markets show narrowing downside premiums without a decisive bullish flip.

Preconditions Put Talks at Risk
Ghalibaf, Speaker of the Parliament of Iran, stated that two “mutually agreed” conditions from the ceasefire framework remain unfulfilled.
Iran considers the Lebanon ceasefire and the release of assets non-negotiable before sitting down with the US delegation.
Trump simultaneously told the New York Post that US warships are being reloaded in case talks fail.
The White House told Fox News separately that the president remains “optimistic a deal can be reached.”
A CNN report also indicated Trump had a tense phone call with Israeli PM Benjamin Netanyahu shortly before Israel announced steps toward direct Lebanon ceasefire talks. Sources suggest Trump pressured Netanyahu to de-escalate, partly to satisfy Iran’s preconditions.
What This Means for BTC
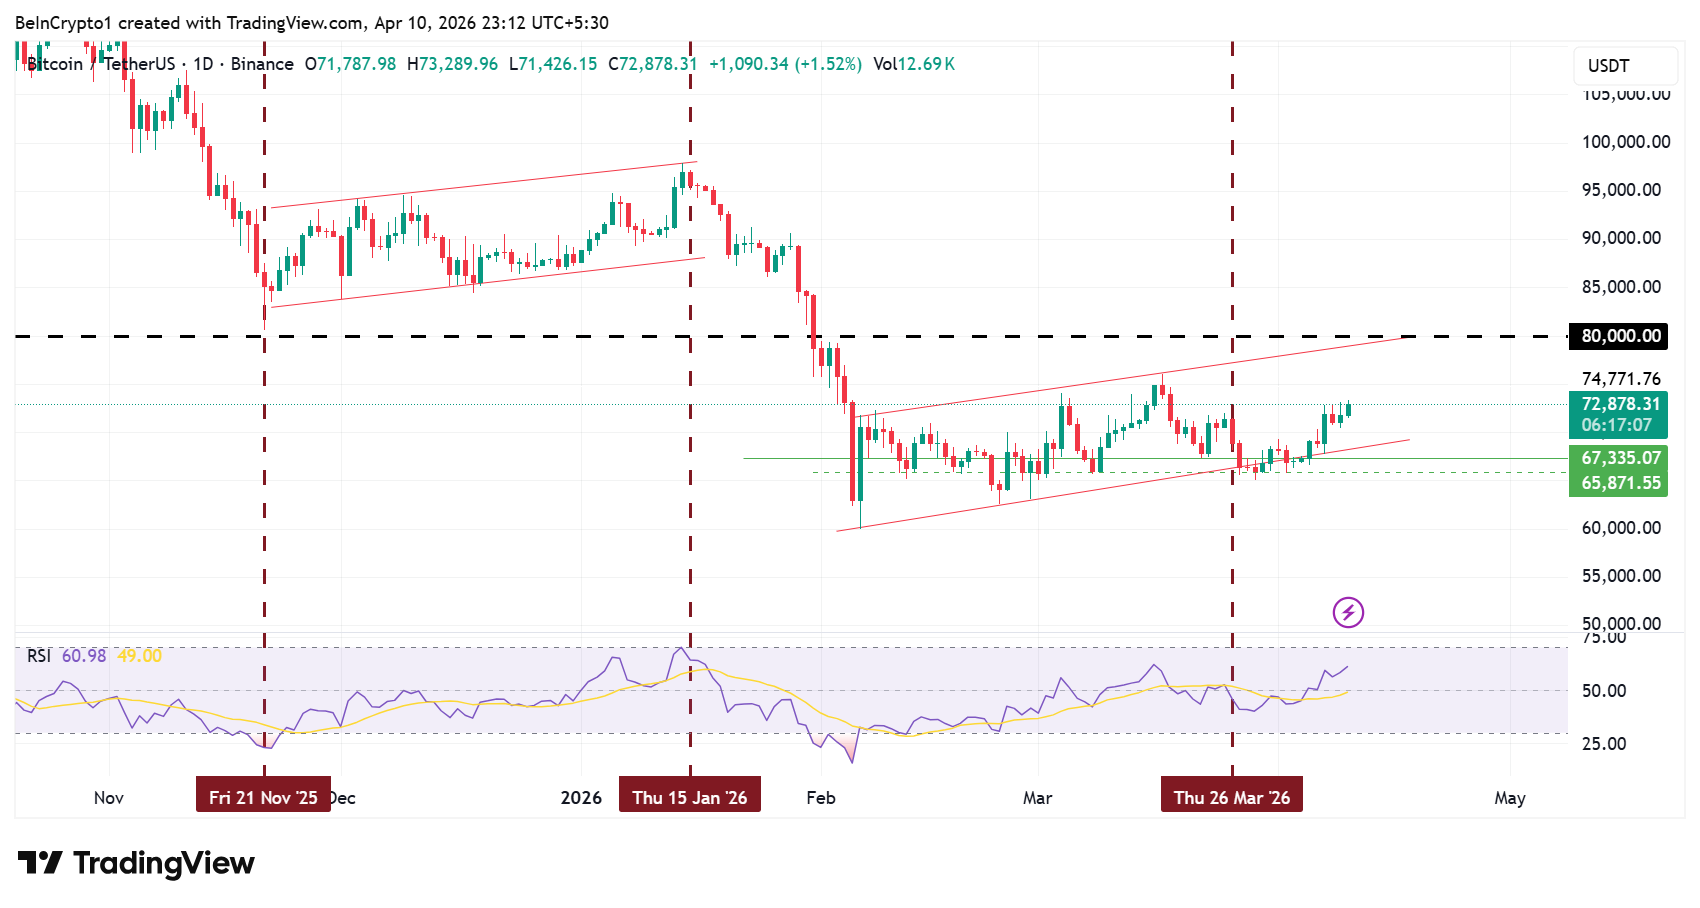
BTC now sits at the top of the $65,000 to $73,000 range that has contained trading since the conflict began in late February.
A successful outcome from Islamabad could push BTC toward $75,000 to $80,000 as geopolitical risk premiums unwind further.
However, a collapse of talks risks renewed Hormuz disruptions and a possible retest of $68,000 support.
The next 48 hours of diplomacy will likely determine whether this week’s relief rally holds or reverses.
“I think it’s gonna be positive. We’ll see. As POTUS said: if Iranians are willing to negotiate in good faith, we’re certainly willing to extend the open hand! If they try to PLAY us, they’ll find the negotiating team isn’t very receptive. We’re gonna try to have a positive negotiation. The president has given us some pretty clear guidelines,” US Vice President JD Vance stated.
The post Why This Weekend Could Break Bitcoin or Send It to $80,000 appeared first on BeInCrypto.


Hyperliquid’s HYPE token is trading around $40.3 on April 10, 2026, up roughly 3.9% in 24 hours and about 10% week‑on‑week after rebounding from early April lows near $35.6.
Summary
- HYPE trades around $40.3, up roughly 3.9% on the day and about 10% over the week, with spot volume near $250M against a circulating market cap around $9B.
- Hyperliquid controls an estimated 66–73% of decentralized perps flow, with ~$50B in weekly volume and $6–$10B in open interest, tying HYPE to real protocol usage.
- Only ~24.8% of HYPE’s 1B max supply is circulating; its fully diluted value clocks in near $35–$39B, implying significant future unlock pressure.
Hyperliquid’s (HYPE) 4-hour chart shows price grinding higher inside a constructive channel, with HYPE still roughly 32% below its all‑time high around $59.3 but supported by rising volume and a bullish, not yet overbought, momentum profile. On the fundamental side, Hyperliquid controls an estimated 66–73% of decentralized perps volume with about $50 billion in weekly trading and 100,000+ weekly active users, suggesting structural demand for HYPE as long as platform open interest near $6–$10 billion remains elevated.
Hyperliquid’s HYPE token is trading at about $40.3 on April 10, 2026, according to data from CryptoRank and other price trackers, up roughly 3.9% over the past 24 hours and extending a climb from early April lows near $35.6. The move leaves HYPE about 32% below its all‑time high of roughly $59.3 set in September 2025, but with a current market capitalization in the $9.6–$13.0 billion range and 24‑hour spot volume between $225 million and $285 million, signaling persistent two‑way flow rather than a thin meme spike.
On TradingView, the HYPEUSDT chart shows price holding a broad uptrend from the 2025 lows, with recent weekly candles printing higher lows above the $35–$36 zone and intraday action clustering in the $38–$41 band. Short‑term analyses on the platform highlight the $39–$40 area as a key demand zone, with some traders targeting initial upside toward $42–$44 if support holds. Momentum remains trend‑positive but not yet in the classic parabolic danger zone: technical dashboards flag RSI as bullish but shy of the 70+ overbought threshold on higher timeframes, while MACD and other trend indicators remain in buy territory.
Fundamentally, HYPE tracks a real business rather than pure narrative. CoinStats’ April investment analysis notes that Hyperliquid has become a dominant decentralized perpetuals venue, with an estimated 66–73% share of on‑chain perps trading, roughly $50 billion in weekly volume and more than 100,000 weekly active users. That positioning is reflected in derivatives data, where aggregated futures dashboards show Hyperliquid open interest frequently in the $6–$10 billion range, with peaks near $9.7 billion during prior volatility spikes — a scale that tends to correlate with demand for the protocol token.
At the token level, however, the growth story comes with a clear caveat. As of April 1, only about 24.8% of HYPE’s maximum 1 billion supply is circulating, with a circulating market cap near $8.7–$9.6 billion versus a fully diluted valuation around $35–$39 billion, implying roughly 4x potential dilution as remaining tokens unlock. That gap matters for medium‑term price predictions: as long as Hyperliquid’s share of perps volume and on‑platform open interest keeps growing, structural demand may offset some unlock pressure, but slower activity or venue competition could see new supply weigh more heavily on price.
Near term, the technical and fundamental mix leans slightly bullish. The token is riding a constructive trend above key support in the high‑$30s, momentum is positive rather than euphoric, and platform usage metrics remain strong. A clean break below the $35–$36 area on rising volume would undermine that thesis and open room for a deeper mean‑reversion toward prior consolidation levels, while sustained closes above the low‑$40s, backed by continued growth in open interest and weekly volume, would keep $50+ back on the table as a medium‑term target.


The Ethereum Layer 2 network raised its L1 data cost scalars 1,280x over six days before rolling them back yesterday.
Users on Scroll, an Ethereum Layer 2 (L2) network, paid more than $50,000 in excess transaction fees over roughly four days after the team behind the project repeatedly raised the parameters that determine how much users pay for posting data to Ethereum, according to an analysis published by L2BEAT.
The overcharges stemmed from six manual increases to two fee multipliers on Scroll’s gas price oracle, the smart contract that calculates the Layer 1 data portion of every transaction’s cost. Each update raised the previous value by 2x to 10x, compounding to 1,280x the original baseline by April 5, L2BEAT said. On April 9, the team slashed both multipliers by 160x.
The baseline cost for all roughly 139,000 affected transactions would have been just $280. Instead, users collectively paid upward of $50,000, with automated bots accounting for the vast majority.
Scroll has not publicly addressed the findings at the time of writing.
Etherfi Cash bots, which are still running during the protocol’s ongoing migration to Optimism, accounted for roughly $35,000, or 66% of the excess, per L2BEAT. Scroll’s own oracle relayer paid approximately $5,200, with LayerZero, Succinct, and other bots making up the rest.
The issue was first flagged by a pseudonymous developer running a Succinct relayer, who posted on X that their transaction costs had jumped from $0.002 to over $20.
“Scroll was subsidizing L1 DA costs and is now correcting to sustainable pricing?” the developer asked. “And there’s no users on Scroll except us, so we’re paying full price for it?”
Crypto research firm Kairos Research noted that the fee spike appeared to coincide with etherfi’s migration to Optimism. When etherfi was Scroll’s dominant app, total daily transaction fees from its products averaged about $250. After the multiplier increases began on March 31, that figure jumped to roughly $16,000 per day.
L2BEAT clarified that the overcharges were not a sequencer issue, as the L1 gas prices reported by the oracle were accurate. The entire overcharge came from the multiplier increases, which went through a separate governance path involving the team’s multisig wallet.
The episode raises the question of whether Scroll had been running fees below cost to retain users, a common practice among L2s competing for activity, and abruptly repriced once its largest fee contributor departed.
Scroll’s total value locked (TVL) sits at just $24 million, according to DeFiLlama, down 96% from its peak of $585 millon in October 2024.
This article was written with the assistance of AI workflows. All our stories are curated, edited and fact-checked by a human.

Overview
Hong Kong approved its first stablecoin licences, marking a key step in regulated digital finance development. Authorities selected bank-backed issuers to lead the rollout under strict oversight. The move strengthens the city’s position in global digital asset markets.
HSBC Leads Retail-Focused Stablecoin Rollout
HSBC plans to launch a Hong Kong dollar-pegged stablecoin in the second half of 2026. The token will support payments, transfers, and digital asset services through its mobile platforms. The bank aims to integrate stablecoins into existing retail and merchant ecosystems.
HSBC will enable peer-to-peer transfers and merchant payments using its PayMe and banking applications. The system will also support subscriptions to tokenized investment products within its digital infrastructure. This approach connects traditional banking services with blockchain-based financial tools.
HSBC is exploring stablecoins in other currencies to support cross-border transactions. However, the bank requires alignment with central banks before expanding beyond Hong Kong dollar issuance. This strategy reflects a measured approach to global digital currency integration.
Anchorpoint Targets Institutional and Phased Expansion
Standard Chartered supports Anchorpoint Financial, a joint venture focused on digital asset infrastructure. The entity includes Animoca Brands and Hong Kong Telecommunications as key partners.
Anchorpoint plans to launch its stablecoin earlier, targeting institutional clients in the initial phase. The firm will later expand access to retail users through selected distributors and partners. This phased rollout allows controlled adoption while building operational experience in regulated markets. The structure also aligns with Hong Kong’s broader financial stability goals.
Anchorpoint focuses on enabling real-world applications such as payments, custody, and trading services. The initiative supports infrastructure development for compliant digital finance operations. It also strengthens collaboration between traditional finance and blockchain firms.
Regulatory Framework Shapes Controlled Market Entry
Hong Kong Monetary Authority introduced the stablecoin regime in August 2025. The framework requires full reserve backing, clear redemption rights, and strict governance standards. Authorities also enforce anti-money laundering measures across all licensed issuers.
The regulator reviewed 36 applications before selecting the first two licence holders. Officials prioritized strong risk management, compliance capacity, and viable business models. This selective approach ensures stability while allowing innovation within defined limits.
Officials confirmed that only a small number of additional licences may follow. The authority maintains flexibility but intends to limit market entry in early stages. This policy balances innovation with financial system integrity.
Hong Kong aims to position itself as a global hub for regulated digital assets. Stablecoins play a central role in improving payment efficiency and supporting tokenized finance. The first approvals mark the beginning of a structured expansion in the sector.
Crypto World
XRP Price Prediction Today: Ripple Launches Treasury Tool as Token Breaks $1.35, Should You Enter Pepeto First?
XRP price holders who watched the token run from $0.30 to $3.65 without getting in now face a market offering a similar setup. Ripple launched its first native Digital Asset Treasury Management System on April 8, letting businesses manage XRP and fiat in one regulated platform, per CoinMarketCap. XRP ETFs pulled in $3.3 million the same day while Bitcoin and Ether ETFs bled over $220 million combined, according to 24/7 Wall St.
Pepeto is nearing its Binance listing with presale rounds selling out faster than ever, and $8.86 million committed during a Fear Index of 14 shows informed capital is locking positions before listing day.
Ripple’s Treasury System Goes Live as XRP ETFs Buck the Outflow Trend
Ripple’s Treasury Management System went live on April 8, giving companies a single platform to hold XRP and fiat without separate custody, per CoinMarketCap. The tool puts XRP directly into corporate finance workflows for the first time.
XRP ETFs took in $3.3 million on a day when every other major crypto ETF posted losses, according to 24/7 Wall St. The CLARITY Act markup is expected late April, and if it passes, XRP gets a permanent commodity tag that could open billions in fresh ETF demand.
The XRP Price Prediction Entry Worth Watching Right Now
Pepeto: The Trading Platform the Market Needs While XRP Grinds Sideways
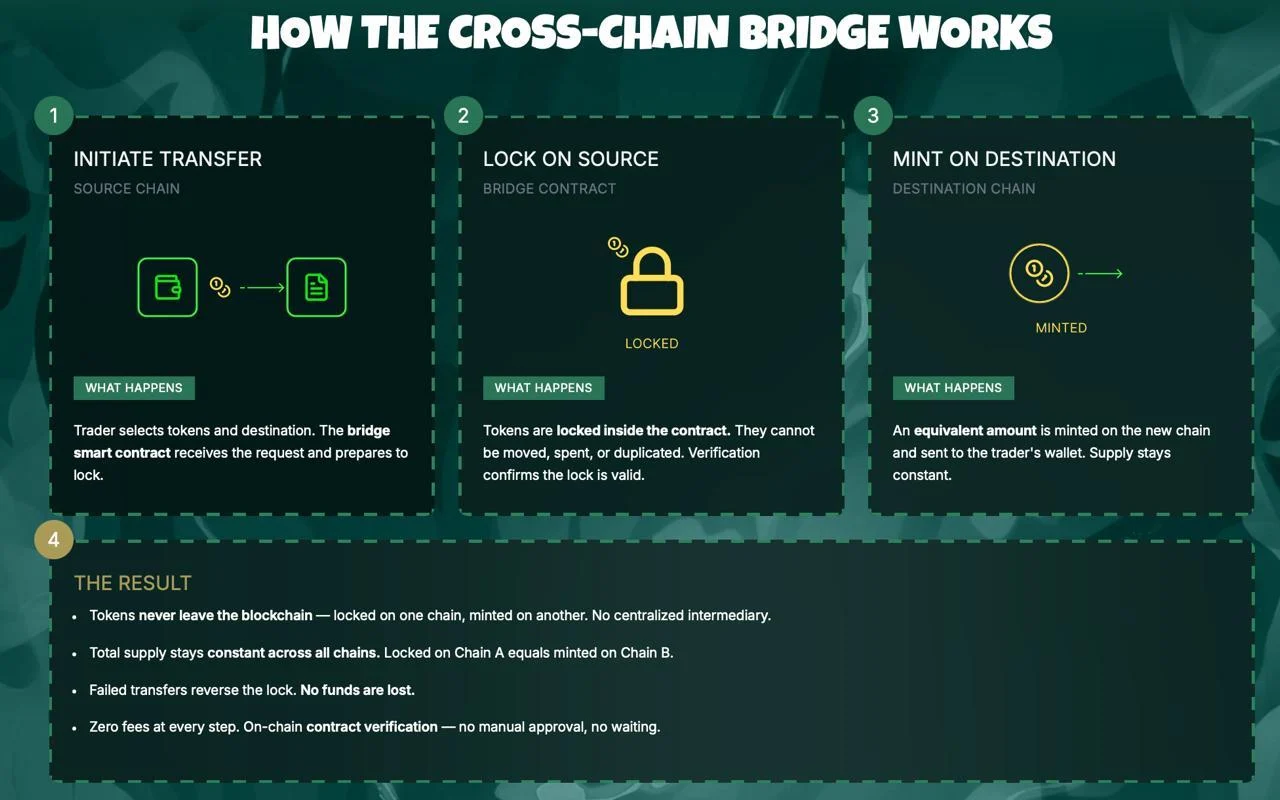
The Binance listing keeps getting closer and presale stages fill faster each round. Pepeto is a contract scanning and zero-fee trading platform that grows more useful when the market turns risky and the XRP price stays range-bound.
While XRP holders wait for the CLARITY Act, Pepeto scans tokens across Ethereum, BNB Chain, and Solana, spotting risky contracts before they touch a wallet. PepetoSwap handles swaps at zero cost so entry size equals position size, and capital works right away instead of sitting inside a $83 billion market cap waiting for billions more.
The presale pulled $8.86 million at $0.0000001863 while the Fear Index reads 14. The FDV at $78 million is small enough that analysts call for 100x because the token powers every trade. SolidProof cleared the codebase, a senior developer from Binance shaped the exchange, and the founder who took Pepe to $11 billion built every tool from scratch. Staking at 186% APY keeps building holdings while listing draws closer.
Crypto history has one constant: early entries made during peak fear with real products running became the breakout stories of each cycle. Pepeto at $0.0000001863 with $8.86 million during a Fear Index of 14 fits that pattern. Once the Binance listing opens, presale pricing ends.
XRP Price Prediction: Can XRP Hold $1.35 and Rally Back to $2?
XRP trades at $1.35 on April 10, down 62% from its $3.65 July 2025 peak, per CoinMarketCap. The XRP price prediction depends on holding $1.35 and clearing $1.42 to open $1.50 then $2.00. Analysts say XRP needs the ceasefire to hold, the CLARITY Act to advance, and the Fed to signal cuts before $2 is in play.
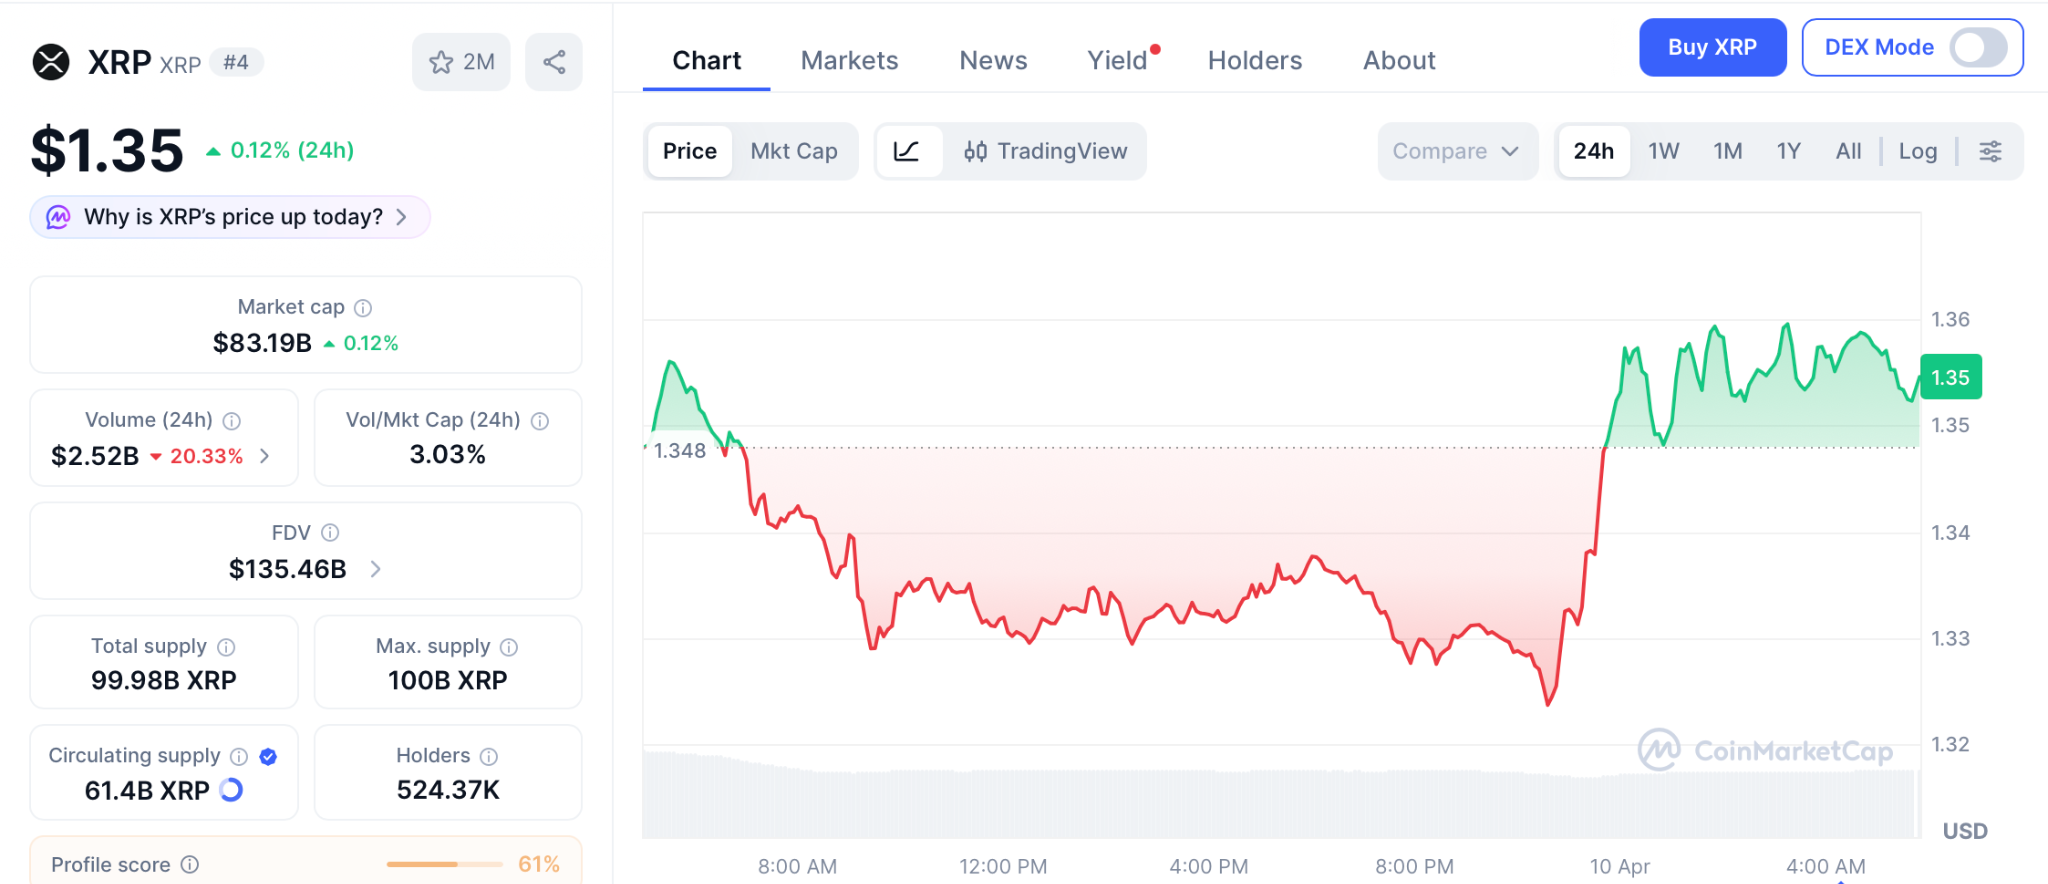
Support sits at $1.28 with resistance at $1.42 then $1.50. The XRP price math from a $83 billion cap means strong targets take months, not the fast timeline a presale-to-listing event offers.
Conclusion
The XRP price prediction confirms XRP needs quarters of macro help before it reaches numbers that matter. The wallets that bought XRP at $0.003 gained 1,000x over years. Those who got into SHIB with no product gained 1,000x in months.
Pepeto combines a live exchange, the same founder who took Pepe to $11 billion, and a confirmed Binance listing. The Pepeto official website still accepts presale entries, and the wallets that caught XRP at $0.003 did not wait for proof, they studied the setup and acted while the crowd held back.
Click To Visit Pepeto Website To Enter The Presale

FAQs
Can XRP price reach $2 in April 2026 based on current market conditions and the CLARITY Act?
XRP needs the Trump-Iran ceasefire to hold, the CLARITY Act to clear the Senate Banking Committee in late April, and the Fed to signal cuts at the April 28 FOMC before $2 comes into play. Without all three, analysts at 24/7 Wall St project XRP stays between $1.28 and $1.60. XRP ETFs took in $3.3 million on April 8 while Bitcoin and Ether ETFs posted losses, showing selective demand even during broad market fear.
What is the best crypto to buy now in 2026 for high returns before the next bull run based on real utility?
Pepeto is the best crypto to buy now because it has a SolidProof-audited contract, a live zero-fee exchange with a token scanner, and a cross-chain bridge across Ethereum, BNB Chain, and Solana. The team includes the original Pepe coin architect and a senior Binance developer. With $8.86 million raised at $0.0000001863, 186% APY staking, and a confirmed Binance listing, the entry combines working tools with presale pricing.
Disclaimer: This is a Press Release provided by a third party who is responsible for the content. Please conduct your own research before taking any action based on the content.

Bitcoin is emerging as a potential component in the fragile ceasefire that is taking shape between the United States and Iran after a 39-day conflict disrupted the region and forced the closure of the Strait of Hormuz.
Tehran is unlikely to relinquish its grip on the narrow trade artery that handles roughly 20% of global crude oil flows. Instead, it plans to manage transit alongside Oman, collecting tolls from vessels seeking safe passage.
And that’s where Bitcoin (BTC) comes into play. Those payments may not be limited to traditional currencies. Hamid Hosseini, a spokesperson for Iran’s Oil, Gas and Petrochemical Products Exporters’ Union, told the Financial Times that certain ships could be required to pay in BTC for safe passage of their oil cargo.
“Once the email arrives and Iran completes its assessment, vessels are given a few seconds to pay in Bitcoin, ensuring they can’t be traced or confiscated due to sanctions,” said Hosseini.
If implemented, the move would mark a notable shift for Iran, which has previously said it would only accept the Chinese yuan as toll payment for the strait.
This week’s Crypto Biz looks at Iran’s reported crypto gambit, Jamie Dimon’s latest comments on blockchain and competition and the White House’s stance on stablecoin yields.
Iran seeks crypto tolls from ships crossing Strait of Hormuz
Ships moving through the Strait of Hormuz are increasingly being asked to pay transit fees in cryptocurrency, as Iran tightens control over one of the world’s most important shipping lanes, according to the Financial Times.
Reports indicate that vessels, particularly oil tankers, are being charged fees that can reach into the millions per trip, with payments made in crypto or alternative currencies. The system is being enforced by Iran’s Revolutionary Guard Corps, which has restricted access to the waterway and allowed only approved ships to pass.
The development comes amid ongoing conflict and a fragile ceasefire, with Iran using its position over the strait as leverage. With roughly a fifth of global oil flows moving through the route, the use of crypto payments underscores both the geopolitical stakes and how digital assets are being used to bypass traditional financial channels.
Jamie Dimon warns blockchain and AI are coming for banking
JPMorgan CEO Jamie Dimon warned that a new wave of technology-driven competitors is putting pressure on traditional banking, highlighting both artificial intelligence and emerging financial infrastructure.
In his annual shareholder letter, Dimon pointed to fintech companies and nonbank players adopting blockchain and other technologies to build faster, lower-cost systems. He also hinted that stablecoins should be viewed as part of the broader shift underway in financial services.
America’s biggest bank, as measured by assets, is already investing heavily in its own blockchain infrastructure, including its Kinexys platform, as it looks to compete in areas such as payments and tokenization where new entrants are gaining ground on traditional players.

Bernstein says Figure stock could double on tokenization growth
Analysts at Bernstein say Figure Technologies’ rapid loan growth highlights the potential of blockchain-based lending, suggesting the company’s stock is significantly undervalued at current levels.
In a recent note, Bernstein said Figure surpassed $1 billion in monthly originations, signaling growing traction. It assigned the stock an “Outperform” rating and a $67 price target, roughly double current levels.
Figure’s lending platform runs on the Provenance blockchain, which is designed to reduce costs and speed up loan processing. Bernstein analysts said this structure could improve margins compared to traditional lenders, particularly as volumes increase.

Stablecoin yield ban would lift bank lending just 0.02%, White House says
Economists at the White House said restricting yield-bearing stablecoins would have a negligible impact on bank lending, challenging claims that such products pose a meaningful threat to deposits.
According to analysis by the Council of Economic Advisers, a ban on stablecoin yields is estimated to increase bank lending by just 0.02%, suggesting only limited spillover into the traditional financial system. The analysis comes as yield-bearing stablecoins remain a key sticking point in market structure legislation talks.
The report also pointed to potential downsides. Limiting yields could reduce consumer benefits by cutting off access to higher returns, highlighting a trade-off for policymakers weighing tighter regulation of the sector.
Crypto Biz is your weekly pulse on the business behind blockchain and crypto, delivered directly to your inbox every Thursday.
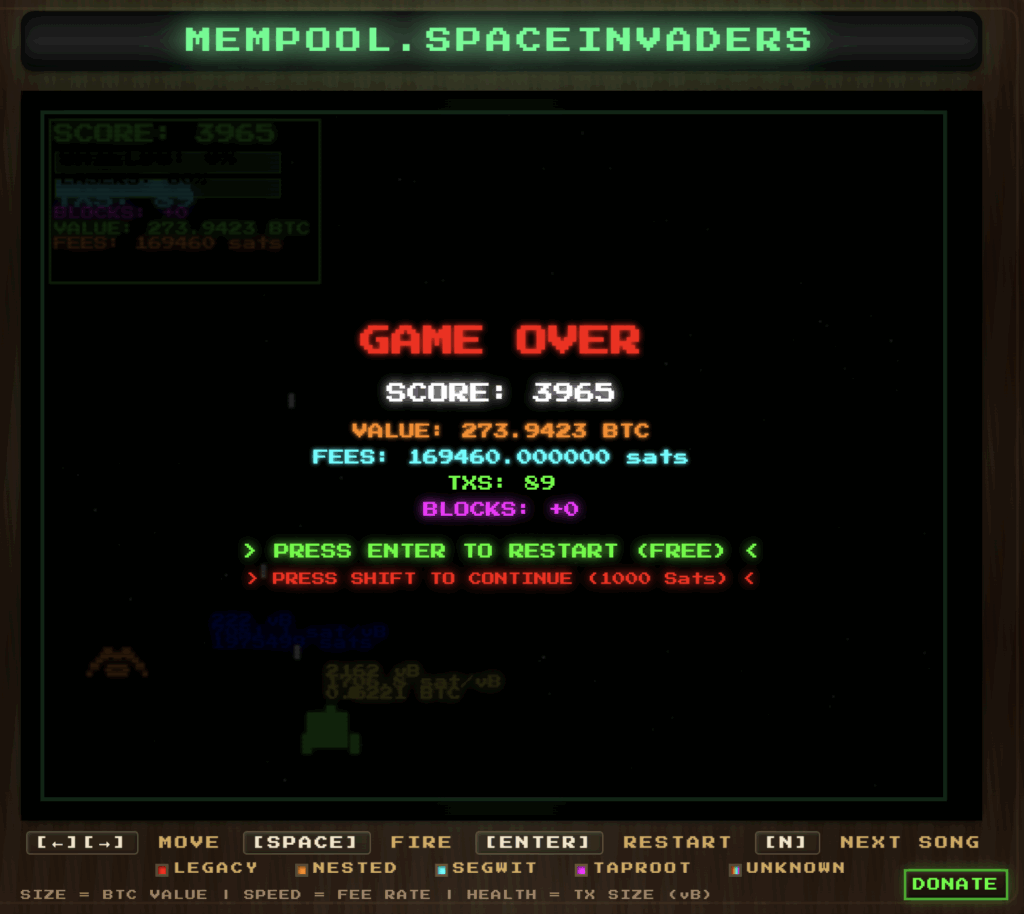
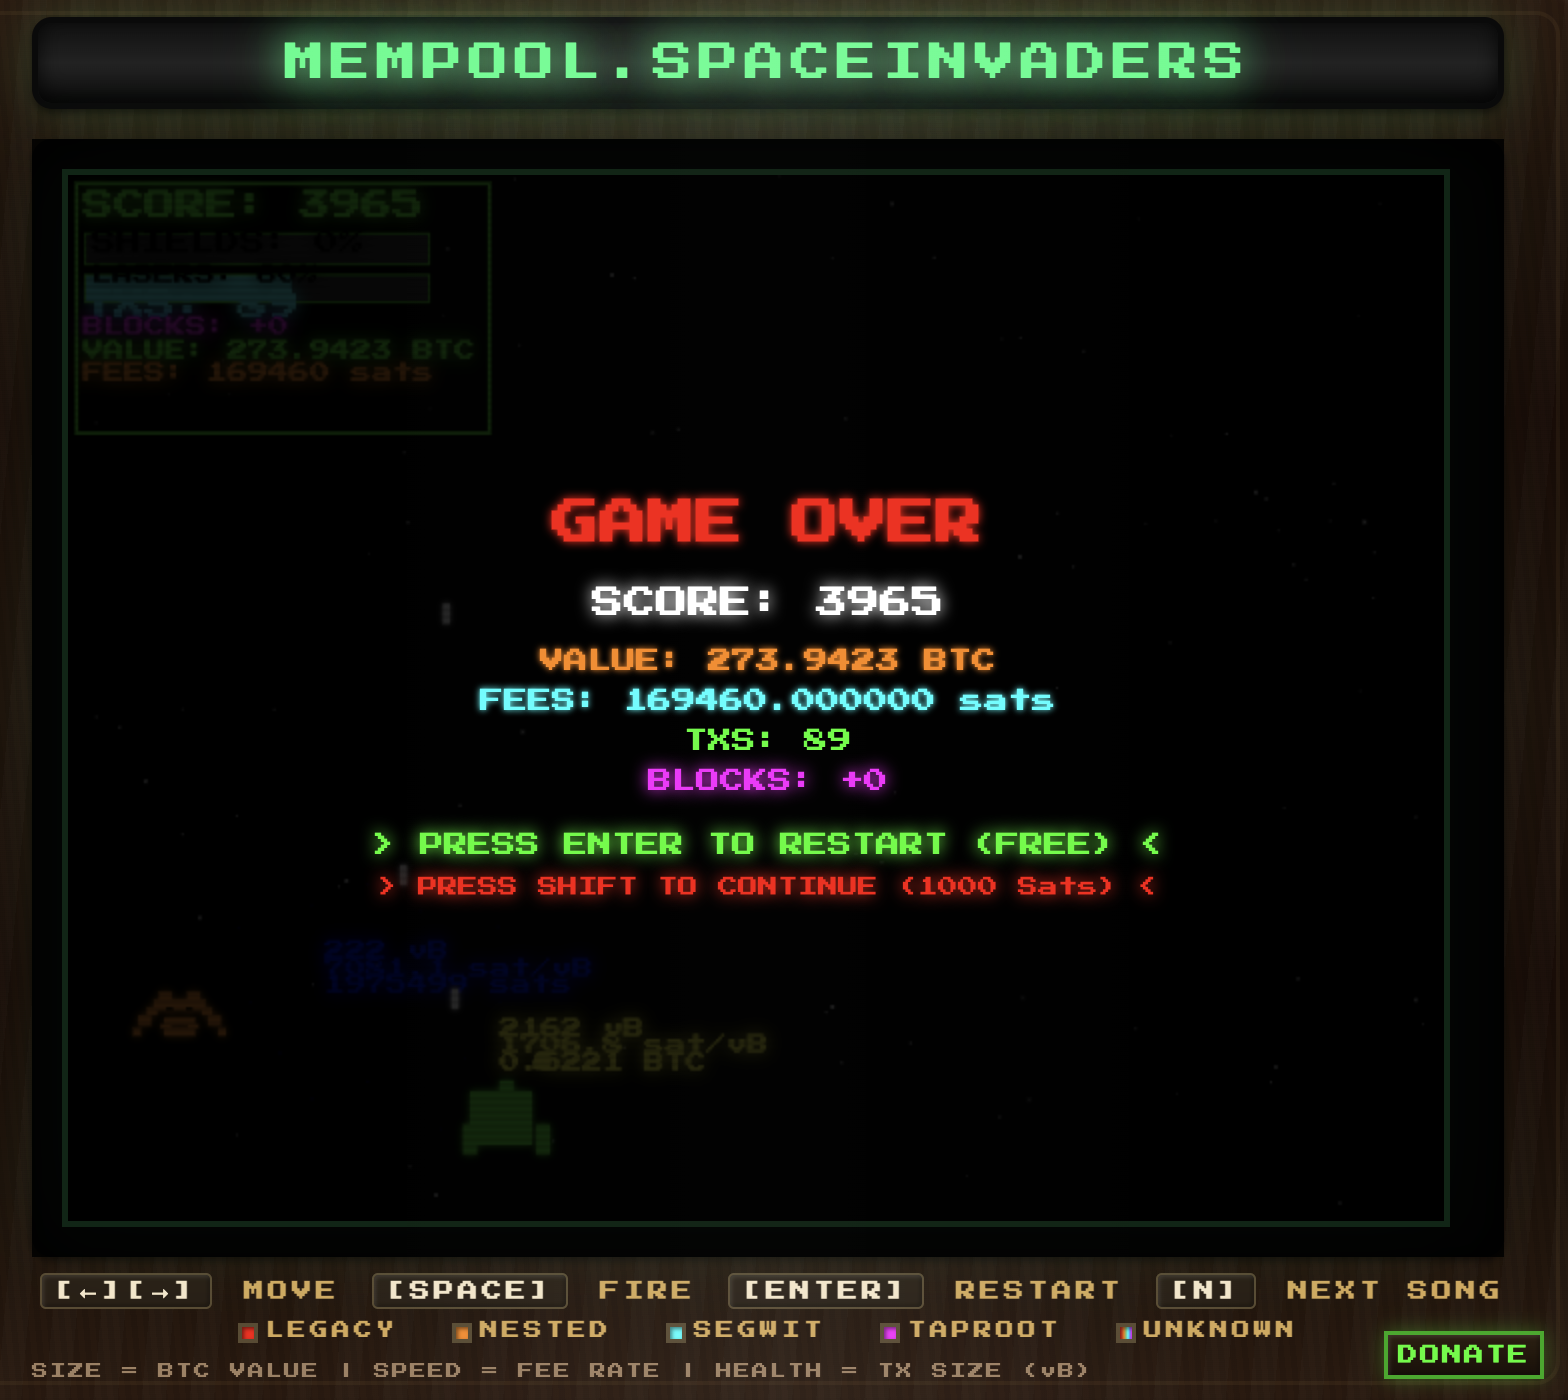
A quirky bitcoin (BTC)-themed Space Invaders clone is promising a bounty of 10,000 Satoshis (SATs), worth $7, to whoever can score 10,000 points. The only catch is that it might take you over an hour — unless you’re willing to move $726 million in BTC.
The game, called Mempool Space Invaders, was released by Stacker News user @jasonb this week. Like Space Invaders, you play as a ship moving left to right shooting “invaders” before they reach the bottom of the screen.
In this version, each surviving invader chips off a percentage of your shield until you’re dead. As for the crypto element, each invader represents a transaction on the blockchain’s mempoool that tallies towards your points.
The larger the invader, the more BTC you’ll score. To get the game’s bounty, you need to score 10,000 BTC. The game also tracks the number of SATs each transaction costs.
After recording one session where Protos scored 273 BTC in 94 seconds, we worked out that, at the same rate, it would take just under an hour of gameplay to reach 10,000 BTC.
Read more: NFT game studio boss says not paying staff ‘works for company cash flow’
That said, scores are based on the real-time BTC mempool, so if lots of wealthy transactions take place while you’re playing, it will likely decrease the time needed to rack up 10,000 BTC.
Lend me $726M so I can make $7 playing BTC Space Invaders
The game’s author recognized that this can be gamed to the player’s advantage, and notes that you can score 10,000 BTC easily if you just send 10,000 BTC, worth a whopping $726 million, to yourself and wait for it to appear in the mempool space.
“Then blast it out of the water — er — space. Just make sure not to spend too much in fees or you’ll eat up all your winnings,” its creator noted. A lot of work for $7.
Bitcoin’s mempool is the collection of pending and unconfirmed BTC transactions that are stored within nodes.
The game also gives players an option to pay 1,000 SATs per death to keep going. If Protos died every 94 seconds, we’d have to pay roughly $27 to reach the bounty score.
As the creator says, this is “not a wise strategy as the continue button is more expensive than a normal lightning game.”
He added that he would like verifiable screenshots of the score to award points, and that if anyone is willing to go through the effort to doctor their screenshot for $7 worth of SATs, “you definitely deserve them.”
Got a tip? Send us an email securely via Protos Leaks. For more informed news and investigations, follow us on X, Bluesky, and Google News, or subscribe to our YouTube channel.

Mythos Model Flags Risk of Security
The focus is on the Mythos model by the company Anthropic that allegedly detects and uses vulnerabilities in operating systems and web platforms. Moreover, the company recognised that the model is able to simulate attacks when provoked under controlled conditions. As such, authorities consider such capabilities as a possible threat when abused by ill-minded individuals. This has enhanced scrutiny in the financial and regulatory areas. Anthropic enjoys limited access to Mythos and is growing defensive applications with Project Glasswing. Large companies like Amazon, Apple, and JPMorgan Chase are part of the initiative. Additionally, such organisations as Google, NVIDIA and the Linux Foundation became involved. Offering to enhance software security through AI-based vulnerability detection, these groups are pursuing this goal.
The company invested a lot of resources in promoting the initiative and deepening the defensive scope. Anthropic provided up to 100 million usage credits and 4 million in direct funding. Moreover, over 40 organisations that control critical infrastructure were able to access the system. This joint effort aims at discovering and resolving the high-severity defects in popular software. Anthropic remains interesting with changes in legal and regulatory developments. The Trump administration tried to take measures against the company in its classification but was stopped by a federal court in San Francisco. Judge Rita Lin ordered that the designation was not substantially statutory-based. Therefore, this ruling was a short-lived reprieve since AI companies remain under the microscope.
The company has recorded robust financial growth, and its annual recurring revenues have increased sharply over the past few months. This has increased interest both in technology and finance. In addition, analysts are still evaluating the overall effect on rival companies, such as Palantir Technologies. The players within the market are keeping track of the way AI implementation influences the competition in the industry. The most recent innovations at Anthropic have brought about an increased interest in AI security, regulatory requirements and market consequences. These have remained influential in the policy debates and financial preparedness.

Coinbase CEO Brian Armstrong has shifted his stance on a key crypto regulatory bill, saying it’s now the moment for Congress to act. After months of negotiations and a previous pause, Armstrong endorsed the Digital Asset Market Clarity Act (CLARITY Act) and praised the current draft as a strong baseline for passable legislation. The move comes as lawmakers press ahead through committee processes, with both sides of the aisle weighing how a structured framework could shape the crypto market in the United States.
Armstrong disclosed his updated view in a Thursday post on X, aligning with remarks from US Treasury Secretary Scott Bessent in a Wall Street Journal op-ed urging Congress to act promptly. In his message, Armstrong described the legislation as a “strong bill” and argued that it’s now time for Congress to move forward. The endorsement marks a notable reversal from January, when Coinbase said it could not back the act as written, contributing to a temporary stall in the legislative process as committees prepared a markup for CLARITY.
Key takeaways
- Armstrong publicly backs CLARITY Act again, calling for a timely passage after months of negotiations shaped by safety, ethics, and market-structure concerns.
- The bill’s path remains tied to committee activity: a Senate Banking Committee markup is anticipated after the Senate Agriculture Committee’s January approval, with both committees needing to align securities and commodities provisions before a full chamber vote.
- Regulatory momentum is visible in parallel moves, including the Office of the Comptroller of the Currency’s approval of Coinbase’s national bank trust charter, which signals growing regulatory engagement with crypto players.
- The industry’s influence in Washington continues to be debated, though executives from Coinbase and Ripple Labs have participated in talks with administration officials about CLARITY and broader market structure questions.
Armstrong’s recalibration: from pause to endorsement
The timing of Armstrong’s endorsement reflects a broader recalibration within the crypto industry’s Washington engagement. In January, Coinbase publicly stated it could not support CLARITY as written, a stance that contributed to a pause in a Senate Banking Committee markup that would have advanced the bill toward floor consideration. Since then, talks among lawmakers and industry participants have continued, with Armstrong asserting that the latest iteration of CLARITY addresses core concerns raised during negotiations.
Armstrong captured the shift in a succinct update, stating on X that the current form of the CLARITY Act is a “strong bill” and that it’s “time to pass the Clarity Act.” The post echoed comments attributed to the same topic by Scott Bessent in the WSJ op-ed, who urged swift congressional action as a matter of clarity and regulatory coherence for the crypto markets. For readers tracking the arc of the bill, the developer-friendly alterations and the way ethics, tokenized equities, and stablecoin yield provisions were addressed are central to understanding why Coinbase and other industry players have shifting views on the legislation’s current contours. For reference, Coinbase previously noted that progress depended on a broader agreement in Congress and among supervisory agencies, with the initial markup delayed as those conversations continued.
Coinbase’s legal head, Paul Grewal, suggested last week that lawmakers were “very close to a deal,” underscoring a sense that convergence across committees—and with the crypto sector—was near. Still, the exact timing of a mark-up remains uncertain, as the banking committee would schedule consideration only after the Agriculture Committee’s earlier action, and after aligning on a regulatory framework that reconciles token classifications with securities and commodities oversight.
Legislative hurdles: where the bill stands and what comes next
The legislative path for CLARITY Act is intricate, reflecting the overlap between securities and commodities frameworks in U.S. regulation. The latest cadence places the banking committee mark-up after a January approval from the Senate Agriculture Committee, with both panels expected to harmonize the finer points of the bill before lawmakers return to the Senate floor. The process underscores a centralized aim: to provide a clear, predictable regulatory framework that can accommodate a spectrum of crypto activities—ranging from exchanges and token issuances to custody and compliance obligations for crypto-native institutions.
From Coinbase’s perspective, the process has required careful alignment with both the executive branch and Congress. Armstrong’s renewed stance appears to be grounded in the belief that the current version adequately balances innovation with investor protection and market integrity. The operational implications are notable: a clearer framework can reduce regulatory uncertainty for exchanges and developers, potentially accelerating product launches, partnerships, and new use cases for digital assets. Investors and builders alike will be watching whether the final iteration resolves long-standing concerns about ethics, tokenized equities, and the governance and disclosure expectations that typically accompany traded assets.
In parallel, industry voices have continued to press for clarity and predictability. Coinbase’s legal leadership has framed the ongoing talks as a sign that policymakers are close to a workable compromise, while industry participants have highlighted the importance of a comprehensive school of thought that integrates the realities of digital asset markets with established financial-market norms. The evolving dialogue in Washington illustrates a broader theme: as technology accelerates, lawmakers are increasingly pressed to deliver rules that foster both innovation and consumer protection without stifling competition.
Regulatory momentum and industry influence: a broader context
Beyond CLARITY Act’s fate, a broader regulatory arc has emerged that shapes industry strategy in the near term. Earlier this year, the Office of the Comptroller of the Currency granted Coinbase a national bank trust charter, following a series of similar approvals for other crypto and financial-services entities. The approvals signal that regulators are willing to grant more robust, federally recognized structures to crypto firms, potentially enabling more sophisticated product offerings under federal oversight. The approvals build a backdrop against which CLARITY Act could accelerate or adjust, depending on how a unified regulatory framework emerges across agencies.
The Washington conversation around crypto is not happening in a vacuum. Executives from Coinbase and Ripple Labs have participated in discussions with administration officials about the proposed framework, reflecting a broader trend of strategic engagement from the industry. The dynamics of these discussions are nuanced: while some policymakers emphasize the need for robust safeguards, others push for a framework that doesn’t hamper innovation or push firms toward burdensome, one-size-fits-all rules. The resulting tension—between comprehensive regulation and market growth—will shape the clarity and predictability investors rely on as crypto markets mature.
As the debate continues, observers are watching whether CLARITY’s final form will offer definitive classifications for tokens, more precise rules for exchanges, and a clear path for stablecoins and custody services. The current trajectory suggests a scenario in which Congress could deliver a coherent set of rules that reduces ambiguity for U.S. participants, while also inviting international competition to respond to a more predictable U.S. framework. For practitioners, that could translate into a more navigable landscape for product development, fundraising, and regulatory compliance—crucial considerations as institutions, startups, and developers build the next phase of the crypto economy.
What remains uncertain is the exact timetable and the precise language that will reach a floor vote. While Armstrong’s renewed endorsement adds momentum, the bill still faces a complex negotiation across committees, potential amendments, and the broader political calendar. Investors should monitor the timing of the banking committee markup and any additional clarifications on how CLARITY addresses the balance between market structure, consumer protections, and innovation incentives. The path forward will likely shape how quickly institutions can deploy regulated crypto products in the United States and how competitors abroad respond to a more defined U.S. framework.
Readers should stay attentive to updates on committee schedules and any new endorsements from other major industry players, as these signals often influence the market’s expectations about regulatory clarity and product timelines. The coming weeks will be telling for whether CLARITY Act can translate into a formal legislative milestone or whether unresolved questions will extend the negotiation phase into a longer horizon.
As the process unfolds, the industry’s practical takeaway is straightforward: clarity tends to reduce risk, but only when the rules are stable and comprehensive. The next few weeks will reveal how close CLARITY is to becoming law and how the balance between oversight and innovation will be achieved in the final text.

Autonomous AI agents have registered roughly 90,000 on-chain identities since January 2025, and the ETH they burn through every micro-transaction is not coming back.
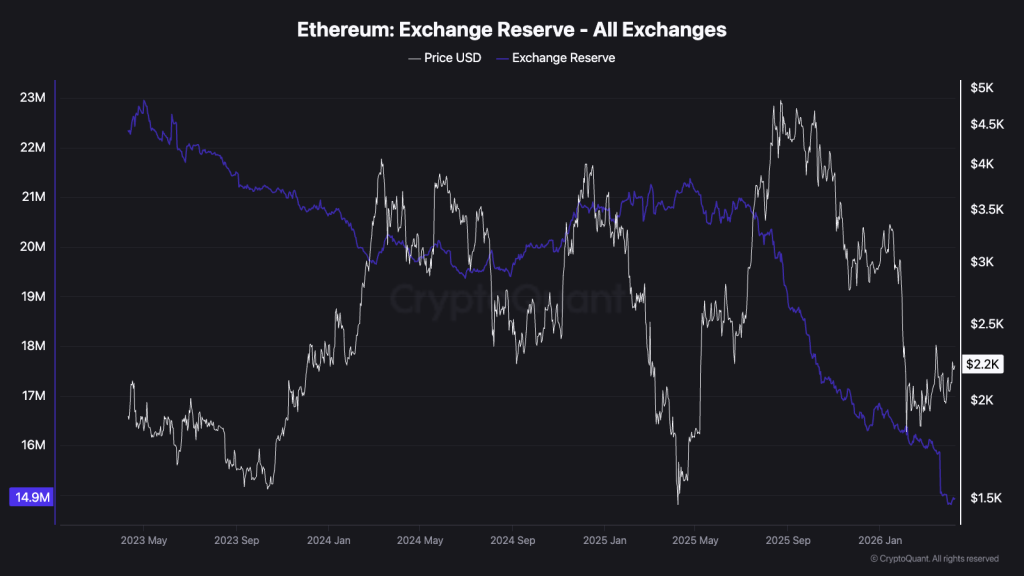
Exchange reserves have collapsed to 16.2 million ETH – the lowest level since 2016 – while over 37 million ETH sits locked in staking contracts.
The EIP-1559 burn mechanism was designed for humans transacting at human speed. AI agents don’t sleep, don’t hesitate, and don’t wait for gas to drop on a Sunday morning.
The question is no longer whether AI activity is compressing ETH supply. The question is whether the compression is structural enough to constitute a genuine ETH supply shock – one that reprices the asset rather than just tightens a few metrics.
Discover: AI price predictions for Ethereum, Bitcoin, and XRP through end of 2026
How AI Agents Are Burning ETH Faster Than the Market Expects
Under EIP-1559, base fees are destroyed rather than paid to validators. That mechanic was calibrated around human-driven transaction demand – periodic spikes during NFT mints, DeFi yield chases, and token launches.
AI agents introduce a fundamentally different demand profile: continuous, high-frequency, and immune to price fatigue.
Projects built on frameworks like Etherealize, alongside autonomous trading systems powered by ASI ($FET) and RENDER, now dominate DEX activity during low-liquidity windows – particularly weekends – where their algorithmic execution faces minimal human competition.
Each interaction triggers a base fee burn. At scale, the aggregate effect on net ETH issuance is material.
Glassnode on-chain data confirms ETH’s annualized net issuance is currently running at approximately -0.5%, meaning burns are outpacing new validator rewards.
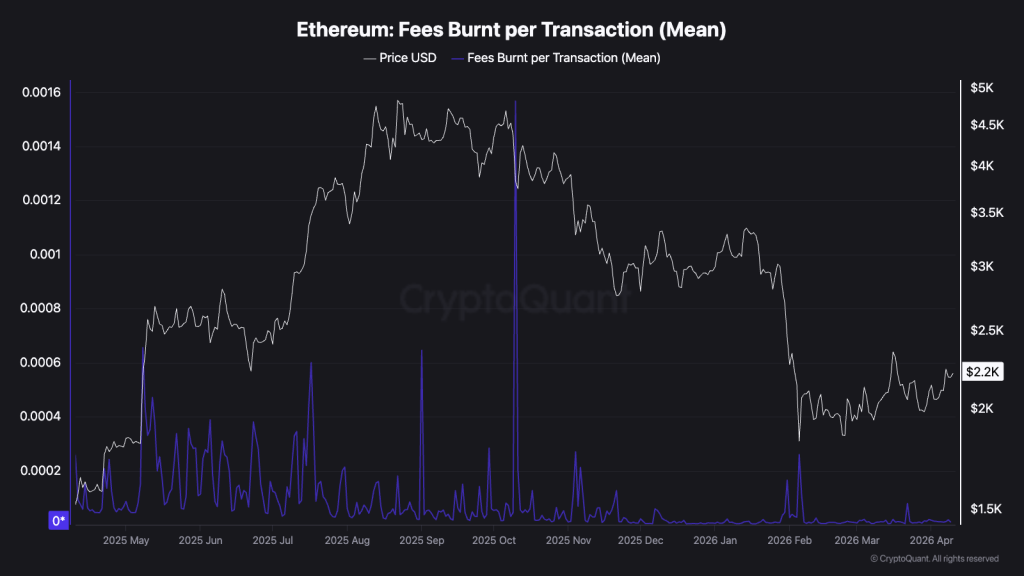
That deflationary state has now persisted across a 12-month high in burn rates, according to CryptoQuant metrics tracking exchange-level reserve depletion alongside network-wide fee destruction. The Etherealize-driven agent economy is not a speculative catalyst – it is already showing up in the supply figures.
What makes AI agent burn different from prior DeFi demand spikes is durability. A yield farming craze burns ETH for weeks; a machine economy running autonomous wallets on deflationary crypto rails burns ETH indefinitely.
The frequency is predictable, the volume scales with agent registrations, and there is no behavioral off-switch triggered by a price correction. That changes the supply calculus in ways that cycle-based models don’t fully capture.
Bitcoin Hyper Targets Early Mover Upside as Ethereum Tests Key Supply Levels
ETH at a $271 billion market cap limits the upside math even if the supply-shock thesis fully validates. A move from $2,400 to $3,000 represents roughly 25% – meaningful, but not the asymmetry that earlier-cycle positioning delivers. For traders who accept the AI-driven deflationary crypto thesis but want higher-beta exposure to the same infrastructure trend, the presale layer is worth examining.
Bitcoin Hyper is currently in presale at $0.0521787, with over $1.1 million raised and a staking APY currently sitting above 90%. The project is built around Bitcoin-native speed infrastructure – a direct architectural play on the machine-economy demand that is driving AI agent adoption across L1 networks. Its positioning assumes that the high-frequency, low-latency transaction environment that makes AI agents viable on Ethereum will expand to Bitcoin-adjacent rails as agent registrations scale.
The entry window at current presale pricing closes as each stage fills. For traders watching Ethereum consolidate below resistance while the supply metrics tighten, the asymmetry argument is straightforward. Research Bitcoin Hyper here before the presale window closes.
The post Etherealize Say AI Will Fuel Ethereum Supply Shock: Here’s Why and Next Coin to Pump appeared first on Cryptonews.

The Masters 2026 LIVE: Leaderboard and updates as McIlroy storms to two-shot lead

Why This Weekend Could Break Bitcoin or Send It to $80,000
IPL 2026: Vaibhav Sooryavanshi blitz scripts history, powers Rajasthan Royals to… | Cricket News


-

 Business5 days ago
Three Gulf funds agree to back Paramount’s $81 billion takeover of Warner, WSJ reports
-

 Sports6 days ago
India men’s 4x400m and mixed 4x100m relay teams register big progress | Other Sports News
-

 Politics2 hours ago
US brings back mandatory military draft registration
-

 Business7 days ago
Expert Picks for Every Need
-

 Tech3 days ago
How Long Can You Drive With Expired Registration? What Florida Law Says
-

 Business5 days ago
No Jackpot Winner, Prize to Climb to $231 Million
-

 Fashion4 days ago
Massimo Dutti Offers Inspiration for Your Summer Mood Board
-
 Sports3 hours ago
Man United discover Nico Schlotterbeck transfer fee as defender reaches Dortmund agreement
-

 Fashion3 days ago
Let’s Discuss: DEI in 2026
-

 Crypto World2 days ago
Bitcoin recovers as US and Iran Agree a Ceasefire Deal
-

 Business6 days ago
Akebia Therapeutics, Inc. (AKBA) Discusses Pipeline Progress and Strategic Focus on Kidney Disease Treatments at R&D Day – Slideshow
-

 Fashion3 hours ago
Weekend Open Thread: Veronica Beard
-

 Crypto World1 day ago
Canary Capital Files SEC Registration for PEPE ETF
-

 Politics7 days ago
The UK should not pay a penny in slavery reparations
-

 Business9 hours ago
OpenAI Halts Stargate UK Data Centre Project Over Energy Costs and Copyright Row
-

 NewsBeat7 days ago
Kemi Badenoch talks ‘spring cleaning’ Reform defections
-

 Tech5 days ago
Samsung just gave up on its own Messages app
-

 Tech4 days ago
Haier is betting big that your next TV purchase will be one of these
-
Sports7 days ago
A Kevin O’Connell Theory Can Now Be Retired
-

 Tech5 days ago
The Xiaomi 17 Ultra has some impressive add-ons that make snapping photos really fun
You must be logged in to post a comment Login