
Crypto World
Which Crypto Would Suffer the Most? (4 AIs Respond)


Check out which tokens may plummet by 90% if such a scenario unfolded.
The global geopolitical tension escalated over the weekend after the USA and Israel carried out mutual attacks on Iran, creating a sudden surge of uncertainty that quickly spread across the region and beyond.
The military operation struck many targets and eventually led to the liquidation of Ali Khamenei (the supreme leader of the Asian country). Iran retaliated against several nations in the region, including the UAE, Bahrain, Qatar, and Saudi Arabia. The American president, Donald Trump, warned that the war may continue for up to four weeks, while leading European economies (some of which are nuclear powers), such as France, Germany, and the UK, have hinted that they may “defend their interest” and join the conflict soon.
Right now, the world is watching the Middle East with growing concern, as the risk of a wider conflict and even a potential World War III seems more real than it has in years. Beyond the countless human lives this devastating event would claim, it would also send shockwaves through global financial and crypto markets. To explore the potential impact, we asked four of the most popular AI-powered chatbots which digital assets would be hit the hardest if such a scenario unfolded.
Small Alts, Memes, and More
ChatGPT started with a disclaimer, stating that a world war will not be just “bad news” but cause a “systemic liquidity shock.” It predicted that such a conflict would lead to immediate market panic, with equities dumping and credit freezing. In that kind of environment, crypto would get hit just as hard as everything else.
The chatbot suggested that small-cap altcoins are at the highest risk because they have thin liquidity, few real buyers, and heavy retail exposure. It alerted that cryptocurrencies, whose market capitalization is under $100 million and whose use-cases are dubious, may collapse by up to 90% in a World War III scenario.
Another sector that may experience a real carnage is the meme coin niche. According to ChatGPT, tokens like PEPE, BONK, WIF, and FLOKI can plummet to zero since they are sentiment-driven and notorious for their enhanced volatility:
“In a true risk-off event like a global war, speculative appetite collapses first, and liquidity in meme tokens can disappear within hours.”
Google’s Gemini agreed with ChatGPT’s assumption. It forecasted that such a major conflict could have a devastating effect on small and mid-cap altcoins and meme coins due to mass panic selling and total lack of buyers.
You may also like:
Perplexity focused specifically on the biggest meme coins by market cap, Dogecoin (DOGE) and Shiba Inu (SHIB), estimating they would likely suffer the most due to their “extreme sensitivity to risk-off sentiment and lack of fundamental utility.”
Grok, the chatbot integrated within X, presented a rather different thesis. It claimed that stablecoins like Tether’s USDT and Circle’s USDC could be among the biggest victims due to their connection to the American dollar:
“Stablecoins are pegged 1:1 to fiat currencies like the USD, backed by reserves in banks, Treasuries, or other assets. In WW3, if major economies like the US face hyperinflation, debt defaults, or banking freezes (as seen in historical wars), these reserves could become worthless or inaccessible. In a global war, peg breaks could lead to total devaluation, turning them into “digital IOUs” for a collapsing dollar.”
How About BTC?
All four chatbots we consulted argued that Bitcoin would plunge substantially immediately after a potential announcement of a global war, but would remain the most resilient asset in the crypto sector. They also suggested that, despite the initial shock, BTC could recover its losses relatively quickly compared to the rest of the market.
“BTC would likely drop sharply alongside other risk assets as investors rush to liquidity. However, if the conflict leads to monetary instability or aggressive money printing, BTC could recover faster than most altcoins as its decentralziation and “digital gold” narrative regain strength,” ChatGPT stated.
Binance Free $600 (CryptoPotato Exclusive): Use this link to register a new account and receive $600 exclusive welcome offer on Binance (full details).
LIMITED OFFER for CryptoPotato readers at Bybit: Use this link to register and open a $500 FREE position on any coin!

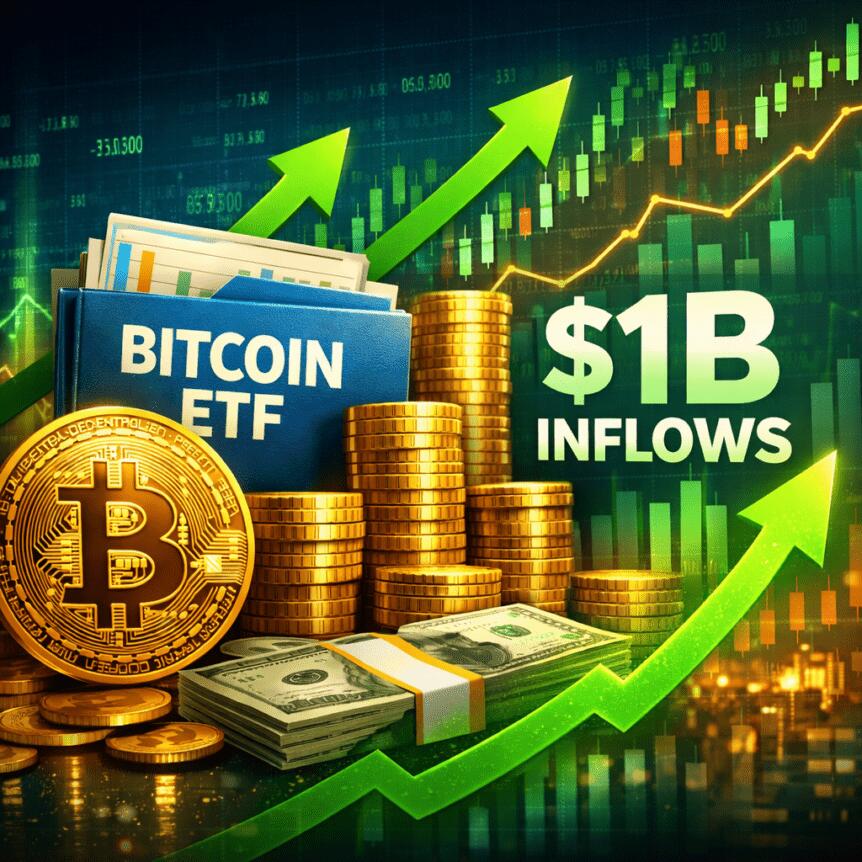
Spot Bitcoin ETFs attracted nearly $1 billion in net inflows over the past week, marking their strongest showing in more than three months as risk sentiment rebounded. SoSoValue estimates total weekly inflows of $996 million, the highest since early January, underscoring renewed institutional interest in spot exposure to the largest cryptocurrency.
In daily terms, Friday delivered the peak with $663.9 million of inflows, followed by $411.5 million on Tuesday and $186 million on Wednesday. Thursday saw a more modest $26 million, while Monday began with a $291 million outflow. Across the week, total net assets in spot Bitcoin ETFs climbed above $101 billion by Friday, accompagned by a surge in activity with daily trading volumes approaching $4.8 billion. The backdrop remains a shift in investors’ appetite for risk assets as macro and geopolitical signals evolve.
Related coverage earlier highlighted Morgan Stanley’s Bitcoin fund moving ahead of WisdomTree after six straight days of inflows, illustrating a broader pattern of growing institutional engagement with Bitcoin-linked offers. Morgan Stanley’s Bitcoin fund overtakes WisdomTree after six trading days is a reference point for how big-name managers are contributing to the ETF narrative.
Key takeaways
- Nearly $1 billion in weekly net inflows into spot Bitcoin ETFs, with Friday alone accounting for about two-thirds of the total.
- Assets in spot BTC ETFs surpassed $101 billion by week’s end, and daily trading volumes neared $4.8 billion, signaling heightened liquidity and interest.
- Market sentiment is shifting toward de-escalation indicators and risk-on assets, even as the Federal Reserve remains cautious on policy timing.
- BTC price action and volatility appear influenced by geopolitical developments, with notable moves tied to shifts in macro risk premia rather than pure price trends alone.
De-escalation signals and the ETF tide
Analysts who track crypto market structure observe a liquidity-driven rebalancing in Bitcoin. Bitunix researchers point to a broader shift: markets are pricing in how geopolitical tensions might unfold rather than merely their persistence. Signs of easing tensions, particularly in US–Iran dynamics, have reduced the immediacy of extreme risk scenarios and have tempered demand for traditional safe-haven assets like the U.S. dollar.
From a macro perspective, the Federal Reserve remains in a cautious stance, with expectations for rate cuts still limited. At the same time, concerns about the United States’ debt trajectory and elevated long-term yields are nudging investors away from perceived risk-free assets, nudging capital toward alternatives such as Bitcoin. In this context, BTC is described as being in a liquidity-redistribution phase, trading within a defined range—roughly a resistance zone above $75,000 and a developing support around $72,000. The ongoing liquidation heatmaps imply a search for a new equilibrium rather than a clear directional breakout.
These dynamics matter for investors because they suggest that the ETF inflows may reflect a longer-term reallocation of portfolios rather than fleeting sentiment shifts. If inflows persist, they could bolster spot exposure even in the face of potential macro headwinds, offering a more durable baseline for demand than temporary risk-on rallies alone.
Geopolitics, markets, and a sudden price move for BTC
The past week’s headlines carried a prominent geopolitics catalyst that rippled through markets. On Friday, Iran’s foreign minister announced the Strait of Hormuz would be opened to commercial shipping for the duration of the current ceasefire, a move quickly echoed by U.S. President Donald Trump. The development calmed fears of immediate supply disruption in one of the world’s most critical oil transit routes, lightening some of the risk premium embedded in energy and broader markets.
In the wake of the Hormuz news, Bitcoin reacted decisively. Prices rose to breach $77,000, reflecting a risk-on impulse that extended beyond crypto markets. Concurrently, Brent crude declined by around 10% to roughly $85 per barrel, illustrating the broad risk-on tilt that can accompany geopolitical easing when investors reassess inflation and growth expectations.
The latest price action sits within the larger context described by market analysts: Bitcoin’s role as a non-sovereign store of value and a hedge against traditional financial fragility continues to attract a new cohort of institutional participants through spot ETFs. While the macro backdrop remains mixed, the ETF inflows and the post-Hormuz rally indicate that crypto markets are increasingly intertwined with macro flows, liquidity dynamics, and geopolitical headlines.
What readers should watch next
Looking ahead, the persistence of ETF inflows will be a key signal to monitor. If money continues to move into spot BTC ETFs, it could reinforce Bitcoin’s pricing as a liquid, institutional-accessible asset rather than a niche retail play. Conversely, any sustained shifts in macro policy expectations—such as clearer guidance on rate cuts—or renewed geopolitical risk could temper the current flow dynamics. The next steps for traders and investors will likely hinge on whether BTC can maintain its position within the current range and whether volumes can sustain the elevated pace that characterized this week’s activity.


Banking trade associations have expanded their lobbying campaign against the stablecoin yield compromise in the CLARITY Act. The groups are now targeting multiple senators on the Banking Committee.
The push escalates a dispute between banks and the White House over whether yield-bearing stablecoins threaten traditional deposits.
White House and Banks Clash Over Stablecoin Yield Data
The Tillis-Alsobrooks compromise would ban passive yield on stablecoin balances while allowing activity-based rewards. Banking groups argue even this restricted framework could siphon deposits from the traditional system.
The Consumer Bankers Association commissioned economist Andrew Nigrinis to dispute the White House Council of Economic Advisers’ April 8 report.
That analysis found banning stablecoin yield would boost bank lending by just $2.1 billion. It estimated a net consumer cost of $800 million from the prohibition.
The CBA-backed paper argues those risks grow as the stablecoin market scales beyond $300 billion. The American Bankers Association has separately warned of up to $6.6 trillion in potential deposit outflows. Reportedly, banking groups have begun lobbying senators beyond the core negotiators.
The White House has previously criticized banks for blocking stablecoin legislation.
Patrick Witt, executive director of the White House Presidential Advisory Committee on Digital Assets, dismissed the continued opposition.
“It’s hard to explain any further lobbying by banks on this issue as motivated by anything other than greed or ignorance. Move on,” he said.
Senator Tillis told reporters his team was “still going back and forth” on releasing the compromise text this week.
Senator Alsobrooks said she expected it “probably” next week. If the Banking Committee does not clear the bill in April, passage in 2026 becomes unlikely.
The post Banks Broaden Lobbying Against Stablecoin Yield in CLARITY Act Talks appeared first on BeInCrypto.

TLDR:
- RWAs excluding stablecoins have reached $29.4B onchain, with tokenized treasuries up 18% month-over-month.
- Hyperliquid’s HIP-3 open interest hit $2.38B, marking a 580% year-over-year surge in perpetual DEX activity.
- Kalshi and Polymarket recorded $23.6B in combined March volume, both hitting all-time highs for two straight months.
- TAO leads decentralized AI with $43M in Q1 revenue, 128 active subnets, and 70% of supply locked in staking.
Narrative rotation 2026 is drawing serious attention from crypto market participants. Analysts suggest capital is no longer chasing a single trend for months before collapsing.
Instead, money is moving toward sectors with real revenue, proven demand, and measurable product-market fit.
Four areas are standing out this cycle: real-world assets, perpetual decentralized exchanges, prediction markets, and decentralized AI. Each sector carries distinct fundamentals that distinguish it from previous speculative waves.
Real-World Assets and Perpetual DEXs Lead Early Flow
Real-world assets, commonly called RWAs, have moved beyond a niche concept in crypto. They now represent fresh collateral entering the ecosystem with genuine external cash flows attached.
Crypto analyst Tanaka noted that RWAs excluding stablecoins currently sit at approximately $29.4 billion onchain. Tokenized treasuries grew 18% month-over-month to $13.6 billion, while tokenized equities recently crossed $1.2 billion.
The biggest movement within this sector involves RWA collateral flowing into DeFi leverage protocols. This points to traditional finance instruments becoming productive assets within decentralized systems.
Protocols building new DeFi primitives around this collateral are drawing the most attention. Tokens like CFG and ONDO are positioned as direct plays on this structural shift.
Perpetual decentralized exchanges are also absorbing considerable flow this cycle. Hyperliquid stands out as the clearest case of where trading activity is concentrating.
Its HIP-3 protocol saw open interest reach $2.38 billion, a 580% year-over-year increase. TradFi perpetuals on the platform grew 188% during Q1 alone.
HYPE captures most of the flow in the perp DEX sector, but traders still use competing venues for arbitrage and hedging. This creates room for secondary platforms to perform alongside the market leader.
The broader thesis is that perpetual DEXs currently hold the strongest product-market fit in crypto infrastructure. Crypto market structure is also beginning to absorb equities, commodities, and prediction exposure through this layer.
Prediction Markets and Decentralized AI Attract Selective Capital
Prediction markets are expanding faster than most analysts anticipated. Kalshi and Polymarket together recorded $23.6 billion in combined volume during March.
Both platforms reached all-time highs for the second consecutive month. Tanaka pointed out that Hyperliquid’s upcoming HIP-4 will deploy permissionless prediction markets directly on its margin layer.
Not every platform in this space is expected to remain viable, though. Markets without a real competitive moat are likely to lose ground quickly.
The stronger opportunities are in infrastructure, oracles, resolution layers, and intent routing built alongside established platforms. Platforms attacking entirely new market segments also show promise.
Decentralized AI is the fourth sector attracting measured capital rotation. OpenAI recently raised $110 billion at a $730 billion valuation. NVIDIA posted $68.1 billion in quarterly revenue, up 73% year-over-year.
These numbers frame the scale of centralized AI dominance, which decentralized alternatives are directly responding to.
TAO remains the primary pick within this category. The network has 128 active subnets, generated $43 million in Q1 revenue, and has 70% of its circulating supply locked in staking.
Grayscale also raised TAO’s allocation to 43% of its AI fund, reflecting growing institutional interest in decentralized AI rails.


CBS News reported that AI in Hollywood has reached a new threshold as actor Val Kilmer, who died in April 2025 at 65, appears in over an hour of finished footage in the upcoming film As Deep as the Grave through state-of-the-art generative AI, constructed from archival material his family provided and executed under SAG guidelines with compensation paid to his estate.
Summary
- Kilmer was cast as Father Fintan, a Catholic priest and Native American spiritualist, five years before his death but was too ill from throat cancer to shoot any scenes, leading director Coerte Voorhees to pursue a generative AI performance with full family cooperation.
- His daughter Mercedes Kilmer supplied archival images and supported the project, saying her father “always looked at emerging technologies with optimism as a tool to expand the possibilities of storytelling.”
- The film’s trailer debuted at CinemaCon in Las Vegas on April 15, 2026, with the ensemble cast also including Tom Felton, Abigail Lawrie, Abigail Breslin, and Wes Studi.
AI in Hollywood reached a defining moment at CinemaCon in Las Vegas this week when the trailer for As Deep as the Grave showed Val Kilmer performing across multiple ages, appearing as a spectral figure at one point and as a younger man in his thirties at another. Kilmer had signed on to play Father Fintan five years before his death but never filmed a single scene. Director Coerte Voorhees chose to reconstruct his performance digitally rather than recast the role.
The production used images of Kilmer at various stages of his life alongside audio recordings from his later years, when his voice had been permanently altered by a tracheotomy following his throat cancer diagnosis. That detail aligned naturally with the character, who suffers from tuberculosis in the film. Voorhees said he deliberately chose Kilmer’s post-surgery voice because it matched what the character would sound like.
Kilmer’s daughter Mercedes and son Jack both supported the project, with Mercedes taking an active role in providing archival material and giving legal authorization for the digital replica. The estate received financial compensation under the terms SAG guidelines require for posthumous digital replicas. “He always looked at emerging technologies with optimism as a tool to expand the possibilities of storytelling,” Mercedes Kilmer said in a statement.
Kilmer had already embraced AI voice technology during his lifetime. For Top Gun: Maverick in 2022, his voice was reconstructed by the AI platform Sonantic using archival audio he personally provided, after his cancer destroyed his natural speaking voice. He called that experience “an incredibly special gift.” That prior participation reinforced the argument that the posthumous AI performance reflected his own values.
The Broader Debate It Reopens
Not everyone agrees that family consent resolves the ethical questions. SAG’s 2023 and 2024 strike negotiations centered specifically on preventing studios from replicating actors without consent or fair compensation. The As Deep as the Grave production argues it satisfies both conditions. Critics, including some who commented when the trailer dropped, argue the existence of a willing family exception creates a template that could be stretched into cases where an actor’s own wishes were ambiguous.
Voorhees addressed the criticism directly: “Despite the fact some people might call it controversial, this is what Val wanted.”
What It Signals for the AI Sector
Each well-publicized AI entertainment milestone simultaneously serves as proof of generative AI’s commercial utility and as a catalyst for the regulatory attention that will define what the technology is ultimately permitted to do. For the AI tokens market and the broader AI bubble debate, cases like this one matter because they determine the social license within which generative AI companies operate, which in turn shapes the legislative environment that governs their products and the infrastructure investments they require.

Iran’s Parliament Speaker Mohammad Bagher Ghalibaf accused President Donald Trump of making “seven claims in one hour, all seven of which were false.” The statement came hours after the S&P 500 posted its fastest recovery since 1982.
Ghalibaf published the rebuke on X (Twitter) and Telegram late Friday, directly challenging Washington’s framing of the reopening of the Strait of Hormuz and the broader ceasefire terms.
What Ghalibaf Actually Said
The Iranian official outlined several specific objections. He rejected any suggestion that the US had gained leverage through its public statements, writing that Washington “did not win the war with these lies, and they will certainly not get anywhere in negotiations either.”
He warned that “with the continuation of the blockade, the Strait of Hormuz will not remain open.” He also stated that all vessel transit through the waterway would follow a route designated by Tehran, requiring Iranian authorization and coordination with its armed forces.
“Whether the Strait is open or closed and the regulations governing it will be determined by the field, not by social media,” Ghalibaf articulated.
The speaker also dismissed Trump’s reported claim that Iran had agreed to transfer its enriched uranium, calling it entirely untrue.
He said Iranian enriched uranium “is in no way going to be transferred anywhere” and that any naval blockade would be treated as a ceasefire violation.
In the same tone, Iran’s Parliamentary National Security Committee Spokesman told Al Jazeera that they will not allow the removal of uranium from Iran, and the American statements on social media differ from reality.
Open in Name, Closed in Practice
Iran formally declared the Strait of Hormuz open on April 17, following a Lebanon ceasefire that fulfilled one of Tehran’s conditions.
Oil markets reacted sharply. Brent crude fell by over 9% to $90.38 per barrel and US crude dropped 11.4% to $83.85.
However, the reopening has not restored normal traffic. Shipping volumes remain at a fraction of the pre-war average of 130 to 140 vessels per day.
Over 150 tankers sit anchored around the strait, while high insurance costs and conflicting US-Iran signals keep most operators on the sidelines.
The US blockade on Iranian-linked ports also remains in force.
The gap between Tehran’s rhetoric and Washington’s narrative suggests talks remain fragile. With no ceasefire extension agreed and both sides disputing basic facts, the strait’s status could shift again at short notice.
Markets that rallied on reopening headlines may need to price in the risk that Friday’s optimism was premature.
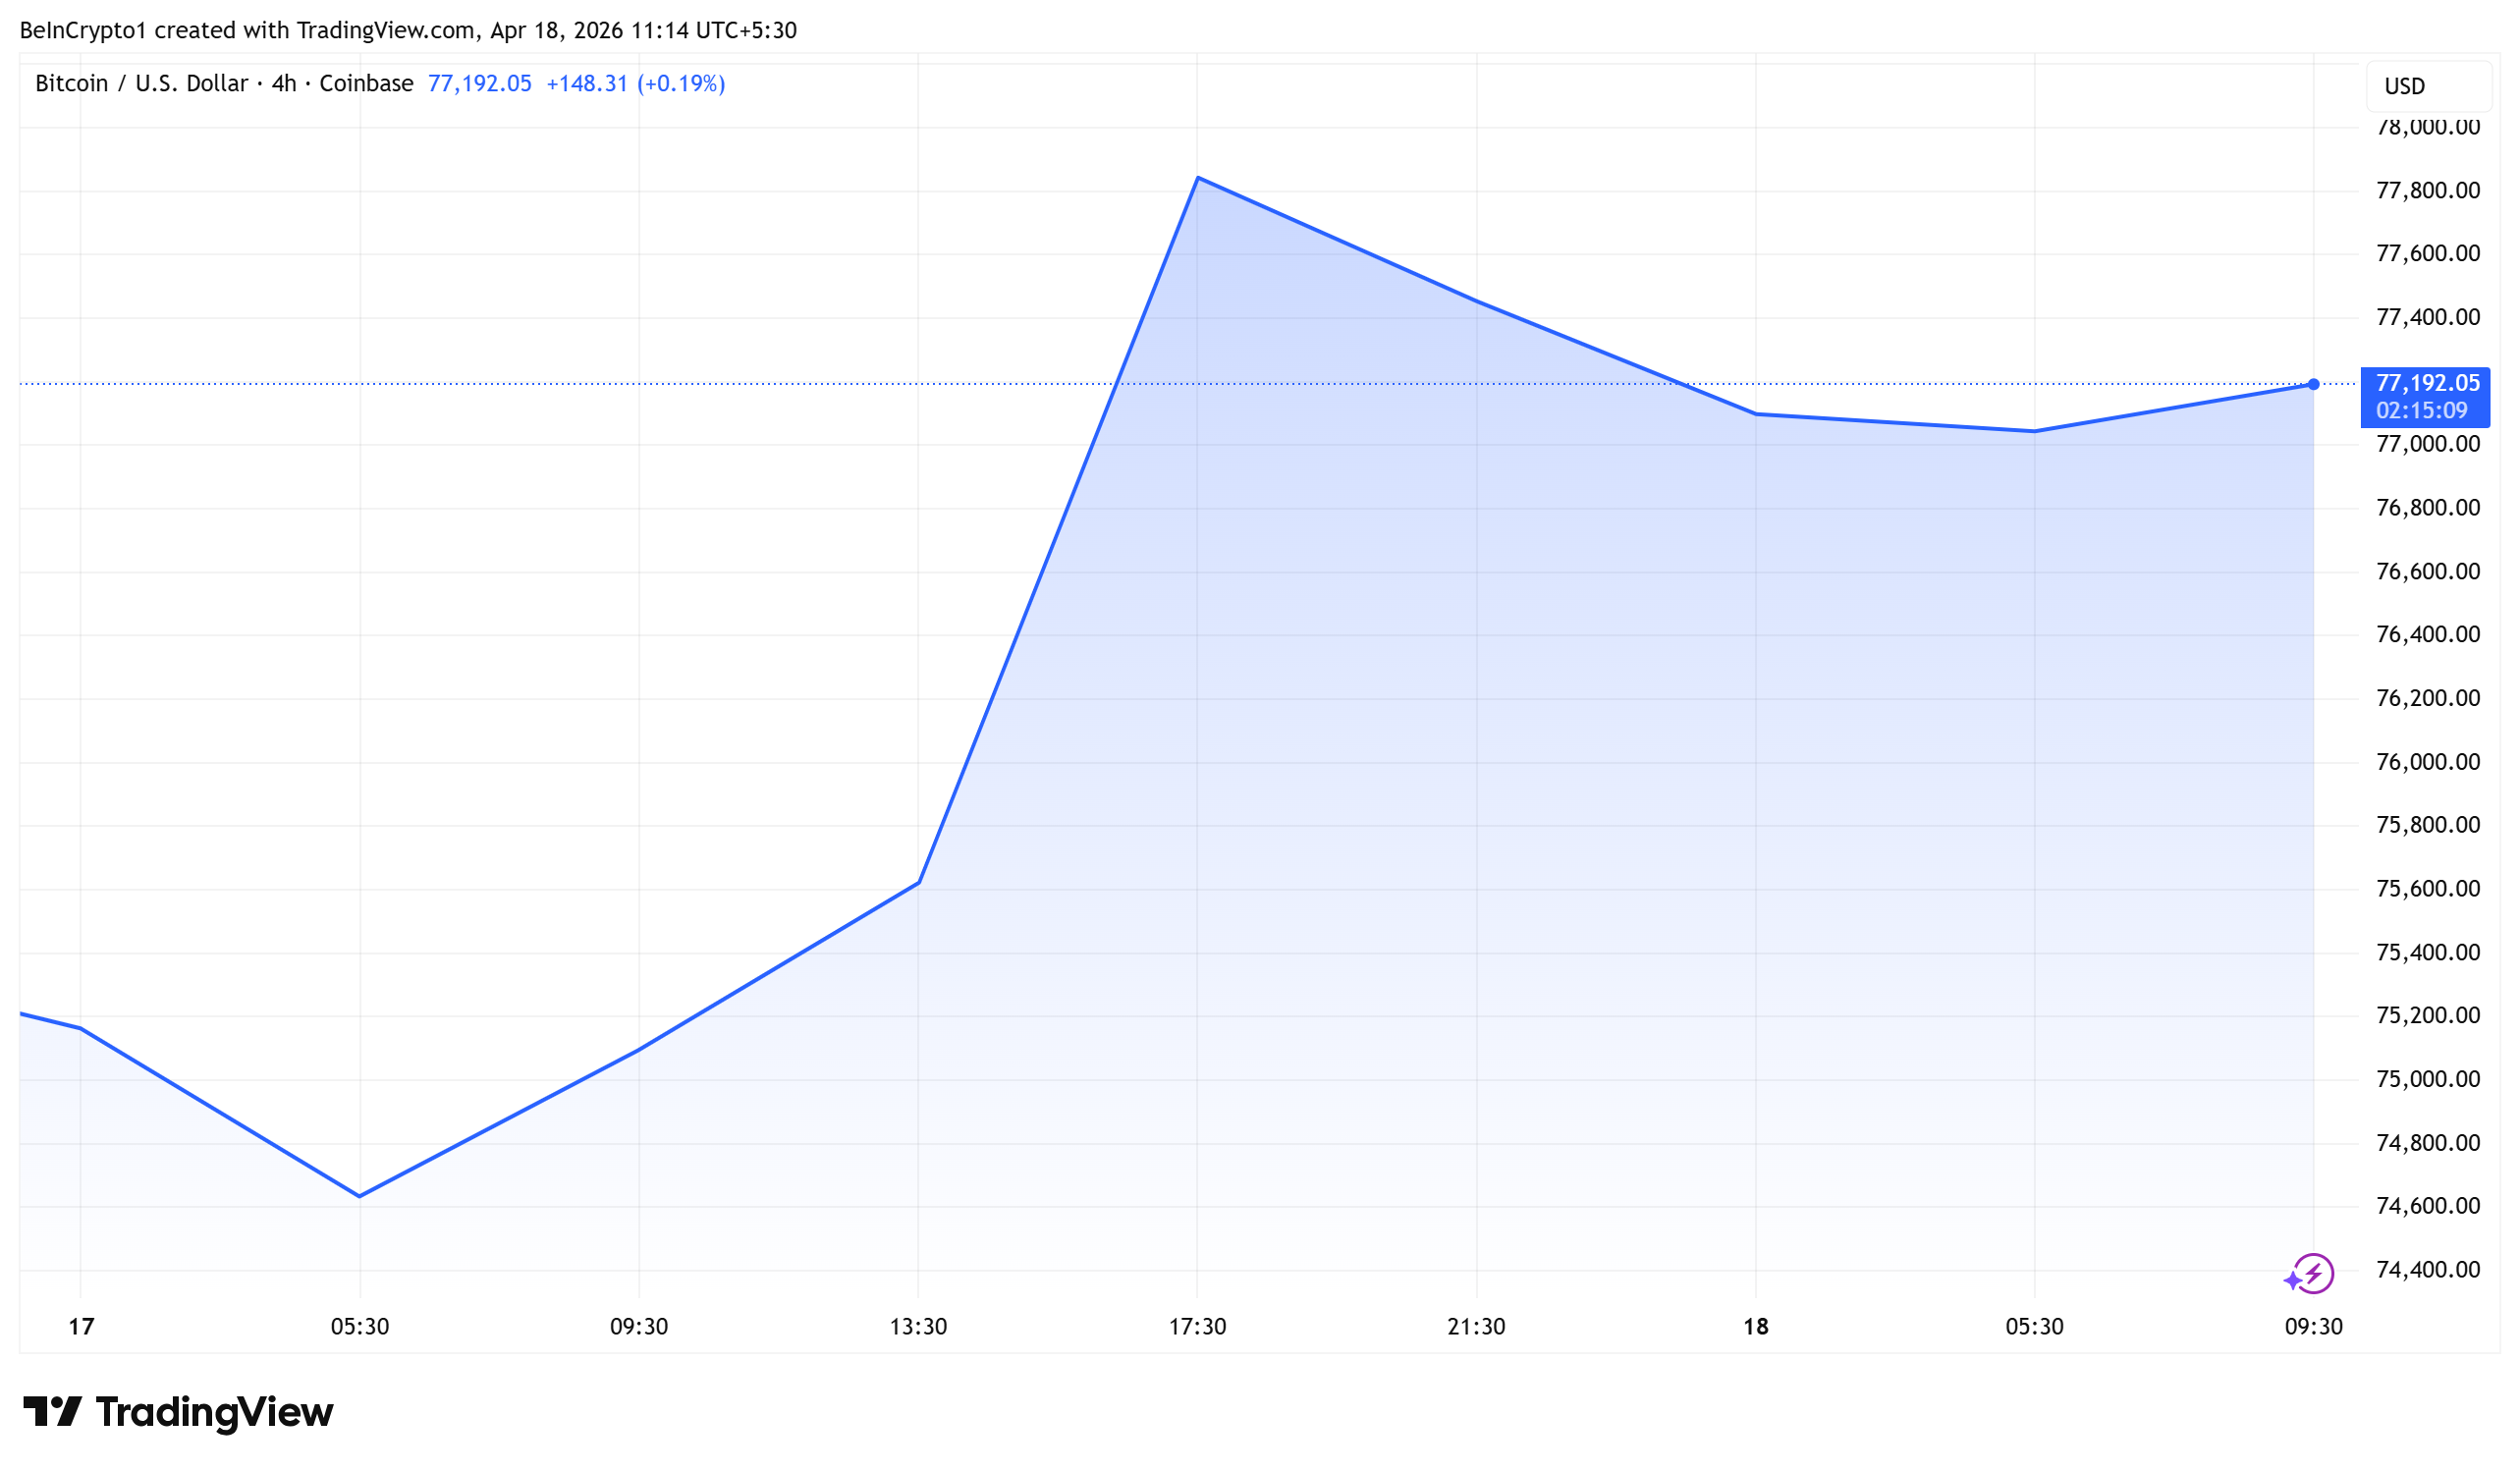
Bitcoin was trading at $77,192 as of this writing, up by 3.6% in the last 24 hours. However, the anticipated weekend rally to $80,000 remains elusive, as markets realize Strait reopening optimism was premature.
The post Iran Accuses Trump of “Seven Lies” After Bitcoin and Stock Markets Surge appeared first on BeInCrypto.
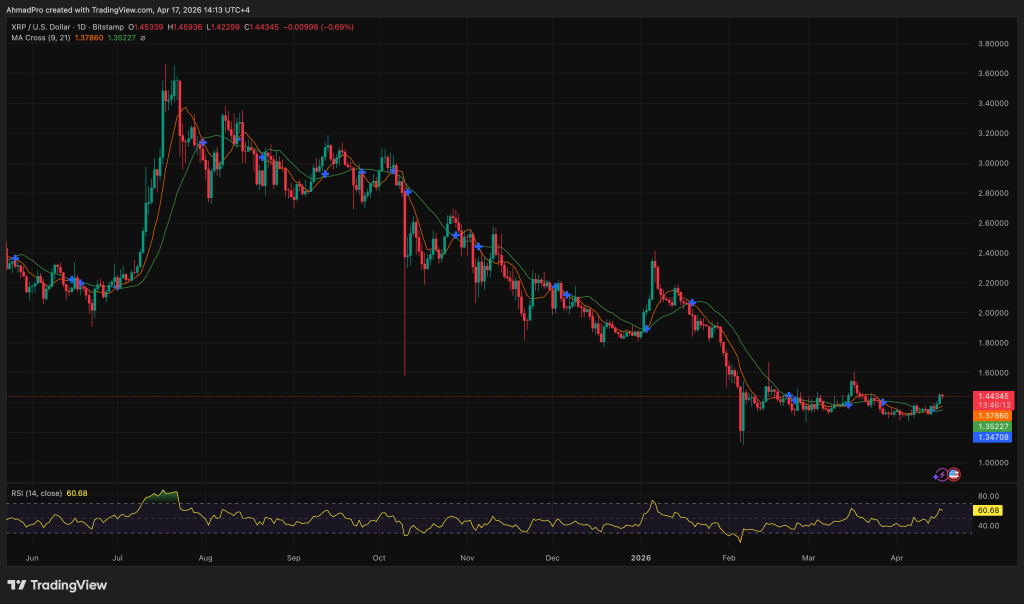
XRP price is trading just above $1.40, pinned in a $1.30–$1.45 range with almost nothing happening – and that’s exactly what makes this setup worth watching.
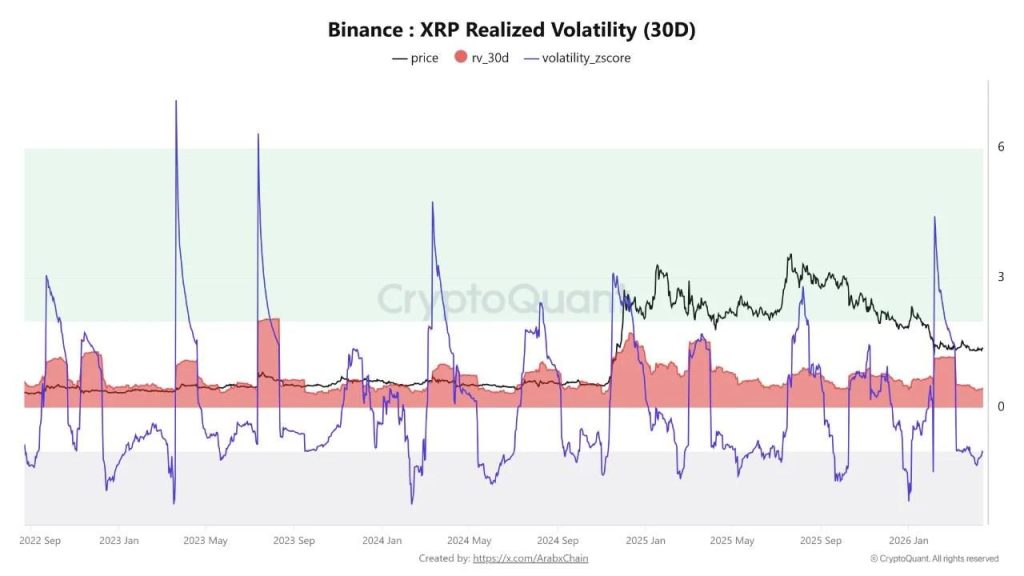
The asset’s 30-day Realized Volatility Index has collapsed to approximately 0.42, its lowest reading since 2024, a quantifiable compression that historically precedes sharp directional moves rather than continued silence.

The price sounds stable until you frame it against where XRP came from. After peaking above $3.00 in mid-2025, a sequence of lower highs and lower lows defined the following months, culminating in a capitulation event in early February 2026, a significant volume spike that flushed weaker hands and reset positioning.
Since that flush, price has done almost nothing.
Discover: The best crypto to diversify your portfolio with
Can XRP Price Clear $1.50 or Is $1.30 the Next Breaking Point?
XRP price right now is not neutral, it is trending down, and the chart makes that pretty clear, because price is sitting below the 50, 100, and 200-day averages, all pointing lower, which is basically the definition of a market that has not bottomed yet.
Volume backs that up too. You had a spike during the selloff, then participation faded, which means this is not accumulation, it is just a quieter downtrend. The fact that $1.30 keeps holding only tells you buyers are defending, not that they are strong enough to push price higher.
So the setup is simple.
If XRP can reclaim $1.50 and actually hold it, that is the first real sign of strength and a potential shift in trend. Until then, every bounce is still just a bounce inside a downtrend.
If $1.30 breaks, the floor disappears, and there is not much support underneath, which is where things can accelerate lower quickly.
What makes it heavier is the on-chain side. Most holders are underwater, MVRV is sitting at levels last seen during major market stress, and supply in profit is low, which usually means momentum is still bearish, not about to flip.
Add to that the fact XRP is already down around 30% over the past year, and this is not just a pullback, it is a sustained downtrend that has not shown a real reversal signal yet.
So the real takeaway is this, the market is compressing, but in a downtrend, and unless something shifts that structure, the odds still lean toward continuation, not a sudden recovery.
Discover: The best pre-launch token sales
The post XRP Price Volatility Falls to Multi-Year Lows, Setting Up a Potential Major Move appeared first on Cryptonews.
TLDR:
- The S&P 500 added $7.3 trillion since March 30, marking one of the fastest recoveries recorded since 1982.
- The rally reflects strong investor demand and steady capital inflows across large-cap equities in recent weeks.
- Crypto observers compared the surge to Bitcoin trends, where rapid recoveries are more commonly seen.
- The gap in recovery speed between equities and crypto markets continues to draw attention from traders.
The S&P 500 has reached a new all-time high after a sharp rebound from late March lows. The rapid recovery has drawn attention across financial markets, as capital flows and investor sentiment shift quickly during this cycle.
S&P 500 Rebound Sets New Pace for Market Recovery
The recent rally pushed the S&P 500 to a fresh peak, marking one of the fastest recoveries in decades. Market data shows the index added about $7.3 trillion in value since its March 30 low.
This pace has not been seen since 1982, when markets rebounded strongly after economic pressure eased. The current move reflects strong buying momentum across large-cap equities and renewed confidence among investors.
A tweet from CryptosRus pointed to the scale of this rebound, noting how traditional markets celebrated the milestone. The post compared the surge to Bitcoin’s historical growth patterns, which often show faster recoveries.
The comparison draws attention to how different asset classes respond during periods of volatility. While equities tend to move with broader economic signals, digital assets often react more rapidly to liquidity and sentiment changes.
Even so, the S&P 500’s recovery has been steady, supported by consistent inflows and institutional participation. This has helped sustain the rally over several weeks without major pullbacks.
Crypto Market Comparison Gains Attention
The same tweet also framed the recovery as routine behavior for Bitcoin holders. It suggested that rapid value expansion is more common within crypto markets than in traditional finance.
This comparison reflects a growing narrative among digital asset participants. Crypto markets often experience sharp price swings, both upward and downward, within short timeframes.
In contrast, equity markets typically move in a more measured way due to regulation, structure, and investor composition. However, the current rally shows that traditional markets can also accelerate under favorable conditions.
The widening gap in speed between crypto and equities remains a topic of discussion. Some market participants view this as a sign of evolving capital dynamics across asset classes.
At the same time, the S&P 500’s rise demonstrates continued strength in traditional finance. Large institutions still play a central role in driving valuation growth within equity markets.
Meanwhile, Bitcoin and other digital assets continue to attract attention for their faster cycles. These differences shape how investors approach risk, timing, and portfolio allocation.
As both markets evolve, comparisons like these are likely to persist. Each asset class operates under different conditions, yet both respond to shifts in global liquidity and investor behavior.


In the latest generative AI news, CBS MoneyWatch reported that US households are actively making room in their budgets for AI subscriptions, backed by Bank of America Institute data showing the number of paying AI subscribers has surged 38% from the 2024 average.
Summary
- Approximately 3% of Bank of America households paid for AI services in early 2026, with median monthly spend at $20, up 10.4% year over year, driven by growing use of tools like ChatGPT Plus, Claude Pro, and Gemini.
- The share of subscribers paying $21 to $40 per month jumped 50% year to date versus 2024, suggesting consumers are moving up the pricing tiers as they deepen their use of AI tools for daily tasks.
- Bank of America Research projects the US consumer AI market could scale to $75 billion annually as AI becomes embedded in productivity, search, entertainment, and personal assistant use cases.
Generative AI news has moved from enterprise budgets to household spending lines. Bank of America Institute analysis of nearly 70 million consumer accounts found that the number of households making AI subscription payments is up 38% from the 2024 average, with median monthly spend sitting at $20 for those who pay, up 10.4% year over year.
The market is still early: only around 3% of Bank of America households are currently paying subscribers. But the growth metrics tell a different story than the headline penetration number.
Higher-income households and younger generations make up the largest share of paying subscribers. But the Bank of America data shows expansion is happening beyond that base. Median AI spending growth was strongest among households earning $75,000 to $125,000 in February 2026, suggesting uptake among middle-income consumers who are integrating tools into professional and personal workflows rather than treating them as discretionary luxuries.
The standard pricing tier across major AI platforms has consolidated around $20 per month, with ChatGPT Plus, Claude Pro, and Google AI Pro each landing in that range. OpenAI recently introduced a $100 per month Pro tier targeting intensive coding and Codex users, while the original $200 monthly plan remains available. The jump in the $21 to $40 monthly bracket reflects consumers moving into bundled or multi-model subscriptions rather than sticking to one platform at the base price.
Bank of America Institute analyst Stephanie Bowley described the trajectory: “I think in some ways it looks a lot like maybe the early days of music or video streaming platforms, where you have this small base, but we’re seeing fast growth and increasing willingness to pay.”
The Consumer Monetization Gap
The Stanford 2026 AI Index estimated that generative AI tools generate $172 billion in annual value for US consumers, while actual consumer subscription revenue remains a fraction of that figure. Most users still access AI through free tiers. The gap between value delivered and revenue captured is what the major AI companies are now attempting to close through new pricing structures, bundled features, and premium tier launches.
Bank of America Research projects the consumer AI market could reach $75 billion annually if adoption continues on its current trajectory, driven by rising demand for tools that save time across shopping, trip planning, financial education, and everyday decisions.
What This Means for AI Tokens and Crypto
The shift from free to paid AI use has direct implications for AI tokens, where infrastructure demand and user monetization rates are primary valuation inputs. Consumer willingness to pay is the commercial signal that separates durable AI market expansion from speculative infrastructure spending, a distinction that has been central to the debate over whether current AI bubble warnings apply to AI platform investments or only to the underlying infrastructure buildout. The Bank of America data suggests the consumer demand side is now real enough to matter beyond early adopters.


Goldman Sachs filed a registration statement with the SEC on April 14 for the Goldman Sachs Bitcoin Premium Income ETF, the first bitcoin ETF news from the Wall Street giant that proposes directly issuing its own crypto income product rather than simply holding third-party spot funds.
Summary
- The fund will invest at least 80% of net assets in instruments providing bitcoin exposure, primarily shares of spot bitcoin ETPs such as BlackRock’s IBIT and Fidelity’s FBTC, then sell call options on those positions to collect monthly premiums.
- The options overwrite level will range from 40% to 100% of exposure depending on market conditions, capping some upside during rallies in exchange for steady income paid to shareholders.
- Bloomberg senior ETF analyst Eric Balchunas described the product as “boomer candy,” noting that Goldman could leapfrog BlackRock’s competing BITA fund by leveraging its distribution network and institutional client relationships.
The Goldman Sachs Bitcoin Premium Income ETF, filed under the Goldman Sachs ETF Trust as a post-effective amendment, would not hold bitcoin directly. It routes exposure through spot bitcoin ETPs and then generates monthly income by selling call options against that position. The fund does not hold bitcoin itself. Its performance depends on the underlying spot ETP prices and the premium income generated by the options strategy, which caps gains in strong rallies.
The filing landed a week after Morgan Stanley launched the Morgan Stanley Bitcoin Trust, intensifying the race among Wall Street’s largest institutions for crypto market share. Goldman’s $3.5 to $3.65 trillion in assets under management gives its distribution network a reach that few other entrants can match.
Goldman CEO David Solomon recently told investors: “I’m an observer of bitcoin,” describing his effort to understand how digital assets are reshaping finance. With a registration statement now on file and a potential launch timeline around mid-June 2026 subject to the standard 75-day SEC review, the observation phase appears to be closing. The bank previously held over $1 billion in spot bitcoin ETF shares through client allocation products but had not proposed issuing its own fund.
The income ETF model is designed for investors who want bitcoin market exposure but prefer regular income distributions over pure price appreciation. During range-bound markets where spot bitcoin trades sideways, a covered-call strategy generates premium income that a simple spot fund would not. Spot bitcoin ETFs recorded $412 million in net inflows on April 14 alone, the same day Goldman filed, underlining the size of the market the product is entering.
What It Means for the Spot ETF Ecosystem
BlackRock’s IBIT has accumulated $63.8 billion in cumulative net inflows since launching in January 2024. Goldman’s proposed fund would use IBIT as a primary underlying vehicle, effectively routing institutional demand through BlackRock’s existing liquidity while differentiating on structure. If Goldman’s distribution network brings new buyers into covered-call bitcoin products, it broadens the spot ETF category’s institutional footprint further.
What Investors Gain and Give Up
The tradeoff is direct. Writing call options collects the premium, generating income, but it also limits how much of any rally the fund captures. During sharp upward moves in bitcoin, the fund would underperform a plain spot ETF by the amount of upside that was capped. During flat or declining markets, the premium income cushions the holding.
That asymmetry matches well with investors who own bitcoin for portfolio diversification and yield rather than directional speculation. Goldman’s client base in private wealth and institutional asset management contains a significant share of investors who fit that profile, which is why the bank’s distribution network becomes the product’s structural advantage rather than just a sales channel.


Ethereum co-founder Vitalik Buterin warned users on April 18 to stop visiting any eth.limo URLs after the popular ENS gateway suffered a DNS registrar attack.
The eth.limo team confirmed the compromise minutes later, stating its domain had been hijacked and that it was working with all involved parties to fix the problem.
What Happened to eth.limo
Eth.limo is a free, open-source gateway that lets users access Ethereum Name Service (ENS) content through standard web browsers. It translates ENS names into HTTPS URLs, allowing anyone to visit decentralized websites without running an IPFS node.
The attacker gained control of eth.limo’s account at its domain registrar. This gave them the ability to redirect all traffic on the wildcard *.eth.limo domain, potentially exposing visitors to phishing pages or malware.
Buterin shared a direct IPFS link to his personal blog as a safe alternative and asked users to wait for an all-clear from the eth.limo team before resuming normal access.
“The kind people at @eth_limo have warned me that there has been an attack on their DNS registrar. So please do not visit vitalik.eth.limo or other eth.limo pages until they confirm that things are back to normal,” wrote Buterin.
Decentralization’s Centralized Weak Spot
The incident highlights a recurring vulnerability in Web3 infrastructure. While ENS records and IPFS content remain decentralized and were not compromised, the DNS layer that connects them to traditional browsers still depends on centralized registrars.
Similar attacks have previously targeted DeFi protocols like Cream Finance and Aerodrome, both through registrar-level compromises.
Crypto phishing losses exceeded $4 billion in 2025, with frontend hijacks becoming an increasingly common attack vector.
No user fund losses have been confirmed so far. The eth.limo team has not yet issued an all-clear, and users should continue avoiding all *.eth.limo URLs until further notice.
The post Vitalik Buterin Warns Users After eth.limo DNS Hijack appeared first on BeInCrypto.

Spot Bitcoin ETFs Near $1B Weekly Inflows as Risk Appetite Improves

Poll: Trump’s immigration message changed. Voters' opinions have not.

Magic crush Hornets, tap into the team everyone expected just in time

Why Israel is blocking foreign journalists from entering

Bitcoin: We’re Entering The Most Dangerous Phase

Alan Cumming Brands Baftas Ceremony A ‘Triggering S**tshow’

Financial bad luck will be removed. #zodiac #horoscope #astrology #zodiacsigns

Jio Financial Q4 results 2026 | jio finance q4 results today | Jio Financial Share News today

LIVE TRADING BTC GOLD | 16/04/2026 |#crypto #livetrading #btc #forex #forextrading
-
 NewsBeat6 days ago
Pep Guardiola and Gary Neville agree over Arsenal title problem that benefits Man City
-

 Crypto World5 days ago
The SEC Conditionalises DeFi Platforms to Be Avoided for Broker Registration
-

 Politics6 days ago
World Cup exit makes Italy enter crisis mode
-

 Crypto World5 days ago
SEC Signals Exemption for Crypto Interfaces From Broker Registration
-

 News Videos3 days ago
Secure crypto trading starts with an FIU-registered
-

 Fashion17 hours ago
Weekend Open Thread: Theodora Dress
-

 Sports1 day ago
NWFL Suspends Two Players Over Post-Match Clash in Ado-Ekiti
-

 Crypto World4 days ago
SEC Proposes Certain Crypto Interfaces Don’t Need to Register as Brokers
-

 Business7 days ago
Ireland Fuel Protests Enter Day 5 as Blockades Spark Shortages and Government Prepares Support Package
-

 NewsBeat4 days ago
Trump and Pope Leo: Behind their disagreement over Iran war
-

 Politics14 hours ago
Palestine barred from entering Canada for FIFA Congress
-
 NewsBeat6 days ago
JD Vance announces ‘no agreement’ with Iran over nuclear weapons fear
-

 Crypto World12 hours ago
Russia Pushes Bill to Criminalize Unregistered Crypto Services
-
Sports6 days ago
Dexter Lawrence, Stefon Diggs, Trading for De’Von Achane
-

 Crypto World5 days ago
Trump whales load up ahead of Mar-a-Lago luncheon.
-
Crypto World6 days ago
Sei Network Enters Quiet Reset Phase as On-Chain Metrics Signal a Slowdown in 2026
-
Business5 days ago
Kering slides after Morgan Stanley downgrade, Gucci woes loom
-
 Entertainment4 days ago
Karol G’s ‘Ultra Raunchy’ Coachella Set Gave ‘Satanic Vibes’
-
 Business2 days ago
Creo Medical agree sale of its manufacturing operation
-

 Sports5 days ago
NWFL opens Pathway for new Clubs ahead of 2026 Season
You must be logged in to post a comment Login