
Crypto World
Why Bitcoin Analysts Say BTC Has Entered Full Capitulation
Bitcoin (CRYPTO: BTC) came under renewed selling pressure on Thursday as the price slipped below $69,000—the lowest level since November 6, 2024. The move underscored a backdrop of extreme market fear and frantic margin risk, with analysts contending that a potential bottom could be taking shape as short-term holders capitulate and on-chain activity points to exhausted selling. While the technical backdrop remains fragile, a cluster of indicators suggests that the recent wave of panic may be approaching a climax, though traders are wary of any renewed macro catalysts or liquidity shocks.
Key takeaways
- Short-term holders moved roughly 60,000 BTC to exchanges in the last 24 hours, signaling acute selling pressure and a large inflow that has contributed to the downside momentum.
- The Crypto Fear & Greed Index registered “extreme fear,” a level that has historically preceded a bottom and a subsequent bounce in prior cycles.
- Bitcoin’s RSI has reached multi-timeframe oversold levels, indicating seller exhaustion in several horizons and the potential for a near-term rebound if demand returns.
- Glassnode data show the seven-day moving average of realized losses climbing above $1.26 billion per day, a sign of rising fear in on-chain behavior and a potential capitulation event.
- Bitcoin’s capitulation metric posted its second-largest spike in two years, a pattern that historically aligns with rapid de-risking and heightened volatility as traders reset positions.
Tickers mentioned: $BTC
Sentiment: Bearish
Price impact: Negative. The renewed selling pressure and significant exchange inflows pushed BTC below key support, intensifying near-term downside risk as market participants reassess risk exposure.
Trading idea (Not Financial Advice): Hold. The combination of extreme fear, oversold RSI, and on-chain capitulation signals could precede a relief rally, but risk management remains essential while the market tests support levels.
Market context: The price action unfolds amid fragile liquidity conditions and a broader risk-off environment that has weighed on crypto assets. As traders parse on-chain signals against macro headlines, episodic capitulation events have tended to precede volatile but recoverable periods, with price action often drifting between fear-driven capitulation and later upside momentum once conviction returns.
Why it matters
The current wave of selling—centered on short-term holders—highlights a critical phase in the Bitcoin cycle. When a large bloc of supply shifts to exchanges at a loss in a short window, it can create a temporary liquidity squeeze that tests the resilience of bids at nearby levels. In the latest data, roughly 60,000 BTC moved from short-term holders to wallets on centralized venues in just one day, a move valued at about $4.2 billion at prevailing prices. This inflow exacerbates selling pressure, particularly in a market that has already faced a string of sharper-than-expected corrections. The dynamic underscores the risk that fresh headlines or macro surprises could reintroduce volatility before buyers re-emerge.”
Another powerful signal comes from the Fear & Greed Index, which sits in the realm of “extreme fear.” The gauge has historically punctured lower during capitulations, yet it also marks a potential turning point when fear peaks. The latest reading aligns with other cycles where a bottoming process has followed intense pessimism, before sentiment gradually shifts as risk appetites reappear among value-focused or long-term participants.
On-chain psychology also appears to be stabilizing, even as prices test psychological thresholds. Glassnode notes that the seven-day realized-loss metric has climbed past $1.26 billion per day, reflecting a surge in realized losses across the market. In their view, spikes in realized losses often coincide with moments of acute seller exhaustion, where marginal selling pressure begins to fade as market participants mark down losses and reassess risk. The capitulation metric, meanwhile, recorded its second-largest spike in two years, signaling a period of aggressive de-risking that typically precedes a more orderly reallocation of exposure once price discovery resumes.
The RSI, a widely watched momentum indicator, also reinforced the notion of an oversold regime across multiple timeframes. Coinglass’ heatmap shows BTC’s RSI flashing oversold conditions on five of six studied horizons. Specifically, the 12-hour RSI sits around 18, the daily around 20, and the four-hour near 23, with weekly and hourly readings also signaling distress. Some analysts have pointed to the weekly RSI near 29 as the most oversold level since the 2022 bear market, a milestone that has historically preceded relief rallies rather than fresh lows. In a market known for abrupt shifts, such readings are often interpreted as evidence of seller exhaustion rather than a guarantee of near-term direction.
Market observers have not avoided drawing parallels to prior capitulation episodes. A prominent sentiment analyst argued that this is “the most oversold” condition since the FTX crash, hinting that panic-driven selling could be approaching a climax even as price action remains fragile. Others urged patience, suggesting that risk/reward can improve when major players either accumulate at discounted levels or when the small-trader crowd exhibits a degree of disbelief that helps shore up a bottoming process. The broader narrative remains clear: extreme fear plus concentrated selling could lay the groundwork for a counter-move, but confirmation will come only with sustained price action and a shift in on-chain behavior.

Analysts cautioned that while the current conditions are telling, they do not guarantee a bottom that will immediately resume a longer-term uptrend. The price regime remains vulnerable to sudden shifts in macro liquidity, regulatory developments, or shifts in major exchange flows. Yet, the logic of capitulation—defined by a broad-based exit from risk and the erosion of conditionally profitable positions—has historically been followed by a re-pricing of risk as buyers step back in and price discovery restarts. In this context, several voices have framed this phase as a potentially fertile point for accumulation, provided that risk controls are in place and the market finds a credible catalyst to re-anchor value expectations.

What to watch next
- Price stabilization near current support levels and any intraday rebound following the extreme fear readings.
- Further on-chain data from CryptoQuant and Glassnode showing whether short-term holder outflows ease and whether realized losses begin to retreat.
- The evolution of RSI across multiple timeframes and any divergence that could hint at renewed buying interest.
- Liquidity conditions and macro developments that could reintroduce coordinated bid support for BTC and risk assets more broadly.
Sources & verification
- CryptoQuant data on 60,000 BTC moving to exchanges by short-term holders over 24 hours.
- Glassnode commentary on seven-day realized losses averaging above $1.26 billion per day and the capitulation metric spike.
- Crypto Fear & Greed Index reading at extreme fear (12) and historical context for similar levels.
- Coinglass RSI heatmap showing oversold conditions across multiple timeframes for BTC, including weekly RSI near 29.
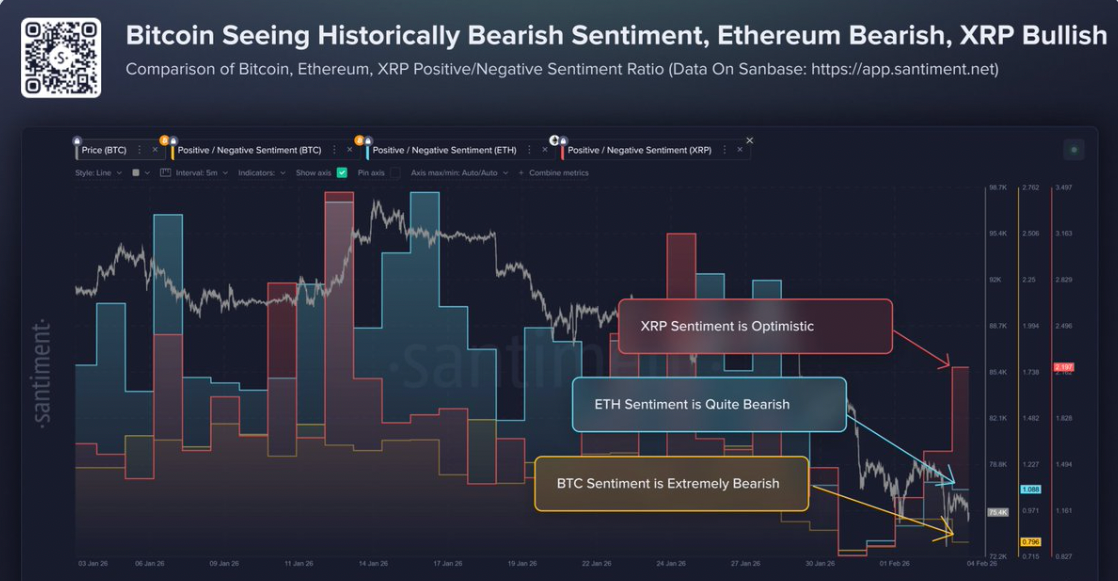
- Santiment and other analyst commentary referencing sentiment shifts and potential near-term relief rallies.
Market reaction and key details
Bitcoin (CRYPTO: BTC) traded with renewed weakness on Thursday as the price slipped below $69,000, a level not seen since November 2024. The move came amid a confluence of on-chain signals and sentiment metrics that suggest investors are bracing for further volatility while some traders anticipate a bottom could be forming. The latest data show a substantial transfer of BTC from short-term holders—investors with a holding period under 155 days—to exchanges, with roughly 60,000 BTC moved in a single 24-hour period. At current prices this corresponds to about $4.2 billion in value, highlighting the scale of the near-term selling pressure and its potential to prolong downside risk if bids remain thin.

Observers on X noted that “the correction is so severe that no BTC in profit is being moved by LTHs,” underscoring a perceived capitulation among longer-term investors who might otherwise absorb losses and help stabilize prices. The sentiment is echoed in the weekly RSI readings, which place Bitcoin in a deeply oversold territory not seen in years. The heatmap from Coinglass confirms that the RSI is oversold on five of six timeframes, with readings such as 18 on the 12-hour and 20 on the daily frame, among others, signaling that selling pressure could be drying up even as prices test critical support. While some analysts describe the situation as an opportunity for buyers, others warn that risk remains high until a durable bid is reestablished and macro catalysts align with improved liquidity conditions.

The fear-driven mood is reinforced by the Crypto Fear & Greed Index, which sat deeply in the “extreme fear” zone. Historical patterns suggest that such levels often precede a turning point, though there is no guarantee of a swift recovery. Analysts have pointed to past episodes where heavy selling pressure and a retreat from risk assets gave way to a slower, more deliberate re-pricing of risk and a gradual incursion of buyers who see value at muted prices. Yet, the path forward remains contingent on a confluence of supportive signals, including on-chain activity that signals accumulation and renewed bid depth in the order book.
Several observers note that while the immediate narrative remains bearish, the prevailing combination of oversold momentum, high realized losses, and isolated capitulation spikes can set the stage for a temporary relief rally if buying interest returns and risk sentiment improves. The debate among market participants continues to hinge on whether the current episode is a definitive bottoming process or merely a dread-filled pause before fresh downside. As always, investors should watch liquidity, regulatory developments, and macro cues for decisive clues about the next leg of the cycle.


US Senator Elizabeth Warren has raised concerns about statements made by SEC Chair Paul Atkins regarding enforcement activity.
Summary
- Warren questioned SEC Chair Atkins after data showed enforcement actions dropped to lowest levels in years.
- SEC data release contradicted earlier testimony where Atkins said he was unsure about enforcement figures.
- Warren requested answers by April 28 on whether Congress was misled about enforcement activity levels.
In a letter sent on Wednesday, she questioned whether his earlier testimony before Congress reflected accurate information.
Warren referred to a congressional hearing held on Feb. 12. During that session, she asked Atkins about reports showing a drop in enforcement actions. According to her letter, Atkins responded that he was “not sure what data” she was referencing at the time.
The issue gained attention after the SEC released its fiscal year 2025 enforcement data on April 7. The figures showed a decline in enforcement actions compared to previous years. Warren stated that the data confirmed earlier concerns about reduced activity.
In her letter, she wrote that the new figures show enforcement actions at their lowest level in a decade. She said this raised questions about the accuracy of Atkins’ earlier response. Warren described the situation as “deeply troubling” based on the available data.
In addition, Warren suggested that Atkins may have provided incomplete information during the hearing. She stated that his response now appears “deeply misleading” given the data released later. The letter also noted that the hearing took place months after the fiscal year had ended.
She further wrote that Atkins “may have been deliberately trying to mislead the Committee.” The statement referred to his lack of clarity when asked about enforcement trends. Warren asked whether he was aware of the enforcement data at the time of his testimony.
Request for Clarification From SEC
The letter includes a series of questions directed at Atkins. Warren requested detailed explanations about the decline in enforcement activity. She also asked him to clarify what information he had access to during the hearing.
A response has been requested by April 28. The discussion comes as the SEC faces scrutiny over its recent approach to enforcement, including actions related to crypto companies. Lawmakers continue to review the agency’s performance based on the latest data.


Kelp, a liquid restaking platform, reported a cyber attack on Saturday that affected its rsETH token operations.
Summary
- Kelp exploit targeted rsETH bridge contract, leading to $293 million loss within a short period.
- Stolen funds moved through Tornado Cash, with large portion converted into Ether across networks.
- DeFi platforms froze rsETH activity after contagion risk spread across at least nine connected protocols.
The team detected unusual cross-chain activity and quickly paused smart contracts across the main network and several Layer-2 systems. The platform stated that it “investigates” the issue while assessing the full scope of the breach.
Meanwhile, the exploit focused on the rsETH adapter bridge contract. This component manages token transfers across chains.
Blockchain security firm Cyvers estimated losses at around $293 million. The attacker gained access to funds by targeting this contract, leading to a large outflow within a short time.
Cyvers reported that the attacker used an address funded through Tornado Cash. This tool is often used to obscure transaction trails. A large portion of the stolen funds, about $250 million, has already been converted into Ether.
The movement of funds has raised concerns among platforms connected to rsETH. Monitoring teams continue to track the assets as they move across networks. No recovery of funds has been confirmed so far. Kelp has not released further technical details about the breach at this stage.
Moreover, the attack caused what Cyvers described as “cross-protocol contagion.” At least nine crypto platforms had exposure to rsETH and took action to limit risk. Many of them paused or restricted activity involving the token.
Aave confirmed that it froze rsETH markets on its V3 and V4 platforms. This step aimed to prevent further losses and contain risk. Cyvers CEO Deddy Lavid stated that the event “highlights the risks of composability in DeFi,” referring to how connected systems can spread risk quickly.
Rising Security Concerns in Crypto Sector
The Kelp incident adds to a growing list of crypto platform breaches. Data shows that losses from hacks and scams reached about $482 million in the first quarter of 2026. These events continue to affect user confidence and platform operations.
Another recent caseinvolved Drift Protocol, which lost about $280 million in an exploit. The platform reported that attackers spent months gaining access before deploying malware. These incidents show ongoing challenges in securing decentralized finance systems.

RaveDAO has denied any role in the dramatic surge and subsequent collapse of its RAVE token, even as major crypto exchanges have opened inquiries into trading activity amid allegations of market manipulation. The project pushed back on social media, saying it was “not engaged in, nor responsible for, recent price action” after RAVE spiked from about $0.25 to nearly $28 in a matter of days before sliding more than 80%.
On-chain sleuth ZachXBT publicly accused RaveDAO of orchestrating a pump-and-dump scheme, pointing to concentrated token holdings and suspicious exchange flows. He suggested that more than 90% of the token supply could be controlled by insiders and urged exchanges to take action.
Key takeaways
- RaveDAO rejects being involved in the sudden RAVE price action, even as critics point to potential pump-and-dump dynamics and concentrated insider holdings.
- ZachXBT alleged a coordinated scheme and called for exchange-focused scrutiny of flows and ownership distribution.
- Major exchanges Binance and Bitget confirmed they are reviewing the situation; Binance’s CEO said the exchange is looking into it, and Bitget’s CEO said the exchange has started investigating RAVE trading activity.
- RaveDAO outlined plans to sell portions of unlocked tokens to fund operations, marketing, and hiring, and is exploring price-triggered or performance-triggered locks to align incentives.
- RAVE trades at around $1.36 after a volatile run; CoinMarketCap data shows a 94.95% drop over the past day at the time of writing.
RaveDAO’s response and token-economy plans
RaveDAO describes itself as a Web3-based entertainment project blending electronic music events with blockchain technology. The goal is to onboard crypto users through real-world experiences—festivals, parties, and other live events—with attendees receiving NFTs for participation. The RAVE token is intended to serve governance, ticketing, and access roles within its ecosystem.
In a bid to support growth while maintaining transparency, the team disclosed plans to sell portions of unlocked RAVE tokens to fund operations, marketing, and hiring. They also said they are examining “price-triggered or performance-triggered locks” as a mechanism to better align incentives with sustainable growth. The project stressed that it aims to build its movement “sustainably and transparently.”
These governance- and event-focused ambitions come at a time of heightened scrutiny of token distributions and market-making practices across the ecosystem. The ongoing focus on token unlocks signals a broader tension between financing growth and protecting holders from abrupt, unpredictable price movements.
As a reminder, RAVE’s role in the ecosystem is tied to its use for governance, ticketing, and access to events. The reported price action—rising from a sub-dollar level to near $28 within days, followed by a steep decline—has raised questions about whether the run was driven by organic demand or speculative trading. At the time this article was prepared, RAVE was trading around $1.36, down roughly 95% over the previous 24 hours, according to CoinMarketCap data.
Related coverage on market-making transparency underscores a recurring theme in crypto: many protocols do not disclose detailed market-maker terms, complicating investor assessment of liquidity dynamics and price discovery. For readers seeking additional context, see the study highlighting disclosure gaps in crypto market-making terms.
Industry backdrop: a wave of DeFi exploits in April
The RAVE episode arrives amid a recent surge in DeFi security incidents. In the first weeks of April, more than a dozen protocols and firms were affected by a string of exploits, beginning with the substantial $280 million Drift Protocol attack on April 1. The incidents touched DeFi liquidity pools, cross-chain bridges, and centralized- and decentralized-exchange ecosystems, illustrating the ongoing risk environment for investors and builders alike.
Projects including CoW Swap, Hyperbridge, Bybit, Silo Finance, Aethir, and Rhea Finance were among those impacted, with breaches ranging from smart contract bugs and oracle manipulation to access-control failures and liquidity-pool exploits. The events have reinforced a narrative around security hygiene, incident response, and governance accountability across the broader crypto space.
Against this backdrop, RaveDAO’s plans to diversify funding and improve token-management practices will be watched closely by holders and potential partners. The situation also underscores the broader market-wide demand for greater transparency around token emission schedules, unlocks, and long-term incentives in community-led ecosystems.
Related coverage of market-maker transparency remains relevant as readers assess how liquidity and price signals are shaped across new multi-chain ecosystems. For background, see coverage noting the ongoing gap in disclosed market-maker terms across many protocols.
What’s next could hinge on official disclosures from the exchanges reviewing activity, any new statements from RaveDAO about token unlocks, and the evolution of their governance and incentive structures. The coming weeks will be telling for investors looking to gauge whether the project can stabilize and deliver on its live-event experiences, or whether the episode signals deeper governance and distribution risks.
Investors should watch for further clarifications on token ownership distribution, the maturity and impact of any proposed price- or performance-triggered locks, and how exchanges handle potential market-manipulation signals as investigations continue.
Readers should monitor official updates from Binance and Bitget, as well as any new disclosures from RaveDAO, to better understand the implications for governance tokens, event-based ecosystems, and the balance between fundraising needs and holder protection.


The RAVE token recorded a rapid increase in value, rising from about $0.25 to nearly $28 within a short period.
Summary
- RAVE token surged rapidly before crashing over 80%, raising concerns about trading activity and liquidity patterns.
- Binance and Bitget launched investigations following claims of insider control and unusual token movement patterns.
- RaveDAO denied involvement and plans token sales to fund operations while promising transparent growth strategies ahead.
The surge attracted attention across the crypto market due to its speed and scale. Soon after, the token lost more than 80% of its value, leaving traders with large losses.
Market data shows that the token later dropped further, trading near $1.39 within a day of the crash. This sharp movement raised questions about trading patterns and liquidity. Observers noted unusual activity during both the rise and fall.
RaveDAO Responds to Allegations
RaveDAO issued a public statement denying any role in the price movement. The team stated that it was “not engaged in, nor responsible for, recent price action.” The response came as discussions grew across social media and trading platforms.
The project also addressed claims about token control. It did not confirm the figures but maintained that operations follow internal plans. The team added that it aims to act “sustainably and transparently” as it develops its platform.
In addition, major crypto exchanges have started reviewing the situation. Binance CEO Richard Teng stated, “We’re looking into it,” confirming that internal checks are underway. Bitget CEO Gracy Chen also said the platform had “started investigating” the trading activity.
These actions followed claims by onchain analyst ZachXBT, who pointed to concentrated holdings and unusual exchange flows. He suggested that more than 90% of the supply could be linked to insiders. Exchanges have not released detailed findings at this stage.
Project Plans and Market Context
RaveDAO shared plans to sell part of its unlocked tokens to fund growth. The funds are expected to support hiring, marketing, and operations. The team also mentioned possible “price-triggered or performance-triggered locks” to manage supply.
The project operates in the Web3 entertainment space, linking music events with blockchain use.
At the same time, the broader crypto sector has seen increased security issues. Several DeFi platforms have reported recent exploits, adding pressure on market confidence.

Key Highlights
- Intel shares have soared 220% over twelve months, reaching $70.32—the highest price in twenty-five years
- New CEO Lip-Bu Tan slashed over 20,000 positions and restored positive free cash flow during the latter half of 2025
- Nvidia committed $5 billion to Intel’s operations; partnerships include Alphabet and Elon Musk’s Terafab initiative
- First quarter 2026 financial results arrive April 23—elevated expectations may trigger price swings
- A single analyst projects shares could reach $150 by 2029 if margin expansion and profit growth materialize
Intel’s recent performance represents one of the semiconductor industry’s most striking comebacks. After touching a multi-year bottom near $18 in June 2025, shares rocketed to $70.32—a twenty-five-year peak—with a remarkable 58% spike compressed into just nine trading sessions. Many investors are now questioning whether the opportunity has passed or if upside remains.
The transformation narrative revolves primarily around Lip-Bu Tan, who assumed the CEO role in March 2025. A veteran venture capitalist with expertise in corporate turnarounds, Tan previously guided Cadence Design Systems to a staggering 3,200% appreciation during his twelve-year tenure. Upon joining Intel, he acted decisively. Workforce reductions exceeded 20,000 employees while capital expenditures were trimmed. Free cash flow, which had posted a combined negative $44 billion drain from 2022 through 2025, finally turned positive in the second half of the previous year.
Intel’s product portfolio has gained fresh momentum as well. The chipmaker unveiled its Core Series 3 mobile processors utilizing the advanced 18A manufacturing process, designed to handle routine AI workloads while extending battery performance for consumer laptops.
Strategic AI Collaborations Mark New Direction
Intel’s strategy extends beyond expense reduction—it’s mounting a serious challenge in the artificial intelligence sector. The firm has forged partnerships with Alphabet focusing on AI capabilities and cloud computing infrastructure. Additionally, Intel is collaborating with Elon Musk on “Terafab,” a semiconductor manufacturing joint venture connecting SpaceX and Tesla.
Then comes Nvidia. Last September, Nvidia poured $5 billion into Intel to manufacture specialized x86 server processors designed to work seamlessly with Nvidia’s graphics processing units. Ben Reitzes, analyst at Melius Research, stated bluntly: “The demand for the x86 server CPU has gone through the roof at hyperscalers. The x86 became an AI chip.”
This represents a fundamental transformation in market perception regarding Intel’s position within AI infrastructure.
Yet the dramatic rally has pushed valuation metrics into stretched territory. Intel currently commands approximately 95 times projected earnings—surpassing valuations for Nvidia, Taiwan Semiconductor, Broadcom, and AMD. Gross profit margins hover below 40%, contrasting sharply with Taiwan Semi’s 55% and Nvidia’s 75%.
Production Efficiency Presents Ongoing Challenge
A significant portion of the margin disadvantage stems from manufacturing capabilities. Intel currently farms out roughly 30% of its wafer production to Taiwan Semiconductor while expanding internal fabrication capacity. Yield rates on its cutting-edge manufacturing process are estimated around 70%, compared to Taiwan Semi’s 90%.
Should these yields climb as the technology matures, profitability margins would likely follow suit. Analyst Reitzes forecasts Intel could generate $7 in earnings per share by 2029. Applying a standard semiconductor industry multiple of 22 times forward earnings produces a theoretical price target of $150.
Wall Street sentiment remains measured. Roughly one in five analysts tracking Intel maintains a Buy recommendation, significantly trailing the S&P 500 average of 55%. The consensus target price stands at $51.25—markedly below current trading levels.
Institutional money managers are quietly building positions. ZEGA Investments established a fresh stake during Q4. Executive Vice President David Zinsner purchased approximately $250,000 in shares this past January.
Intel will announce Q1 2026 results on April 23.


Key Takeaways
- Amazon shares reached $250.56, sitting just 1.4% beneath the record closing high of $254.
- The e-commerce giant’s stock has climbed 20% during April, finishing higher in nine out of the past 10 trading days.
- Truist Securities lifted its target to $285, forecasting 25% AWS revenue expansion in Q1.
- TD Cowen analyst John Blackledge maintained his Buy stance with a $300 target price.
- Amazon announced plans to purchase Globalstar for approximately $12 billion and partnered with Apple on satellite services.
Amazon has been building impressive momentum over recent weeks. Shares concluded Friday’s session at $250.56 — the highest closing price since November 3, 2025 — leaving the stock within striking distance of its all-time record close of $254, just 1.4% away.
The upward trajectory has been consistent and methodical. AMZN shares have finished in positive territory for nine of the last ten trading sessions, accumulating a remarkable 20% gain throughout April. For the year, the stock has advanced approximately 8.6%.
As Amazon prepares to report Q1 results on April 29, investor focus has intensified. Wall Street analysts are projecting earnings per share of $1.63 — a slight uptick from the $1.59 posted in the same period last year — alongside total revenue of approximately $177 billion, marking roughly 14% year-over-year expansion.
Truist Securities analyst Youssef Squali upgraded his price objective Friday to $285 from $280, reaffirming his Buy recommendation. His forecast anticipates AWS revenue climbing 25% in Q1, representing an acceleration from the 23% growth achieved in Q4 2024, fueled by expanding AI collaborations with companies including OpenAI and Anthropic.
Squali further projects North America marketplace revenue will expand approximately 10% compared to last year, characterizing economic pressures such as elevated fuel prices as “manageable” assuming they remain temporary.
Financial commentator Jim Cramer offered his perspective over the weekend, labeling Amazon “ascendant” while drawing a sharp contrast with Microsoft, which he characterized as becoming viewed as a “chronic underperformer.” Cramer positioned Amazon as the superior investment choice currently, citing its growth momentum against Microsoft’s decelerating revenue trends.
Wall Street Eyes $300 Price Level
John Blackledge from TD Cowen, recognized as a 5-star analyst, reaffirmed his Buy recommendation alongside a $300 price objective — representing approximately 20% potential upside from Friday’s closing price. His projections suggest Q1 revenue will marginally exceed consensus estimates, with operating income tracking roughly 4% ahead of expectations.
Blackledge highlights high-margin advertising revenue and AWS as primary profit catalysts, supplemented by ongoing improvements in fulfillment operations.
Looking toward Q2 2026, his revenue forecast sits 1.5% above Street consensus while his operating income estimate runs 5% higher — indicating expectations for continued AWS growth acceleration.
Across Wall Street, Amazon commands a Strong Buy consensus rating derived from 42 Buy recommendations and only 3 Hold ratings. The average analyst price target registers at $284.77, suggesting approximately 14% upside potential from present levels.
During Q4 2025, AWS delivered 24% year-over-year revenue growth. CEO Andy Jassy characterized this performance as the division’s “fastest growth in 13 quarters” — a metric that analysts are incorporating heavily into their Q1 projections.
Amazon Enters Satellite Communications Market
Beyond the upcoming earnings report, Amazon executed a significant strategic transaction this week. Tuesday brought the announcement of an agreement to purchase Globalstar at an equivalent price of $90 per share — establishing a valuation approaching $12 billion for the satellite communications company.
This acquisition positions Amazon to develop its own space-based internet infrastructure, challenging the market dominance currently held by Elon Musk’s Starlink operation.
Additionally, Amazon finalized an arrangement with Apple to deliver satellite connectivity capabilities for existing and upcoming iPhone and Apple Watch products. This partnership leveraged a pre-existing Globalstar relationship that Apple had previously established.
The consensus Wall Street price target of $284.77 implies approximately 14% potential appreciation from AMZN’s latest closing price of $250.56.

Key Takeaways
- Oklo (OKLO) shares climbed 30% this week alongside NuScale Power (SMR), which also gained over 30%
- White House issued new directives to accelerate nuclear power development for space exploration
- Goals include an orbital reactor demonstration by December 2028 and a lunar-based system by 2030
- Oklo announced a significant board restructuring, bringing in four new directors with nuclear sector expertise
- The company recently missed earnings expectations while insiders sold more than $50M in shares over three months
Oklo experienced a breakout week as shares of the small modular reactor developer surged 30% across five consecutive trading sessions. The rally was fueled by favorable policy developments, industry-wide momentum, and internal governance changes.
The primary driver? New White House directives released this week focused on accelerating nuclear power technology for space applications. The roadmap establishes an orbital reactor demonstration target of December 2028, with a lunar surface reactor planned for 2030.
NuScale Power (SMR) experienced a parallel surge, climbing more than 30% during the same timeframe. Nano Nuclear Energy (NNE) advanced approximately 20%, while uranium miner Uranium Energy (UEC) posted gains of roughly 10%.
The nuclear energy sector has experienced sustained upward momentum, with consecutive positive sessions attracting significant investor interest.
Space Nuclear Initiative Sparks Market Enthusiasm
The White House directive provides investors with concrete milestones. The establishment of a 2028 orbital demonstration and 2030 lunar reactor creates specific timeframes for potential contract awards and supply chain development.
Andrew Chanin, co-founder and CEO of ProcureAM, explained to Yahoo Finance that dependable power sources are essential for space infrastructure. “Lunar bases, orbiting space stations, orbiting data centers — all these require energy,” he noted.
The sector’s momentum also benefited from NASA’s successful Artemis II lunar flyby mission, which concluded earlier this month and maintained space exploration in the investment spotlight.
Oklo simultaneously announced a board overhaul this week, appointing four new directors with nuclear engineering and industrial expertise. The company designated a Lead Independent Director and transitioned its CTO to a senior technical advisory position. Market participants interpreted these moves as signals of increased operational focus.
Underlying Financials Present Challenges
Despite the stock’s impressive run, the company’s financial performance reveals ongoing challenges.
Oklo fell short of its latest quarterly expectations, reporting a per-share loss of $0.27 versus analyst projections of -$0.17. Wall Street currently anticipates a full-year EPS of -$8.20.
Recent insider transactions have drawn attention. CEO Jacob DeWitte disposed of 140,000 shares in February at $75.18 per share, totaling approximately $10.5 million. CFO Richard Bealmear sold 72,090 shares in March at $60 per share. Collectively, insiders have sold over $50.8 million in stock during the past 90 days.
Among institutional investors, Sumitomo Mitsui Trust Group established a new stake in Q4, acquiring 222,510 shares valued at roughly $15.97 million. Institutional ownership now represents approximately 85% of outstanding shares.
Wall Street analysts remain divided. Citigroup reduced its price objective from $95 to $73.50 while maintaining a neutral stance. Canaccord Genuity lowered its target from $175 to $125 but retained a buy rating. The consensus rating stands at “Moderate Buy” with an average price target of $84.30.
OKLO began trading Friday at $66.92, within its 52-week range of $19.89 to $193.84.
Crypto World
Solana (SOL) Surges Past Ethereum in Transaction Volume as Network Adds 1.5M Monthly Users

Key Highlights
- SOL rallied 10% over a five-day period, reaching its highest level in three weeks on Friday
- Open interest in futures contracts increased from $3.5B to $4.2B within seven days
- The token has lagged behind the wider cryptocurrency market by 13% year-to-date in 2026
- The Solana network has attracted 1.5 million additional daily active users each month during Q1
- Several Solana-based memecoins surged over 40% from Wednesday through Friday
The price of Solana’s SOL token experienced a 10% increase across a five-day trading window, touching a three-week peak on Friday. This upward momentum followed announcements from the United States and Iran regarding an extended ceasefire agreement, which triggered an 8% decline in Brent crude oil valuations and boosted risk appetite throughout cryptocurrency markets.
Currently, SOL is changing hands in the $84–$85 range, with market participants monitoring whether the psychological $100 threshold represents the next significant price objective.
The aggregate open interest across SOL futures contracts expanded from $3.5 billion last Sunday to $4.2 billion by Friday—representing a 20% increase within a single week. This expansion signals heightened engagement from leveraged market participants spanning both institutional investors and retail traders.
However, despite this upward price action, the annualized funding rate for SOL perpetual futures contracts remains at approximately 3%. This figure falls short of the 5–10% neutral bandwidth, suggesting that bullish traders have yet to demonstrate overwhelming confidence. Nevertheless, it represents a substantial improvement from the extreme pessimism witnessed on April 7, when SOL traded beneath the $80 level.
Throughout 2026, SOL has delivered returns 13% below those of the broader cryptocurrency market. Reduced activity across decentralized applications (DApps) built on the network has contributed to this underperformance.
Weekly revenue generated by DApps on the Solana blockchain currently hovers around $16 million, representing a decline from previous peaks. To provide perspective, Ethereum-based DApps generated $10 million in revenue last week, while BNB Chain DApps produced $4 million—indicating that diminished DApp revenue represents an industry-wide phenomenon rather than a Solana-specific challenge.
Memecoin Trading Volume Accelerates
Numerous memecoins operating on the Solana blockchain recorded gains exceeding 40% during the Wednesday-to-Friday trading window. Historically, increased memecoin trading activity has correlated positively with SOL price appreciation, especially following the early 2025 memecoin boom that positioned Solana as the dominant platform for user engagement after the Official Trump memecoin deployment.
Solana maintains its leadership position in decentralized exchange (DEX) trading volume and currently ranks as the second-largest blockchain by Total Value Locked across all networks.
The Solana blockchain processed approximately 9 billion transactions during the previous month, significantly outpacing Ethereum’s 69 million transactions. Cumulatively, Solana has now settled over 500 billion transactions compared to Ethereum’s 3 billion. Its architectural design prioritizing speed, minimal fees, and high throughput positions it favorably for applications in gaming, trading platforms, and financial service offerings.
Additionally, Solana has established a stablecoin settlement collaboration with Visa, securing its presence within the developing blockchain-based payments sector.
Network User Base Expands Steadily
Throughout the previous quarter, the Solana ecosystem successfully onboarded 1.5 million new daily active users each month. This growth trajectory persisted even as SOL’s market price declined from $293 to approximately $83 during the period of heightened Middle East geopolitical tensions.
Data from prediction markets showed the April 16 price target of $110 trading at 100% YES probability, while the April 30 target of $150 remains active with approximately 15% implied probability. Trading volume within these prediction markets remains limited, meaning the probability estimates could experience rapid shifts following any substantial order flow.
As of Friday’s trading session, SOL was valued around $85, with total open interest standing at $4.2 billion as memecoin trading activity continues to generate upward momentum in futures market demand.
Key Takeaways
- California federal court dismissed securities fraud lawsuit targeting Caitlyn Jenner’s JENNER memecoin
- Token failed to satisfy Howey Test criteria required for security classification
- British investor Lee Greenfield reported losses exceeding $40,000 from token purchases
- Court determined absence of “common enterprise” among token purchasers
- Non-federal claims under California law transferred to state court jurisdiction
A federal court has delivered a legal victory to Caitlyn Jenner by dismissing a class-action lawsuit alleging her JENNER memecoin constituted an unregistered security.
A federal judge ruled Caitlyn Jenner’s $JENNER memecoin is not a security, dismissing a class action lawsuit from a buyer who lost $40K.
The court found the token failed the Howey Test’s “common enterprise” requirement. pic.twitter.com/UGQUs2YYzo
— Token Metrics (@tokenmetricsinc) April 17, 2026
The decision came Thursday from California federal judge Stanley Blumenfeld Jr., who determined the plaintiffs failed to demonstrate that the JENNER token satisfied the legal criteria for a security.
At the heart of the case was the Howey Test, a legal framework established by a 1946 Supreme Court decision. This test requires an investment contract to include capital invested in a collective venture with profit expectations derived from the efforts of others.
Judge Blumenfeld concluded that the token failed to satisfy two of the three Howey Test components. Specifically, he found insufficient evidence establishing a “common enterprise” linking JENNER token purchasers.
The primary plaintiff, Lee Greenfield from the United Kingdom, claimed losses surpassing $40,000 from purchasing the token across both Solana and Ethereum networks during May 2024.
Greenfield’s legal team contended that Jenner exploited her fame to promote the token. The filing cited an X platform post featuring an AI-created image depicting Jenner wearing a “JENNER ETH” shirt, used to market the cryptocurrency to potential buyers.
The initial legal action was brought in November 2024 against both Jenner and her manager Sophia Hutchins. Hutchins passed away in July 2025.
The revised complaint claimed investors had collectively pooled their resources based on Jenner’s promise that a 3% transaction fee would finance token repurchases, promotional activities, political donations to Donald Trump’s campaign, and fractional ownership shares in her Olympic gold medal.
Court Rejects Common Enterprise Claim
Judge Blumenfeld dismissed the pooling theory presented by plaintiffs. His ruling stated the allegations failed to establish that investors had agreed to share profits and losses or combine resources beyond the simple act of purchasing the cryptocurrency.
The Olympic medal ownership initiative was revealed in August 2024, occurring after Greenfield had already completed his token purchases, and ultimately never materialized.
The court further determined that Jenner’s promotional efforts alone were insufficient to constitute a common enterprise under securities law.
JENNER Token History
The JENNER token debuted on the Solana blockchain in May 2024 via the Pump.fun platform. Controversy erupted immediately when Jenner and other celebrity endorsers alleged they had been defrauded by a partner identified as Sahil Arora.
Jenner subsequently relaunched the token on the Ethereum network. Investors asserted this migration negatively impacted the original Solana version’s market value.
The cryptocurrency reached its peak market capitalization of approximately $7.5 million in June 2024. Since then, its value has collapsed, losing virtually all market worth.
Case Outcome and Future Proceedings
The court rejected the plaintiff’s motion to file a third amended version of their complaint. Claims based on California state law regarding contract violations and fraud were transferred to state court for potential further proceedings.

Key Highlights
- Shares of Boeing advanced more than 2% Friday following announcements that CH-47 Chinook helicopters will receive drone swarm deployment capabilities.
- A contract worth approximately $324M from the U.S. Army for Chinook helicopters strengthened Boeing’s defense order book.
- Millennium Space Systems and Boeing introduced a mid-class satellite platform with plans for approximately 26 units in 2026.
- Oak Harvest Investment Services expanded its Boeing position by 44.5% during Q4, bringing holdings to 28,933 shares valued at approximately $6.28M.
- Analysts maintain a “Moderate Buy” rating on BA stock with a consensus price target of $252.48.
Friday proved eventful for Boeing as shares gained more than 2% following several significant announcements across its defense and aerospace divisions.
The primary catalyst came from revelations that the CH-47 Chinook helicopter platform will receive substantial capability enhancements. Boeing is integrating what it describes as “launched effects” technology into the Chinook fleet — an umbrella term encompassing drones, electronic decoys, and loitering munitions. These capabilities can be deployed from both piloted and autonomous aircraft platforms.
The Chinook platform has maintained operational relevance for over 60 years and continues generating new orders. This technological enhancement aims to extend its strategic value. Reports indicate the U.S. Army has expressed substantial interest in these enhanced vertical-launch capabilities.
That interest translates into tangible financial commitments. The Army recently granted Boeing a contract valued at approximately $324 million for Chinook helicopters, bolstering the company’s defense sector pipeline. However, the program faces some uncertainty — congressional members have questioned the CH-47F Block II program’s trajectory, prompting Boeing to advocate for firmer Army commitments.
New Satellite Platform Unveiled
In aerospace developments, Boeing partnered with its Millennium Space Systems division to reveal a mid-class satellite platform designed for the “micro GEO” segment. The platform serves both defense and commercial markets, combining Boeing’s payload technology with Millennium’s accelerated manufacturing capabilities.
The initiative targets delivery of approximately 26 satellites throughout 2026. Boeing has been aggressively pursuing this market segment, and Millennium’s rapid production methodology provides competitive advantages as communications satellite demand accelerates.
Boeing’s most recent quarterly results exceeded market expectations considerably. The aerospace giant reported Q4 earnings per share of $9.92, substantially surpassing the consensus forecast of -$0.40. Quarterly revenue reached $23.95 billion — representing 57.1% year-over-year growth and exceeding the $22.41 billion analyst projection.
Despite the exceptional quarterly performance, Wall Street forecasts remain cautious with a projected -$2.58 EPS for the full fiscal year, creating a complex earnings outlook as the company approaches its April 22 Q1 earnings release.
On the manufacturing front, Boeing continues ramping workforce additions, hiring between 100 and 140 factory employees weekly to accelerate 737 MAX production and populate a newly established assembly line.
Institutional Activity Intensifies
Institutional stakeholders control 64.82% of Boeing’s outstanding shares. Oak Harvest Investment Services increased its position by 44.5% in the fourth quarter, elevating holdings to 28,933 shares with an approximate value of $6.28 million. Multiple additional institutional investors similarly expanded their Boeing allocations during Q3.
This institutional accumulation coincides with some insider divestment. Executive Vice President Howard McKenzie divested 10,497 shares in February at $233.99 each, while Senior Vice President Ann Schmidt sold 6,281 shares at $243.37. Collectively, company insiders have sold 21,012 shares totaling approximately $4.98 million over the past 90 days.
Boeing commenced Friday trading at $223.17. The stock’s 52-week trading range extends from $156.47 to $254.35. The 50-day moving average currently stands at $219.27.
Wall Street price targets span from the $252.48 consensus to $290.00 from Tigress Financial, which maintains a Buy rating. Susquehanna established a $280 target with a “positive” outlook, while Royal Bank of Canada elevated its target to $275 with an “outperform” designation.
Additionally, El Al expanded its 787 Dreamliner order by six aircraft this week, contributing incremental demand to Boeing’s widebody production backlog.

Why DeWalt’s New Power Tool Batteries Look Different Than What You Remember

Train nightmare at Manchester Piccadilly as Arsenal FC fans scramble to get to huge Man City clash

Tens of thousands gather outside Angolan capital for Pope Leo Mass


-
 NewsBeat6 days ago
Pep Guardiola and Gary Neville agree over Arsenal title problem that benefits Man City
-

 Crypto World6 days ago
The SEC Conditionalises DeFi Platforms to Be Avoided for Broker Registration
-

 Fashion2 days ago
Weekend Open Thread: Theodora Dress
-

 Politics7 days ago
World Cup exit makes Italy enter crisis mode
-

 Crypto World5 days ago
SEC Signals Exemption for Crypto Interfaces From Broker Registration
-

 News Videos4 days ago
Secure crypto trading starts with an FIU-registered
-

 Sports2 days ago
NWFL Suspends Two Players Over Post-Match Clash in Ado-Ekiti
-

 Crypto World5 days ago
SEC Proposes Certain Crypto Interfaces Don’t Need to Register as Brokers
-

 NewsBeat5 days ago
Trump and Pope Leo: Behind their disagreement over Iran war
-

 Politics2 days ago
Palestine barred from entering Canada for FIFA Congress
-

 Crypto World1 day ago
Russia Pushes Bill to Criminalize Unregistered Crypto Services
-

 Sports6 days ago
NWFL opens Pathway for new Clubs ahead of 2026 Season
-

 Crypto World6 days ago
Trump whales load up ahead of Mar-a-Lago luncheon.
-
 Business3 days ago
Creo Medical agree sale of its manufacturing operation
-
Business6 days ago
Kering slides after Morgan Stanley downgrade, Gucci woes loom
-
Crypto World6 days ago
Sei Network Enters Quiet Reset Phase as On-Chain Metrics Signal a Slowdown in 2026
-

 Tech6 days ago
Google adds E2E encryption to Gmail for iOS and Android enterprise users
-
 Entertainment5 days ago
Brand New Day’ Footage Reveals the Devastating Impact of ‘Now Way Home’
-

 Tech6 days ago
Apple glasses won’t go brand shopping like Meta did with Ray-Ban and Oakley
-
 Entertainment5 days ago
Karol G’s ‘Ultra Raunchy’ Coachella Set Gave ‘Satanic Vibes’
You must be logged in to post a comment Login