
Crypto World
Why India’s e-Rupee Could Go Global

India is transitioning its domestic e-rupee initiative from a controlled digital payments experiment into a strategic instrument aimed at reshaping cross-border trade, remittances, and tourism flows. The central bank-backed digital rupee, issued by the Reserve Bank of India (RBI) and tested in parallel retail and wholesale pilots, is increasingly framed as a sovereign settlement rail rather than a mere payment rail. As policymakers weigh connections with other countries’ CBDCs, New Delhi appears to be testing not only technology but the governance and regulatory architecture needed to support borderless, final settlements. The trajectory suggests the e-rupee could become a tool to streamline international money movements, while also tying India’s financial ambitions to broader geopolitical aims.
Key takeaways
-
The e-rupee has evolved from a domestic digital payment experiment into a strategic instrument intended to influence cross-border trade, remittances and tourism flows.
-
It represents sovereign digital money, enabling direct and final settlement without relying on multiple intermediaries for international payments.
-
India views cross-border CBDC use as a way to address long-standing inefficiencies in global payments, including high costs and slow settlement times.
-
Proposals to link the e-rupee with other countries’ CBDCs reflect India’s effort to simplify trade and tourism settlements using sovereign digital currencies.
-
RBI’s pilots in retail and wholesale contexts provide the groundwork for potential international corridors and interoperability studies with partners such as BRICS members.
India’s e-rupee is no longer confined to laboratory tests. It has become a central piece of the country’s financial planning, with policymakers discussing ways to extend the reach of the digital rupee beyond domestic borders. The goal is not to decouple from the global financial system but to offer a regulated, interoperable alternative that can reduce settlement times and costs for cross-border transactions, while ensuring sovereign oversight and financial stability. The RBI’s ongoing pilots for both retail and wholesale use cases—testing technology, delivery mechanisms, and practical applications—underscore a careful, phased approach to broader adoption. In parallel, discussions about linking the e-rupee to other CBDCs—especially those among BRICS members—signal a concrete intent to shorten settlement rails and simplify trade and tourism settlements through sovereign digital money.
The e-rupee in context: what it is and why it matters
The e-rupee is a digital form of the Indian rupee issued by the RBI, designed to function as central bank digital currency (CBDC) on par with physical cash. It operates much like digital cash kept in a wallet, with the central bank standing as the guarantor of its value. The RBI has been running pilot programs for both retail use (accessible to the public) and wholesale use (targeting institutional participants) to assess technology, distribution channels, and real-world usefulness. Unlike the Unified Payments Interface (UPI), which facilitates real-time transfers between bank accounts, the e-rupee represents the monetary asset itself, allowing direct, instantaneous and final settlement without a tangle of intermediaries.
Cross-border momentum for CBDCs has grown as central banks recognize that even seamless domestic payments can stall when pushed through international rails. In this context, the e-rupee offers a blueprint for a globally interoperable settlement layer that could reduce the reliance on dollar-dominated correspondent banking networks. The RBI’s forward-looking stance includes exploring linkages with other nations’ CBDCs to enable smoother cross-border exchange, trade, and tourism flows. Policy discussions have highlighted the potential value of connecting the e-rupee to partner currencies in a way that minimizes friction and preserves financial stability. For readers seeking foundational context, CBDCs are explained in Primer form here, with broader discussions on digital wallets and payments frameworks available from reputable explainer content.
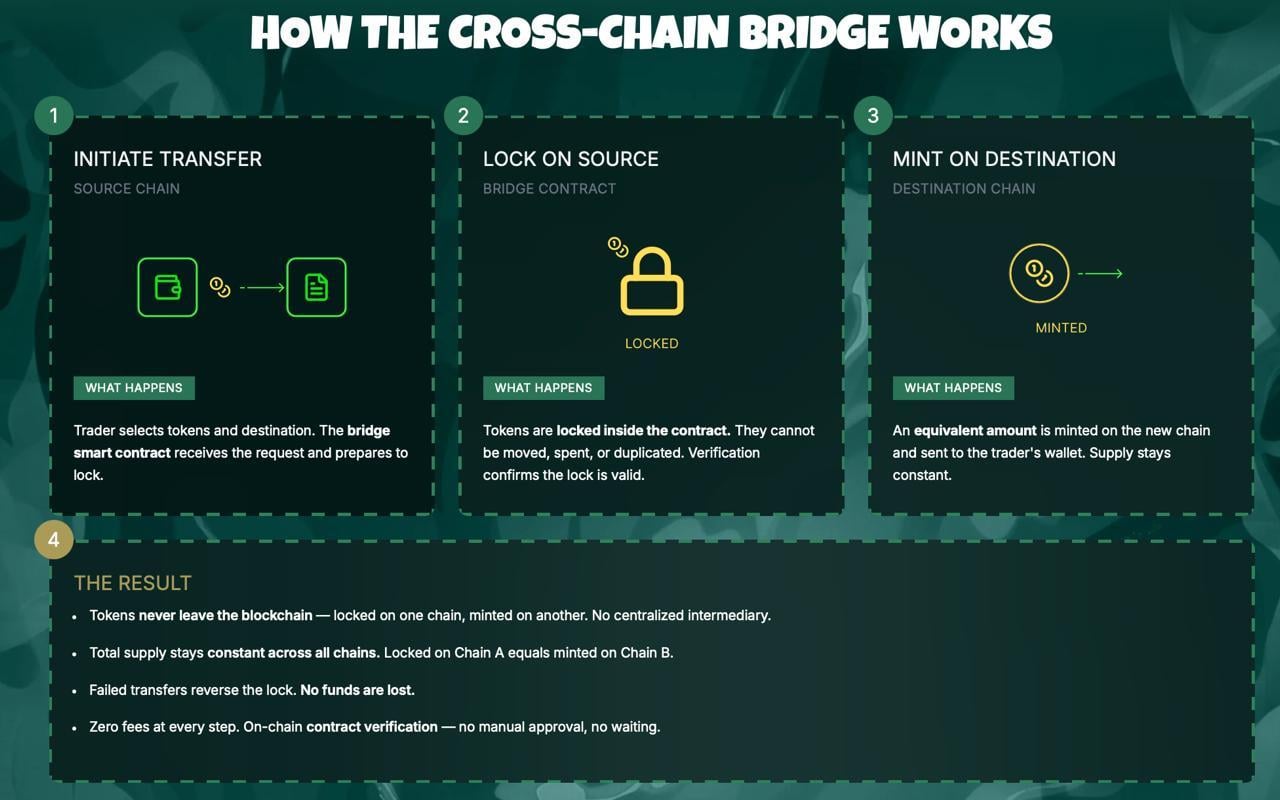
How cross-border e-rupee transactions could work
Experts outline several practical architectures to realize cross-border use of the e-rupee. These approaches aim to balance interoperability with regulation and technical readiness, while leveraging India’s established digital payment rails and governance standards.
-
Bilateral CBDC corridors: Direct agreements between two central banks to settle in e-rupees, including mechanisms for FX conversion and harmonized regulatory standards. This model emphasizes clarity of rules, risk controls, and settlement assurances between partner economies.
-
Multilateral platforms: A shared infrastructure that connects multiple CBDCs, echoing initiatives such as the multi-CBDC Bridge, designed to expand interoperability beyond bilateral lines and reduce the complexity of cross-border settlements.
-
Interfacing with domestic rails: Linking domestic payment networks with CBDC settlement to enable seamless, interoperable rails where the e-rupee underpins cross-border settlement while domestic payments retain their existing structures.
In practical terms, such designs aim to soften the traditional frictions that plague cross-border payments—high fees, opacity, and the need for pre-funded nostro accounts—by providing a sovereign settlement asset that can be used directly across borders. The BIS and other international bodies have documented how CBDC interoperability could reduce the capital locked in cross-border rails and unlock liquidity for lenders and traders alike. India’s strategy also contemplates a broader objective: to facilitate trade and tourism settlements using the rupee’s international footprint, while maintaining regulatory guardrails that protect financial stability and AML/CFT standards.
Barriers to global CBDC interoperability
Despite the promise, interoperability remains technically and geopolitically complex. Countries must converge on technology standards, governance models, and regulatory requirements, including anti-money-laundering (AML) and countering the financing of terrorism (CFT) controls. Differences in capital flow regimes, data protection rules, and dispute-resolution mechanisms add layers of complexity. A recurring challenge in CBDC pilots is settlement balance: one nation may accumulate excess holdings of another’s digital currency without synchronized outflows, creating risk that requires careful policy adjustment and liquidity management.
Beyond technical issues, geopolitical considerations shape how these schemes unfold. Initiatives to connect CBDCs across borders could draw responses from major currency issuers and influential trade partners, necessitating a diplomatic and robust regulatory approach. Several pilots emphasize tourism as a key use case: paying with sovereign digital money could simplify transactions for visitors who do not want or cannot open local bank accounts, a factor that adds practical appeal to cross-border adoption.
Key outcomes and milestones for the global e-rupee
For India, success would mean tangible improvements in the efficiency of cross-border payments, alongside broadening the rupee’s international role in trade and travel. Measurable milestones could include the launch of pilot corridors with strategic partners, refinements to regulatory frameworks, and broader participation from banks and fintechs in borderless settlements. The ultimate test will be proving that a sovereign digital currency can deliver real-world benefits—lower costs, faster settlement, and more transparent settlement data—without compromising monetary stability or financial integrity.
Positioning India in the future of money involves more than technology; it requires a coherent policy framework that can accommodate bilateral and multilateral arrangements while preserving financial system resilience. If successful, the e-rupee could alter how cross-border money flows are structured, potentially expanding the rupee’s reach in Asia and among BRICS partners, and shaping the next phase of digital money governance. While the path remains intricate and contingent on regulatory alignment, the ongoing dialogue surrounding cross-border CBDC links signals a decisive shift in how sovereign digital currencies may participate in global finance.
Why it matters
The move to expand the e-rupee beyond India’s borders matters for several stakeholders. For migrants and their families, a more direct settlement channel could cut remittance costs and speed up payments. For exporters and importers, interoperable CBDC settlements could reduce foreign exchange friction and improve liquidity. For policymakers, a globally connected e-rupee offers a test case for balancing innovation with financial stability, AML/CFT compliance, and data sovereignty. For banks and fintechs, cross-border CBDC rails could unlock new business models around settlement-as-a-service and interoperability-driven payments networks. In short, the e-rupee sits at the intersection of technology, regulation, and international finance, with implications for how digital money is governed and used in everyday commerce.
As this program evolves, observers will watch not only the technical performance of cross-border rails but also how regulatory cooperation and governance structures adapt to multi-country use. The outcome could influence both the pace of adoption and the design choices countries pursue as they explore sovereign digital currencies as a means to modernize cross-border financial infrastructure without undermining monetary sovereignty.
What to watch next
-
RBI announcements on cross-border CBDC pilots with strategic partners, including any BRICS-related linkages and regulatory updates.
-
Progress reports on bilateral CBDC corridors and multilateral platforms, with concrete timelines or pilot results.
-
Adoption milestones by banks and fintechs participating in wholesale or retail e-rupee testing, and any shifts in settlement timelines or cost metrics.
-
Regulatory and governance frameworks that address AML/CFT and data governance in cross-border CBDC settlements.
Sources & verification
- Official explanations of CBDCs and digital wallets (Cointelegraph: What are CBDCs? A beginner’s guide to central bank digital currencies).
- Cointelegraph explainer on crypto wallets and related wallet technologies (digital wallet concepts).
- Times of India article: “e-rupee circulation rises to Rs 1016 crore; RBI to explore cross-border CBDC pilots.”
- Bis: multi-CBDC Bridge overview and interoperability concepts.
- IBEF data on remittance flows and India’s status as a leading remittance recipient.
Global ambitions for India’s e-rupee: cross-border payments and policy bets
India’s central bank digital currency program is moving from controlled pilots to a broader narrative about how sovereign digital money can support international commerce. The e-rupee, anchored by the RBI, is becoming a potential settlement asset with direct applicability to cross-border remittances, trade, and tourism settlements. While domestic pilots continue to refine wallet experience, distribution, and security, the international dimension—via bilateral corridors, multilateral platforms, or domestic-foreign rail integrations—remains a central policy objective. The practical challenge is to harmonize technology standards, regulatory regimes, and governance frameworks across borders while preserving the instrument’s credibility and resilience. Continued transparency from RBI and sustained collaboration with partner central banks will be essential as proposals to connect CBDCs expand from concept to implementation.
In parallel, the global conversation around CBDCs is evolving. The examples and pilots outlined in international forums and industry analysis suggest that a successful cross-border e-rupee framework could reduce pre-funded liquidity requirements and streamline settlement in real time, potentially changing how banks manage liquidity and how businesses price cross-border services. The broader implication for the crypto and traditional financial ecosystems is a reshaping of the currency-agnostic settlement landscape—one that foregrounds sovereignty, regulatory clarity, and interoperability as core design principles.


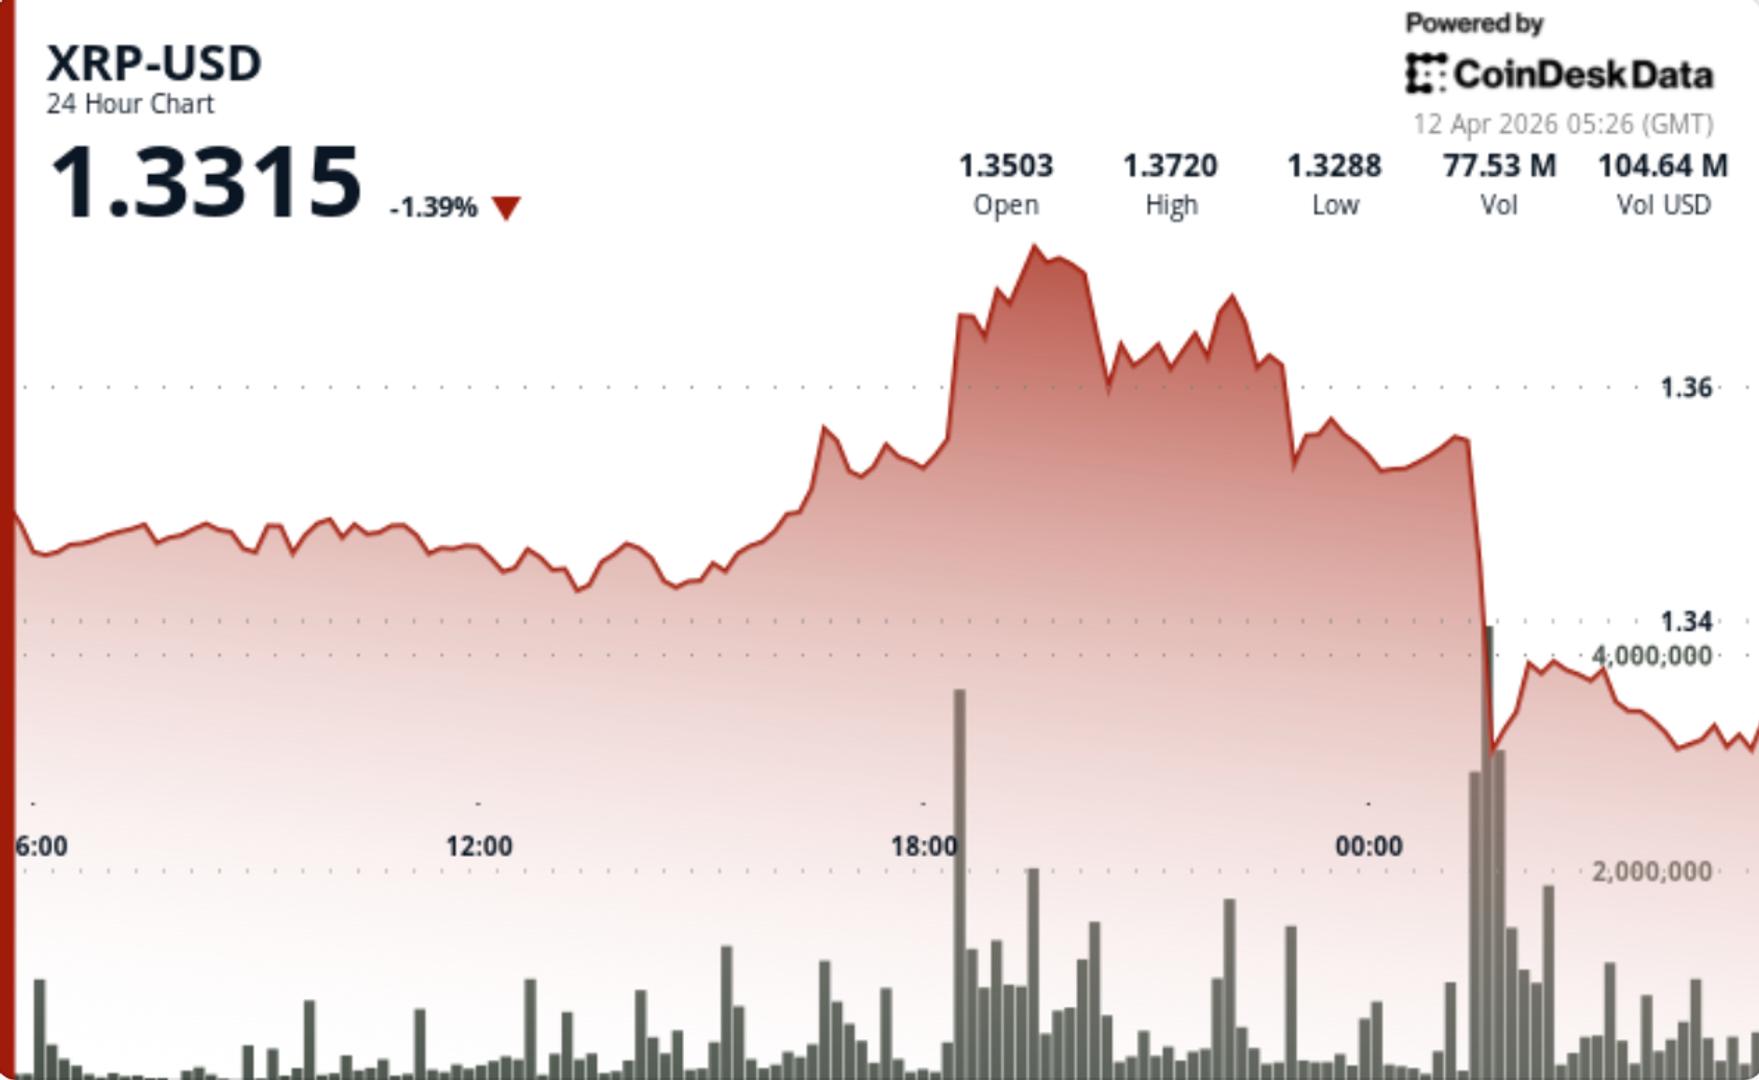
XRP saw a sharp breakdown in late trading, with a sudden wave of selling pushing price below key support. The speed of the move and lack of strong recovery suggest sellers are still in control, even as volatility compression points to a larger move ahead.
News Summary
• XRP fell from $1.36 to $1.33 in minutes, with a rapid spike in volume triggering a cascade of selling.
• The breakdown pushed price below $1.35, flipping it into resistance while upside remains capped near $1.41.
• Analysts remain split, with some calling for deeper downside while others still see a larger cycle recovery.
Market Overview
XRP declined 1.7% over the 24-hour period, but the headline move hides the real story, which is the intraday breakdown. Price was relatively stable before a sudden burst of selling hit, driving a quick drop through $1.35 and down toward $1.33.
The move came on extremely elevated volume, confirming it was not a thin liquidity move but a real flush. Once support gave way, price moved quickly, which is typical in current conditions where order books remain relatively shallow.
The bounce that followed was weak. XRP recovered slightly but failed to reclaim lost levels, forming a lower high and reinforcing the idea that the move was not just a temporary spike but a structural rejection.
Technical Analysis
The key signal is how quickly support failed and how weak the recovery has been. High volume on the way down, followed by fading volume on the bounce, typically points to distribution rather than accumulation.
XRP remains below key resistance levels and continues to trade within a broader downtrend. Indicators are mixed, with volatility compressing even as momentum weakens, creating the conditions for a larger move but without a clear direction yet.
This leaves the market in a familiar position where price is stuck between breakdown risk and the potential for a sharp reversal if resistance is reclaimed.
What traders should watch
• $1.35 is now the immediate pivot after breaking down, and price needs to reclaim it to stabilize.
• $1.40-$1.41 remains the key resistance zone that has capped multiple recovery attempts.
• On the downside, failure to hold $1.33 opens a move toward $1.32-$1.31, where the next demand zone sits.
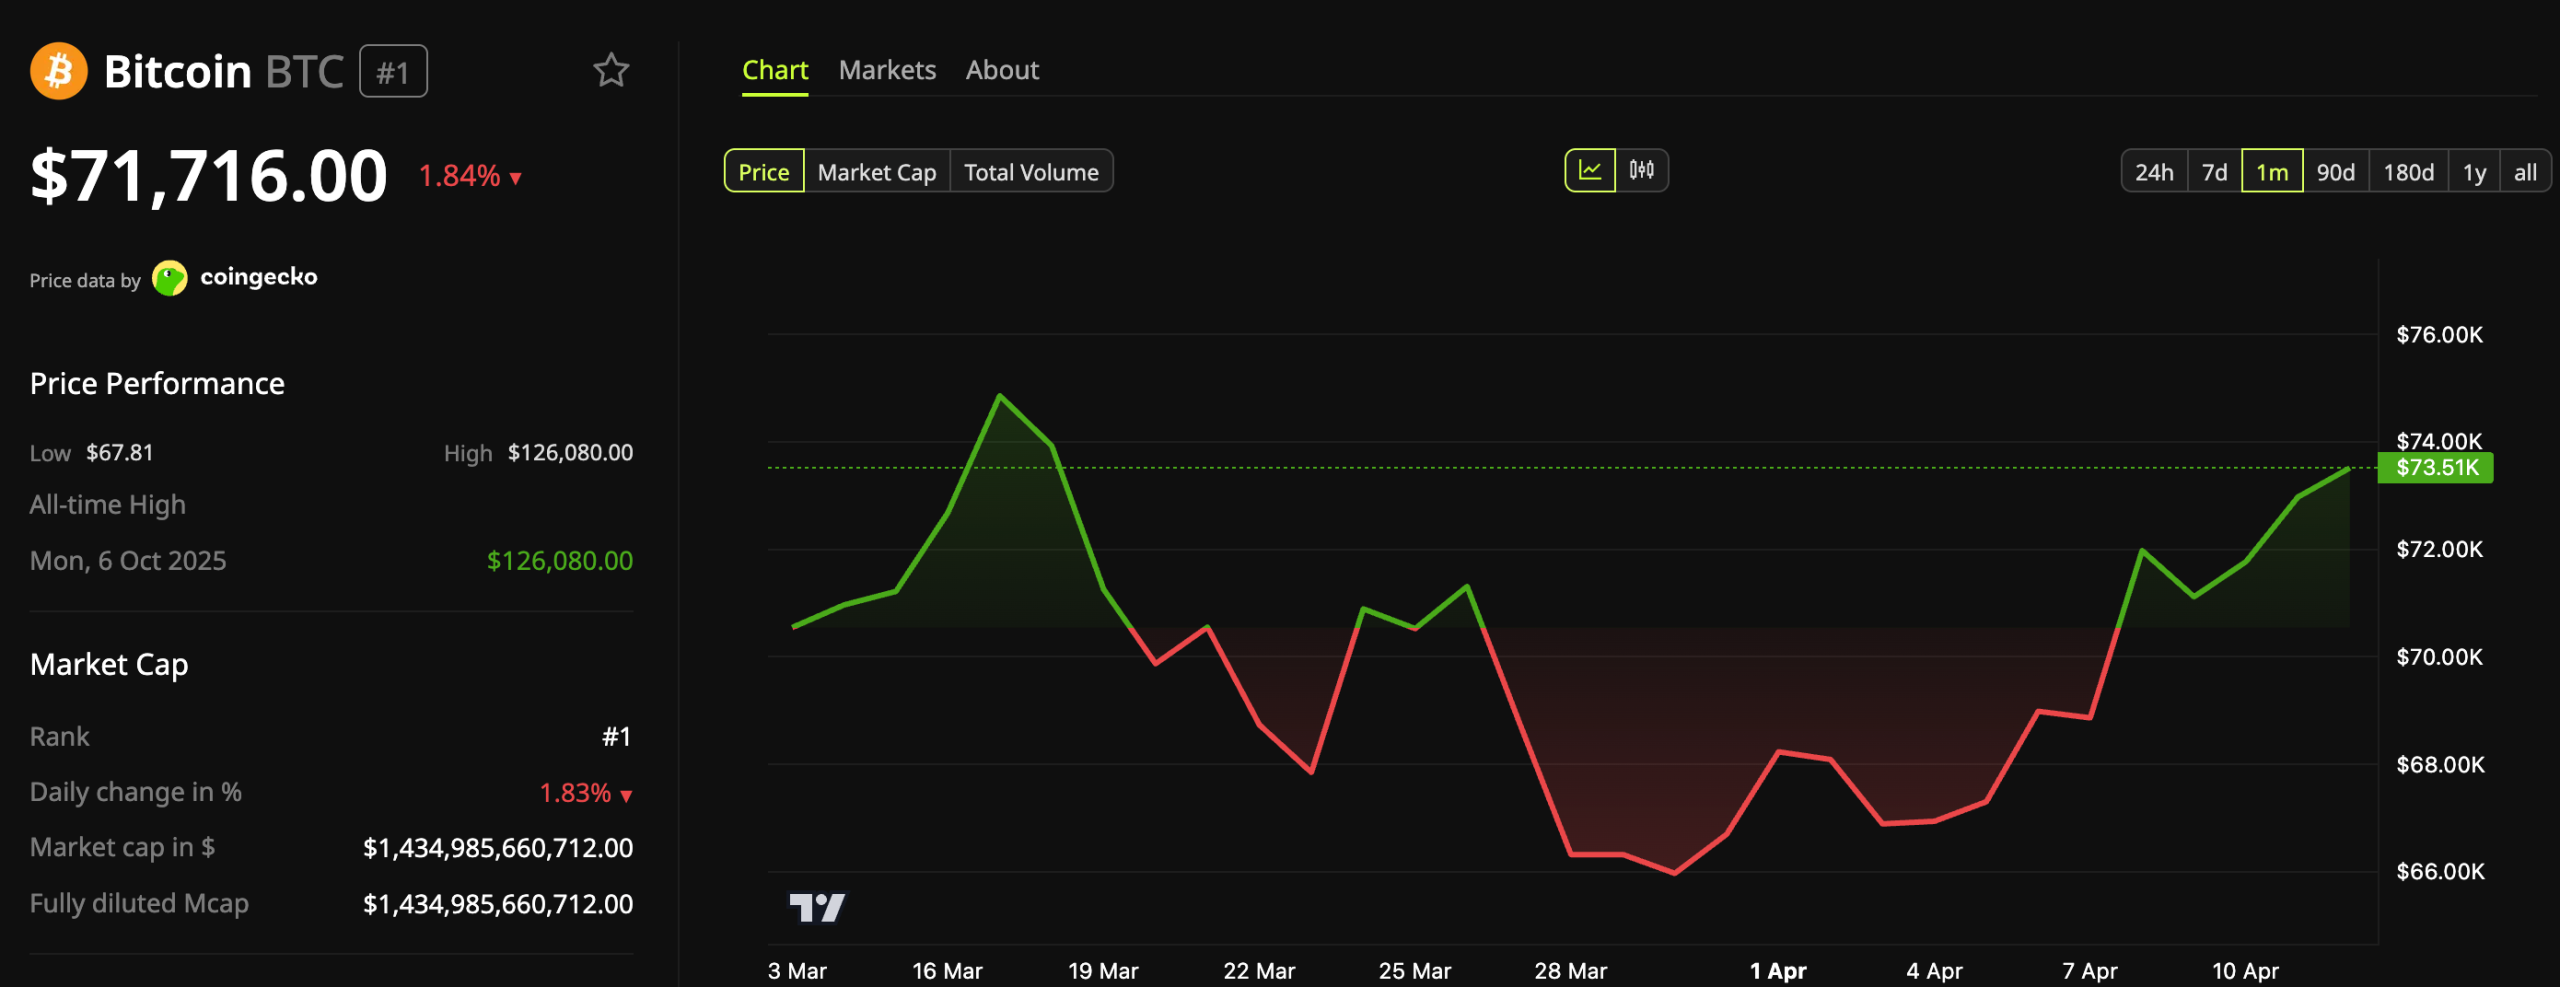
Bitcoin (BTC) reversed its Saturday rally and fell below $72,000 after the United States and Iran failed to reach an agreement following peace talks in Islamabad, Pakistan.
The largest cryptocurrency had climbed near $74,000 on Saturday before dropping to an intraday low of $71,168 during early Asian trading hours.
Bitcoin Drops as US-Iran Talks Fail After 21-Hour Islamabad Session
At press time, BTC traded at $71,716, down 1.84% over the past 24 hours.
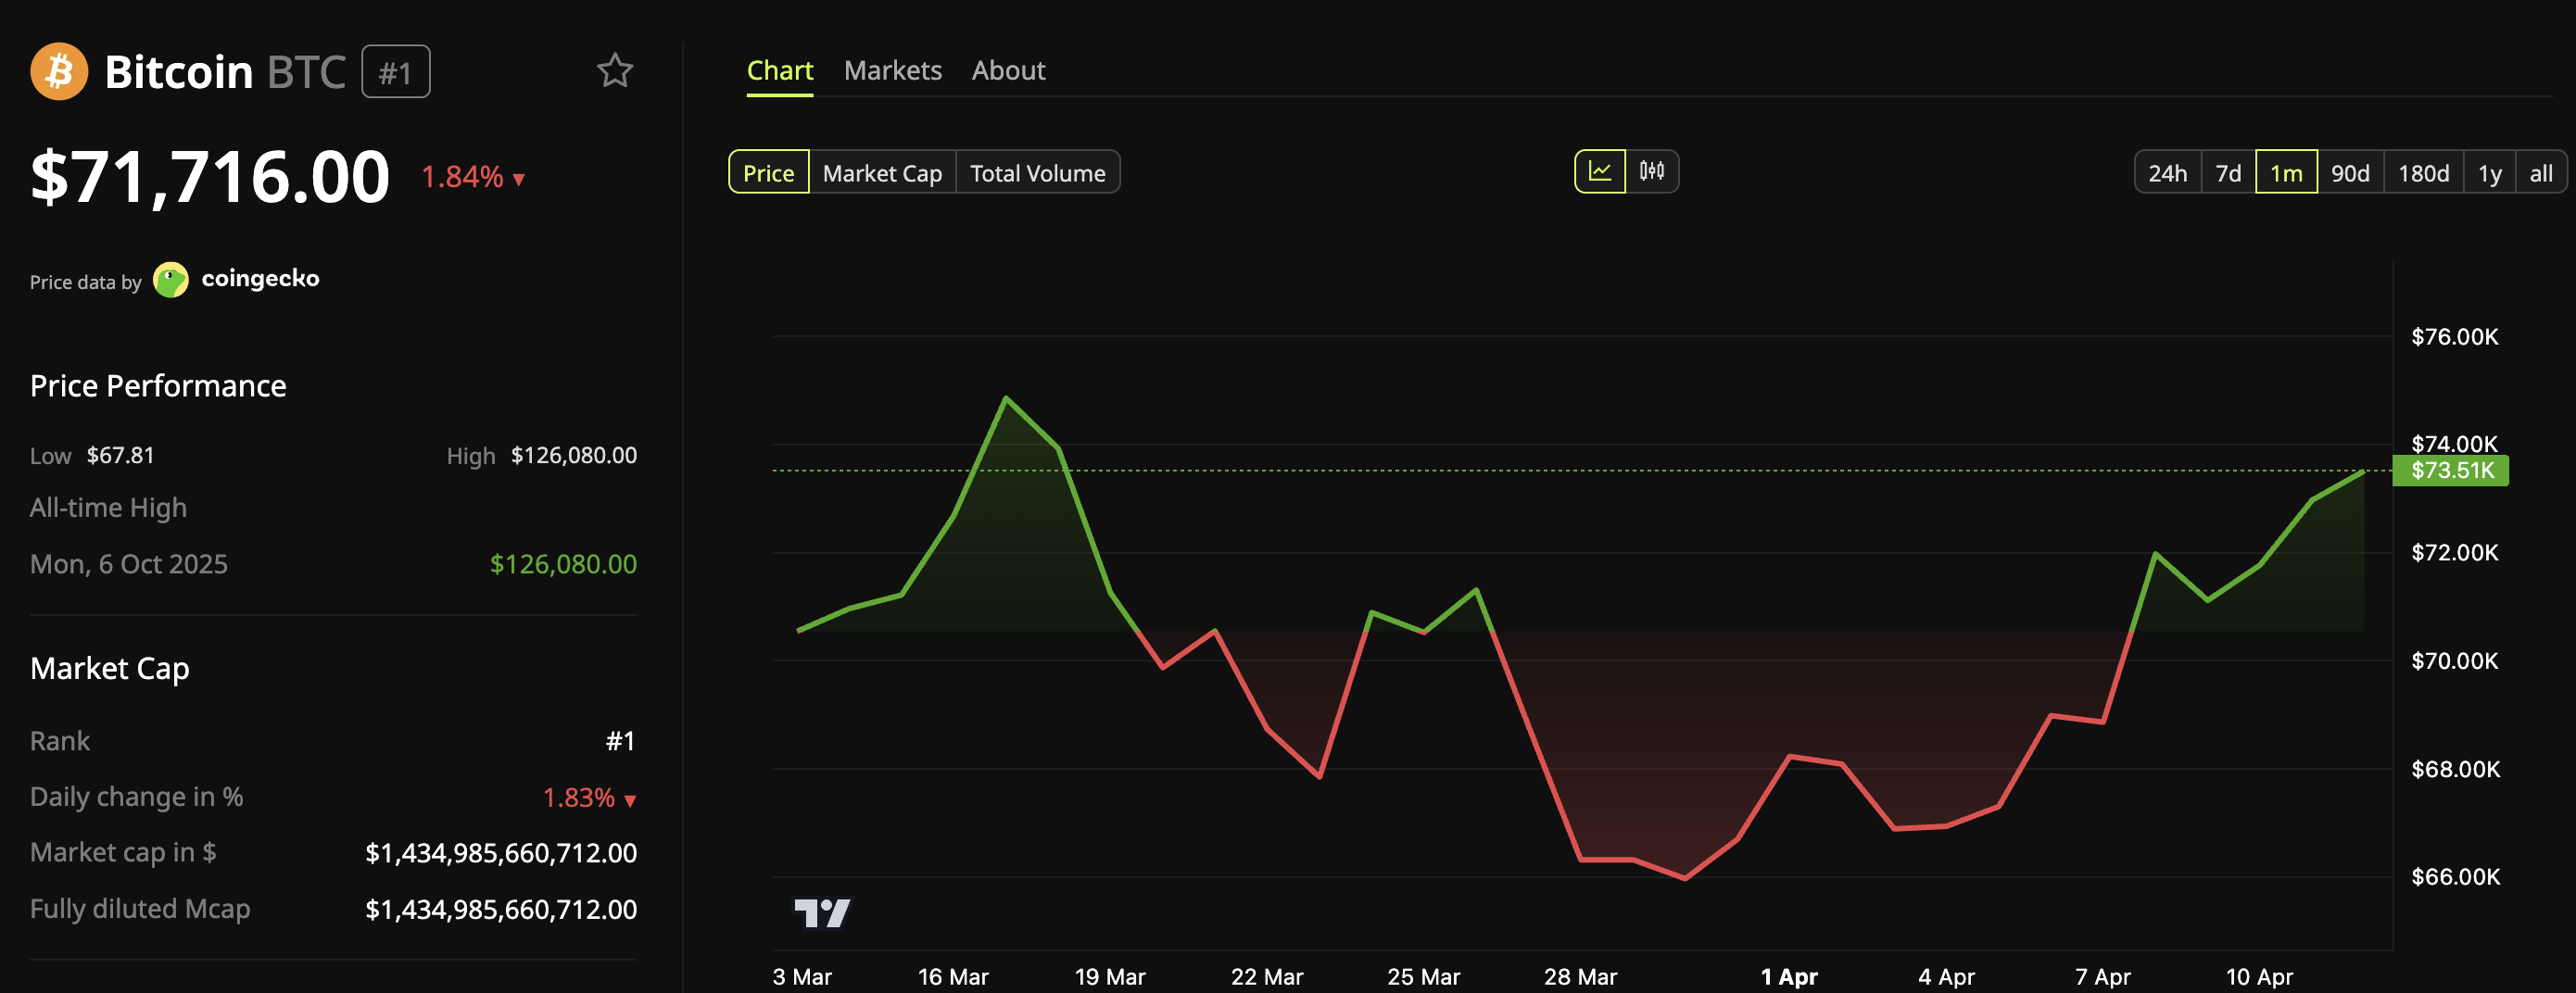
BeInCrypto Markets data showed that the broader crypto market cap also declined by 1.7%, with most major large-cap assets in the red. Ethereum (ETH) slipped to roughly $2,220, while XRP fell to $1.33, each shedding close to 2%.
BTC had gained ground earlier in the week after a two-week ceasefire was announced. However, the ceasefire remained fragile.
Israel continued airstrikes in Lebanon, and Iran announced crypto tolls on ships passing through the Strait of Hormuz. BeInCrypto also reported that, according to US officials, Tehran was unable to locate all the mines across the strait.
Two US Navy destroyers reportedly transited the Strait of Hormuz to begin mine-clearing operations, according to US Central Command. However, Iran rejected that claim outright.
Follow us on X to get the latest news as it happens
What Happened Between the US and Iran in Islamabad
The high-level negotiations between Washington and Tehran ended without producing a peace deal. Both sides offered competing explanations for the breakdown.
According to Fars news agency, any path to an agreement depends on Washington scaling back what Iran considers “unreasonable demands”. The control of the Strait of Hormuz and the nuclear program remain among several unresolved points of contention between the two sides.
“Despite various initiatives from the Iranian delegation, the unreasonable demands of the American side prevented the progress of the negotiations. Thus, the negotiations ended,” Iranian state broadcaster IRIB said in a post.
A source close to Iran’s negotiating team told Fars news agency that Washington sought concessions through diplomacy that it had been unable to secure from the war.
“The Americans needed the negotiation for their lost face in the international arena and were unwilling to lower their expectations despite the defeat and stalemate in the war with Iran,” the source said. “Iran has no plans for the next round of talks,” they mentioned.
On the US side, VP JD Vance held a brief press conference. He maintained that the American delegation was “quite accommodating and flexible.”
“The president told us, ‘You need to come here in good faith and make your best effort to get a deal.’ We did that, and unfortunately, we weren’t able to make any headway,” he said.
Vance emphasized that preventing Iran from developing nuclear weapons, both now and in the future, remains President Trump’s “core goal.” He left Pakistan after the briefing.
“So, look, we were constantly in communication with the team, because we were negotiating in good faith. And we leave here with a very simple proposal, a method of understanding that is our final and best offer. We’ll see if the Iranians accept it.”
The deadlock raises concerns about the fragile two-week ceasefire. However, Pakistan’s foreign minister has released a statement, urging both sides that it is “imperative that the parties continue to uphold their commitment to ceasefire”.
Subscribe to our YouTube channel to watch leaders and journalists provide expert insights
The post US-Iran Talks Breakdown, Bitcoin looses Weekend Gains appeared first on BeInCrypto.

TLDR:
- US intelligence confirms China is preparing MANPAD air defense shipments to Iran within weeks.
- Beijing is routing weapons through third countries to conceal origin and maintain plausible deniability.
- The transfer escalates beyond dual-use tech sales to direct government-to-government weapons delivery.
- Trump is set to meet Xi in Beijing next month as US-China tensions quietly build behind ceasefire talks.
Beijing has publicly taken credit for brokering the fragile US-Iran ceasefire, according to three sources familiar with US intelligence assessments.
The systems in question are MANPADS—shoulder-fired air defense missiles that threatened US aircraft throughout the five-week war. Shipments are reportedly being routed through third countries to conceal their Chinese origin.
China Prepares MANPAD Transfer To Iran While Ceasefire Holds
Three U.S intelligence sources familiar with recent assessments have confirmed to CNN that Beijing is preparing to deliver man-portable air defense systems, known as MANPADs, within the next few weeks.
The timing raises immediate questions. China claimed credit for helping broker the ceasefire that paused fighting between Iran and the US earlier this week.
Moving weapons to one side of that conflict during an active pause directly contradicts that public position. MANPADs presented a real threat to low-flying US military aircraft throughout the five-week war.
President Trump confirmed at a Monday press conference that an F-15 downed over Iran last week was struck by a shoulder-fired heat-seeking missile. Iran credited a new air defense system for that strike without identifying it further.
Two sources told CNN that Beijing is routing the shipments through third countries to conceal their origin. That approach preserves China’s ability to deny direct involvement and has been used in previous sanctions evasion cases.
A Chinese embassy spokesperson flatly denied the reporting, stating Beijing has never provided weapons to any party in the conflict.
Beijing’s Calculated Support For Iran Behind A Neutral Facade
Chinese companies have already been supplying Iran with sanctioned dual-use technology. That technology has helped Iran continue building weapons and improving navigation systems.
A direct government-to-government weapons transfer, however, would mark a clear escalation beyond those commercial arrangements.
One source described Beijing’s strategy as deliberate. China sees no value in openly entering the conflict against the US and Israel.
That path would be unwinnable and damaging to China’s broader standing. Instead, Beijing is quietly supporting Iran while maintaining the appearance of neutrality.
Iran supplies China with the bulk of its sanctioned oil, giving Beijing a firm economic reason to keep Tehran stable. Sources noted China could argue that air defense systems are defensive rather than offensive, distancing its support from Russia’s intelligence sharing that helped Iran target US forces.
Trump is set to meet President Xi in Beijing next month. High-level US-China talks took place during ceasefire negotiations this week.
Whether the reported shipment affects those diplomatic plans remains an open question as both governments continue engaging publicly.

Crypto World
Crypto News Proves the Market Is Alive as Coinbase Drops CLARITY Act Opposition and Pepeto Outpaces BNB and XRP in One Key Metric
Crypto news just delivered the clearest bullish signal of 2026 after Coinbase CEO Brian Armstrong publicly endorsed the CLARITY Act on April 9, removing the last major industry holdout standing between crypto and federal law according to 24/7 Wall St.
That means the regulatory path is open, institutional money is lining up, and Pepeto with $8.9 million in presale wallets, a running exchange, and a Binance listing is how to capture 150x before that wave hits.
Coinbase CEO Brian Armstrong reversed months of opposition and backed the CLARITY Act on April 9, the same day Treasury Secretary Scott Bessent called the bill a national security priority in the Wall Street Journal according to 24/7 Wall St.
SEC Chair Paul Atkins confirmed the SEC and CFTC are ready to implement the bill the moment Congress sends it forward.
The crypto news declaring death while Coinbase, the Treasury, and the SEC line up behind the same bill tells you everything about where this market is headed.
Regulatory Green Light, Institutional Flows, and the Presale Loading During Fear
Why Pepeto Is the Crypto News Answer Every Wallet Was Searching For
The Pepeto presale runs on a completely different model than standard launches. Each closed round lifts the cost and cuts the tokens still available. Wallets that entered early locked lower pricing because they committed before exchange tools were proven, and wallets entering today get a working platform but pay more.
This structure removes the guesswork of timing bottoms and replaces it with fixed entry windows where the terms are clear. Instead of fighting for allocation after the Binance listing opens, wallets race to lock position before it opens. That shift is why $8.9 million entered while most crypto news headlines read like obituaries.
PepetoSwap handles every trade without touching your balance, and the multi chain bridge transfers capital between Ethereum, BNB, and Solana at no cost so wallets never shrink from transfer charges. A SolidProof review confirmed every smart contract is clean, and a developer who ran Binance listing launches built the exchange debut path.
Staking at 185% APY grows holdings for wallets already committed while the crypto news audience reads doom headlines. At a presale price of $0.0000001863, the entry cost is visible and the Binance listing return is clear, and the working exchange behind this presale means the 150x math rests on real tools, not hype.
Binance Coin (BNB) Price at $606 as BNB Chain Extends Zero Fee Stablecoin Program
Binance Coin (BNB) holds $606 according to CoinMarketCap, up 0.4% on the day as BNB Chain extended its zero fee stablecoin program through April 30 covering over $4.5 million in gas costs.
BNB dropped 22% from its January high of $780 but outperformed Bitcoin’s 47% drawdown over the same stretch. From $606 with a previous peak above $1,370, the return measures in single digit percentages while the Pepeto presale gives 150x from one listing event, something BNB at an $83 billion cap cannot deliver.
Ripple (XRP) Price at $1.35 as CLARITY Act Nears Senate Vote
Ripple (XRP) trades at $1.35 according to CoinMarketCap after Armstrong’s endorsement cleared the last obstacle for the CLARITY Act, which would permanently classify XRP as a digital commodity.
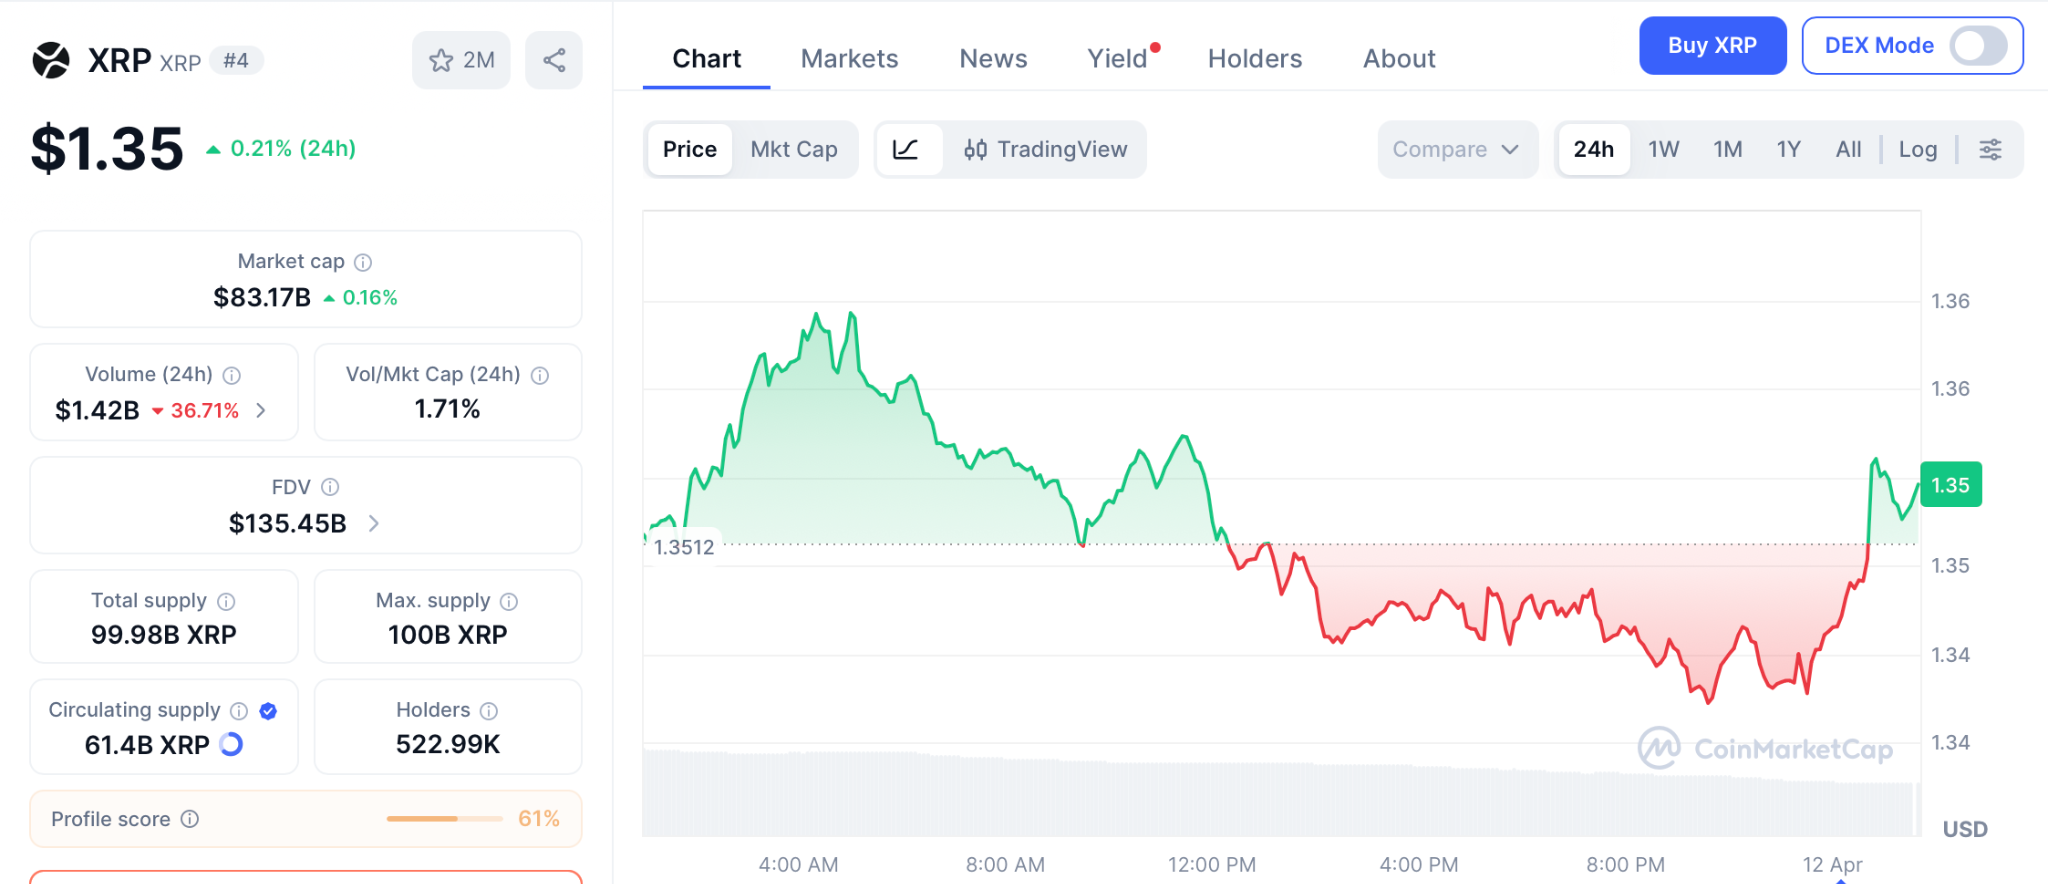
XRP sits 64% below its $3.65 high with support at $1.28 and resistance at $1.40. From $1.35 at an $83 billion cap, targets range from $2.00 to $2.80, solid for percentage gains but not 150x, and the presale delivers 150x from one listing event.
Conclusion
The way serious wallets choose entries has shifted completely this cycle. Cheap prices alone no longer determine which projects earn capital. Token distribution mechanics and operational transparency now drive where money goes.
Looking for crypto news brought you here, and Pepeto is what that search was pointing to, because the working exchange means the 150x math is built on real products and BNB at $606 or XRP at $1.35 cannot deliver in a full year what one listing event delivers to presale holders.
The investors who enter the presale right now hold the same position early BNB buyers had before the exchange opened, the position that turned small entries into wealth that made every financial choice after it easy, and the presale is still accepting entries at a price the Binance listing erases the moment it goes live.
Click To Visit Pepeto Website To Enter The Presale

FAQs
What does crypto news say about institutional adoption after the CLARITY Act breakthrough?
Coinbase, the Treasury, and the SEC all endorsed the CLARITY Act in the same week, proving crypto is entering regulated infrastructure status. Pepeto at presale pricing with a Binance listing carries the 150x that regulated products cannot access.
Is Binance Coin a better buy than presale entries at BNB’s current price of $606?
Binance Coin (BNB) trades at $606 with an $83 billion cap and single digit upside to resistance at $650. Pepeto through the Pepeto official website offers presale entry and listing event returns that BNB at this size cannot produce.
Disclaimer: This is a Press Release provided by a third party who is responsible for the content. Please conduct your own research before taking any action based on the content.
TLDR:
- Microsoft trades near $370 after a prolonged downtrend, with weak consolidation signaling limited buyer strength.
- Meta rebounds from $540 lows as RSI improves, though price still faces resistance near the $640–660 range.
- Microsoft remains below key resistance levels, keeping the broader bearish structure intact for now.
- Meta shows early recovery signs, but failure to break higher could lead to another support retest.
U.S. technology stocks are trading below prior peaks as volatility persists across major indices. Recent market commentary points to valuation compression among leading firms, with Microsoft and Meta Platforms drawing attention for relative pricing and shifting price structures.
Microsoft Extends Downtrend as Key Support Faces Pressure
Market analyst Ali Charts recently noted that Microsoft trades about 30% below its all-time high. The stock currently holds a price-to-earnings ratio near 23x, placing it among the lower valuations within the “Magnificent 7” group.
The daily chart structure reflects a clear transition from bullish momentum into a sustained downtrend. Between May and July 2025, Microsoft advanced strongly, forming consistently higher highs and higher lows.
However, that structure weakened between August and November as repeated rejections appeared near the $540–$560 range.
Selling pressure intensified after a breakdown below the $500 level in November 2025. The move confirmed a broader trend reversal, followed by continued declines into the $400 region. Subsequent rebounds failed to hold, with price action forming lower highs throughout early 2026.
As of April 2026, the stock trades near $370, where consolidation remains weak. Candlestick bodies have narrowed, showing reduced momentum. At the same time, recovery attempts lack follow-through, indicating limited buyer strength at current levels.
Key resistance stands between $400 and $420, where previous attempts have stalled. A higher resistance band exists around $480–$500, now acting as a supply zone.
On the downside, the $360–$370 area serves as immediate support. A break below this range may expose the $340 level.
Meta Tests Recovery as Momentum Gradually Improves
Ali Charts also pointed out that Meta trades about 22% below its peak, while revenue has increased 22% year-over-year. The stock shows a different structure compared to Microsoft, with more range-bound movement and early signs of stabilization.
Price action throughout 2025 shows a strong rally between May and August, where Meta climbed toward the $780–$800 zone. That move was followed by a prolonged distribution phase, where multiple breakout attempts failed near the highs.
From November 2025 to March 2026, the stock entered a controlled decline. Prices moved within a defined range between roughly $720 and $560. Lower highs remained intact during this phase, though selling pressure appeared less aggressive compared to Microsoft.
In April 2026, Meta trades around $630 after rebounding from the $540 level. The move reflects a recovery attempt, supported by improving momentum indicators. The Relative Strength Index has risen from oversold levels near 25–30 to around 57, signaling a shift in short-term strength.
Even so, resistance remains firm between $640 and $660. A broader supply zone sits between $700 and $720, where previous rallies stalled. On the downside, support is seen between $580 and $600, with stronger demand near $540.
The current structure places Meta at a decision point. A move above $660 could open the path toward higher levels, while rejection may lead to another test of lower support zones.
TLDR:
- Nasdaq and Russell 2000 have fully recovered losses from the March selloff, rising nearly 9% from recent lows.
- Strong liquidity conditions and rising global M2 supply continue to support equity market resilience and recovery.
- ISM data holding above 52 for three months signals steady economic activity backing market strength.
- Large-cap stocks lead the recovery while small caps follow, reflecting improving but cautious risk appetite.
U.S. equities have staged a swift recovery, with major indices erasing losses linked to recent geopolitical tensions. Market data shows both large-cap and small-cap benchmarks rebounding sharply, supported by strong liquidity conditions and steady macroeconomic signals.
Nasdaq Leads Recovery as Large Caps Approach Record Levels
A recent post by Bull Theory noted that both the Nasdaq 100 and Russell 2000 have fully recovered from declines tied to the US-Iran conflict. The Nasdaq 100, in particular, has climbed back near its all-time highs after a sharp March 2026 drop.
Weekly data shows the Nasdaq opened at 24,143 and closed at 25,116, after reaching a high of 25,226. The index had fallen toward the 23,000 level during the geopolitical selloff. However, buyers returned quickly, pushing prices back above key support at 24,000.
The broader trend remains upward, with the index rising from around 16,500 to near 26,000 before the correction.
Earlier disruptions, including tariff-related concerns in 2025, did not slow the longer-term move. Instead, price action shows consistent recovery patterns after each macro-driven decline.
Current levels place the Nasdaq close to resistance between 25,500 and 26,000. Market behavior suggests continued strength, with multiple bullish weekly candles forming after the March low. This pattern reflects sustained demand, particularly in large-cap technology stocks.
At the same time, the speed of the rebound indicates that market participants are responding more to liquidity conditions than short-term geopolitical risks. The absence of extended consolidation also points to strong underlying momentum.
Russell 2000 Follows With Steady Gains as Risk Appetite Builds
The Russell 2000 has also recovered, though it remains slightly below its previous highs. According to the Bull Theory update, the index is up roughly 9% from its March bottom, mirroring the Nasdaq’s recovery pace.
Weekly figures show the Russell opened at 2,527 and closed at 2,630, with a high of 2,646. During the March decline, it dropped toward the 2,400–2,450 range. That move marked an approximate 11% pullback before buyers stepped in.
The index has since reclaimed the 2,600 level, supported by a series of strong weekly gains. Still, it trails the Nasdaq in reaching its peak, with resistance seen between 2,650 and 2,700. This slower recovery aligns with typical market behavior, where large caps often lead before smaller stocks catch up.
Earlier tariff-related volatility in 2025 also triggered a sharp dip near 1,800, followed by a rapid rebound. That pattern has repeated, reinforcing the view that recent declines were driven by external shocks rather than internal weakness.
Across both indices, synchronized movements suggest a shared macro influence rather than isolated sector stress. The quick recovery from the March selloff reflects stable demand conditions and continued capital flow into equities.
Supporting data adds context to the rebound. Global M2 money supply has reached record levels, while ISM readings have stayed above 52 for three straight months. Inflation trends also remain contained, near multi-year lows.
As markets approach resistance zones, price action around these levels will guide the next phase. A sustained move above recent highs could extend the rally, while rejection may lead to a consolidation range.
TLDR:
- Bitwise’s amended ETF filing has boosted sentiment, driving HYPE close to a key resistance zone near 43.
- Price structure shows a clear shift from a bearish trend to higher highs, confirming a developing bullish phase.
- RSI nearing 70 and price above the upper Bollinger Band suggest strong momentum but rising short-term pressure.
- Holding above 42 support may open the path to 45 and 50, while a pullback could retest 40 or 38 levels.
Hyperliquid’s native token HYPE has surged after a fresh ETF filing by Bitwise, pushing prices toward key resistance.
Market data shows rising momentum, with traders watching whether the breakout sustains or pauses near current levels.
ETF Filing Fuels Price Momentum as HYPE Nears Resistance
A recent update shared by Coin Bureau on X revealed that Bitwise filed a second amended application for a proposed HYPE ETF. This step often appears late in the approval process and typically signals regulatory progress.
The filing confirmed details such as the ticker and fee structure, which added clarity for market participants. As a result, HYPE recorded strong gains, climbing nearly 200% over the past year.
Following the announcement, price action showed a steady push toward the 42.5–43.0 resistance zone. The token traded at 42.474, marking a daily gain of 2.12%. Intraday movement ranged between 41.480 and 42.685, reflecting steady buying pressure.
Earlier trends show a shift in structure over recent months. The market moved from a prolonged decline into a base formation between 24 and 26. Since February, the price has formed higher highs and higher lows, signaling a developing uptrend.
At the same time, traders are reacting to the proximity of resistance levels. The 45.0 level stands as the next barrier, followed by the psychological 50.0 mark. These zones continue to attract attention as prices consolidate near recent highs.
Technical Indicators Show Strength While Short-Term Pressure Builds
Momentum indicators support the current trend, although short-term conditions suggest caution. Bollinger Bands show price trading slightly above the upper band, which sits near 42.149. This positioning often reflects strong momentum but may also signal temporary exhaustion.
The bands have widened, pointing to rising volatility and continued directional movement. Such expansion typically appears during breakout phases, especially when demand remains steady.
Meanwhile, the Relative Strength Index stands at 67.86, approaching the overbought threshold of 70. The RSI remains above its moving average, confirming upward momentum. However, the current level suggests that buying pressure could slow in the near term.
Support levels are also becoming clearer as the price stabilizes above the previous resistance. The 42.1 level now acts as immediate support, while 38.2 aligns with the mid-band and serves as a dynamic floor. Below that, 34.2 and 30.0 remain key structural zones.
Price behavior around these levels may guide short-term direction. Holding above 42.0 could support further upside toward 45 and possibly 50. On the other hand, a pullback toward 40.0 or 38.2 may occur before continuation.
Market structure continues to favor an upward trend, supported by consistently higher highs and strong momentum readings. Even so, resistance between 42 and 45 remains a critical area where traders may lock in gains.
TLDR:
- Bitcoin holds above $73K as Coinbase Premium turns positive, showing renewed demand from US-based institutional investors.
- RSI at 61 signals moderate strength, with room for further upside as buying pressure gradually builds.
- MACD remains flat with slight weakness, pointing to consolidation rather than a confirmed trend reversal.
- Price faces resistance at $75K–$78K, while strong support near $70K continues to anchor the current range.
Bitcoin traded near $73,000 as fresh demand from US-based investors supported recent price stability. Market data shows institutional participation rising, while retail activity remains cautious, shaping a controlled recovery phase after earlier declines.
Coinbase Premium Signals Renewed Institutional Activity
Crypto analyst Ali Martinez, known as @alicharts on X, noted a shift in market dynamics driven by US investors. In a recent tweet, he pointed out that the Coinbase Premium Index has turned positive for the first time since mid-March.
This metric tracks the price difference between Coinbase and other global exchanges. A positive reading often reflects stronger buying pressure from US participants. It also suggests that regulated capital is re-entering the market after a quieter period.
At the same time, Bitcoin’s price hovered around $73,031, with a daily high of $73,235 and a low of $72,559. The move follows a broader downtrend that lasted from November through February. During that phase, the asset recorded consistent lower highs and lower lows.
However, price action shifted after a sharp drop in early February. Bitcoin found support between $60,000 and $62,000, forming a base. Since then, the market has moved sideways with a slight upward bias.
Recent candles show steady gains rather than sharp spikes. This pattern suggests controlled accumulation rather than aggressive speculation. As a result, traders are watching whether institutional demand can sustain this pace.
Indicators Show Strength Building Below Key Resistance
Technical indicators reflect a market that is stabilizing but not overheated. The Relative Strength Index currently stands at 61.49, remaining above its moving average of 50.51. This level indicates moderate strength while leaving room for further upside.
The RSI has also formed higher lows since February. This pattern aligns with the gradual recovery seen in price action. It shows that buying pressure has been increasing over time, even during consolidation phases.
Meanwhile, the Moving Average Convergence Divergence indicator shows limited momentum divergence. The MACD line sits at 670, slightly below the signal line at 673. The histogram remains marginally negative at -3.
This setup reflects slowing momentum rather than a reversal. A bullish crossover occurred in late March, followed by a flattening trend. Such behavior often appears during consolidation before a directional move.
Key levels continue to guide market attention. The $70,000 mark serves as immediate support and a psychological anchor. Below that, the $60,000 to $62,000 range remains a strong base from earlier in the year.
On the upside, resistance sits between $75,000 and $78,000. A break above this range could open the path toward the $90,000 to $95,000 zone. Until then, the price may continue moving within a defined range.
Ali Martinez’s observation ties closely with this setup. When Coinbase leads global pricing, it often reflects early positioning by larger players. That trend, combined with steady technical readings, keeps focus on whether Bitcoin can test higher resistance levels soon.
Crypto World
U.S. Government Moves $177K Bitcoin Seized from Steroid Dealer Glenn Olivio to Coinbase Prime
TLDR:
- The U.S. Government sent 2.44 BTC worth $177K from Glenn Olivio’s seized wallet to Coinbase Prime.
- The transfer ended over 30 days of wallet inactivity, triggering immediate attention from on-chain analysts.
- Coinbase Prime’s institutional setup suggests the funds are now positioned for custody or potential sale.
- Small government Bitcoin transfers have historically preceded larger cluster movements in seized asset cycles.
U.S. government-seized Bitcoin linked to indicted steroid distributor Glenn Olivio has moved to Coinbase Prime, blockchain data shows. The transfer involved 2.44 BTC worth approximately $177,400 — the first wallet activity in over a month.
While the amount is relatively small, the destination has raised immediate questions across the crypto market about a potential structured liquidation of federally held assets.
Drug Money, Federal Wallets, And A Transfer That Caught The Market’s Attention
The U.S. Government’s seizure of Bitcoin does not move quietly. When 2.44 BTC left a wallet tied to Glenn Olivio and arrived at Coinbase Prime, blockchain trackers flagged it within minutes.
Olivio was indicted in 2025 on charges related to operating an illegal steroid distribution network. The funds had sat untouched in federal custody for over a month.
That silence made the transfer more striking when it finally came. On-chain data laid out the full trail — from criminal proceeds to government custody to an institutional trading platform — in plain view.
Coinbase Prime is not a holding address. It is a platform built specifically for institutions to manage, custody, and sell large volumes of digital assets.
Sending seized Bitcoin there carries a specific message to the market — these funds are being prepared for structured handling, and a sale is possible.
A Small Transfer, But A Signal The Crypto Market Is Taking Seriously
The $177,400 figure is modest by government crypto standards. Federal agencies collectively hold billions in seized digital assets.
Still, traders and on-chain analysts monitor even the smallest government wallet movements with considerable attention.
The reason is precedent. Small transfers from seized government wallets have historically preceded larger cluster movements.
One modest on-chain transaction can signal the beginning of a broader repositioning effort, not just a one-off administrative shuffle.
Blockchain technology has stripped away the opacity that once surrounded government asset forfeiture. Federal auctions used to happen behind closed doors, invisible to the public until after the fact.
Now every wallet movement is recorded, timestamped, and publicly accessible within seconds. That transparency changes the dynamic entirely.
Market participants can watch seized criminal proceeds move through the financial system in real time. Whether this particular transfer leads to an immediate liquidation or sits within a longer strategy, the crypto market has already registered it — and will keep watching.
TLDR:
- STX’s fake inverse H&S at $3.84 acted as a classic distribution trap for retail liquidity.
- A 93.64% drawdown reset structure, flushing weak hands via a decisive SSL sweep.
- Price now sits in a key $0.07–$0.11 demand zone, signaling potential accumulation phase.
- A reclaim of $0.40 is pivotal to unlock macro upside toward $1–$3.50+ targets.
STX price analysis places the asset at a critical crossroads following a devastating 93.64% collapse from its $3.84 cycle high.
A fake inverse head and shoulders pattern near the neckline lured retail traders into a distribution trap engineered by smart money.
Price has since landed in a high-timeframe demand zone between $0.07 and $0.11, where the next major move could take shape.
How Smart Money Trapped Retail And Erased 93% Of STX’s Value
The collapse started at the $3.84 neckline, where a fake inverse head and shoulders pattern formed. Retail traders saw a textbook bullish reversal setup and positioned accordingly. That confidence proved costly.
Smart money used that optimism as exit liquidity. As retail bought the perceived breakout, larger players quietly distributed their positions into the demand.
STX then rolled over and fell 93.64% from its cycle peak, resetting the entire market structure. Head and shoulders formations at macro tops rarely resolve in favor of late buyers.
STX followed that script precisely, trapping thousands of traders before the floor collapsed entirely. The drop was not a surprise to those who understood the context.
A liquidity sweep below the ascending trendline has since occurred. That SSL grab cleared out remaining stop-losses and flushed the last wave of weak hands from the market.
Selling pressure has largely exhausted itself at these levels, leaving the price sitting in unfamiliar but potentially significant territory.
STX Now Eyes A 4,700% Recovery — Here Is What Needs To Happen
STX currently trades inside the $0.07–$0.11 high-timeframe demand zone. This area aligns with prior inefficient price delivery and follows a complete liquidation cycle.
Most sellers have already exited, and the remaining structure is leaning toward accumulation. The $0.40 level is the line that separates noise from opportunity.
Below it, STX remains trapped in a bearish market structure. A confirmed breakout and retest above $0.40 would mark the beginning of a genuine structural shift and open the door to the bull targets.
Those targets sit at $1.00, $2.50, and $3.50 and above. The full measured move extension puts maximum upside near 4,798% from current prices.
Crypto markets have delivered returns of that magnitude before, but conditions must align.
Capital rotation into mid-cap altcoins, continued Bitcoin L2 narrative strength, and a sustained reclaim of $0.40 are all required. Stacks carries a fundamental edge here, given its direct ties to Bitcoin’s growing Layer 2 ecosystem.
Risk invalidation sits at a two-week close below $0.043. That level, if broken, voids the bullish thesis entirely. The same setup offering nearly 5,000% upside can still fall another 50% before any confirmed bottom takes hold.

Google Messages gets a Trash folder for your unimportant chats to simmer in

The Philippine money is evolving?!

Haitians cut back on already scarce food and ask how they’ll survive rising fuel prices


-

 Business6 days ago
Three Gulf funds agree to back Paramount’s $81 billion takeover of Warner, WSJ reports
-

 Politics2 days ago
US brings back mandatory military draft registration
-

 Fashion2 days ago
Weekend Open Thread: Veronica Beard
-

 Tech4 days ago
How Long Can You Drive With Expired Registration? What Florida Law Says
-

 Business7 days ago
No Jackpot Winner, Prize to Climb to $231 Million
-

 Fashion6 days ago
Massimo Dutti Offers Inspiration for Your Summer Mood Board
-
 Sports2 days ago
Man United discover Nico Schlotterbeck transfer fee as defender reaches Dortmund agreement
-

 Fashion5 days ago
Let’s Discuss: DEI in 2026
-

 Crypto World3 days ago
Canary Capital Files SEC Registration for PEPE ETF
-

 Business1 day ago
Tesla Model Y Tops China Auto Sales in March 2026 With 39,827 Registrations, Beating Cheaper EVs and Gas Cars
-

 Crypto World4 days ago
Bitcoin recovers as US and Iran Agree a Ceasefire Deal
-

 Politics2 days ago
Malcolm In The Middle OG Turned Down ‘Buckets Of Money’ To Appear In Reboot
-

 Business2 days ago
OpenAI Halts Stargate UK Data Centre Project Over Energy Costs and Copyright Row
-

 Business14 hours ago
Ireland Fuel Protests Enter Day 5 as Blockades Spark Shortages and Government Prepares Support Package
-

 Tech6 days ago
Gamer Restores the Original PlayStation Portal From Two Decades Ago
-

 Tech6 days ago
Italian court says Netflix must refund customers up to $576 over price hikes
-

 Tech6 days ago
Samsung just gave up on its own Messages app
-

 Tech6 days ago
Haier is betting big that your next TV purchase will be one of these
-

 Tech6 days ago
The Xiaomi 17 Ultra has some impressive add-ons that make snapping photos really fun
-

 Politics2 days ago
LBC Presenter Mocks Trump Over Iran War Failures
You must be logged in to post a comment Login