
Crypto World
Why Is the Crypto Market Down Today?
The total crypto market cap (TOTAL), led by Bitcoin, is still feeling the aftershocks of Gold’s recent crash, which also affected crypto assets. Following in the king’s footsteps, River (RIVER) took a 27% hit in the last 24 hours.
In the news today:-
- Tether reported over $10 billion in net profit for 2025, driven by growing USDT circulation and reserves backed largely by US Treasuries and gold. Its latest attestation shows $6.3 billion in excess reserves, exceeding $186.5 billion in token-related liabilities, highlighting a stronger balance sheet.
- Binance released a post-mortem detailing that the crypto flash crash of October 10, 2025, was driven by macro shocks and automated liquidations, not exchange failures. The exchange attributed the $19 billion liquidation wave to rising bond yields, trade-war concerns, and a rapid market-wide deleveraging.
Sponsored
The Crypto Market Is Bleeding
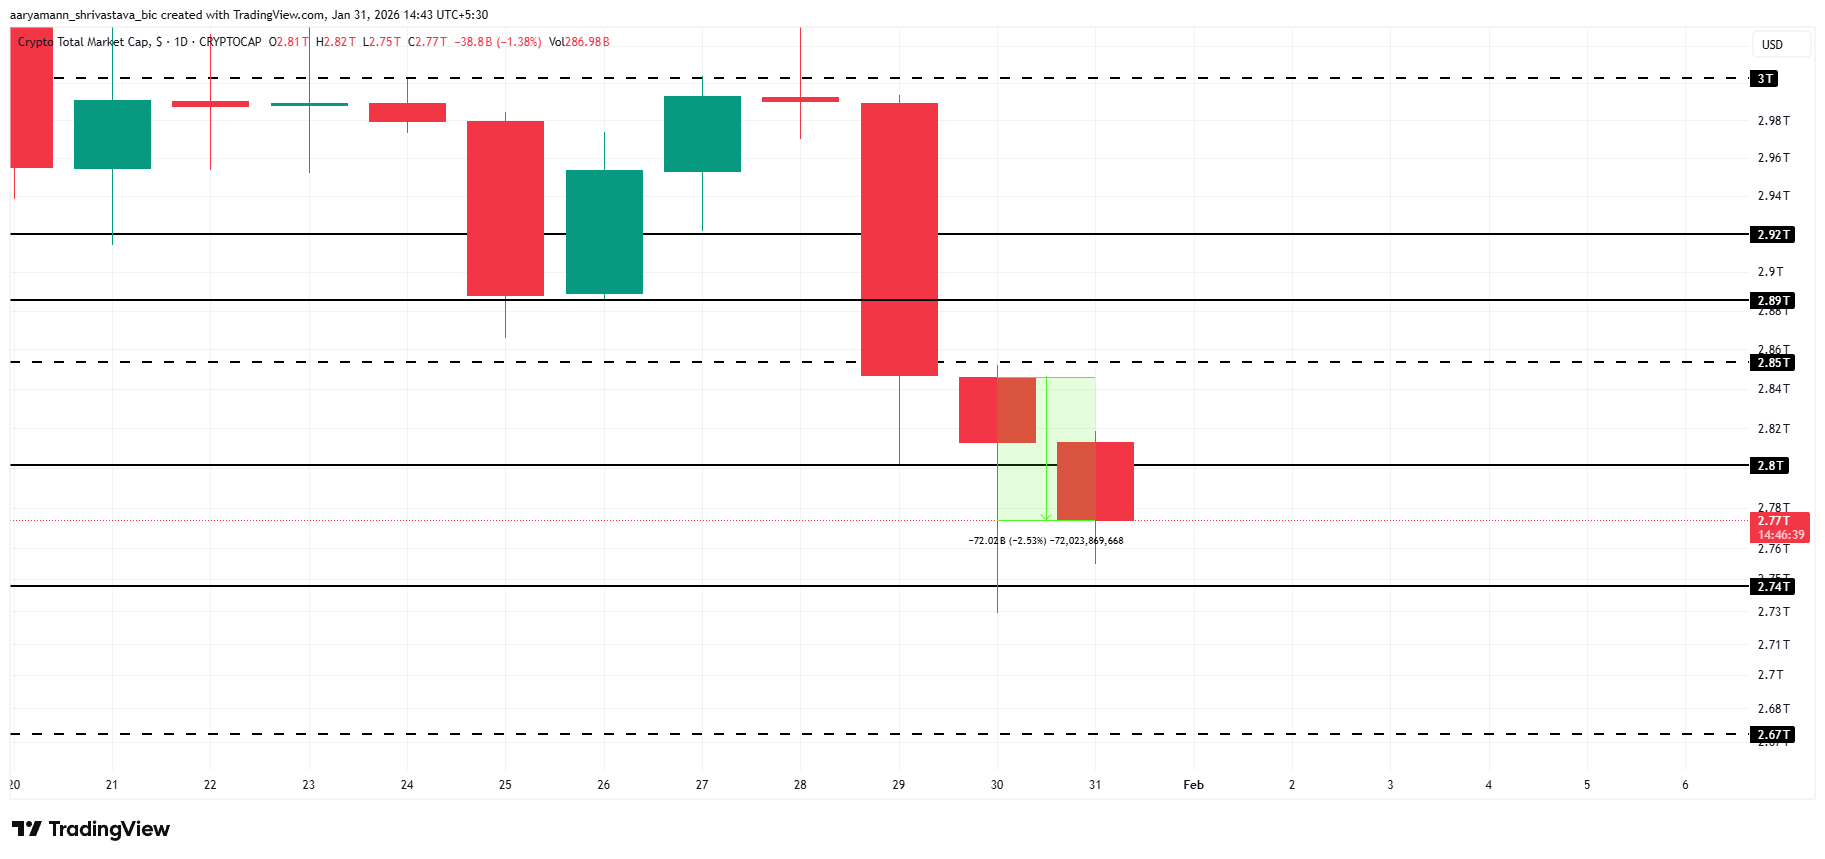
The total crypto market capitalization fell by $72 billion over the past 24 hours, settling near $2.77 trillion. Despite the decline, TOTAL remains above the $2.74 trillion support level. This zone has acted as a short-term floor, helping limit further downside amid broader market weakness.
Worsening global conditions triggered the latest pullback across digital assets. If negative momentum persists through the weekend, selling pressure could intensify.
Under this scenario, TOTAL may break below $2.74 trillion. A confirmed breakdown would likely send the market cap toward the $2.67 trillion level.
Want more token insights like this? Sign up for Editor Harsh Notariya’s Daily Crypto Newsletter here.
Sponsored

A bullish reversal remains possible if sentiment improves. Renewed buying could help TOTAL reclaim the $2.80 trillion mark as support. Sustained strength above this level would open the door to a move toward $2.85 trillion, invalidating expectations of a deeper correction.
Bitcoin Continues Its Downtrend
Bitcoin price weakened further, trading near $83,182 at the time of writing. The crypto king broke down from a broadening ascending wedge, a pattern that projected a 12.6% decline. The move confirmed bearish momentum and increased downside risk toward the $75,850 technical target.
The breakdown accelerated after Bitcoin lost the $84,698 support level. This failure confirmed the broader drawdown and shifted the short-term structure to bearish. With selling pressure intact, the next major support now sits near $80,787. Holding this level is critical to prevent deeper losses.
Sponsored
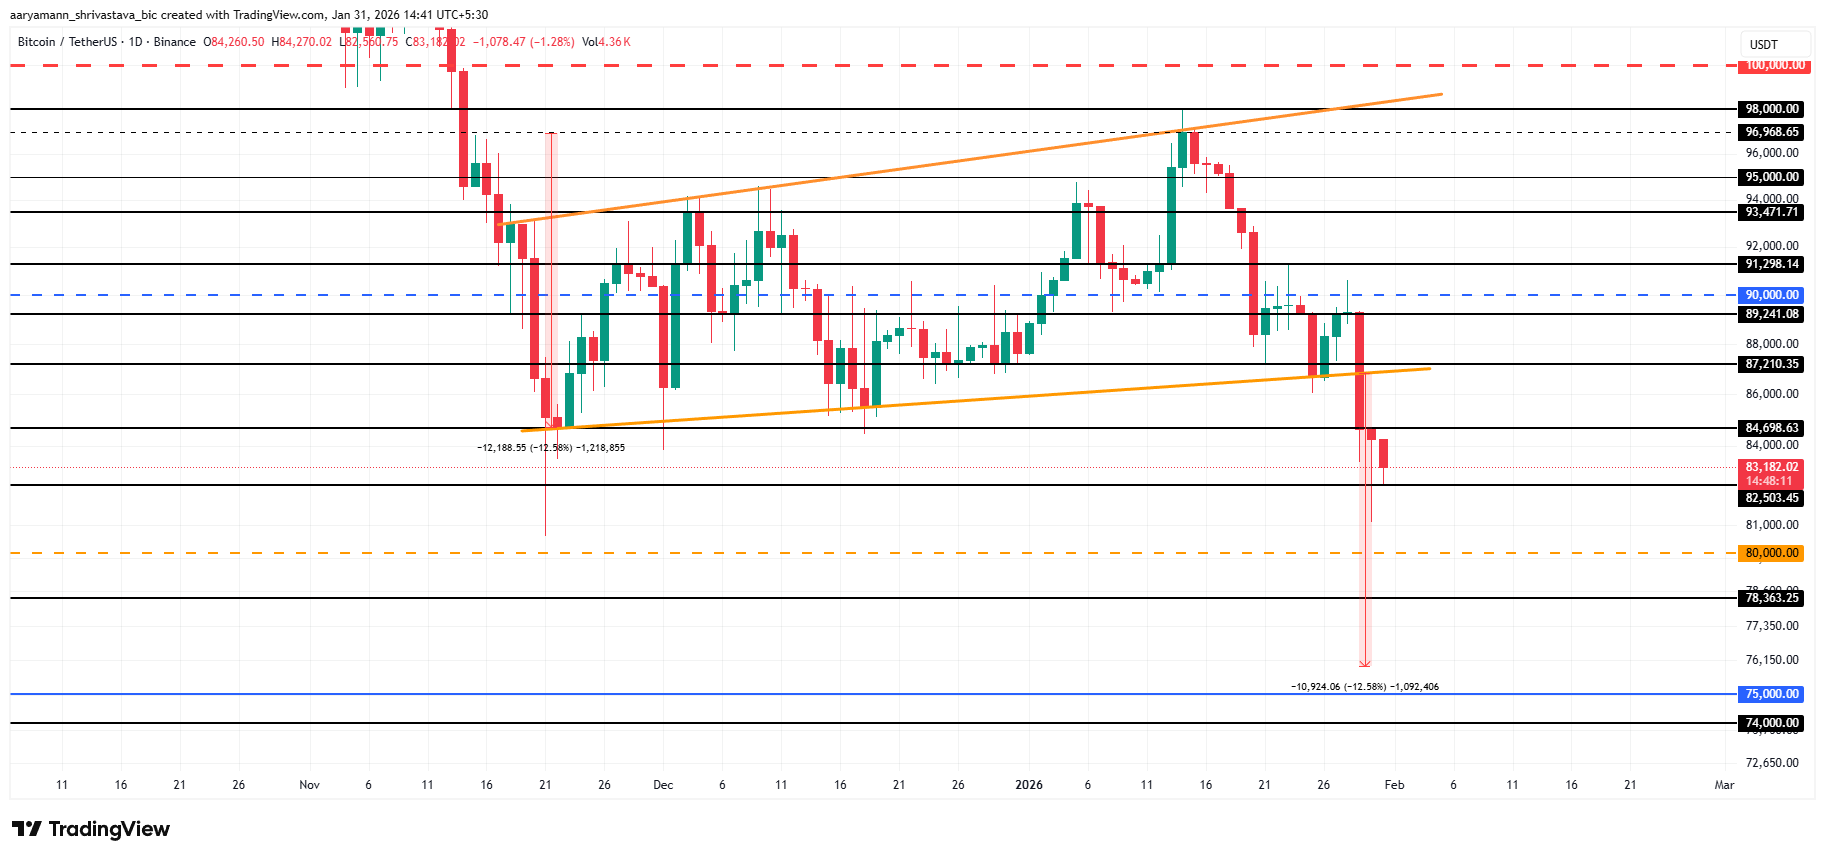
A recovery scenario depends on reclaiming $84,698 as firm support. Regaining this zone would signal stabilization and renewed buyer confidence.
As the long downward wick on Friday shows strong dip buying. If investors maintain this momentum, Bitcoin could attempt a rebound toward $87,210. Sustained strength above reclaimed support would be required to restore bullish momentum.
Sponsored
River Strays Farther Away From ATH
RIVER recorded the steepest decline among altcoins, dropping 28% in the past 24 hours. The sell-off pushed the price down to $31 at the time of writing. This move confirmed a breakdown below the $36 support level, marking a sharp shift in short-term market structure.
Despite the decline, there are no clear signs of aggressive selling. The pullback appears driven by lingering bearish sentiment rather than panic exits. The next key support sits near $27, aligning with the 50-day EMA. This confluence suggests downside may remain limited under stable conditions.
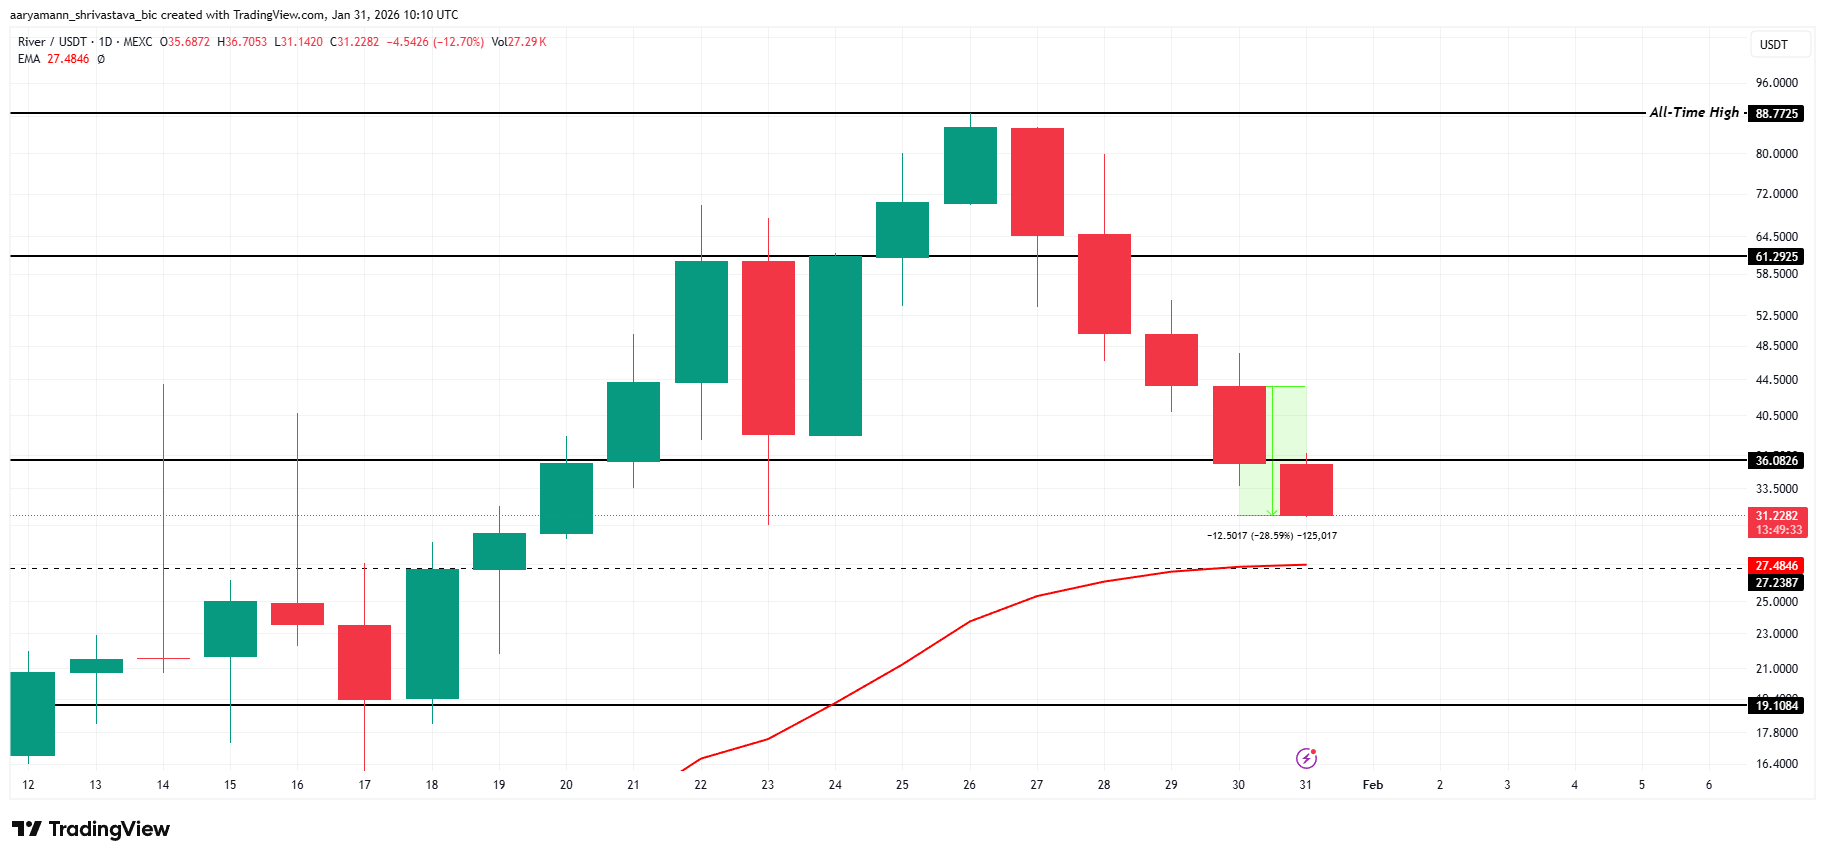
A bullish reversal remains possible if sentiment improves. Reclaiming $36 as support would signal renewed demand. Such a move could pave the way for a move toward the $61 resistance zone.
Recovering that level would invalidate the bearish outlook and help RIVER erase a large portion of recent losses.


CoreWeave (CRWV) and Meta (META) have broadened their existing partnership, originally valued at up to $14.2 billion, with a new agreement worth around $21 billion.
As part of the deal, CoreWeave will supply dedicated cloud capacity to Meta through 2032, helping power the development and rollout of its AI technologies.
The infrastructure will span multiple locations and feature early deployments of NVIDIA’s (NVDA) Vera Rubin platform, aimed at boosting efficiency, reliability, and scale.
The NVIDIA Vera Rubin platform is the next-generation AI supercomputing architecture is expected to mark a massive shift from simple “Generative AI” to “Agentic AI,” whereby AI becomes more proactive in executing steps towards its goals rather than relying on human prompts.
A key focus of the CoreWeave-Meta agreement is inference, reflecting the industry’s shift toward running AI systems continuously rather than just training them.
“This is another example that leading companies are choosing CoreWeave’s AI cloud to run their most demanding workloads,” said CEO Michael Intrator.
The deal signals that large tech companies are increasingly securing long-term compute resources to support AI-driven services. Shares of CoreWeave rose 3% in pre-market trading on Thursday.
Read More: Mark Zuckerberg’s Meta is planning stablecoin comeback in the second half of this year


Meta Platforms is stepping up its presence in the fast-moving social commerce space, introducing new tools that connect creators, artificial intelligence, and advertising more closely to actual purchases, particularly across Instagram and Reels.
Summary
- Meta Platforms is rolling out new tools that let brands turn Instagram Reels into shoppable content by linking product catalogs with creators.
- The company is expanding AI-driven ad tools, including automated video creation and product optimisation, improving conversions and lowering acquisition costs.
- Meta is also preparing new AI models, including Muse Spark, as it scales its ecosystem across WhatsApp, Facebook, and Instagram to stay competitive.
The latest rollout signals a shift from passive product discovery toward a system where engagement can translate more directly into measurable sales outcomes.
A key part of the strategy centres on expanding the role of creators in the shopping journey. Businesses across 22 countries, including India, will soon be able to share product catalogues with creators, enabling them to tag and link items directly within Reels content. The change effectively turns creator posts into shoppable storefronts, narrowing the gap between entertainment and commerce.
Meta said its creator marketplace now includes more than 1.5 million discoverable creators. New filters within Ads Manager allow brands to identify suitable partners with more precision, improving campaign alignment.
“This makes it easier than ever for businesses to quickly identify creators who are a good match for their goals and likely to perform well in their partnership ads campaigns,” the company said.
“Partnership Ads has moved influencer marketing from a brand-building line item to a marketing channel tied to outcomes,” said Vikas Chawla, pointing to the growing ability to measure creator-led performance.
Meta is also increasing its focus on Reels as a space where users are more likely to engage with ads. The company has expanded its “Reels Trending Ads” into categories such as business, finance, travel, and entertainment, placing brands alongside content that is already drawing strong engagement.
“We’re now part of conversations consumers are already having… the performance uplift has been hard to ignore,” said Sadhvi Dhawan.
At the same time, artificial intelligence is becoming a central component of Meta’s commerce stack alongside creators.
The company is extending its Advantage+ suite with generative AI tools that automate video production, voiceovers, and translations. These tools are designed to lower the effort needed to produce localised, high-volume ad creatives.
Meta is also testing a feature called “product set optimisation,” which allows advertisers to prioritise specific products within larger catalogues. Early results show a 17% drop in cost per purchase for promoted items.
Automated catalog video tools are also gaining traction. These tools convert static listings into video ads and are delivering up to 20% more conversions per dollar, further improving campaign efficiency.
Meta prepares new AI models as competition intensifies
Alongside its commerce push, Meta is advancing its artificial intelligence roadmap with plans to release its first models developed under Alexandr Wang. Some versions are expected to be offered under an open-source license.
Meta has long stood out among major U.S. tech firms for allowing developers to modify its frontier models. However, rising competition in AI is prompting questions over whether that level of openness will continue.
The company continues to emphasise its distribution advantage. By embedding AI tools across platforms such as WhatsApp, Facebook, and Instagram, Meta can reach billions of users globally, often without direct cost. That scale remains difficult for rivals to match and forms a key part of its strategy to close the gap with competitors.
Meta has also introduced Muse Spark, its first model from the Meta Superintelligence Labs unit. The system is positioned as a step toward “personal superintelligence” capable of reasoning, using tools, and coordinating multiple agents on behalf of users.
A core feature of Muse Spark is its “Contemplating” mode, which runs several agents in parallel before producing a response. Meta describes it as an answer to advanced reasoning systems such as those seen in models like Gemini Deep Think and GPT Pro.
The company’s push into AI has also involved internal restructuring. Reports indicate that Meta has cut hundreds of roles as it redirects resources toward priority engineering projects tied to its AI ambitions.
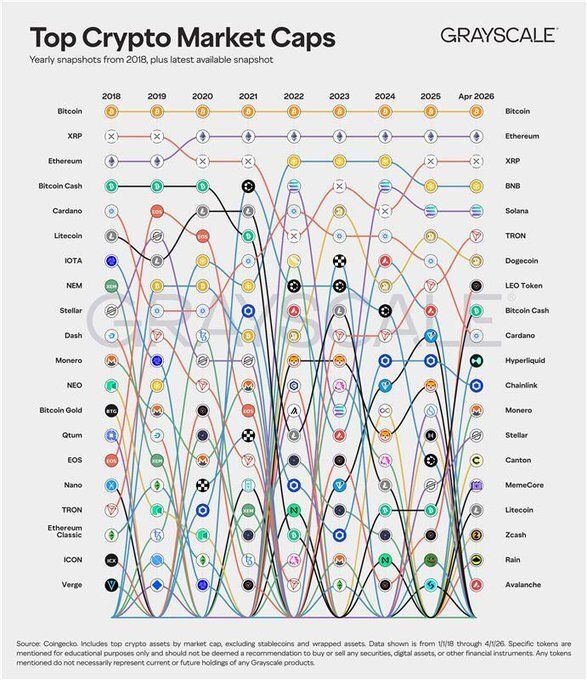
A chart tracking the top 15 cryptocurrencies by market cap every year since 2018 shows a clear pattern. Bitcoin never moves from the number one position.
Most altcoins that once competed for top rankings have either fallen sharply or disappeared entirely.
Bitcoin Holds Number One Across Every Cycle
Bitcoin maintains the top position every single year from 2018 to 2026. The crypto market goes through multiple bear markets, regulatory crackdowns in major economies, and waves of new competitors during this period.
Bitcoin’s ranking does not change. It remains at number one while the rest of the top 15 reshuffles around it.
Ethereum and XRP: The Only Cryptos That Keep Up
Ethereum has held second place consistently since 2018, maintaining its position as the dominant smart contract platform. No competitor manages to overtake it despite years of challengers entering the market.
XRP shows more volatility but never drops out of the top 10. It moves from second place in 2018 to third in 2026, surviving a multi-year SEC lawsuit that would have ended most projects. Out of the original 20 cryptos tracked in 2018, only Bitcoin, Ethereum, and XRP maintain top positions.
The Cryptos That Vanished and the Newcomers That Replaced Them
Half of the cryptos that appeared in the 2018 top 15 have completely disappeared from the top 20 by 2026. IOTA, NEM, Dash, NEO, Qtum, EOS, Bitcoin Gold, Nano, Verge, and Ethereum Classic were once considered serious projects. Investors debated which one would become the next
Ethereum. EOS raised $4 billion in its ICO. Dash was marketed as digital cash for the world. Today, none of them rank among the top 20.
The replacements show an equally notable shift. Solana climbs from obscurity to the top five. Dogecoin, created as a joke, now sits in the top ten. Hyperliquid did not even exist in 2018 and now competes with decade-old names.
Higher Means Stable, Lower Means Volatile
The chart shows a pattern: the higher the ranking, the more stable the position. Bitcoin at number one never moves. Ethereum at number two barely shifts. XRP fluctuates within the top 10 but stays there.
Below the top 10, the volatility increases. Projects jump ten positions up or drop out of the rankings entirely within a single cycle. Most of the 2018 top 15 that vanished came from positions six through fifteen.
What This Means for Crypto Rankings
The chart illustrates the volatility that defines crypto beyond price swings. Rankings shift. Projects that dominate one cycle can disappear in the next. Market cap positions that seem secure can evaporate within a few years.
The data covers eight years. In that time, only three cryptos maintain their top positions. Ten disappear from the top 20 entirely. The rest drop but survive somewhere lower in the rankings. For a market often described as high-risk, the data shows where that risk plays out: not just in price, but in relevance.
The post Bitcoin Stays on Top for 8 Years: Most Cryptos Vanished appeared first on BeInCrypto.

A Seoul Administrative Court has overturned the Financial Intelligence Unit’s three-month partial suspension of Dunamu, the operator of Upbit, in a ruling that reframes how AML rules are applied to crypto exchanges in Korea. The decision, reported by Yonhap News Agency, sides with Dunamu’s challenge to the regulator’s February 2025 sanction, which had blocked new Upbit user transfers for a period of three months.
The court’s reasoning centers on regulatory clarity. It noted that explicit guidelines exist for transfers above 1 million won (roughly $675), but regulations governing smaller transfers were not sufficiently specific to underpin the enforcement action. In essence, the ruling challenges the FIU’s ability to impose major AML sanctions when the underlying compliance standards aren’t clearly spelled out in practice.
Key takeaways
- The Seoul Administrative Court overturned the FIU’s three-month partial suspension on Dunamu, affirming Dunamu’s challenge to the regulator’s AML sanction.
- The court found that while large transfers have clear regulatory expectations, smaller transfers lacked precise guidance, weakening the basis for the enforcement action.
- The ruling narrows the FIU’s leverage to sanction crypto exchanges when the applicable AML standards are not explicitly defined, potentially affecting how similar cases are pursued in the future.
- Dunamu had argued that it had already taken proactive steps to address AML concerns, and the court accepted that there was no clear evidence of intent or gross negligence on the part of Upbit’s operator.
- The decision follows a sustained dispute that began after the FIU’s sanction and a court-granted injunction in March 2025 allowing Upbit to continue onboarding while the case was reviewed.
What the ruling changes about AML enforcement for exchanges
At the heart of the case is a tension between regulatory expectations and the practical, day-to-day controls required of digital-asset platforms. The FIU had argued that Dunamu facilitated transactions with unregistered overseas virtual asset service providers (VASPs) and failed to meet customer due diligence standards. It also cited a broader review that flagged hundreds of thousands of suspected KYC violations during Upbit’s license assessment. In response, Dunamu pursued legal relief, arguing that the sanctions lacked a precise, enforceable standard for the actions expected from exchanges.
The court’s decision emphasizes that enforcement actions must be grounded in clearly articulated requirements. When the rulebook is not explicit for certain transaction sizes, penalizing operators on those grounds becomes problematic. The ruling thus narrows the FIU’s capacity to wield large-scale AML penalties in cases where the applicable guidance isn’t demonstrably specific, potentially prompting regulators to refine or clarify AML expectations for smaller transfers going forward.
Regulatory and market implications for Korea’s crypto sector
The judgment arrives at a moment when Korea’s crypto industry has been navigating a tightening but opaque regulatory environment. While the FIU has shown a willingness to sanction exchanges for AML lapses, this ruling signals that the regulator may need to anchor its actions in clearly defined, widely understood standards—especially for lower-value transfers that constitute a substantial portion of daily exchange activity.
For investors and market participants, the decision offers a measure of judicial oversight over AML enforcement, potentially reducing the risk of abrupt, wide-sweeping sanctions when guidance is ambiguous. It also accentuates the importance for exchanges to maintain proactive, transparent compliance programs that can stand up to scrutiny even if regulatory guidance is not perfectly explicit on every transfer tier.
Observers will be watching whether the FIU updates its guidelines in response to the ruling or appeals the decision. The core issue is whether regulators can consistently apply penalties without accessible, precise standards to govern smaller-scale transfers. The court’s stance suggests a preference for clearly defined rules over broad, punitive actions in the AML domain, at least in cases where evidence of intent or gross negligence is not strong.
Operational impact on Upbit and user onboarding
The February 2025 sanction had blocked new Upbit users from transferring digital assets as part of a broader AML crackdown. After Dunamu filed suit, the court granted an injunction on March 27, 2025, permitting Upbit to continue onboarding while the case proceeded. With the new ruling overturning the sanction, Upbit’s operations are positioned to return to prior norms, subject to ongoing regulatory oversight and any further developments in the case or in FIU guidance.
For Upbit users and the broader market, this outcome matters beyond a single court ruling. It underscores the delicate balance between enforcing AML standards and ensuring that legitimate trading platforms can operate without prolonged, legally uncertain suspensions. In the near term, exchanges may respond by accelerating internal reviews and tightening KYC and due-diligence workflows to align with any forthcoming clarifications from regulators.
What comes next
The ruling sets a precedent that could influence future regulatory actions against crypto exchanges in Korea. If the FIU chooses to appeal or to issue updated guidelines, the framework for AML enforcement could become clearer, reducing ambiguity around what constitutes compliance for both large and smaller transfers. Market participants should monitor whether the FIU issues new guidance on cross-border transactions, VASP registrations, and customer due diligence, and whether further cases test the boundaries of enforcement against exchanges with robust internal controls but evolving regulatory interpretations.
In the longer term, the case highlights a broader dynamic in crypto regulation: the push for concrete, actionable standards that guide both enforcement and compliance. For operators, clarity reduces legal risk and helps stabilize onboarding and transaction flows. For users, it signals a potential path toward more predictable compliance practices and smoother access to crypto services, provided the regulatory framework continues to evolve with clear, well-publicized guidelines.
Readers should watch for any FIU statements or guideline updates that clarify expectations for smaller-value transfers and cross-border activity, as well as any subsequent court actions tied to this dispute.
Crypto World
Fartcoin Whale Liquidated for $3 Million on Hyperliquid After Suspected Manipulation Play
Onchain analysts flagged an alleged coordinated Fartcoin (FARTCOIN) manipulation attempt on Hyperliquid, resulting in $1.5 million in losses for the protocol’s liquidity vault.
Blockchain security firm PeckShield and onchain tracker Lookonchain identified the incident on April 9, linking four wallets to a single entity.
How the Alleged Fartcoin Manipulation Unfolded
According to PeckShield, the attacker accumulated a $15 million Fartcoin long position totaling 145.24 million tokens across four wallets.
The attacker then triggered what PeckShield described as a “suicide” liquidation in a low-liquidity environment. This forced Hyperliquid’s Auto-Deleveraging (ADL) mechanism to activate, pushing the toxic position onto the Hyperliquidity Provider (HLP) vault.
Lookonchain confirmed that the wallets suffered a combined $3.02 million in liquidation losses.
“A $3M loss on paper, but likely a massive net profit via cross-venue hedging,” the post added.
Meanwhile, two short-side traders with addresses beginning 0x06ce and 0x4196 were auto-deleveraged by the ADL system, realizing approximately $849,000 in combined profits.
“4 fresh wallets, same entity, all traced $USDC at the same time coordinated long-liquidated in under 3 hours after a 27% pump collapsed into a 30% crash. This is what whale-vs-whale manipulation looks like when both sides are playing the same game, and one of them blinks first,” Evening Trader Group wrote.
Follow us on X to get the latest news as it happens
The fallout comes as Fartcoin’s price sees notable volatility. The meme coin surged to an intraday high of $0.25 yesterday, marking its highest level since late January.
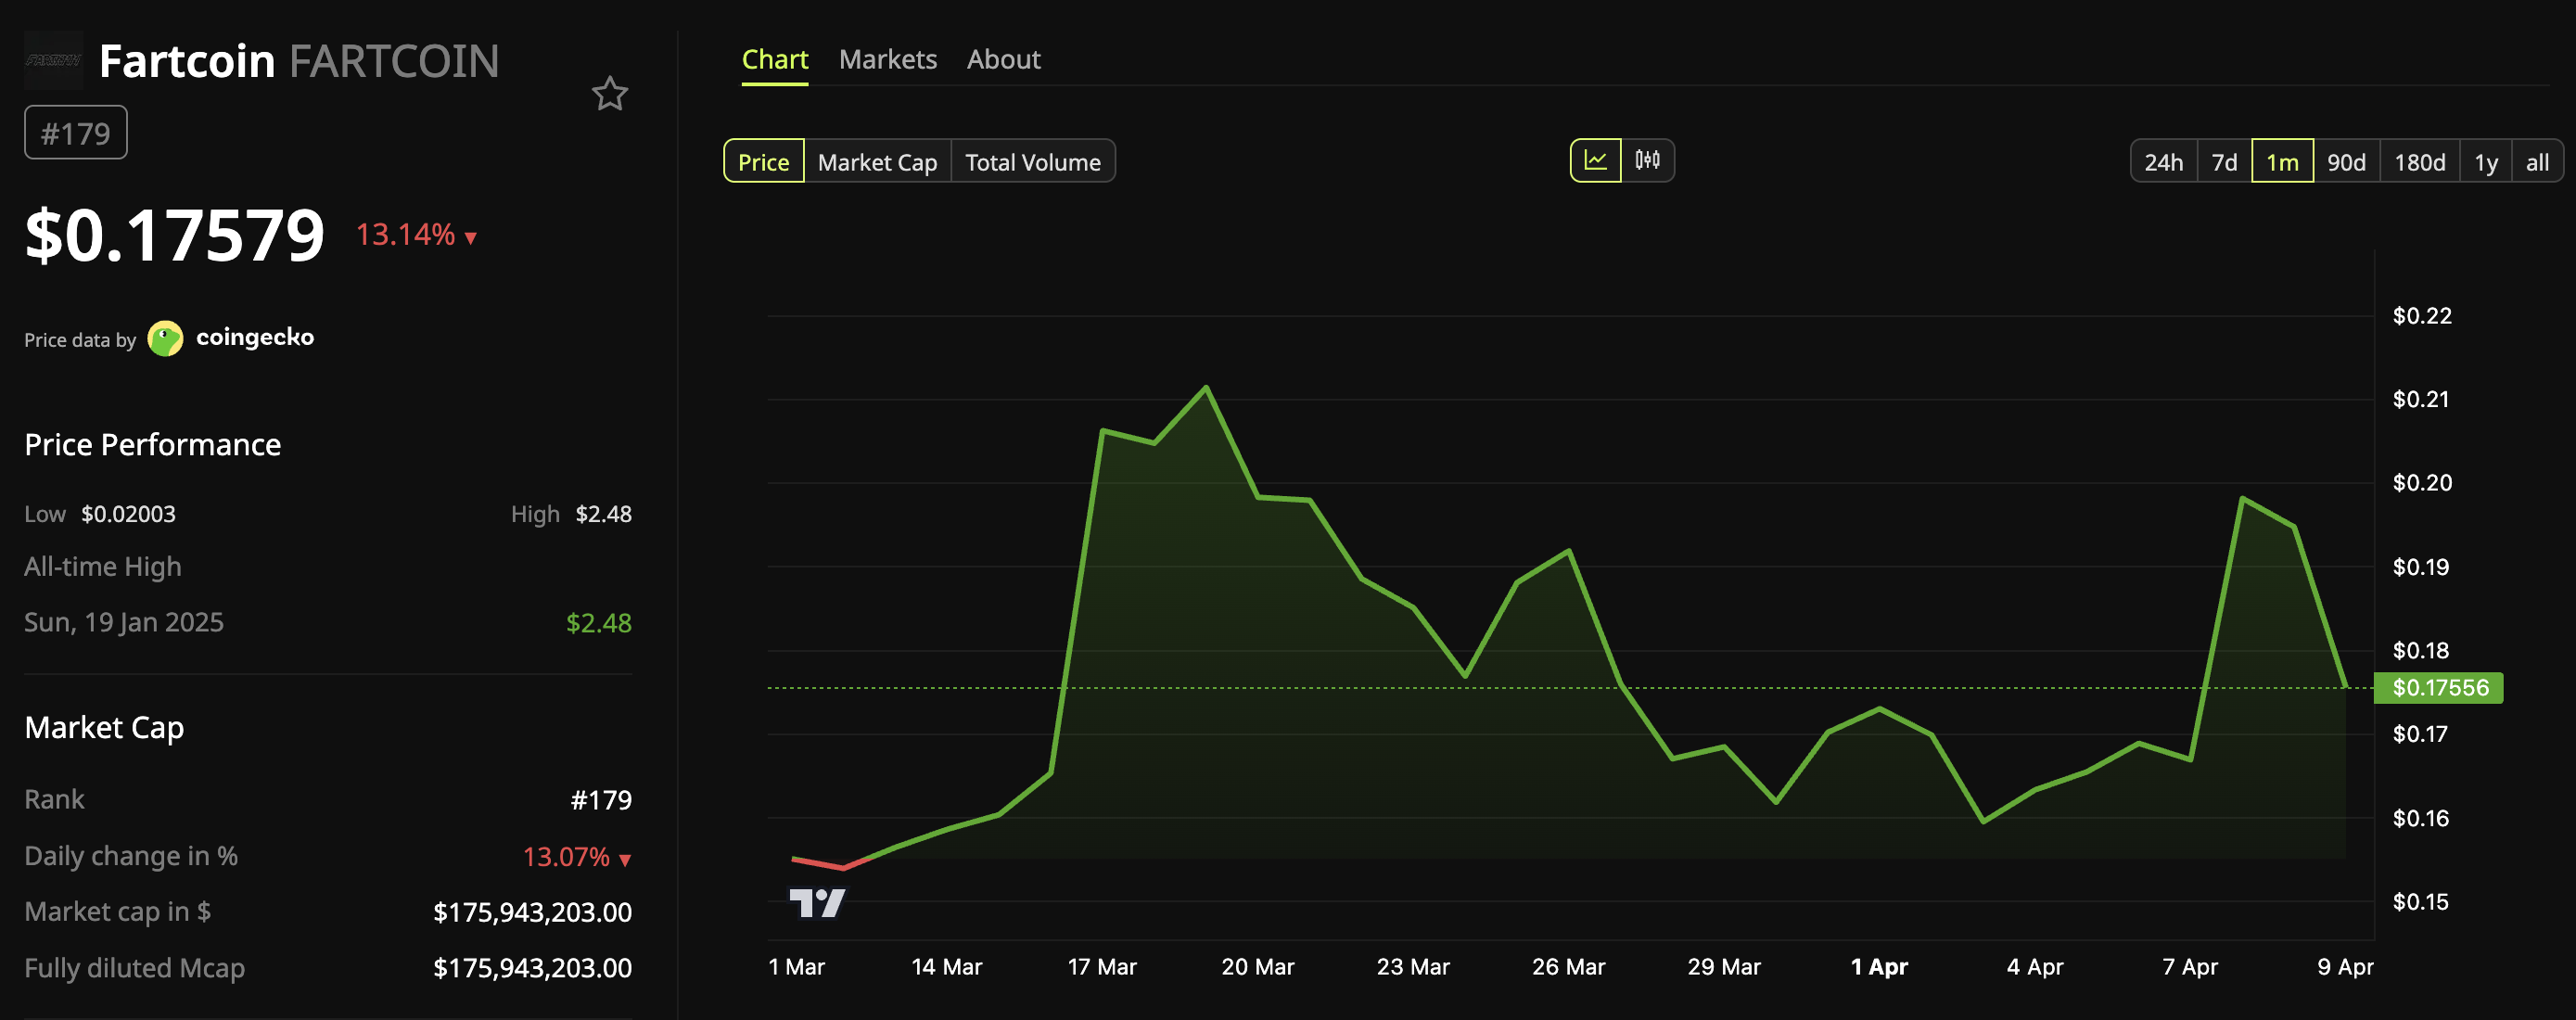
However, over the past 24 hours, the token dropped more than 13%, ranking as the top loser among the 300 largest cryptocurrencies on CoinGecko. The token was trading near $0.17 at the time of writing.
The post Fartcoin Whale Liquidated for $3 Million on Hyperliquid After Suspected Manipulation Play appeared first on BeInCrypto.
Crypto World
MEXC Launches VVIP System Powered by M Score, Redefining Elite Access Beyond Asset Thresholds

MEXC, one of the world leaders in zero‑fee digital asset trading, announced the launch of the industry-first VVIP system that went live on April 2, 2026. The system redefines VVIP access by moving beyond traditional asset-based eligibility toward a dynamic, multi-dimensional user value-based model. It gives every trader the opportunity to access elite privileges and lays the foundation for a more user-centric ecosystem.
At the core of the VVIP system is M-Score, a dynamic metric that reflects user value based on trading activity, account security, and platform engagement. Unlike conventional models that rely primarily on asset holdings or trading volume, M-Score is continuously updated to capture real-time user behavior, offering a more comprehensive and flexible framework for tier qualification.
The MEXC VVIP system unlocks a comprehensive suite of premium benefits for users with an M Score of 800 or above. Eligible users can receive exclusive loss coverage to help manage downside during volatile markets, claim APR boosters to earn enhanced interest on their idle assets, and access 24/7 rapid-response support along with expedited handling for large withdrawals through a priority channel. In addition, users can participate in popular platform events with rewards credited instantly, with no manual review required, and receive Elite Experience Cards to share top-tier privileges with their friends. Users at Standard and Premier tiers also receive tier-appropriate benefits, with full details available on the VVIP page.
The system is being rolled out in phases, with initial access granted to eligible users. Eligible users can access the VVIP section via the MEXC platform. MEXC will also unveil a major platform event on April 13, with further details to be announced in due course. Access will be reserved for users who achieve a minimum M-Score of 600 (Premier tier and above).
MEXC continues to put users first by combining multi-dimensional user value-based evaluation with platform participation, making it easier for users to access premium benefits. This approach reflects the company’s broader commitment to supporting the sustainable development of the digital asset industry. Looking ahead, MEXC will further enhance its VVIP system to help users seize opportunities in a changing market.
About MEXC
Founded in 2018, MEXC is committed to being “Your Easiest Way to Crypto.” Serving over 40 million users across 170+ countries, MEXC is known for its broad selection of trending tokens, everyday airdrop opportunities, and low trading fees. Our user-friendly platform is designed to support both new traders and experienced investors, offering secure and efficient access to digital assets. MEXC prioritizes simplicity and innovation, making crypto trading more accessible and rewarding.
MEXC Official Website| X | Telegram |How to Sign Up on MEXC
Risk Disclaimer: This content does not constitute investment advice. Given the highly volatile nature of the cryptocurrency market, investors are encouraged to carefully assess market fluctuations, project fundamentals, and potential financial risks before making any trading decisions.
The post MEXC Launches VVIP System Powered by M Score, Redefining Elite Access Beyond Asset Thresholds appeared first on BeInCrypto.


Disclosure: This article does not represent investment advice. The content and materials featured on this page are for educational purposes only.
AI-driven crypto tools are becoming essential as traders seek automation to manage volatility.
Summary
- AI trading tools surge in 2026, helping crypto traders automate strategies and manage risk more effectively
- AccuQuant offers 24/7 automated trading with real-time AI optimization and one-click setup for beginners
- AI bots democratize crypto trading, enabling users to capture market opportunities without constant monitoring
In the ever-changing world of cryptocurrency, automation is more than just a buzzword; it’s a necessity. With the rapid rise of AI-powered solutions for cryptocurrency trading, traders are increasingly relying on automation to navigate volatile markets.
This article highlights 10 innovative tools that combine intelligent analytics with user-friendly design to give traders a competitive edge. Whether they’re a beginner or a seasoned trader, these AI-driven tools can improve their trading strategies and better manage risk.
The evaluation criteria for these robots are:
- Key features include advanced tools such as a visual strategy builder, backtesting capabilities, and automated risk management.
- Unique value lies in its unique elements, including AI integration, community support, open-source flexibility, and seamless multi-exchange support.
- Use cases: Specific scenarios where each robot can excel, from entry-level automation to complex algorithmic trading.
After extensive research, we selected three outstanding solutions that have proven their value in the field of artificial intelligence for cryptocurrency trading.
Best AI-powered cryptocurrency trading bots:
1. AccuQuant
With its easy setup and fully automated system, AccuQuant captures market opportunities 24/7. No experience is required to get started quickly and easily generate passive income amidst market fluctuations.
AccuQuant’s main functions:
- One-click trading start: No complicated setup required, start intelligent trading in minutes.
- AI real-time optimization: Automatically identifies market opportunities and dynamically adjusts strategies to improve performance.
- Automated profit mechanism: No need to constantly monitor the market; the system runs 24/7, and you can start earning passive income.
How AccuQuant works: A step-by-step guide for beginners
- Register and create an account: New users will receive a $20 real bonus upon registration!
- Choose a strategy: Select a strategy that fits a particular budget and purchase.
- Start automated trading: Once the purchase is successful, activate the AI system to process all trades 24/7.
For more information, visit the official website.
2. PionexGPT
PionexGPT combines the insights enabled by GPT with customizable robots, making it one of the best solutions. This platform leverages natural language market analysis to help traders enhance their decision-making process, making it a versatile option for anyone looking to improve their strategies.
3. 3Commas
3Commas is known for its cloud-based automation, featuring advanced tools such as trailing stops and portfolio management. Its vibrant community and strategy marketplace allow traders to exchange ideas and adopt proven strategies, solidifying its reputation as a top AI-powered cryptocurrency trading platform.
Why use artificial intelligence in cryptocurrency trading?
Speed and Efficiency
Artificial intelligence (AI) can process massive amounts of data and execute trades far faster than humans. This speed allows traders to capitalize on even the smallest market fluctuations, gaining a competitive edge.
Data-Driven Decision Making
AI utilizes advanced algorithms to analyze vast amounts of data, including historical price trends, market news, and social media sentiment.
Automation
AI allows for automated trading, eliminating the human element in the trading process. Automated systems can continuously monitor the market and execute trades according to predefined criteria without constant supervision.
Risk Management
AI can create personalized risk management strategies, dynamically adjusting trading positions, stop-loss orders, and portfolio allocation to minimize risk in volatile markets such as cryptocurrencies.
Predictive Capabilities
AI models, especially those driven by machine learning, can predict market trends based on historical data.
Factors to Consider
Choosing the right AI-powered cryptocurrency trading bot depends on needs. Here are some factors to consider:
- Skill Level: Assess whether the platform is suitable for beginners or advanced traders with technical expertise.
- Cost Structure: Understand subscription fees, commission models, or any hidden costs that could impact trading success.
- Integration: Ensure the bot supports your preferred exchanges and integrates seamlessly with your existing trading tools.
- Community and Support: A strong user community and reliable customer support can significantly enhance your experience.
- Testing: Validate performance starting small, even with the best AI-powered cryptocurrency trading bots, the cryptocurrency market is unpredictable.
- Security: Always check for robust security protocols to protect funds and personal data.
Summary
In summary, AI-powered cryptocurrency trading bots offer significant advantages through automated trading and the provision of insights based on key technical indicators, making them indispensable tools for both novice and experienced traders. They address the 24/7 challenges of the cryptocurrency market, allowing traders to capitalize on opportunities without constant monitoring.
These bots not only improve performance but also democratize profitable trading strategies, enabling non-professional traders to participate effectively. With so many bots available, each with unique features and capabilities, traders can choose the one that best suits their needs and preferences.
Disclosure: This content is provided by a third party. Neither crypto.news nor the author of this article endorses any product mentioned on this page. Users should conduct their own research before taking any action related to the company.
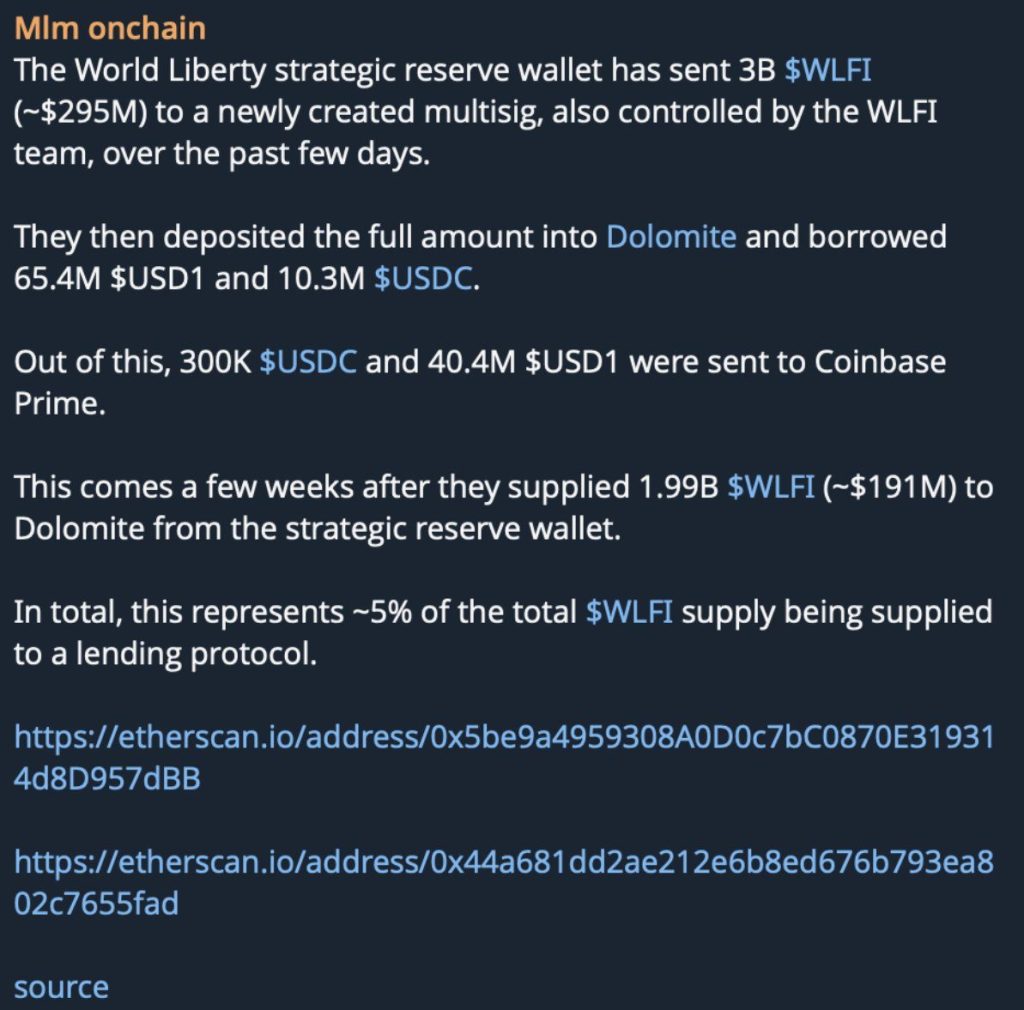
Are Trump crypto insiders back at it again? $484 million in Trump WLFI crypto tokens deposited on Dolomite Protocol. Borrowed against for USDC. And a governance token with almost no real market depth sits as the collateral backstop.
If this unwinds, Dolomite lenders don’t get a haircut; they get wiped.
DeFi analyst Ignas flagged the pattern on X, identifying the leverage structure as a potential systemic threat to Dolomite’s lending pools. The on-chain footprint is already public. The question isn’t whether the risk exists – it’s whether lenders understand what they’re sitting inside.
- The Deposit: Approximately $484M in $WLFI tokens has been deposited into Dolomite Protocol as collateral.
- The Mechanism: That collateral is being used to borrow USDC – extracting real stablecoin value against a token with minimal on-chain liquidity.
- The Bad Debt Risk: If $WLFI price drops sharply, collateral value falls below outstanding USDC debt, leaving Dolomite lenders with unrecoverable DeFi bad debt.
- The Yield Trap: USDC lending APY on Dolomite has spiked to 13.5% – attractive on the surface, but potentially unredeemable if a bank run triggers on bad debt confirmation.
- The Political Trigger: Analysts tie the likely $WLFI dump window to the fading political utility of the token post-cycle – a timeline tied directly to the Trump orbit’s exit incentives.
- What to Watch: DOLO’s $15M market cap makes it acutely vulnerable to protocol insolvency fears; any public confirmation of bad debt could detonate the token in hours.
Explore: The best pre-launch token sales with asymmetric upside potential
How the $484M Trump WLFI Crypto Leverage Play Actually Works – and Where It Breaks
The structure is direct and that’s what makes it dangerous. Entities linked to World Liberty Financial deposited $484M worth of WLFI into Dolomite Protocol, using those tokens as collateral to borrow USDC.
On paper, it looks like a standard DeFi leverage position. In practice, it’s a liquidity time bomb.

WLFI is a governance token. It has politically generated demand and almost no organic secondary market depth.
That means the $484M figure is a valuation on-paper, not $484M that can actually be liquidated into the open market without collapsing the token’s price by 60%, 70%, or more in a single session.
The collateral isn’t real in any liquidation scenario that matters.
When collateral value drops below the outstanding USDC borrow, and with WLFI’s liquidity profile, the threshold is not far, Dolomite’s liquidation engine cannot recover the debt.
No buyer exists at the price needed to make lenders whole. That’s the DeFi bad debt scenario: the USDC is gone, the collateral is worthless at scale, and the protocol is left insolvent in all but name.
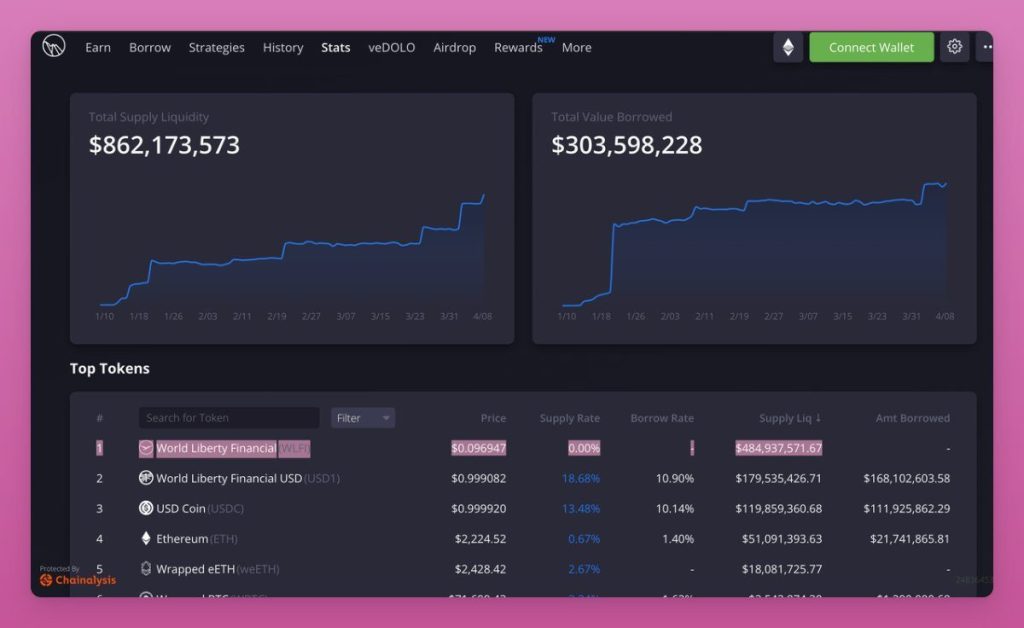
Ignas’s alert on X specifically called out the borrow pressure dynamics, USDC lending rates on Dolomite have already spiked to 13.5% as the protocol attempts to attract fresh liquidity to service the growing borrow demand.
That rate spike is not a yield opportunity. It’s a distress signal. Similar warning patterns preceded the Stabble protocol’s 62% TVL collapse on Solana, where liquidity pressure built silently before the exit hit.
The math on DOLO exposure is brutal at this scale. A $15M market cap token absorbing a protocol-wide insolvency event involving nine figures of bad debt doesn’t survive the news cycle intact.
What DOLO Lenders Are Actually Facing – The Bad Debt Exposure Quantified
DOLO sits at approximately $15M in market cap. That number matters because it tells you exactly how much bad news the token can absorb before the math becomes unsurvivable.
Dolomite does not appear to operate a protocol-level insurance fund sufficient to cover a nine-figure bad debt event. There is no backstop that absorbs $484M in underwater collateral.
IYKYK.
New USDC incentives from @worldlibertyfi are now live on Dolomite.$USDC
→ 14.02% APY
→ 6.52% WLFI
→ 0.59% oDOLO https://t.co/in1nMNXWjz pic.twitter.com/mfgtv5mhu7— Dolomite
(@Dolomite_io) April 7, 2026
The 13.5% USDC APY that Dolomite is currently advertising to new depositors is the yield trap Ignas explicitly warned about.
Depositors chasing that rate are walking into a pool that may not be redeemable at par if the borrow position unwinds badly. This is the same dynamic that burned depositors in DeFi platform controversies where advertised yields masked structural insolvency risk.
If bad debt is confirmed on-chain – whether through a WLFI price collapse or a forced liquidation event – DOLO’s reaction will be immediate. A $15M cap token doesn’t need institutional selling pressure to crater. Retail panic alone is sufficient at that size.
Discover: The Best Crypto Presales Live Right Now
The post Lending Pool Heist: Are Trump Crypto Insiders Setting Up To Crash DOLO Crypto? appeared first on Cryptonews.
Crypto World
Bitcoin $80,000 play is now the most popular bet in derivatives: Crypto Daybook Americas


Sentiment in the bitcoin market appears to have flipped after a long time, suggesting an investor positioning for a potential rally to $80,000.
On Deribit, which accounts for a majority share of the multi-billion dollar global crypto options market, the $80,000 call — a derivatives bet that prices will rise beyond that level — has emerged as the most popular trade. It has overtaken the $60,000 put, which dominated positioning in recent months as prices declined.
As of writing, open interest at the $80,000 strike stands at over $1.6 billion, with each contract representing one bitcoin, according to Deribit data. The $60,000 put has an open interest of $1.41 billion.
BTC has already rebounded above $70,000 from early-week lows near $67,000, supported in part by a temporary ceasefire between the U.S. and Iran that weighed on oil prices. Analysts say continued weakness in oil could help ease inflation concerns, potentially strengthening the case for Federal Reserve rate cuts — a backdrop that tends to support risk assets, including bitcoin.
On-chain data offers some additional supports the bullish case.
“For only the second week in 2026, Bitcoin wallets holding more than 10,000 BTC have recorded net inflows. This points to whale accumulation rather than ETF-driven demand. If sustained, it raises the likelihood of a supply squeeze that could push Bitcoin toward the $75,000–$80,000 range,” said Paul Howard, senior director at crypto liquidity provider Wincent.
Separately, analysts at 21Shares see scope for further upside, with a potential move toward $100,000 by the end of June under favorable conditions.
“Over the past month, we’ve seen more than $1.5 billion in net inflows into BTC ETFs, alongside an increase in holdings by larger investors of around 6% since the start of the year — pointing to continued demand from more sophisticated participants,” said Matt Mena, crypto research strategist at 21Shares. “If geopolitical tensions ease and regulatory clarity improves, a move toward $100,000 by the end of Q2 cannot be ruled out.”
Still, risks remain. The ceasefire is fragile, and any renewed escalation could send oil prices higher again, potentially dampening risk appetite and capping bitcoin’s gains.
Later today, the U.S. fourth-quarter GDP data is due. While the backward-looking release may have limited immediate impact, a significant surprise in either direction could still trigger short-term volatility. Stay alert!
What’s trending
- Trump vows to keep US troops in Persian Gulf before Iran talks (Bloomberg): As both sides accused each other of violating the truce, Trump vowed to keep U.S. troops in the Persian Gulf ahead of talks with Iran that are planned to firm up a fragile ceasefire.
- Everyone’s awaiting U.S. inflation figures, but bitcoin traders couldn’t care less (CoinDesk): The latest U.S. inflation report for March, due Friday, is seen as a key indicator by several observers, given the backdrop of the Iran war and its inflationary impact. Yet, the latest BTC market activity shows that traders couldn’t care less.
- ‘NATO in grave danger after Iran war,’ former US NATO ambassador says (euronews): Former US ambassador to NATO, Ivo Daalder, said repeated threats by Trump to withdraw from NATO and other concerning confrontations, have created the ‘worst crisis’ the alliance has ever faced.
- Inflation data, Iran talks: What to watch for the rest of the week (The Wall Street Journal): After Wednesday’s big stock-market rally, investors will watch if the U.S.-Iran ceasefire holds and await inflation data updates, Q4 GDP estimates, and new data on consumer sentiment.
Today’s signal

The chart shows bitcoin’s daily price swings in candlestick format since October 2025. It also has a yellow trendline drawn off the record high of over $126,000 in October represents the brutal bear market.
As of writing, BTC’s price traded close to that trendline resistance, a make or break level.
A decisive breakout above the trendline – ideally on strong volume and sustained follow-through – would mean the downtrend has likely tun its course. That could open the door for a broader bullish trend reversal, with scope for a move toward the $75,000–$80,000 region initially, and potentially higher if momentum builds.
On the other hand, a rejection at the trendline would reinforce it as a valid resistance level, suggesting continuation of the bear market. This would raise the risk of another pullback toward recent support levels, potentially ito $65,000 or lower.
Read more: For analysis of today’s activity in altcoins and derivatives, see Crypto Markets Today . For a more comprehensive list of events this week, see CoinDesk’s “Crypto Week Ahead“.

Crypto World
Bitcoin under $71,000, ETH, SOL, XRP drop as Iran ceasefire frays within 48 hours of being signed


Bitcoin traded at $70,981 on Thursday, down 0.5% over 24 hours but still up 6.1% on the week, as the two-week ceasefire between the U.S. and Iran that triggered Tuesday’s broad rally began showing cracks less than 48 hours after it was announced.
Iranian Parliament Speaker Mohammad Bagher Ghalibaf said three clauses of the ceasefire proposal had been contravened, without specifying which ones. Israeli attacks continued in Lebanon.
And the Strait of Hormuz, the critical shipping lane whose reopening was supposed to be the centerpiece of the deal, remains effectively closed with minimal tanker traffic passing through despite Iran’s pledge to allow “coordinated” transit.
Brent crude rebounded 2% to about $97 after Wednesday’s collapse of more than 10%, its worst single-day plunge in six years. The reversal reflects how quickly the market has moved from pricing in peace to pricing in uncertainty about whether the ceasefire holds through the weekend, let alone for the full two weeks.
Ether fell 2.6% to $2,180 after leading the ceasefire rally with a 5.2% weekly gain. Solana’s SOL dropped 3.1% to $81.96, XRP lost 3% to $1.33, and dogecoin slid 3.4% to $0.091. BNB held relatively flat at $600, down 2.2%.
The MSCI Asia Pacific Index fell 0.9% with two stocks declining for every one that rose, after surging the most in a year on Wednesday’s ceasefire euphoria. S&P 500 and European futures pointed to a 0.2% decline, signaling the four-day winning streak for global equities was about to end. Treasuries were steady after wiping out an earlier rally on concern that higher oil prices would feed back into inflation.
Meanwhile, The Federal Reserve continues to highlight upside inflation risks alongside softening labor conditions, keeping the higher-for-longer rate narrative intact. Japan’s wage growth has hit multi-decade highs, strengthening expectations for further rate hikes.
That combination amounts to what one analyst described as “uncoordinated tightening” across major economies, layered on top of geopolitical uncertainty that prevents any stable anchor for rate expectations.
For bitcoin specifically, the move from $67,000 to $72,700 on the ceasefire and the subsequent hold above $70,000 despite Thursday’s wobble is the most constructive price action since the war began six weeks ago.
The $65,000 to $73,000 range that has contained every move since late February is still intact, but bitcoin is now testing the upper half rather than grinding along the bottom.

Who Will Win 2026 Masters? Scottie Scheffler Heavy Favorite to Win as Rory McIlroy Pursues Rare Repeat Glory

Meta doubles down on AI with $21 billion CoreWeave (CRWV) partnership

What Is MND? Explaining Game of Thrones Actor’s Disease


-

 NewsBeat7 days ago
Steven Gerrard disagrees with Gary Neville over ‘shock’ Chelsea and Arsenal claim | Football
-

 Business7 days ago
No Jackpot Winner and $194 Million Prize Rolls Over
-

 Fashion6 days ago
Weekend Open Thread: Spanx – Corporette.com
-

 Business5 days ago
Expert Picks for Every Need
-

 Business4 days ago
Three Gulf funds agree to back Paramount’s $81 billion takeover of Warner, WSJ reports
-

 Sports5 days ago
India men’s 4x400m and mixed 4x100m relay teams register big progress | Other Sports News
-

 Tech2 days ago
How Long Can You Drive With Expired Registration? What Florida Law Says
-
Business4 days ago
No Jackpot Winner, Prize to Climb to $231 Million
-

 Fashion3 days ago
Massimo Dutti Offers Inspiration for Your Summer Mood Board
-

 Fashion2 days ago
Let’s Discuss: DEI in 2026
-

 Tech7 days ago
Commonwealth Fusion Systems leans on magnets for near-term revenue
-
Politics6 days ago
Wings Over Scotland | The quality of mercy
-

 Business5 days ago
Akebia Therapeutics, Inc. (AKBA) Discusses Pipeline Progress and Strategic Focus on Kidney Disease Treatments at R&D Day – Slideshow
-

 Fashion7 days ago
Statement Sunglasses: The Accessory Shaping Modern Fashion
-

 Crypto World22 hours ago
Bitcoin recovers as US and Iran Agree a Ceasefire Deal
-

 Fashion7 days ago
Thursday’s Workwear Report: Merino Wool Blend Short-Sleeved Sweater
-

 Politics6 days ago
East Jerusalem Palestinian families eviction orders
-

 Sports7 days ago
Which German players will make final cut?
-

 Fashion7 days ago
For Love & Lemons’ Spring 2026 Line is for the Romantics
-

 Politics6 days ago
Why so many children are now classified as ‘disabled’
You must be logged in to post a comment Login