
Crypto World
Why Is The US Stock Market Up Today?
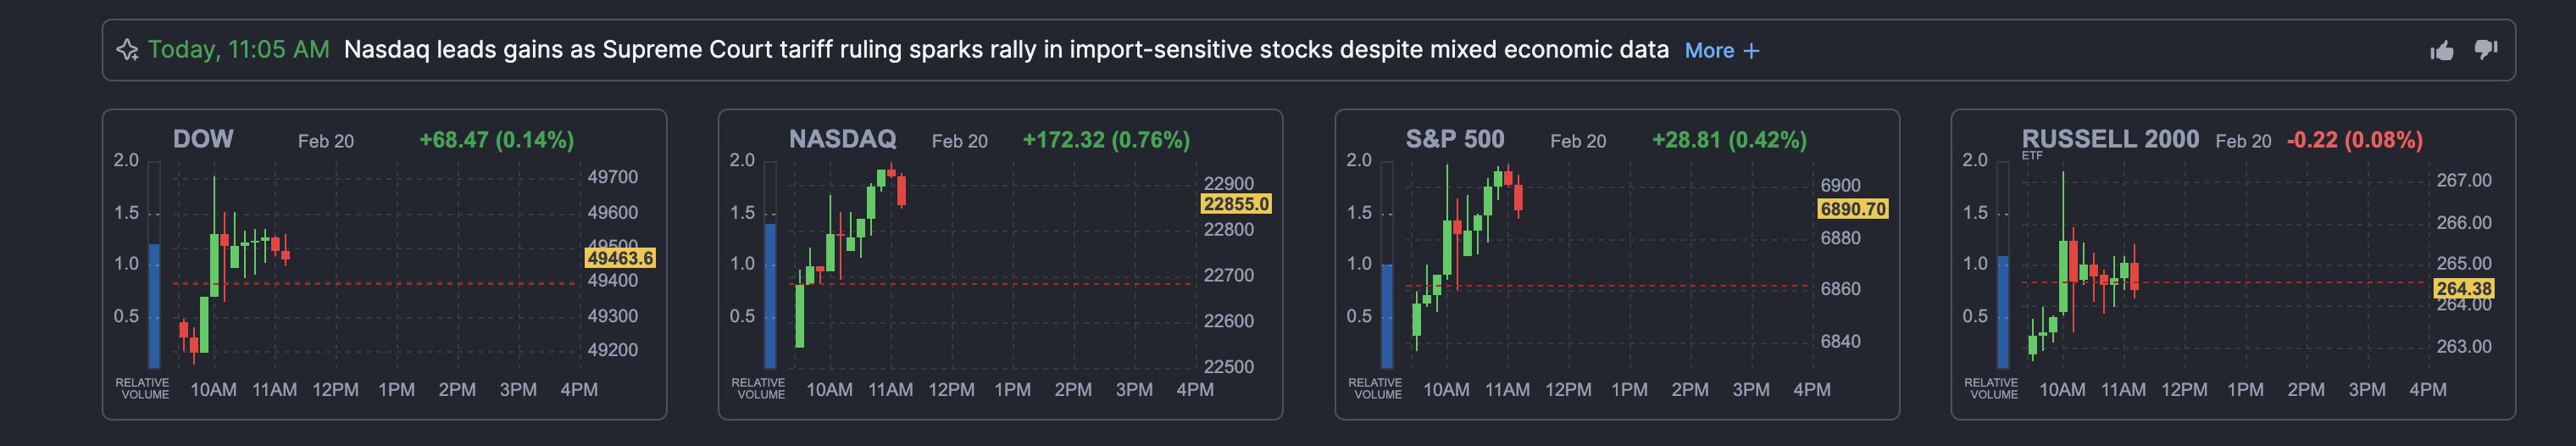
The US stock market recovered sharply on February 20, after the Supreme Court struck down President Trump’s tariffs in a landmark 6-3 ruling. The S&P 500 is trading around 6,890 at press time, up 0.45% from yesterday’s close, at the time of writing.
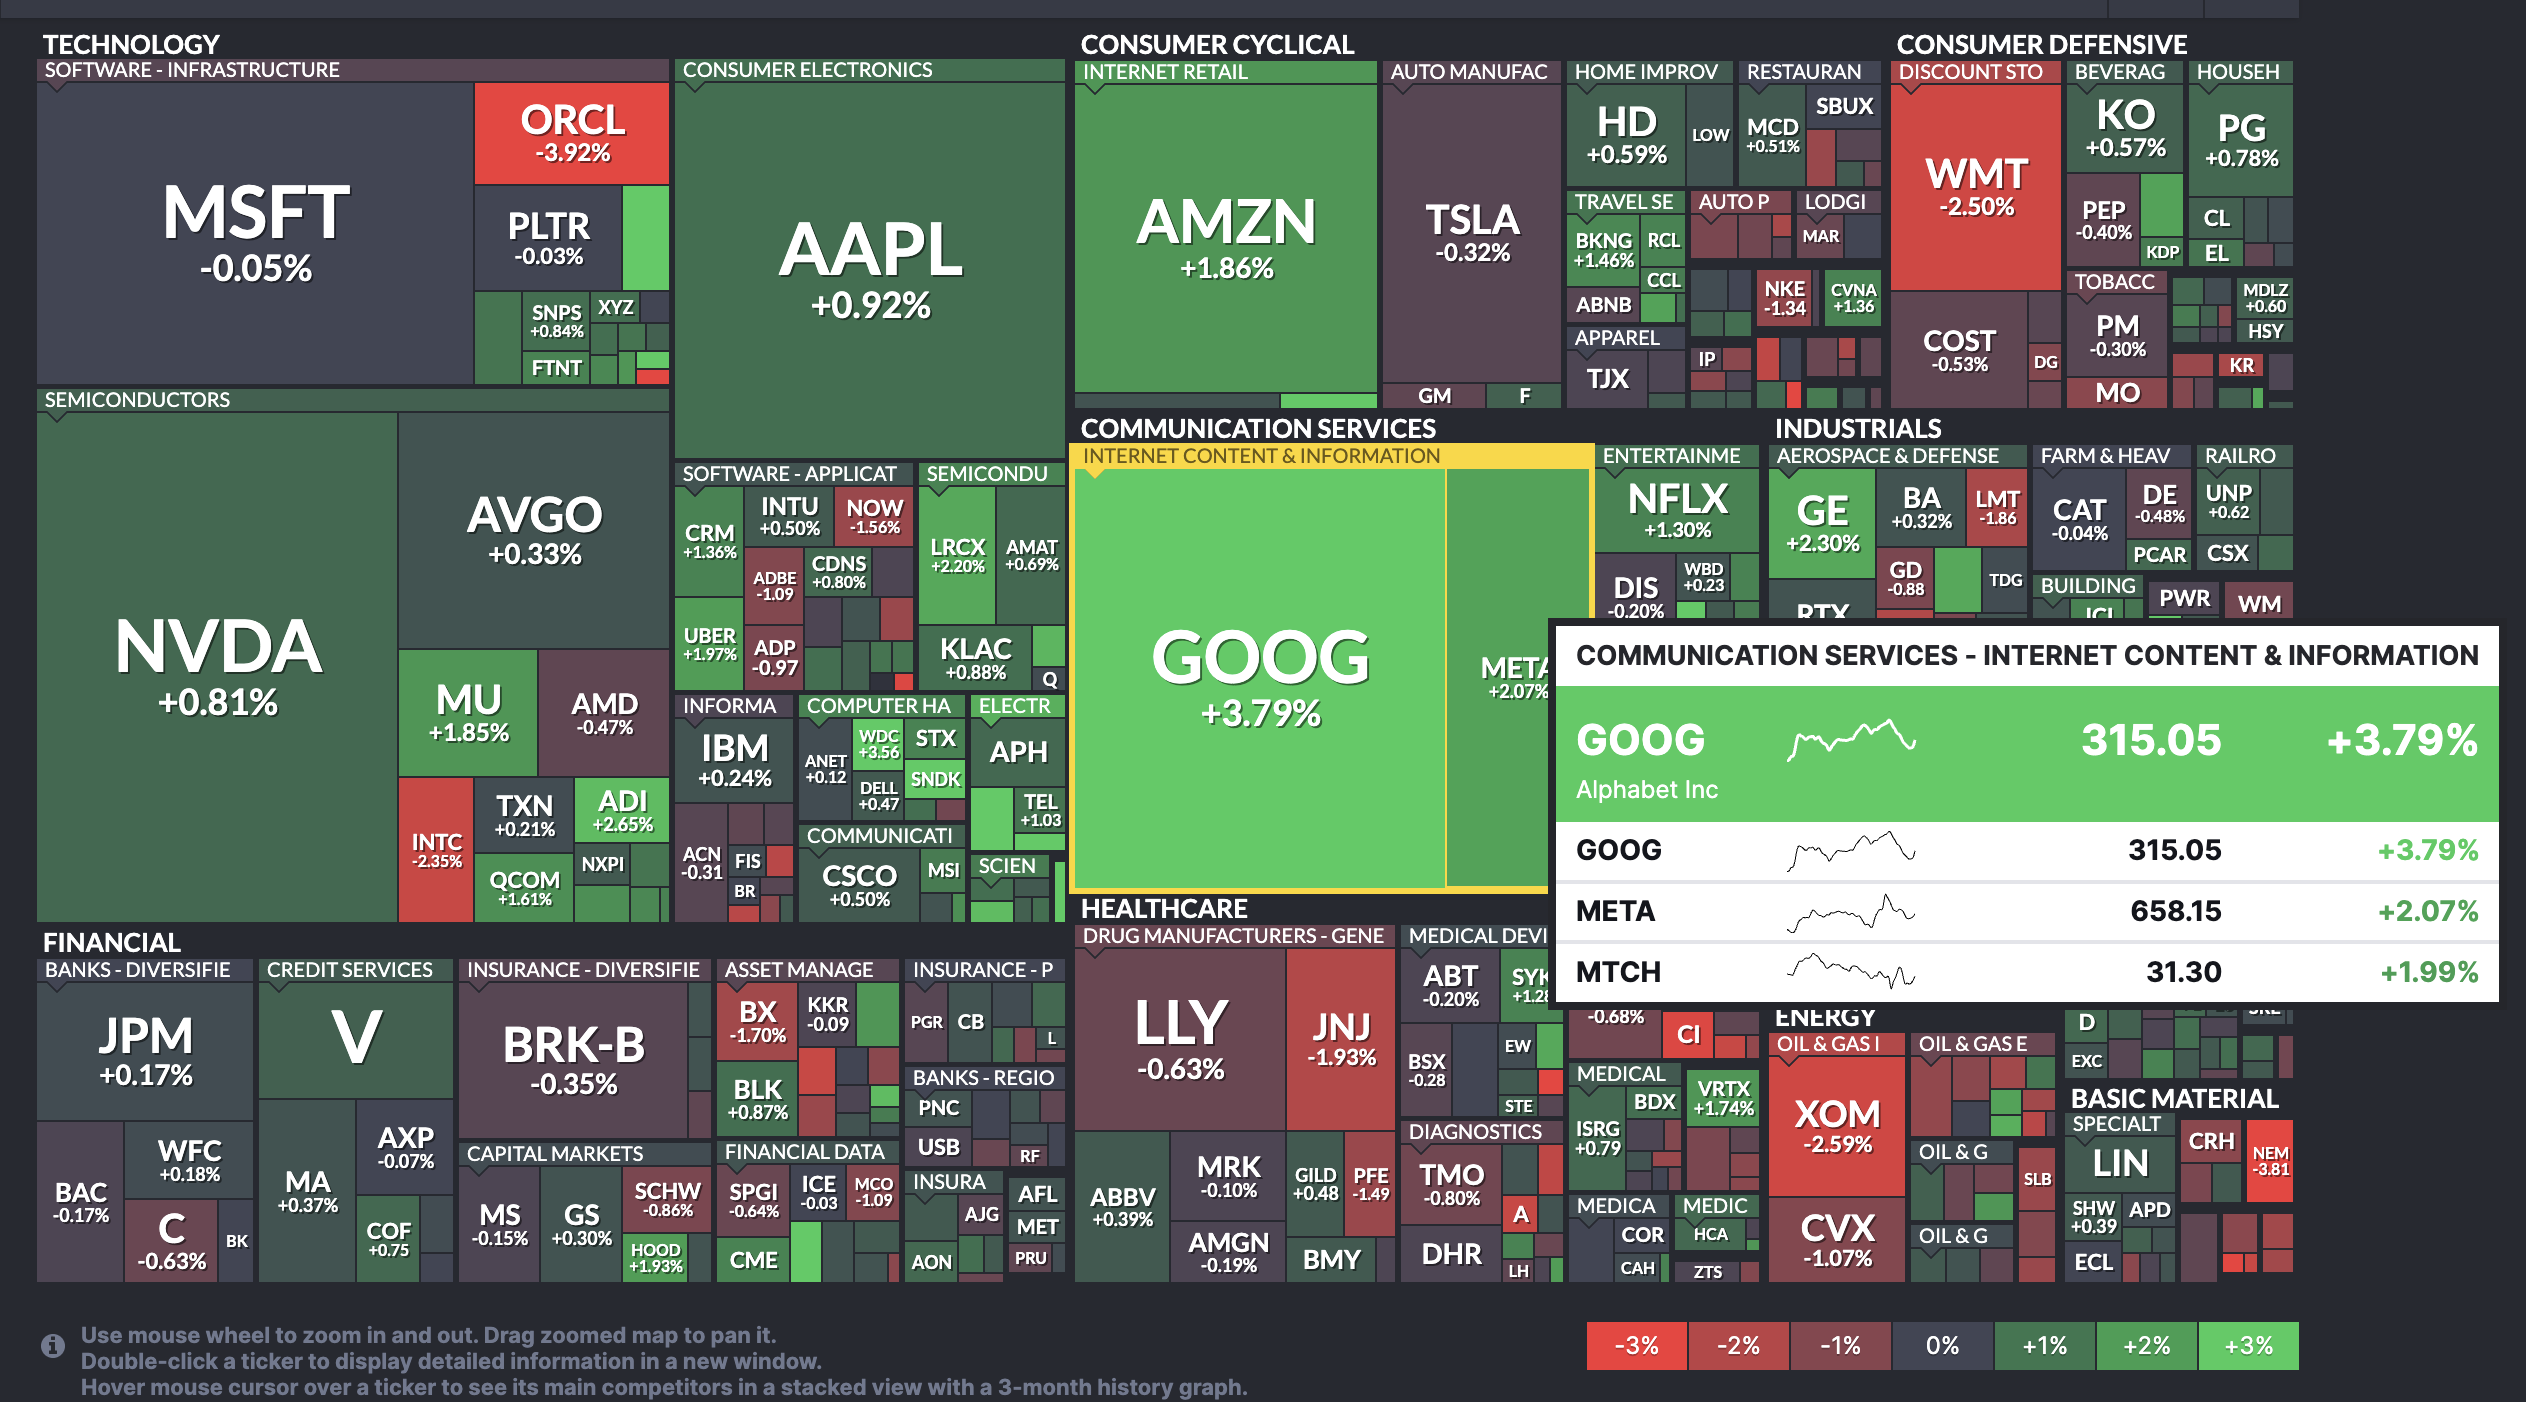
Tech (XLK) leads the rebound on tariff relief while Energy (XLE) gives back early gains despite rising oil prices. Alphabet (GOOGL) stands out, almost independently, with a 3.8% surge as it attempts to break free from a bearish pattern.
Top US Stock Market News:
Wall Street Recovers From Stagflation Scare As Tariff Ruling Sparks Relief Bounce
Wall Street faced one of its most dramatic intraday reversals on February 20, 2026. The morning opened with panic as the “data deluge” delivered a stagflation-like combination.
Advance Q4 GDP slowed sharply to 1.4% (well below the 2.8% consensus), while Core PCE accelerated to 3.0% YoY, its hottest reading since mid-2025. S&P 500 futures dropped immediately after the 8:30 AM ET release.
But the mood flipped mid-session when the Supreme Court struck down President Trump’s sweeping emergency tariffs in a landmark 6-3 ruling. Markets interpreted the decision as a major deflationary catalyst going forward.
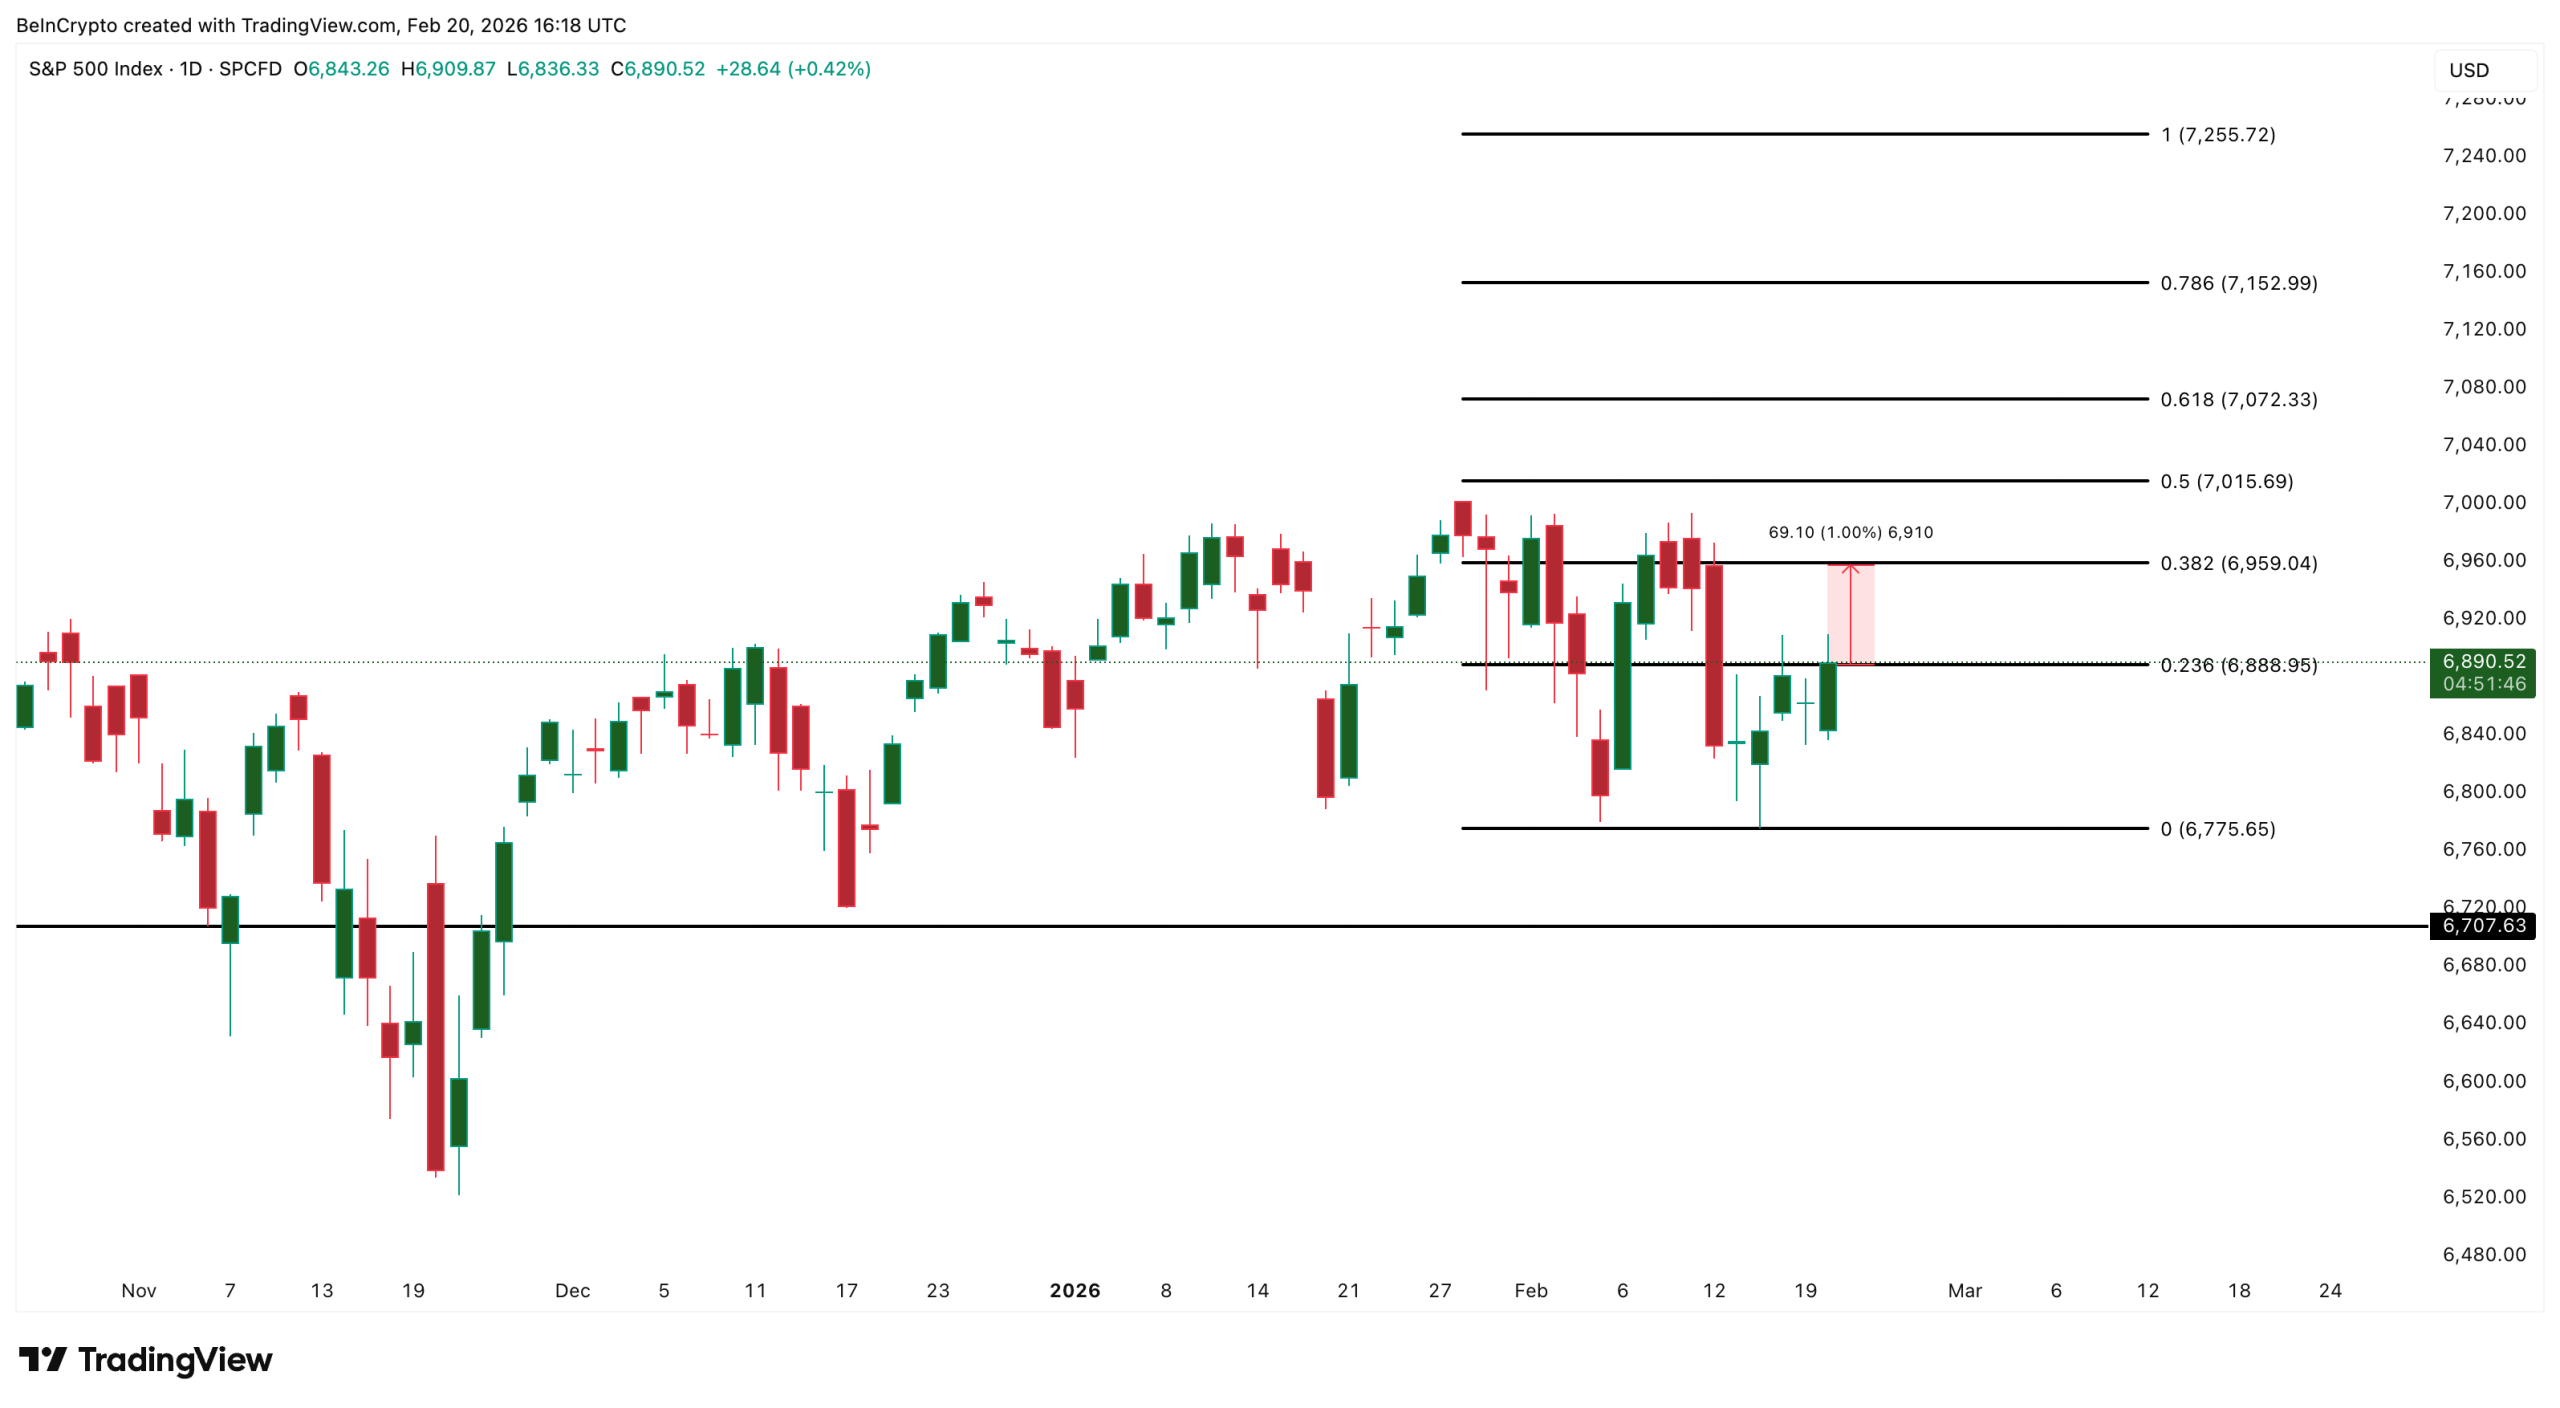
The S&P 500 is trading at approximately 6,890 at press time, up 0.45% from yesterday’s close. Moreover, the index is now flirting with a strong zone near 6,888.
A sustained move above this level opens the path toward 6,959, and clearing that could prime the index for the psychological 7,000 milestone.
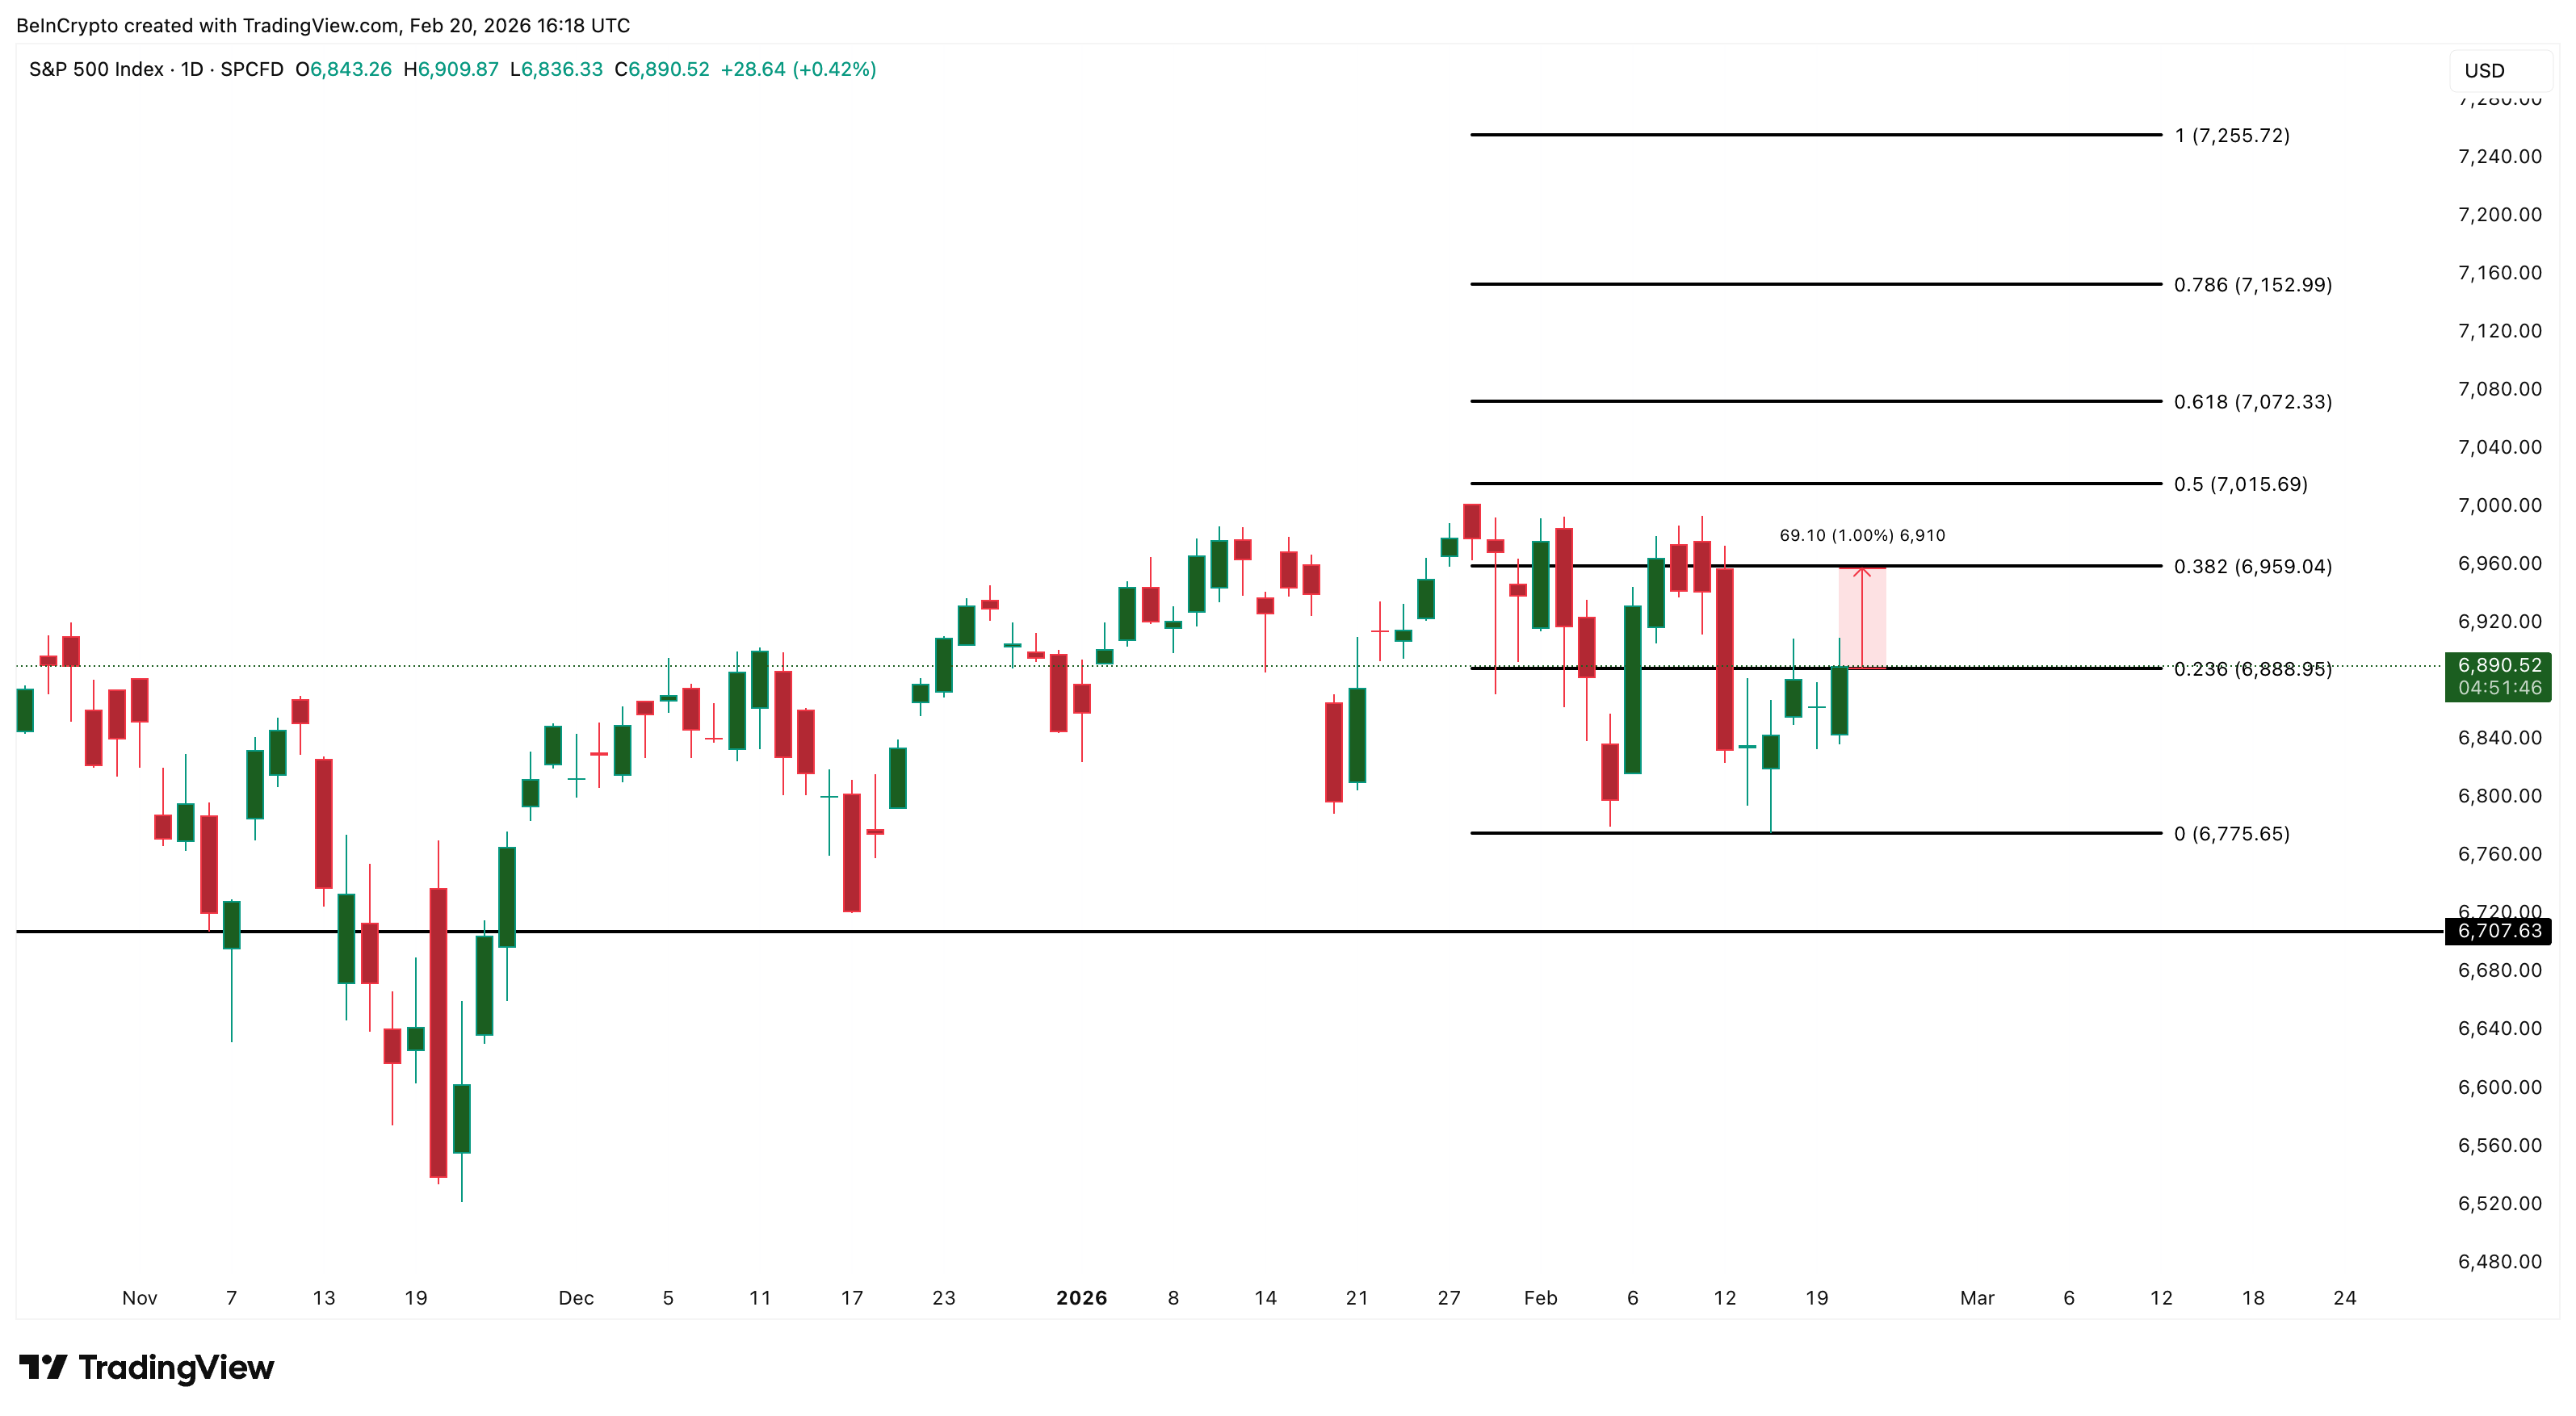
On the downside, 6,775 is the key support to watch. A break below that level would invite weakness toward 6,707.
However, upside conviction is not without risk. Experts are already flagging that the tariff ruling may not be the final word — the administration could pursue alternative tariff mechanisms, which could weigh on sentiment as the session progresses.
A move to key resistance still requires roughly a 1% push from current levels.
The Nasdaq leads the recovery, up 172 points (0.76%), and the DOW is up 68 points, at the time of writing.
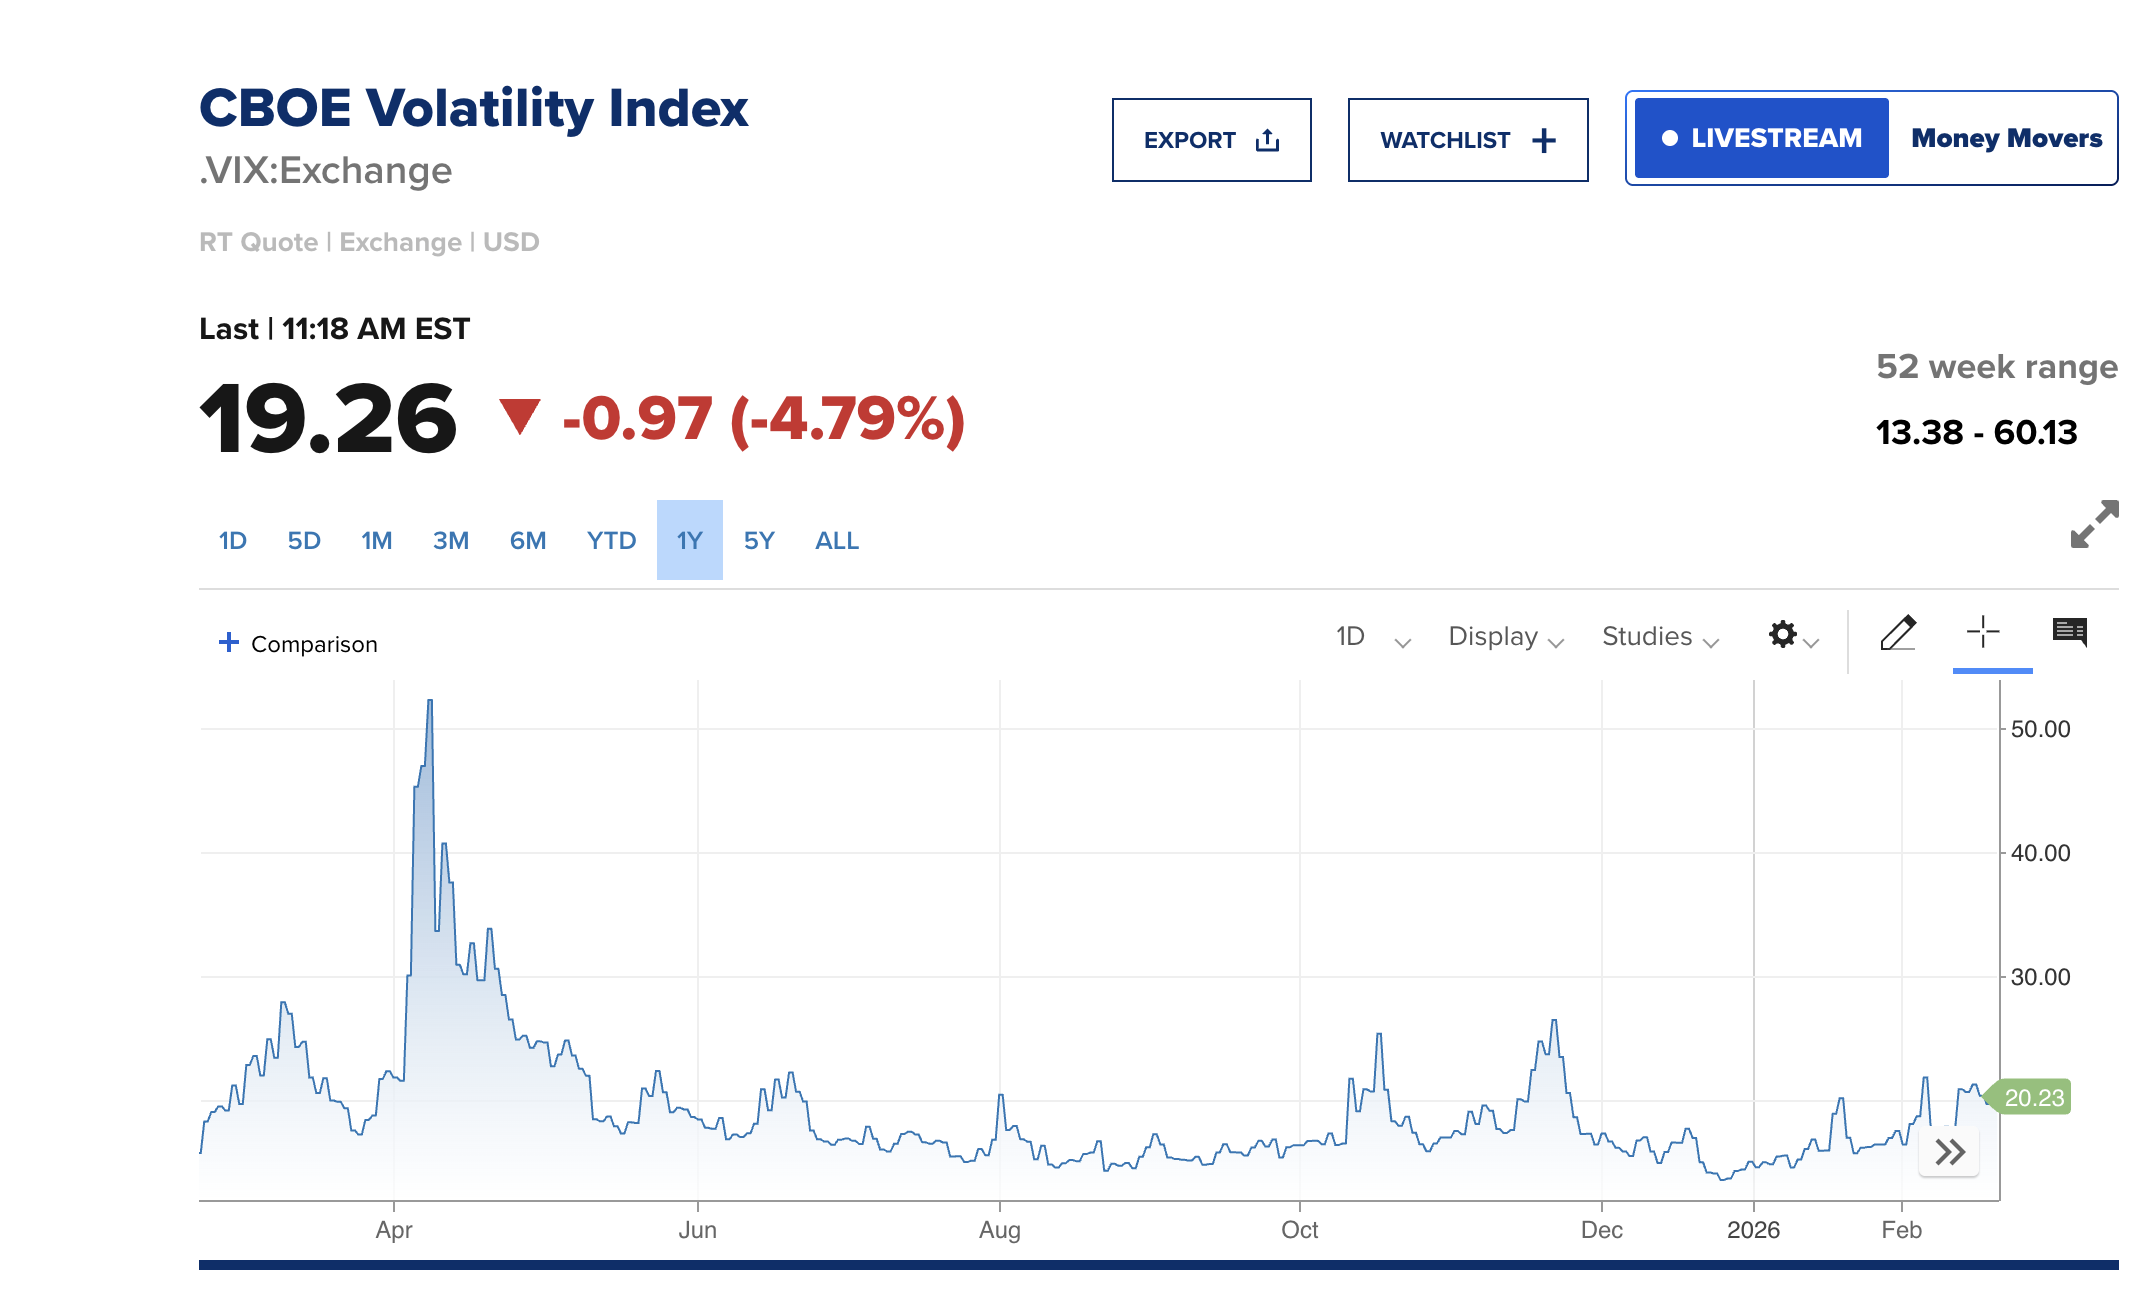
The CBOE Volatility Index (VIX) dropped sharply, falling approximately 5%. The move below 20 signals that the initial stagflation panic has eased and the market is shifting back toward a cautiously optimistic posture.
The tug-of-war is clear: stagflation data pulling markets down, tariff relief pulling them up. Onto the sectors now.
Tech Rallies While Energy Dips, But Builds Bullish Case
The sector story on February 20, 2026, takes an unexpected turn. The surface numbers tell one story, but the charts tell another.
Technology (XLK) is up 0.36% at $140.72, benefiting from the Supreme Court’s tariff strike-down as lower import costs directly support hardware and semiconductor supply chains.
However, the rally faces a ceiling. XLK attempted to cross above the $141.29 resistance, but sellers stepped in. A daily close above this level is needed to open the path toward $144.78 and eventually the $149–$150 zone.
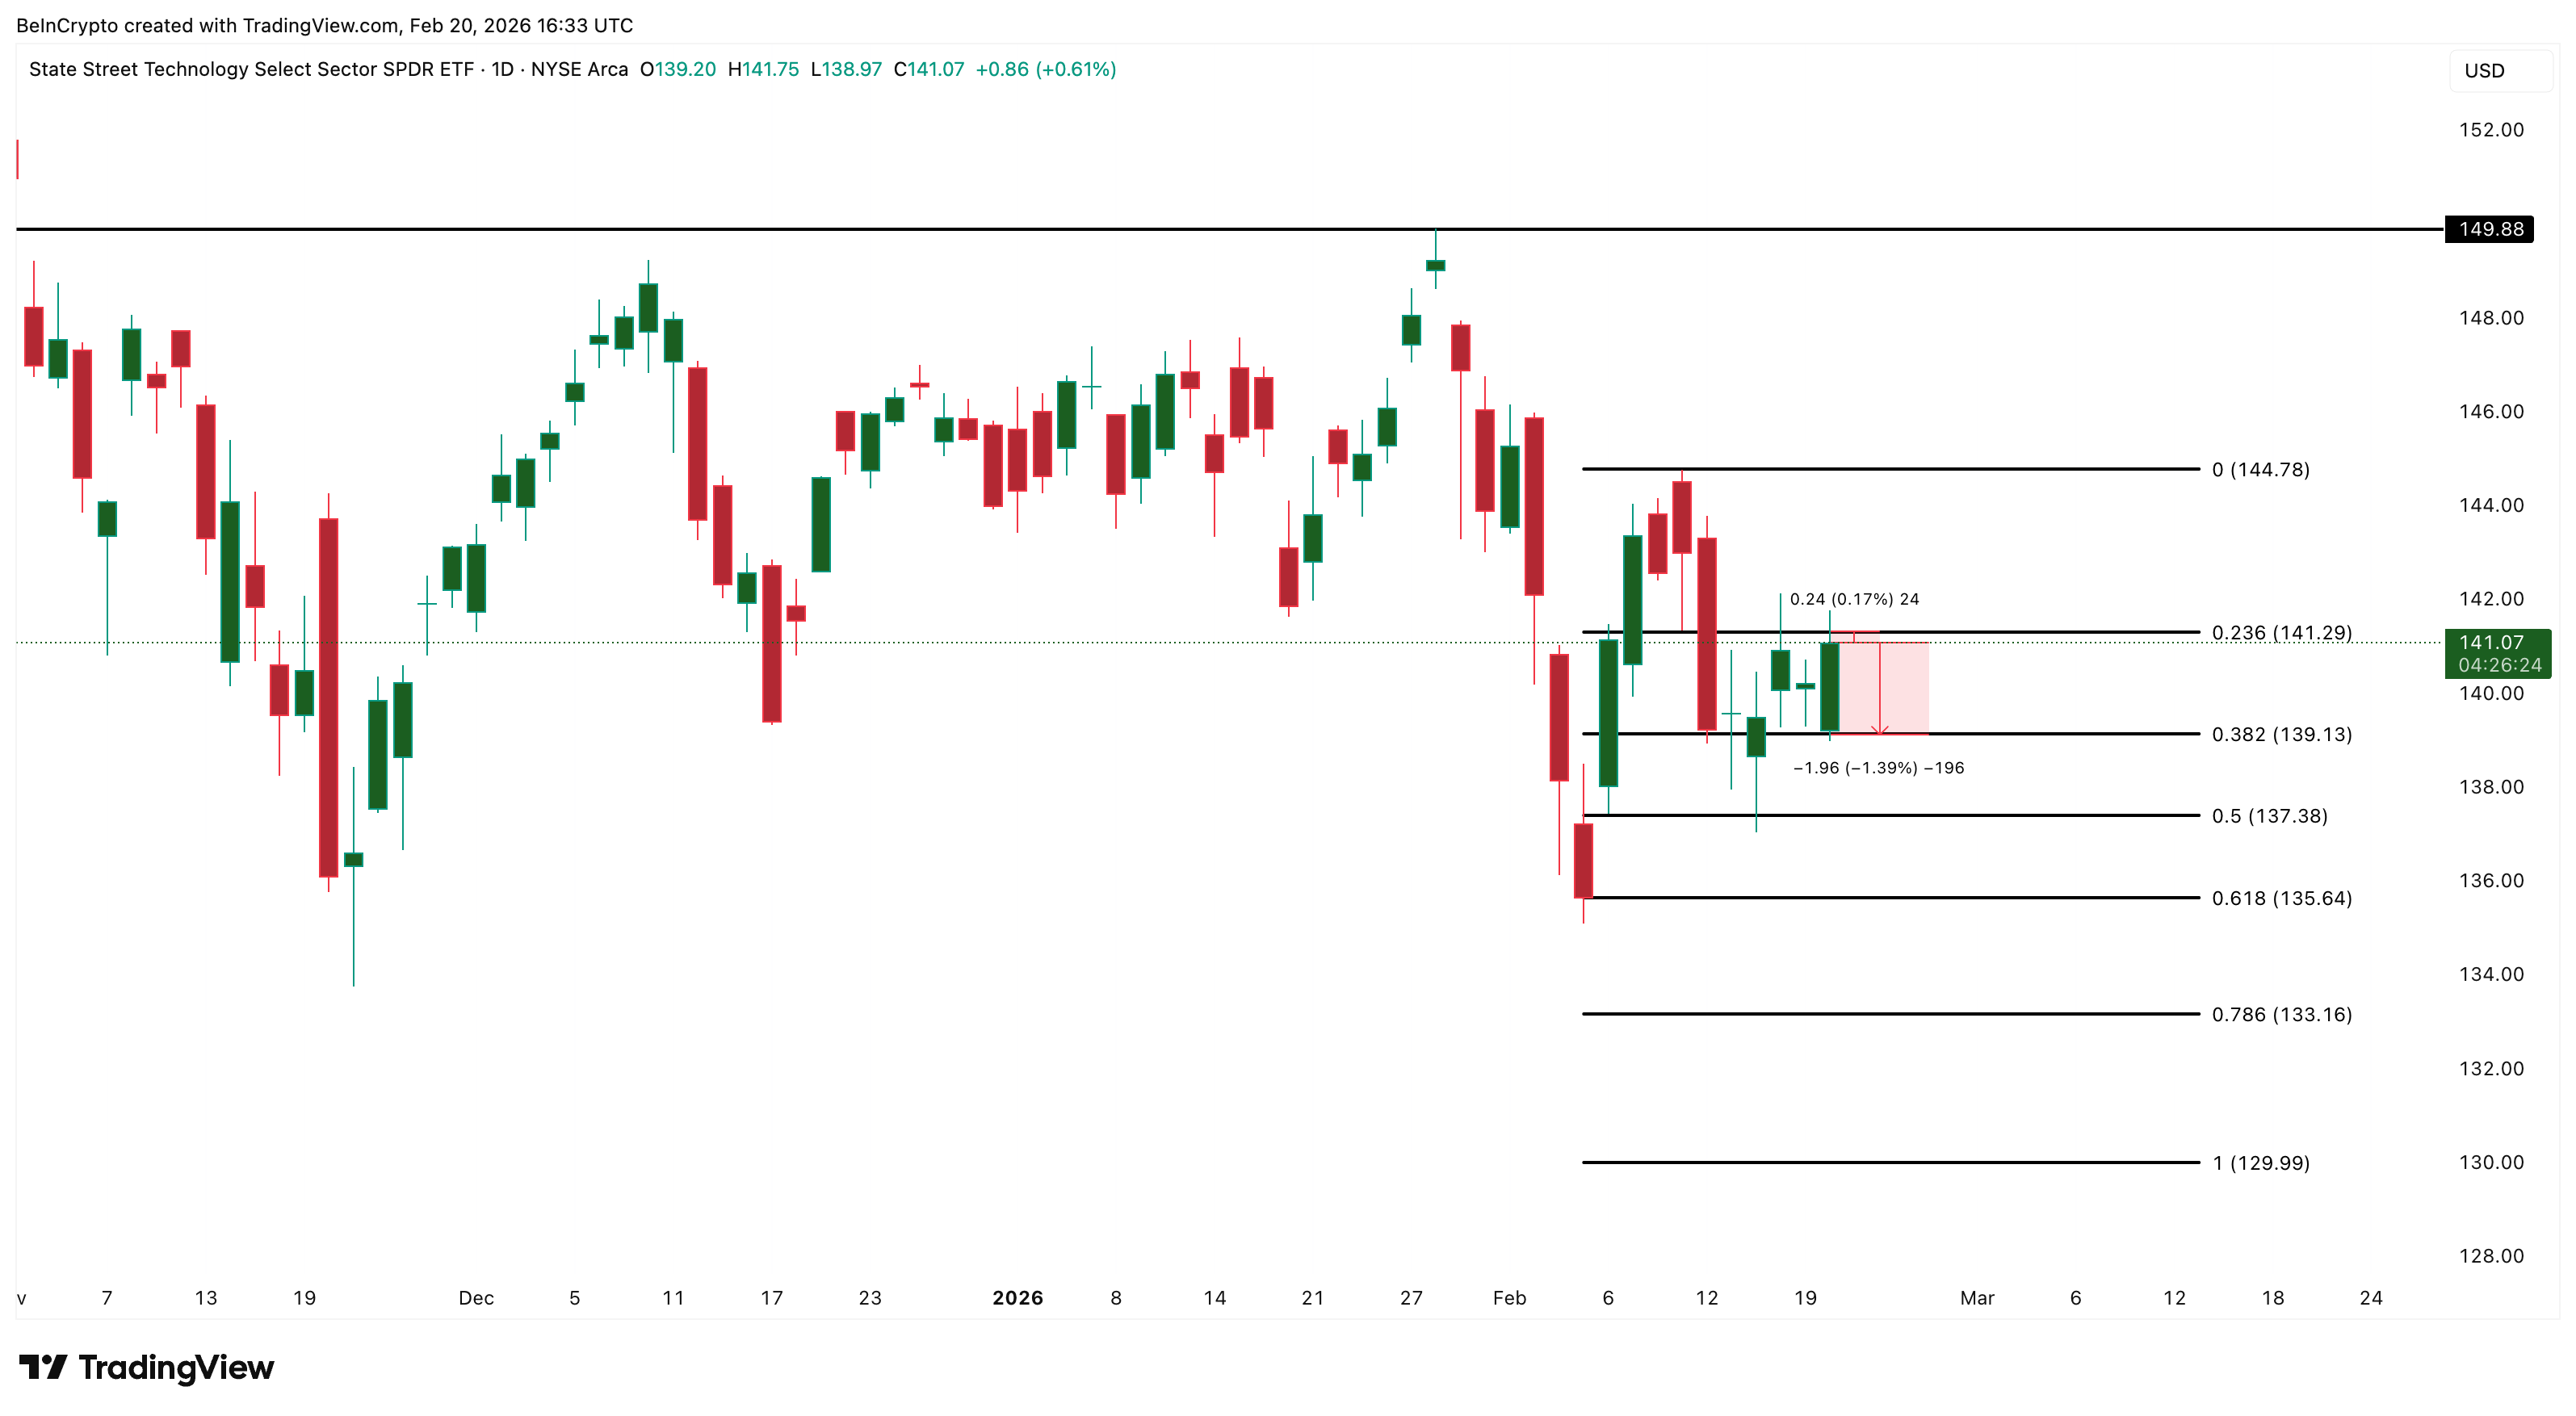
A failure to hold above $139 would flip the short-term structure bearish. The tariff relief provides the US stock market catalyst, but with Core PCE at 3.0%, reinforcing higher-for-longer rates, tech valuations remain under pressure.
Energy (XLE) tells the opposite story. The sector looked strong as US-Iran tensions pushed oil higher: WTI held above $66 and Brent above $71. But gains faded through the session, with XLE now down 1.09% since yesterday.
Yet the XLE chart tells a more constructive story underneath the red. The ETF appears to be consolidating inside a bullish flag. If the breakout confirms above $55.90, it could target $60.29 — roughly a 10% move.
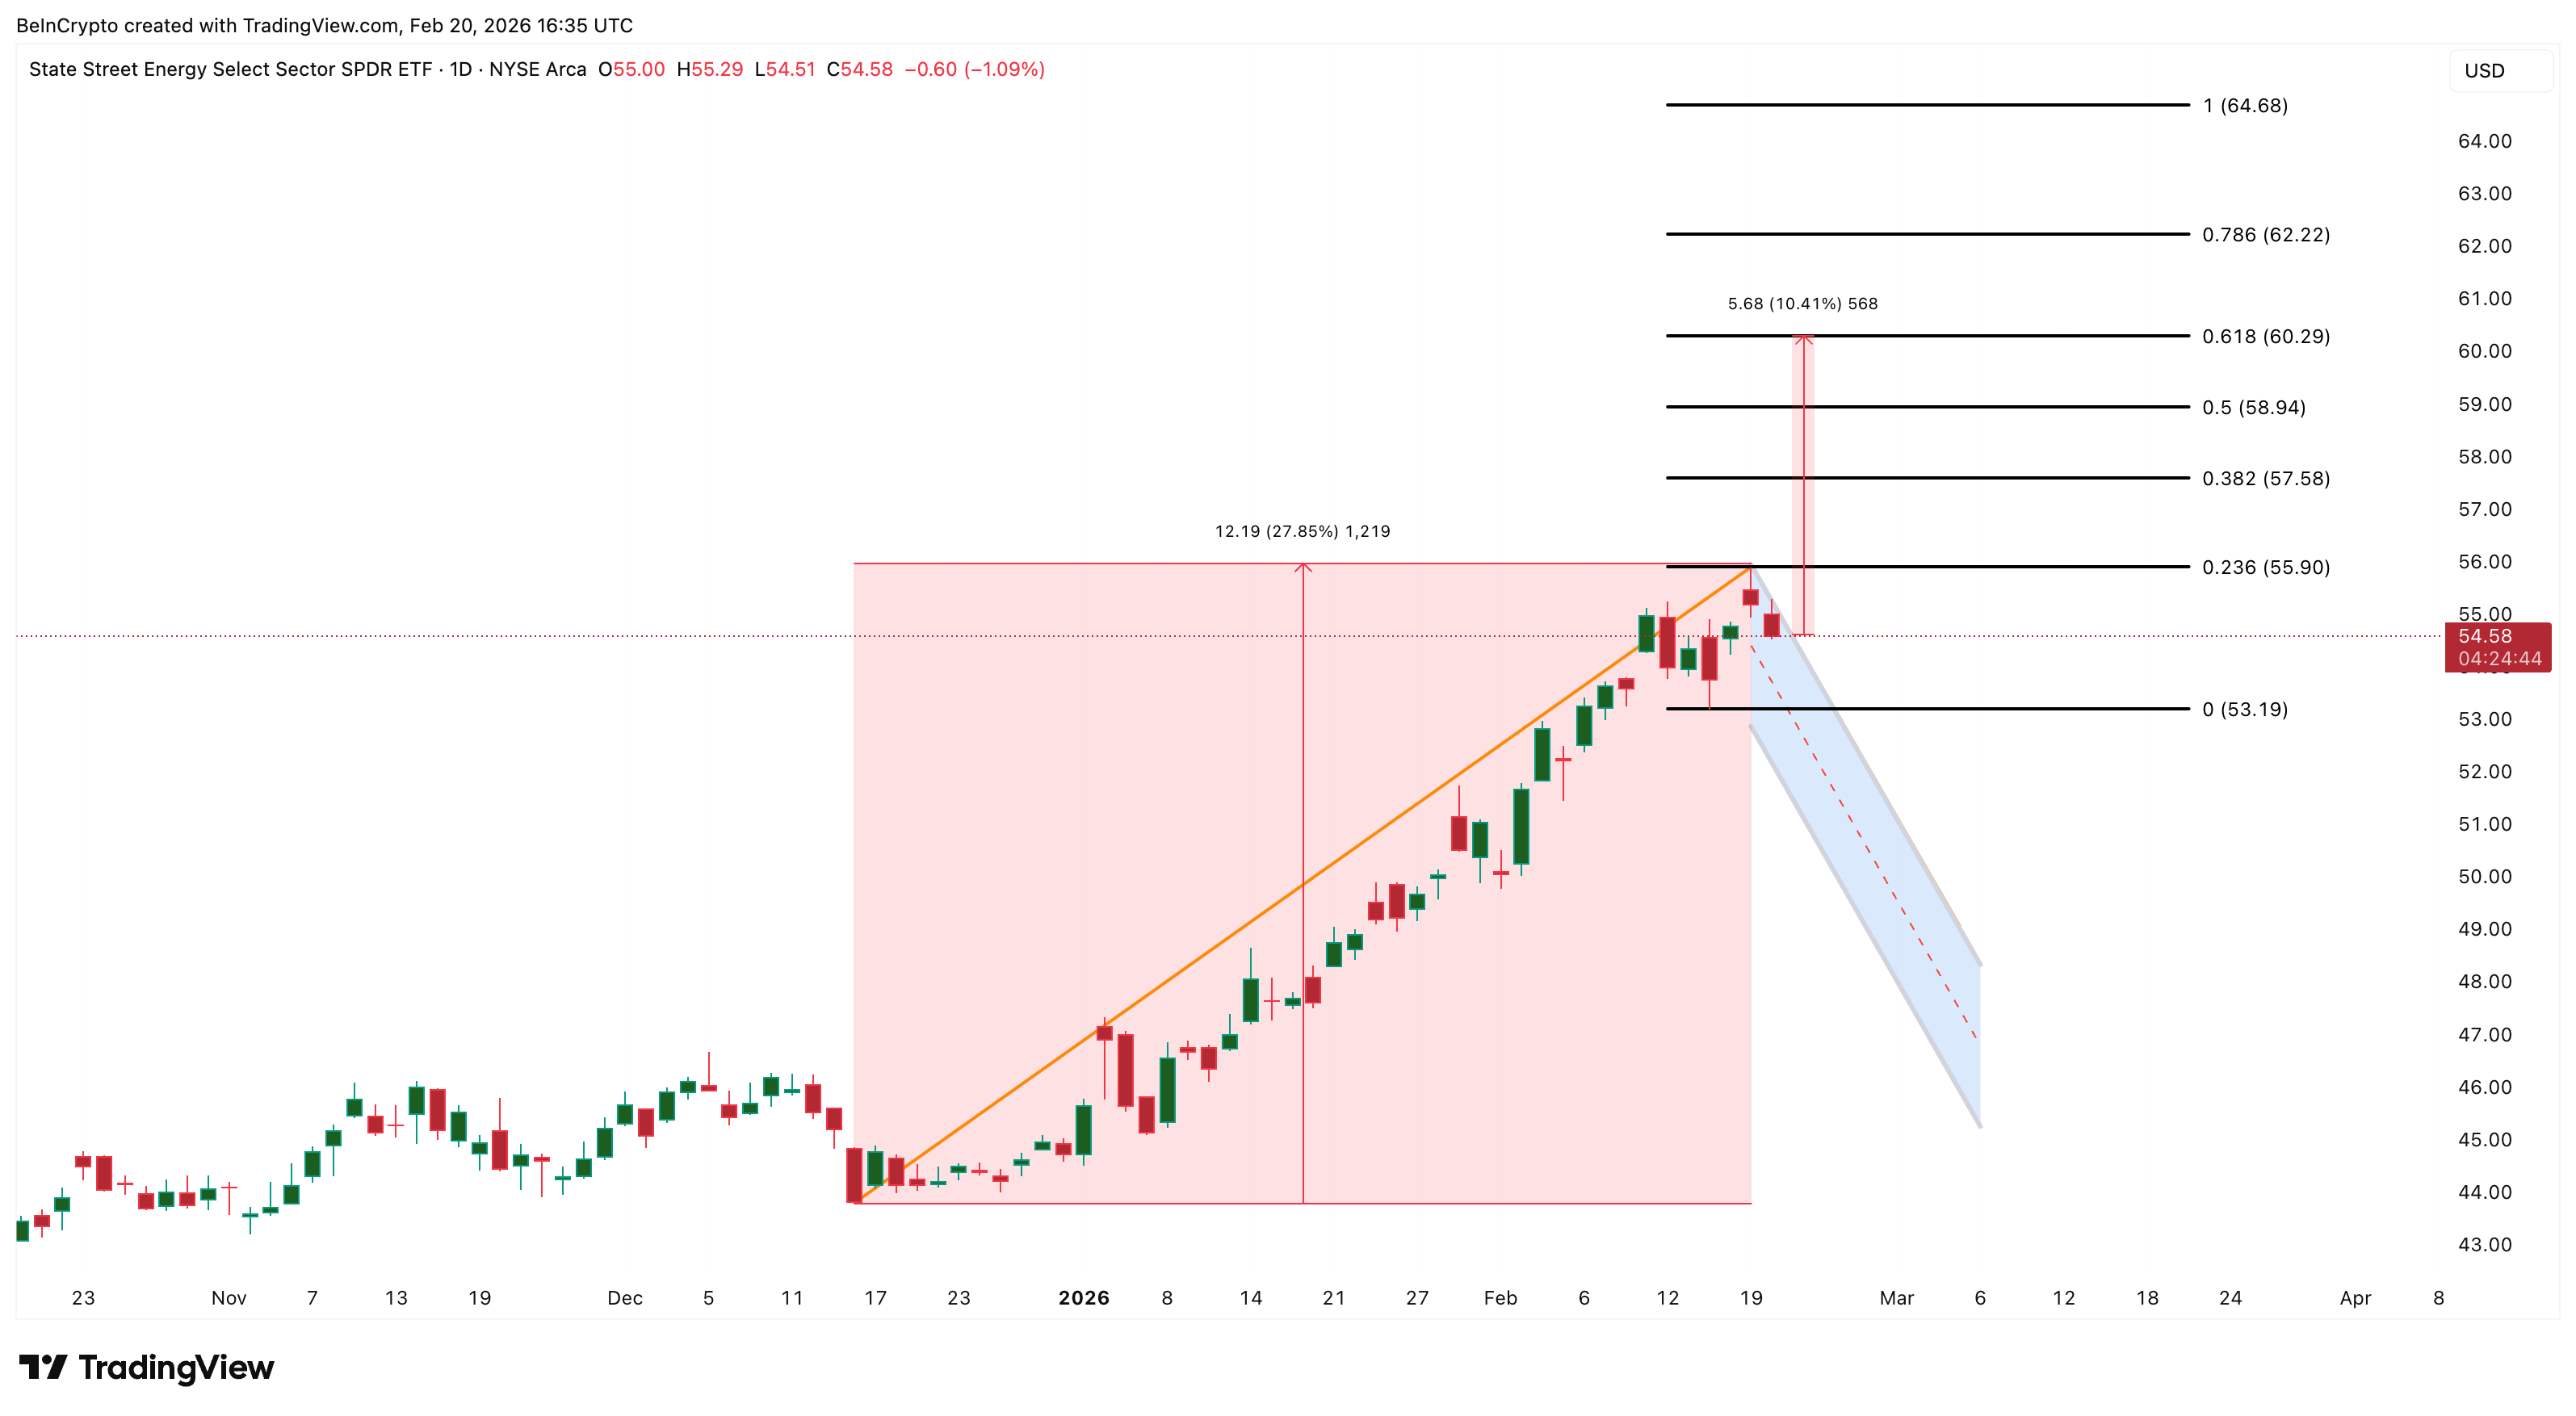
The full measured move from the previous leg projects a potential 27% rally. A drop below $53.19 would invalidate the setup.
Alphabet (GOOGL) Surges As Bears Lose Grip
Alphabet (GOOGL) is the standout US stock market mover on February 20, 2026, surging approximately 3.8% to trade around $316. The stock has shown sustained buying momentum with no significant upper wick, yet, a sign that sellers have not stepped in to cap the bounce.
The move is notable because Alphabet had been trapped inside a bearish flag pattern after pulling back from its early February highs. Today’s surge is attempting to break down that bearish structure, reversing off the $296–$300 support zone and pushing toward pattern invalidation.
However, Alphabet is not out of the woods yet. A sustained move above $327 — extending to $330 — is needed to fully invalidate the bearish setup and confirm a larger bullish reversal. Until those levels are cleared, the risk of a failed breakout remains real.
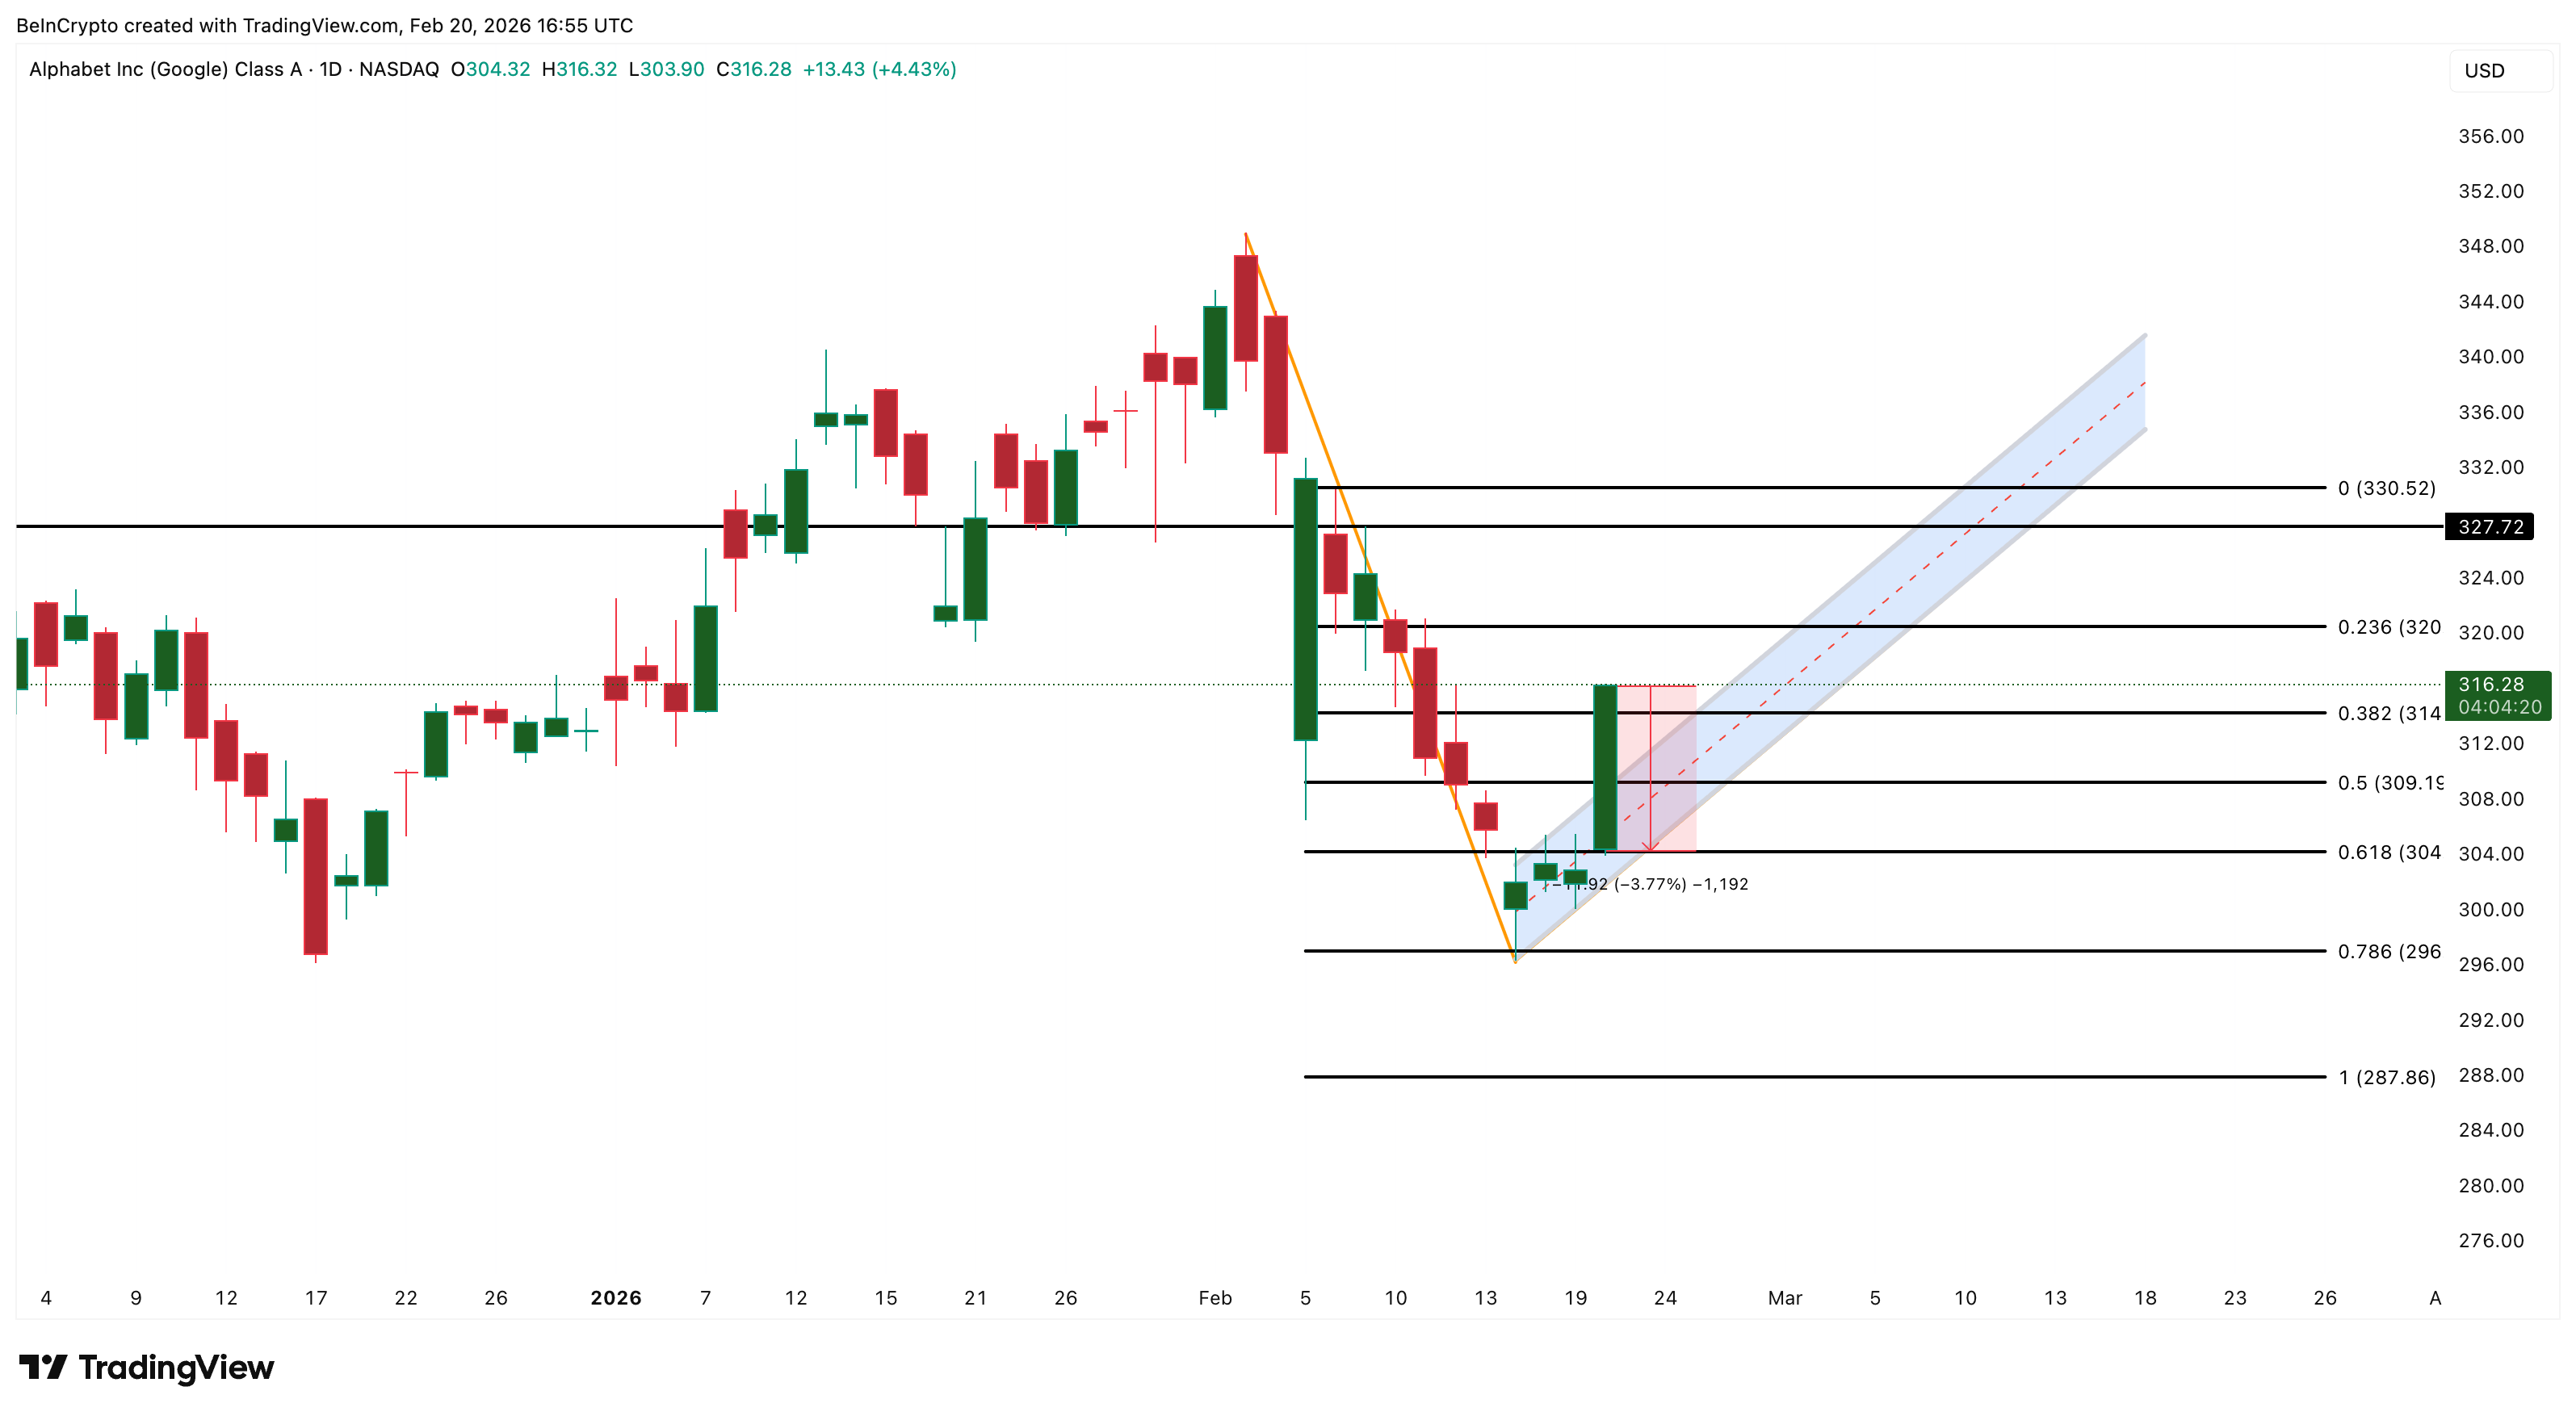
On the downside, a drop back below $304 would weaken the breakout attempt and reintroduce bearish pressure. Further weakness under $296 could accelerate selling, potentially re-testing lower supports and resuming the bearish flag pattern — erasing today’s entire gain.
Within Communication Services, Alphabet is leading while Meta also posts gains, as over 51% of stocks are in the green.

While other sectors stabilize with muted moves, Alphabet’s sizable independent rally signals that dip-buyers are aggressively positioning in AI-linked growth names.


Bitcoin’s drawdown narrative is shifting from a pattern of extreme collapses to a more mature market dynamic, according to Cathie Wood, the founder and CEO of ARK Invest. In a CNBC appearance on Squawk Box dated April 1, Wood argued that the era of 85% or greater corrections may be behind BTC, framing the asset as a proven technology and monetary tool rather than a volatile tech experiment.
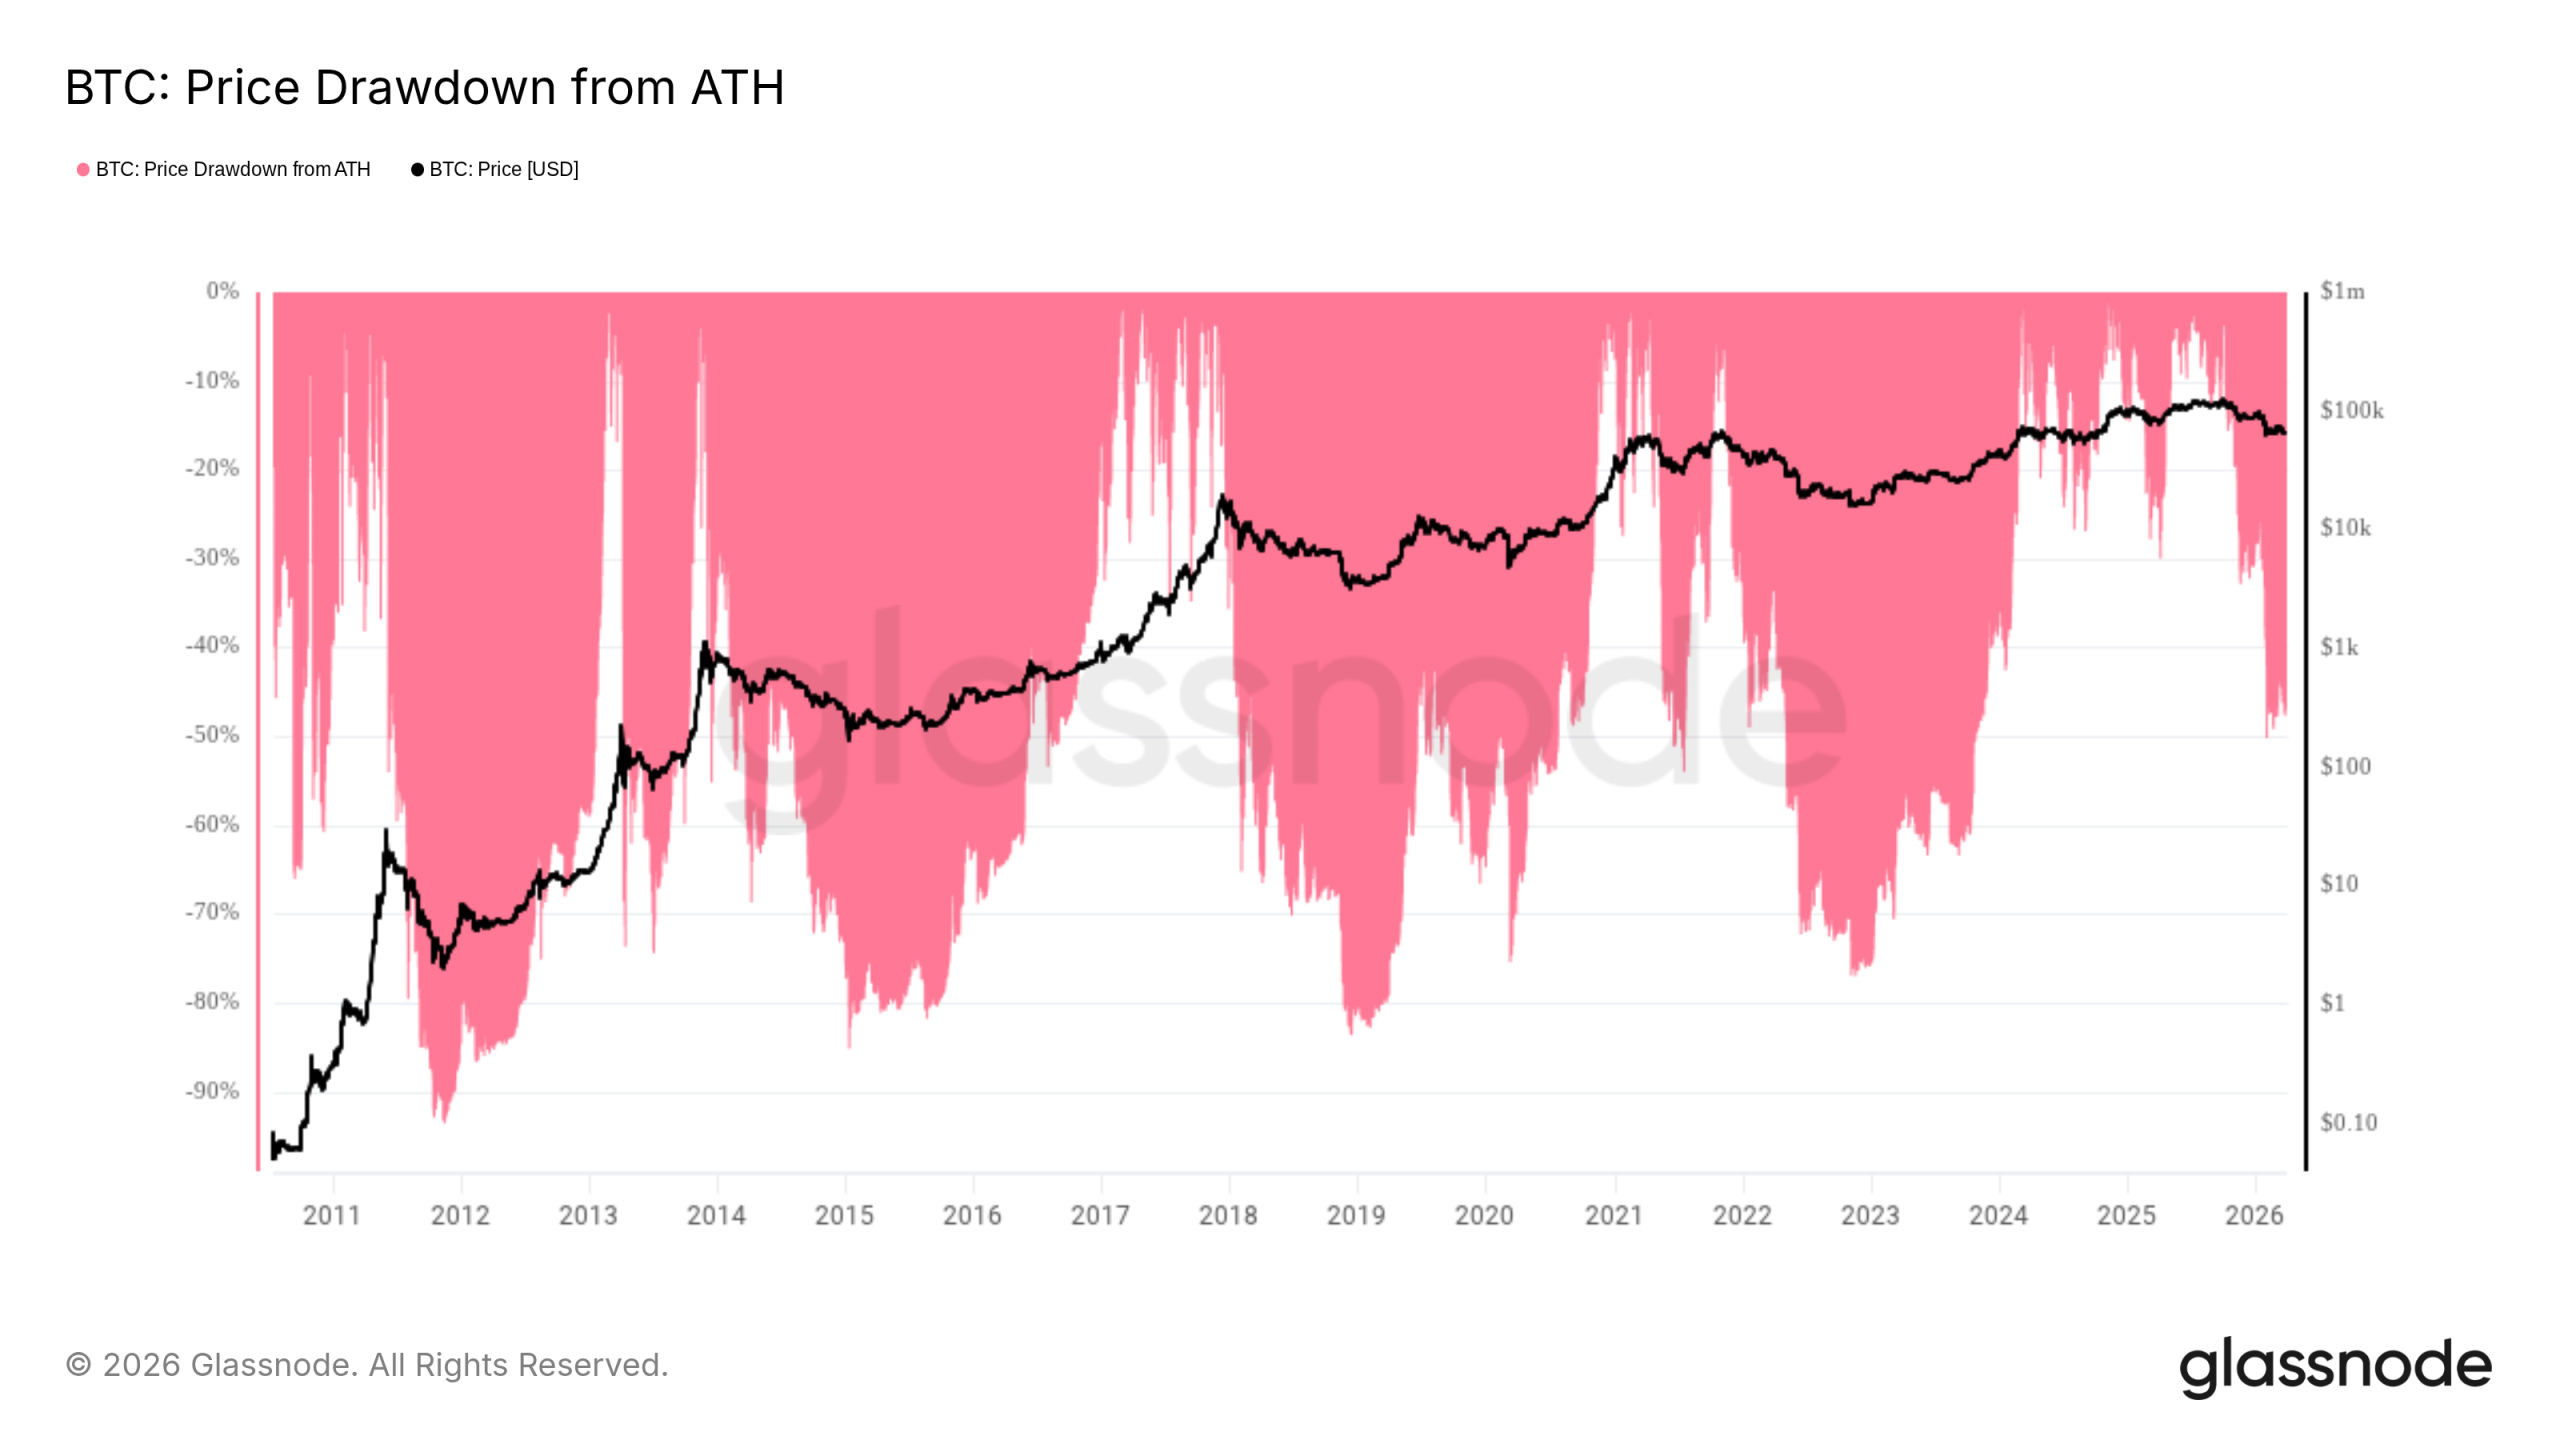
Speaking amid a price backdrop around the 69,000 level—the prior all-time high reached in 2021—Wood’s remarks come after a long bear market that wiped out roughly 80% of BTC’s value before a bottom near 15,600. On-chain data, however, suggest the current downturn has not yet mirrored the depth seen in prior cycles. Glassnode data indicate the bear market’s maximum drawdown from BTC’s peak remains well short of past extremes, around 52% from the record high of about 126,200 in October 2025.
Key takeaways
- ARK Invest’s Cathie Wood argues Bitcoin is past the era of 85%+ price collapses, framing BTC as a proven technology and monetary asset rather than a speculative fad.
- Analysts disagree on the next significant price level: a chartist forecast points to roughly $34,000 as a bottom (a 72% drawdown), while consensus from broader coverage points to a range of roughly $40,000 to $50,000.
- On-chain data show the bear market depth to date is shallower than in some previous cycles, with maximum drawdown around 52% from the all-time high, suggesting a potentially different extinction-like pattern for BTC.
- April seasonality and near-term momentum remain in focus: some analysts see historical patterns of spring recoveries during bear phases, while macro headlines and liquidity conditions continue to influence the path forward.
Wood’s view: BTC’s maturation and the new normal
Wood’s comments came during a dialogue about Bitcoin’s long-run narrative. She stressed that the 85–95% declines associated with earlier, less mature markets are unlikely to recur for Bitcoin, a narrative she frames as evidence of BTC’s transformation into a validated monetary system and a new asset class. The remarks echo her longstanding bullish stance on Bitcoin, which has been a hallmark of ARK’s research orientation toward disruptive technologies.
At the time of her appearance, Bitcoin was hovering near the post-2021 high watermark—an area that previously marked the transition into a multi-quarter bear cycle. Wood’s perspective contrasts with the more cautious or range-bound themes that have dominated much of the current trading backdrop, where macro conditions, policy signals, and sector rotation often determine day-to-day moves.
That said, Wood’s optimism sits alongside a chorus of caution from other analysts who note that the road ahead remains data-driven and uncertain—a reminder that even as BTC stabilizes, macro headwinds can quickly reassert themselves.
Forecasts diverge on the floor of the bear market
While Wood’s stance centers on BTC’s maturation, other voices point to specific downside scenarios. Tony Severino, a veteran market technician, floated a bottom near $34,000, implying a 72% drawdown from the peak. He summarized the trajectory in a post on X, suggesting that a decline to that level would mark a “max drawdown” consistent with a new phase for the asset.
Beyond Severino’s projection, broader market commentary remains split. A section of traders and analysts continues to anticipate a bottom in the higher $40,000s to low $50,000s, a range that Cointelegraph has cited in prior coverage as a common region for a generational floor rather than a catastrophic collapse. For some observers, the 40k–50k zone remains the anchor for a long-term re-rating of Bitcoin’s risk profile.
Meanwhile, Bloomberg Intelligence analyst Mike McGlone has warned that prices could be trending toward seven-year lows, underscoring the risk that macro developments—such as central-bank policy and global liquidity—could extend the bear phase even as on-chain metrics offer a more nuanced view of drawdown depth.
Seasonality, on-chain signals, and what to watch next
Seasonality has long been cited as a potential internal driver of Bitcoin’s price path. Timothy Peterson, a network economist and commentator, highlighted a pattern in which April historically functions as a turning point during bearish cycles. A chart he shared on X illustrates April as a potential inflection month in past bear phases, though whether that dynamic repeats remains contingent on broader market conditions.
March’s monthly close added a modest, 1.8% gain for BTC/USD, effectively ending a five-month losing streak. The move, while not dramatic, keeps the door open for a spring rebound, provided macro momentum aligns with technical and on-chain signals.
On-chain context adds another layer to the discussion. Glassnode’s analysis shows that the current bear market’s depth—though material—is not yet aligned with the most severe declines observed historically. The all-time high of roughly 126,200 in October 2025 has given way to a drawdown of about 52%, a figure that suggests the market could behave differently than in previous cycles if macro conditions stay supportive or liquidity improves.
For investors, this combination of on-chain resilience and mixed macro signals creates a nuanced backdrop. A Bitcoin trading environment shaped by a less severe drawdown yet ongoing external headwinds could translate into a more protracted consolidation rather than a sharp capitulation or a swift breakout. Observers will be watching for signs of sustained demand, improving liquidity in risk markets, and any shifts in policy that could alter the risk-reward calculus for crypto exposure.
As the calendar turns to April, market participants will parse a mix of seasonality whispers, data-driven cautions, and evolving macro narratives. The next several weeks could prove decisive in whether BTC resumes a broader uptrend, remains range-bound, or teeters on renewed volatility as external conditions shift.
This article synthesizes observations from multiple sources, including Cathie Wood’s CNBC discussion, on-chain data from Glassnode, and commentary from market analysts such as Tony Severino and Mike McGlone, as well as prior coverage from Cointelegraph on price floors and seasonality in Bitcoin’s bear markets. Investors should treat forecasts as probabilistic scenarios rather than certainties and remain mindful of the evolving macro landscape that continues to shape crypto markets.
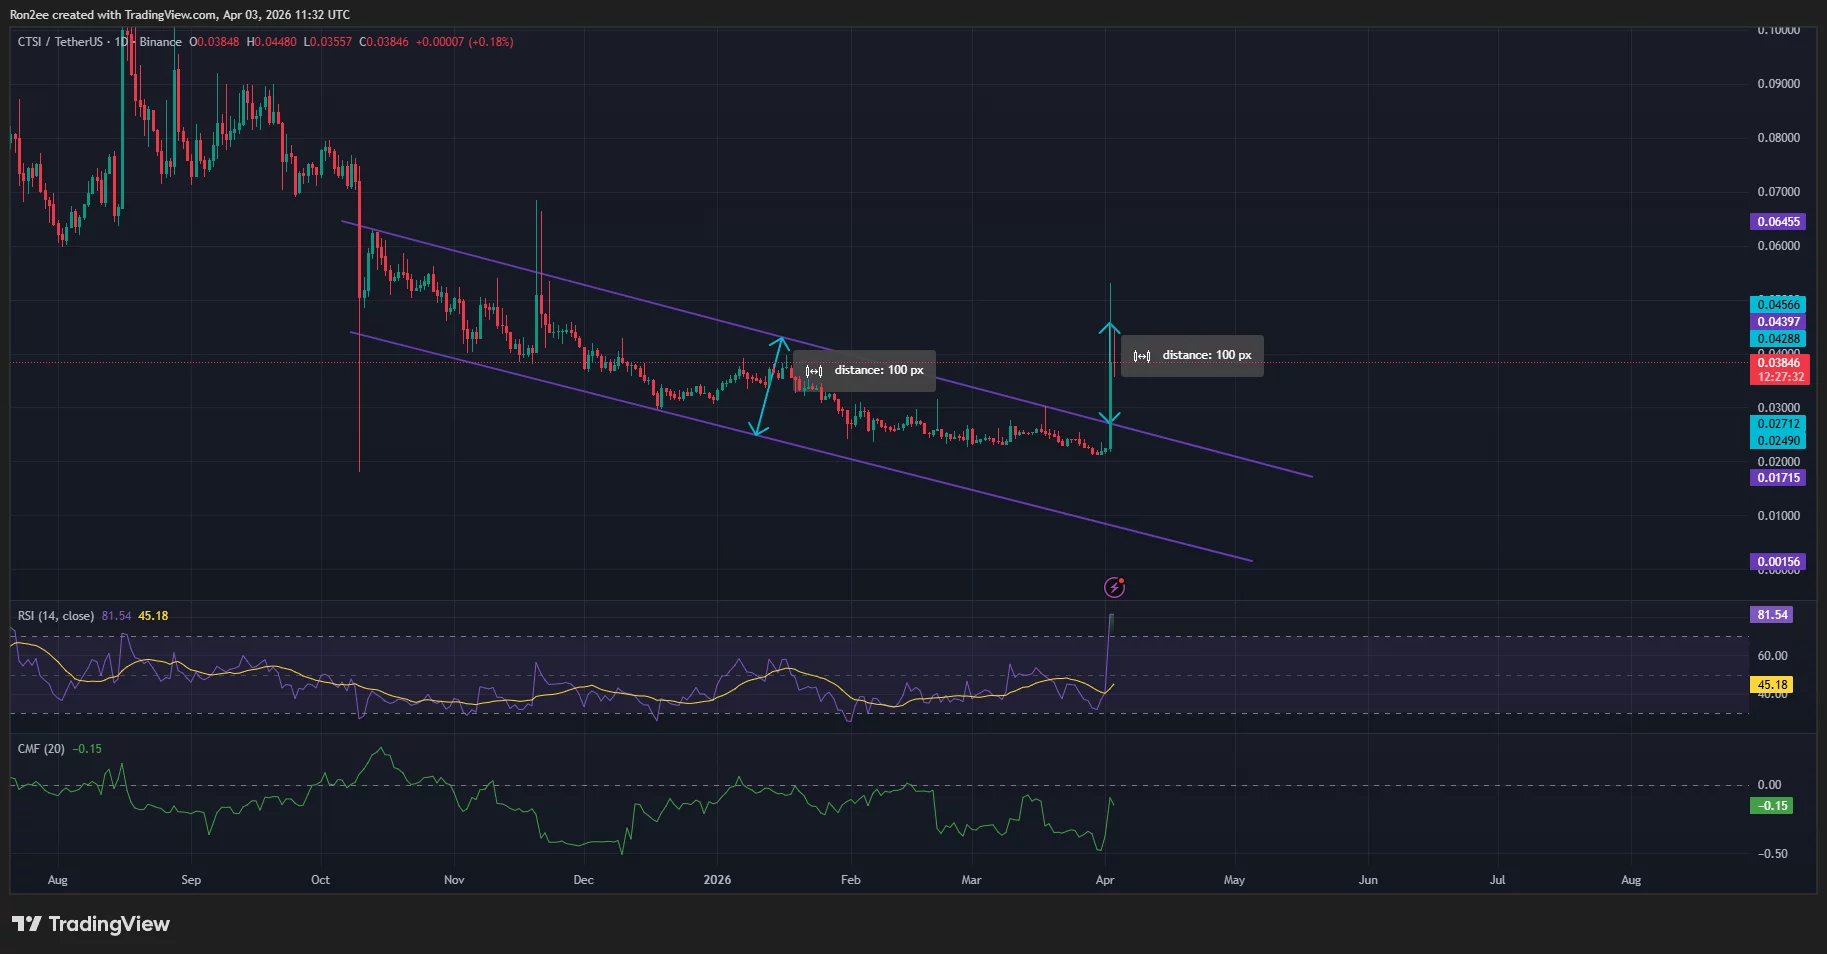
Cartesi token soared over 100% to a 3-month high of $0.049 on Friday. Will the Layer 2 token edge higher over the coming sessions, or will it succumb to profit-taking?
Summary
- Cartesi price surged over 100% to a three-month high amid a sharp rise in trading volume and a short squeeze.
- The rally was driven by progress toward L2BEAT Stage 2 status and growing developer activity around Cartesi Machine deployments.
- Technical indicators show overbought conditions and profit-taking signals, with CTSI price at risk of a pullback toward $0.030 support.
According to data from crypto.news, Cartesi (CTSI) price rallied nearly 110% to $0.049 on Friday, reaching its highest level since November 2022.
The rally came in a high-volume trading environment. In the past 24 hours, the daily trading volume of Cartesi rose 1,260%, suggesting a sharp rise in demand from traders that likely buoyed the token toward its highs today.
There are three main reasons why Cartesi price broke out today.
First, Cartesi’s Permissionless Refereed Tournament fraud-proof system is reportedly nearing the Stage 2 classification by L2BEAT. This milestone would rank it among the most secure and decentralized Layer 2 scaling solutions, setting it apart from competitors that still rely on permissioned validators.
Second, the project’s recent initiative to ship high-throughput applications reached critical implementation deadlines in April. Tangible developer interest in the Cartesi Machine, which allows decentralized apps to run on Linux, is finally translating from theoretical potential into live deployments.
Third, after months of trading in a narrow range of $0.02 to $0.025, the sudden break above long-term resistance triggered a volatility spike. This caused a short squeeze, forcing bearish traders to buy back their positions and further fueling the massive gains seen today.
On the daily chart, Cartesi price has broken out of a multi-month descending parallel channel pattern, a sign that bulls have finally gained control of the market. It has already attained the target level from the breakout, suggesting there could be some selloff on the horizon.

Such selloff risks also come as the relative strength index has crossed the overbought threshold. Crypto rallies often face some pullback when this metric hits an overbought state.
Additionally, the Chaikin Money Flow index showed a negative reading, a sign that investors have started to rotate capital or take profits at these higher levels.
Hence, the Cartesi token could likely retest its immediate support of $0.030 before its next leg higher.
Disclosure: This article does not represent investment advice. The content and materials featured on this page are for educational purposes only.
Bitcoin (BTC) is “done” with drawdowns of 85% or more from all-time highs, says ARK Invest CEO, Cathie Wood.
Key points:
-
Bitcoin will not see another correction of 85% or more versus its latest all-time high, Cathie Wood argues.
-
A new prediction sees $34,000 becoming the next BTC price bottom.
-
Bitcoin bear-market seasonality hints that a reversal could come this month.
Wood on BTC price: No more 85% “collapses”
In an interview with CNBC’s Squawk Box segment on April 1, Wood stayed calm about double-digit BTC price losses.
“Believe it or not, in the Bitcoin community, down 50% — if that’s as far as it goes — they’ll consider that a real victory,” she said.
“Because you’re right; the 85-95% collapses associated with a very new technology — that’s done. This is a proven technology, it’s a proven monetary system and it’s a new asset class.”
Wood, a longtime Bitcoin bull, was speaking as Bitcoin circled its old $69,000 all-time highs from 2021.
Those preceded a year-long bear market in which BTC/USD lost nearly 80% before bottoming at $15,600. That marked the latest such correction, with bear markets typically bringing losses around the 80% mark.
Data from onchain analytics platform Glassnode shows that the current bear market has yet to match historical patterns with maximum downside versus Bitcoin’s $126,200 record from October 2025 at 52%.

Responding to Wood, analyst Tony Severino predicted that 2026 would bring a price bottom equal to a 72% drawdown.
“Correct, -72% max drawdown next =$34,000,” he wrote on X.
That figure exceeds commonly held predictions by traders for where Bitcoin’s next generational floor will be. As Cointelegraph reported, consensus favors the area between $40,000 and $50,000.
This week, however, Bloomberg Intelligence analyst Mike McGlone warned that price may already be trending toward seven-year lows.
Bitcoin historically rebounds in April
Continuing the bear-market comparison, data from network economist Timothy Peterson revealed that April could mark some form of inflection point for price.
Related: Bitcoin risks new lows as US dollar targets highest level since April 2025
A chart uploaded to X this week shows April typically being a recovery month during bearish phases.

The March monthly close, meanwhile, ended a five-month losing streak for BTC/USD with modest gains of 1.8%.
This article is produced in accordance with Cointelegraph’s Editorial Policy and is intended for informational purposes only. It does not constitute investment advice or recommendations. All investments and trades carry risk; readers are encouraged to conduct independent research before making any decisions. Cointelegraph makes no guarantees regarding the accuracy or completeness of the information presented, including forward-looking statements, and will not be liable for any loss or damage arising from reliance on this content.
Crypto World
AccuQuant launches automated trading of Ethereum contracts, enabling users to earn $7k a day through swing trading


Disclosure: This article does not represent investment advice. The content and materials featured on this page are for educational purposes only.
Ethereum drops below key support as traders turn to automated systems like AccuQuant for intraday strategies.
Summary
- Ethereum drops below key support as bearish momentum builds, while traders watch resistance near 2200 for reversal signals
- AccuQuant launches automated Ethereum trading system targeting intraday gains amid heightened market volatility
- Automated crypto strategies gain traction as traders seek emotion-free execution and consistent small-profit accumulation
Ethereum experienced a sharp drop yesterday, with the price breaking below support near the daily moving average. The MACD bearish momentum intensified again, and other technical indicators remained relatively flat.
If the price rebound fails to break through the previous high near 2200, a further pullback could potentially trigger a fifth wave retracement. In such volatile markets, relying solely on manual judgment is often susceptible to emotional biases and makes it difficult to capture market rhythms in a timely manner. To address this pain point, AccuQuant launched a fully automated Ethereum contract trading system, enabling users to earn $7,000 per day through intraday trading.
What is AI automated trading?
AI cryptocurrency automated trading uses algorithms and data models to replace manual market analysis. It continuously monitors the cryptocurrency market 24 hours a day, accurately identifies trading opportunities, automatically makes long and short trading decisions, and executes buy and sell operations. It is an intelligent trading system that operates around the clock, delivering high efficiency without emotional interference.
How to start AI-powered fully automated trading?
1. Register now and claim a $20 welcome bonus.
2. Choose a suitable strategy and start automated trading.
3. Withdraw profits or continue trading.
- Beginner Experience: Amount: $100 | Period: 2 days | Daily Return: $3 | Return at Maturity: $100 + $6
- Starter: Amount: $500 | Period: 5 days | Daily Return: $7 | Return at Maturity: $500 + $35
- Advanced: Amount: $3,000 | Period: 15 days | Daily Return: $45.3 | Return at Maturity: $3,000 + $679.5
- Premium: Amount: $5,000 | Period: 20 days | Daily Return: $78.50 | Return at Maturity: $5,000 + $1,570
- Pro: Amount: $10,000 | Period: 25 days | Daily Return: $162 | Return at Maturity: $10,000 + $4,050
- Expert: Amount: $30,000 | Period: 30 days | Daily Return: $516 Maturity Payout: $30,000 + $15,480
- Elite: Amount: $100,000 | Lifetime: 42 days | Daily Payout: $2,000 Maturity Payout: $100,000 + $84,000
(Click here to see more automated trading strategies)
Case study: How to achieve a daily profit of $7,000
An AccuQuant user, after enabling an automated Bitcoin trading strategy, saw the system complete multiple trades throughout the day.
Given the day’s highly volatile market, the strategy achieved a cumulative profit of approximately $7,000 by consistently capturing small fluctuations.
The key was not in a single large profit, but rather in:
- High-frequency, small-amount profit accumulation
- Strict adherence to strategy discipline
- Avoid emotional trading
- Continuously participate in market fluctuations
- Sign Up and Receive Rewards, Easily Start Trading
New users receive a $20 reward upon registration and can earn an additional $0.50 daily upon login. Experience automated trading with zero barriers to entry.
- No Need to Monitor the Market, the System Works for You 24/7
Say goodbye to staying up all night watching market data. The AI system runs automatically 24/7, avoiding emotional interference and giving you back your time.
- Simple and Easy to Use, Even Beginners Can Quickly Get Started
The interface is intuitive and clear, requiring no complicated operations. Whether someone is a beginner or a professional trader, they can easily use it.
- Earn Money Through Referrals, Multiple Ways to Reward
Join the affiliate program and earn up to 3% + 1.5% referral rewards, diversifying income streams.
- Transparent Fees, No Hidden Costs
No extra transaction fees or management fees. All fees are clearly visible, making every profit safer.
- Multi-currency support, flexible and convenient deposits and withdrawals
Supports deposits and withdrawals of various mainstream cryptocurrencies, including:
BTC, ETH, DOGE, SOL, XRP, USDC, LTC, and USDT (TRC20/ERC20), meeting the needs of different users.
In the volatile cryptocurrency market, where volatility equals opportunity, the key is not predicting prices but rather how to efficiently participate in the volatility itself.
AccuQuant empowers users to participate more systematically in intraday cryptocurrency market movements through automated and quantitative strategies.
For more information, visit the official website.
Media contact: [email protected]
Disclosure: This content is provided by a third party. Neither crypto.news nor the author of this article endorses any product mentioned on this page. Users should conduct their own research before taking any action related to the company.
Crypto World
Ethereum Foundation stakes $93 million of ether in a day, reaching its 70,000 ETH target


The Ethereum Foundation staked roughly $93 million in ether (ETH) on Thursday in several batches, bringing its total staked position to approximately $143 million and nearly completing the 70,000 ETH staking target it announced in February, according to Arkham data.
The total deposit of 45,034 ETH was split into uniform chunks of 2,047 ETH, each worth roughly $4.23 million, sent from the foundation’s treasury multisig to the Eth2 Beacon Chain deposit contract.
At roughly $2,059 per ETH, the $143 million total staked position works out to approximately 69,500 ETH, nearly the full 70,000 ETH commitment.
The foundation had been building toward the target incrementally since February, starting with an initial 2,016 ETH deposit and adding roughly 20,470 ETH on Monday. Thursday’s batch covered the remaining balance in one shot.
The foundation’s Arkham-tracked portfolio shows approximately $270.9 million in total assets across 14 addresses, with ETH as the dominant holding at roughly 102,400 ETH ($210.9 million). Smaller positions include USDC, BNB, and a fraction of a bitcoin.
Yield income
Staking is the process of locking up cryptocurrency to help secure a blockchain and earn rewards. It’s analogous to buying bonds and lending money to the government in return for fixed income yields.
At current staking rates, the position would generate roughly $3.9 million to $5.4 million annually at the 2.7% to 3.8% APY range typical for institutional stakers. With MEV-boost, returns could run higher.
That is modest relative to the foundation’s annual operating expenses, which have historically run near $100 million, but it converts a dormant treasury into a productive one without selling ETH.
Why staking?
The Ethereum Foundation is putting its ETH to work through staking, earning rewards that help fund research, grants, and operations — all without needing to sell its coins, creating a long-term, self-sustaining treasury.
This replaces the earlier model where the foundation resorted to ETH sales that weighed over valuations. The foundation faced criticism for the same through 2024 and early 2025.
With staking, the foundation earns yield. The shift, however, does not fully eliminate the need to sell entirely.
At the same time, completing the 70,000 ETH target does not mean staking is done. The foundation still holds over 100,000 unstaked ETH. Whether it expands the program beyond the initial commitment or holds the rest as liquid reserves has not been announced.
Ether traded at $2,059 at the time of the deposits, down roughly 4.3% over the past week.

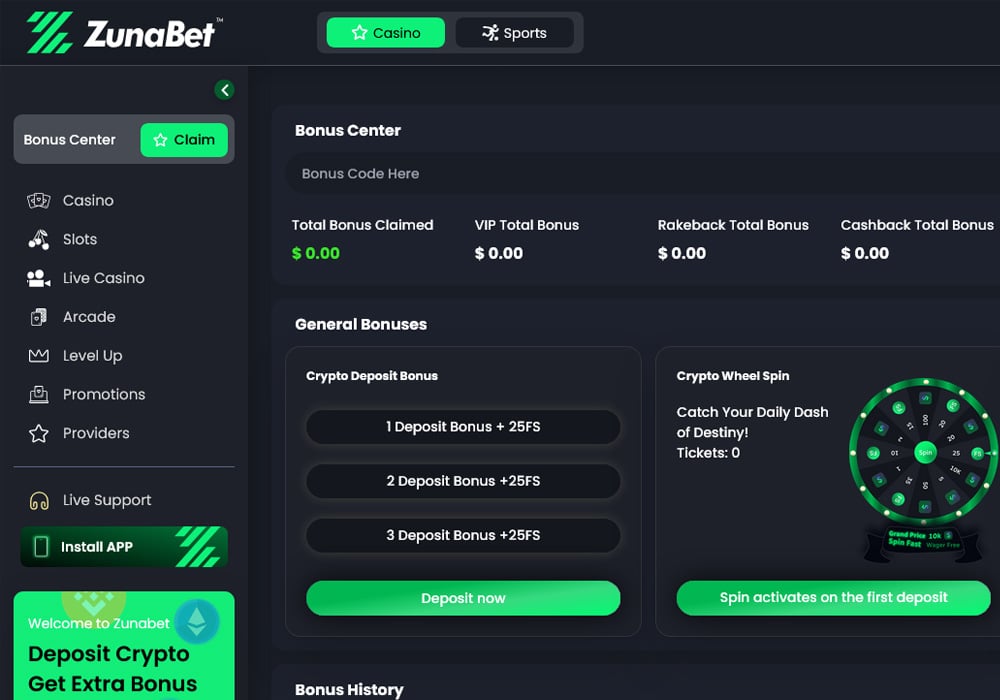
The path from Stake.com to ZunaBet is becoming one of the most well-traveled routes in crypto gambling. It starts with a question that more players are asking in 2026 than at any point before: is there a better option? That question leads to a search. That search leads to comparisons. And those comparisons increasingly lead to the same destination. ZunaBet launched in 2026 and has quickly established itself as the platform that crypto gamblers discover when they decide to look beyond what they already know. Stake.com continues to operate at scale — its brand and traffic remain significant. But a growing number of its users are no longer content with what the platform provides, and ZunaBet has built exactly what those users are looking for. Here is why the path keeps leading to the same place.
Stake.com: The Platform That Opened the Door
Stake.com deserves its place in the history of crypto gambling. Launching in 2017 under a Curaçao license, it was among the first platforms to demonstrate that a full-scale gambling operation could function entirely on cryptocurrency. Bitcoin, Ethereum, Litecoin, Dogecoin, and other major coins were accepted from the beginning, which gave crypto holders something the rest of the gambling industry was not yet willing to offer — a native place to play.
Original games gave Stake a soul. Crash, Plinko, Mines, and Dice became iconic within the crypto gambling community, building a player base that was loyal not just to the platform but to the specific experience those games created. Provably fair mechanics and clean design made them endlessly replayable. Third-party content from providers including Pragmatic Play, Evolution, and Hacksaw Gaming eventually expanded the casino with slots and live dealer options.
A sportsbook covering football, basketball, tennis, MMA, esports, and additional markets rounded out the product with competitive odds and an interface that kept things simple for experienced bettors.
Stake opened a door that the entire crypto gambling industry walked through. The complication is that some of the platforms that followed walked through it with better offerings.
What Sends Players Looking
The search for alternatives always starts with something specific. In Stake’s case, three recurring frustrations have created enough collective momentum to turn individual dissatisfaction into a visible market trend.
The absence of a welcome bonus is the trigger that initiates most searches. Stake has never offered deposit matching, free spins, or sign-up promotions of any kind. In the platform’s earlier years, this was a minor inconvenience because few crypto casinos were doing things differently. In 2026, with competitors extending welcome packages worth thousands of dollars, the inconvenience has matured into a genuine competitive weakness. Every player who learns about a multi-thousand dollar bonus on another platform while holding a bonusless Stake account faces a question that gets harder to ignore each time it comes up.

The concealed VIP program transforms mild frustration into active disengagement. Stake rewards its most valuable players through an invitation-only system that includes rakeback, recurring bonuses, and dedicated account management. For that small group, the program works well. For everyone else — which is the overwhelming majority — the program does not visibly exist. No tiers are published. No requirements are disclosed. No progress is shown. Playing regularly on Stake while receiving no structured recognition for that regularity creates a slow-building sense that the platform does not value your presence unless you are already in the top tier of spenders.
Game catalog size has become an increasingly common point of comparison. Platforms entering the market in 2025 and 2026 have arrived with game libraries that are dramatically larger than what Stake maintains. Players who enjoy exploring new games, testing different providers, and accessing a wide range of styles find themselves constrained on Stake in ways they no longer need to tolerate.
What Players Find When They Arrive at ZunaBet
ZunaBet went live in 2026 under Strathvale Group Ltd with an Anjouan gaming license. The founding team has more than 20 years of combined experience in online gambling. The platform was not bolted onto existing fiat infrastructure — it was designed natively around cryptocurrency, making digital assets the default for every function.
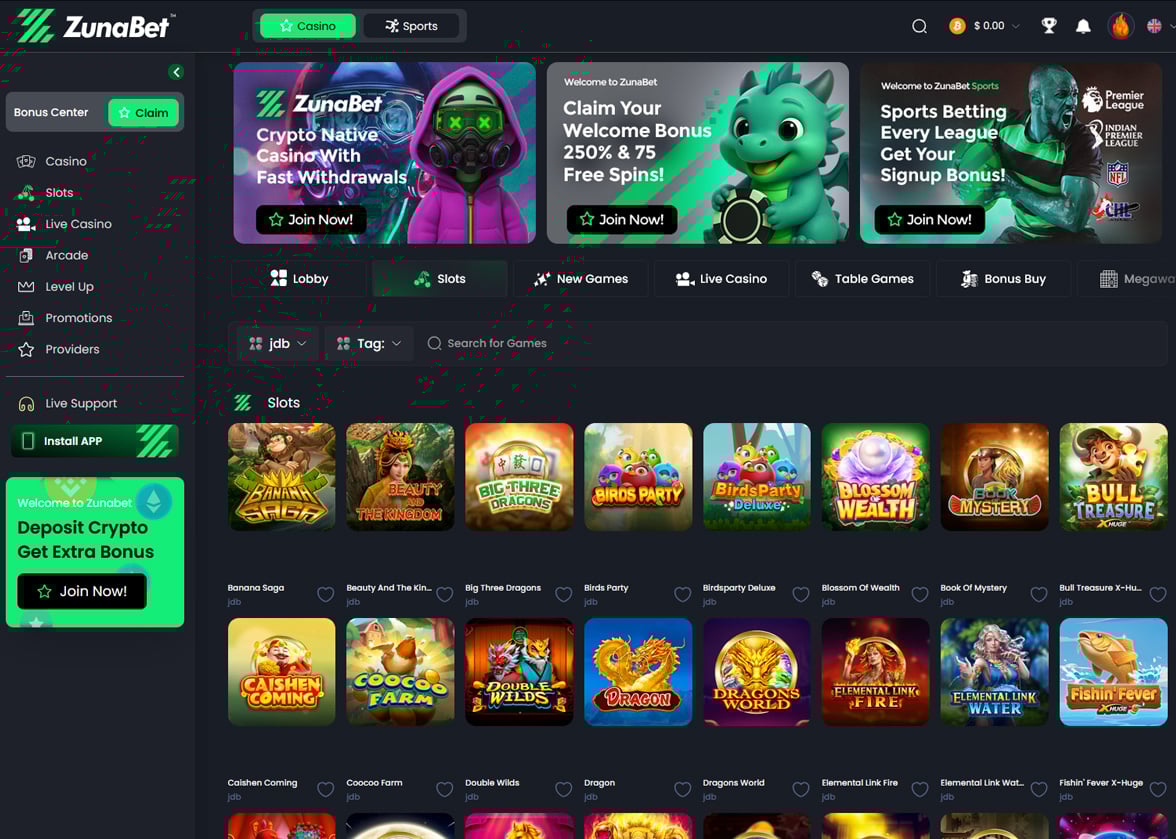
The game library hits first. Over 11,000 titles from 63 content providers fill the platform. Pragmatic Play, Hacksaw Gaming, Yggdrasil, BGaming, and Evolution sit among 60+ studios that contribute slots, RNG table games, and live dealer content. The catalog is not inflated with filler — the range of mechanics, visual styles, volatility profiles, and themes provides genuine variety that sustains interest over months of regular play.
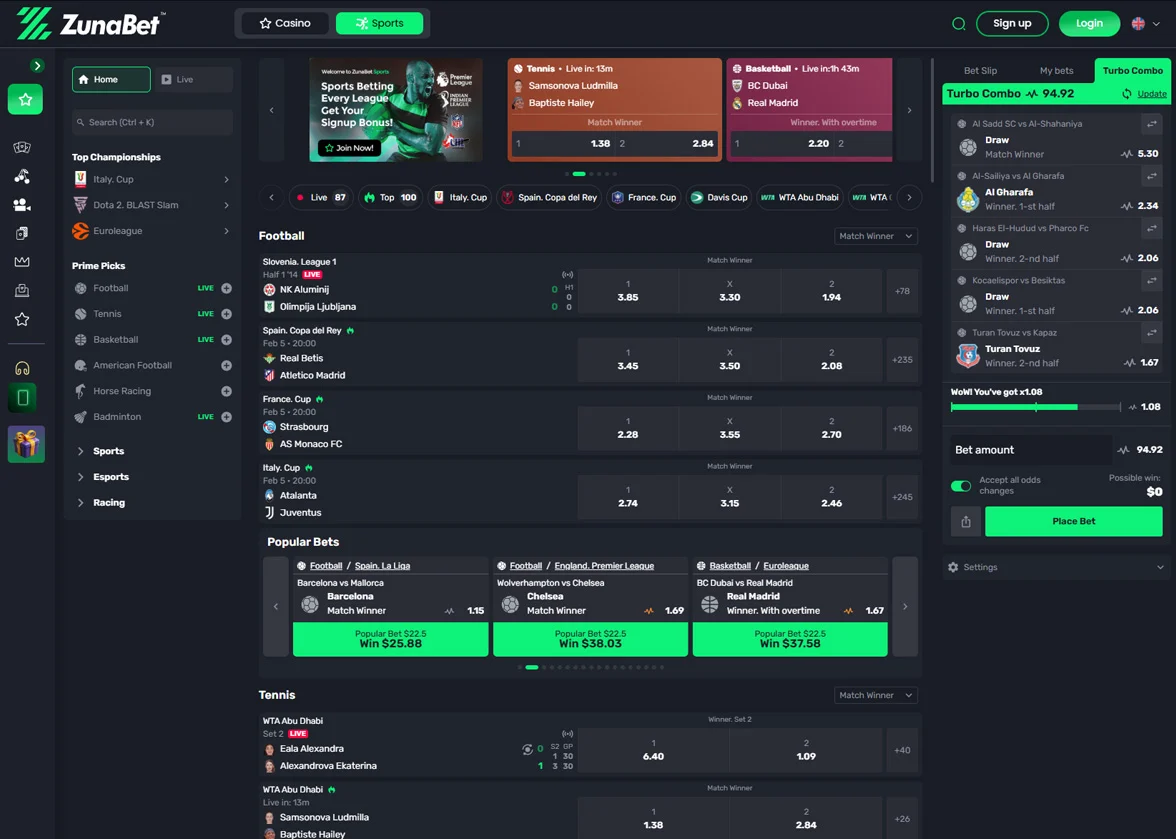
Sports betting is a built-in feature rather than an add-on. The sportsbook handles football, basketball, tennis, NHL, combat sports, virtual sports, and esports markets covering CS2, Dota 2, League of Legends, and Valorant. A single account with a shared balance keeps everything connected, so moving between a slot session and a live match bet takes seconds.
More than 20 cryptocurrencies are accepted: BTC, ETH, USDT on multiple blockchain networks, SOL, DOGE, ADA, XRP, and others. No processing fees are charged. Withdrawals are engineered to settle quickly. Native apps for iOS, Android, Windows, and MacOS provide consistent access, and live chat operates around the clock.
The First Thing That Changes Their Mind
The welcome bonus is typically the moment a browsing Stake player becomes a depositing ZunaBet player.
On Stake, there is no bonus. Your deposit equals your balance and nothing is added. Every session from your first bet onward is funded entirely by your own money.
On ZunaBet, new players receive up to $5,000 in matched deposits plus 75 free spins across three transactions. First deposit: 100% match up to $2,000 with 25 free spins. Second: 50% match up to $1,500 with 25 spins. Third: 100% match up to $1,500 with 25 spins. The three-deposit format means the welcome period extends across multiple sessions, building engagement gradually rather than exhausting the bonus in one shot.
For someone who has never received a bonus on any platform, the impact goes beyond the financial. Seeing a deposit doubled communicates something about how the platform views the player relationship. It says your business is worth competing for. That message alone is enough to shift a player’s mindset from casually browsing to genuinely considering a permanent switch.
The Thing That Makes Them Stay
Welcome bonuses attract attention. Loyalty programs earn commitment. The gap between how Stake and ZunaBet handle ongoing rewards is what turns a ZunaBet trial into a ZunaBet home.
Stake keeps its loyalty system behind a barrier that most players will never cross. The VIP program is by invitation only, governed by criteria nobody can see. Those inside it benefit from rakeback, regular bonuses, and personal account management. Those outside it — the vast majority of the player base — receive nothing beyond the standard gambling experience. No tiers to track. No milestones to chase. No feedback that their play is generating any return beyond what the games themselves provide.
ZunaBet shows you everything before you place your first bet. The dragon evolution loyalty program has six tiers published in full: Squire at 1% rakeback, Warden at 2%, Champion at 4%, Divine at 5%, Knight at 10%, and Ultimate at 20%. Free spins increase with each tier up to 1,000. VIP club access and double wheel spins add additional layers. A dragon mascot called Zuno gives the progression personality and makes climbing tiers feel like part of the fun rather than background accounting.
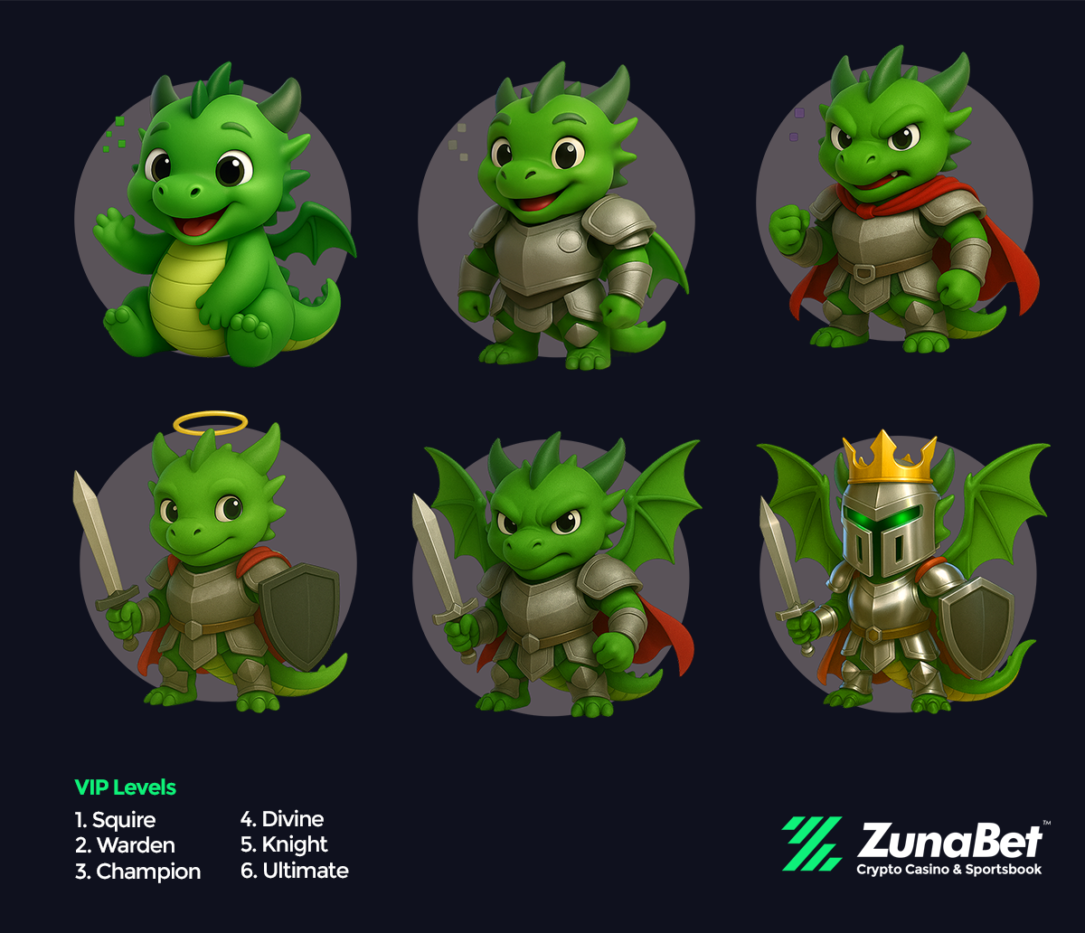
Nothing is hidden. Nothing is invitation-only. Every player sees the complete structure from day one and can track exactly where they stand within it. At 20% rakeback, the Ultimate tier returns a substantial portion of the house edge on every wager, creating ongoing value that compounds across every session. For a player who spent their Stake tenure with zero structured loyalty recognition, discovering a system that rewards them openly and progressively is usually the deciding factor in making ZunaBet their permanent platform.
Where Both Platforms Sit in the Wider Market
Stake and ZunaBet occupy the crypto-native tier of online gambling, which separates them fundamentally from traditional operators like DraftKings, BetMGM, FanDuel, and Caesars. Fiat platforms carry the overhead of bank processing, card network fees, and withdrawal timelines that can stretch across multiple business days. For players who hold and transact in crypto, those platforms represent a step backward.
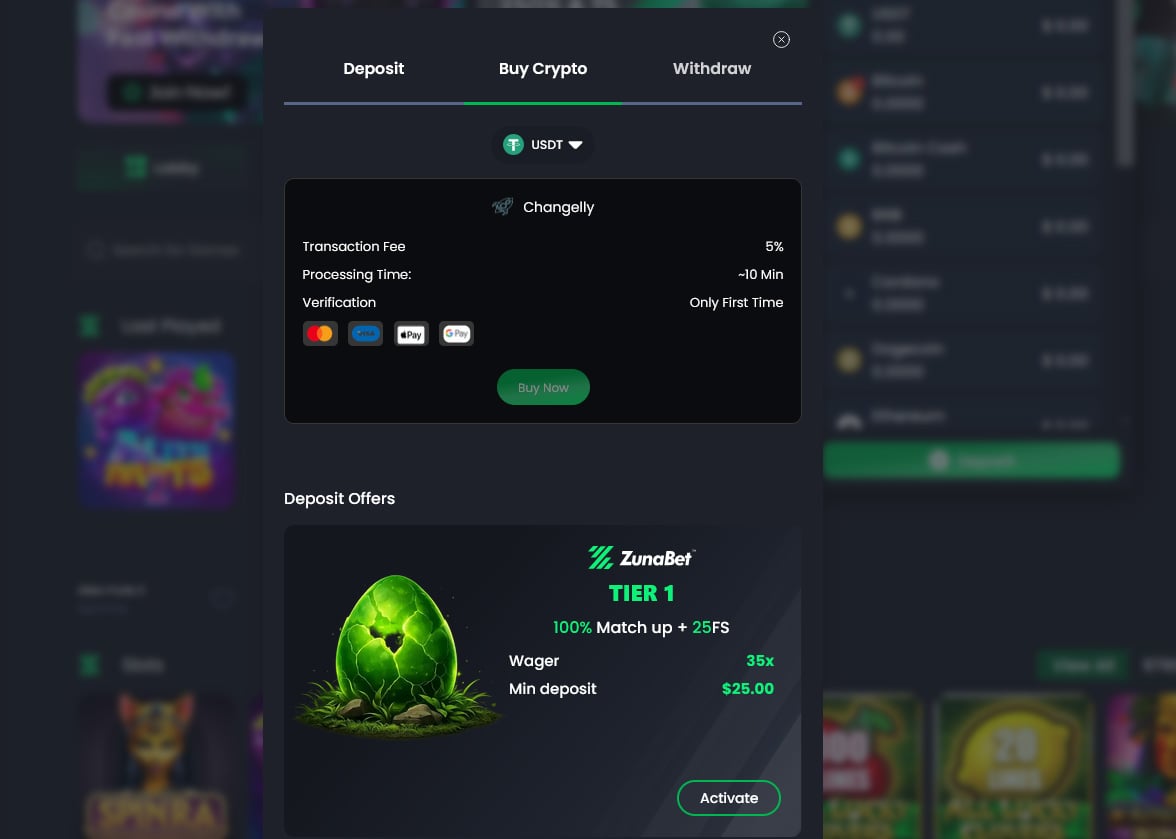
Within the crypto tier, ZunaBet extends further. Over 20 supported coins, including USDT across several blockchain networks, reflect how crypto users actually manage their holdings in 2026. Zero platform fees on every transaction and fast withdrawal processing keep the financial experience frictionless. Stake supports fewer coins and offers a narrower payment framework, which increasingly matters to players whose crypto activity spans multiple tokens and chains.
Why the Path Keeps Leading Here
The reason ZunaBet keeps appearing at the end of Stake alternative searches is straightforward — it was built to be found there. Every feature addresses a documented frustration. The $5,000 welcome bonus fills the void Stake leaves empty. The 11,000+ game library from 63 providers replaces a catalog players have outgrown. The transparent six-tier loyalty program with up to 20% rakeback replaces an invisible system that most players never benefit from. The 20+ supported cryptocurrencies with zero fees outpace Stake’s payment infrastructure.
Stake created the foundation for crypto gambling and earned every bit of its reputation. But foundations are meant to be built upon, and ZunaBet represents the next floor. More games, more value at sign-up, more transparency in rewards, and more flexibility in payments — delivered by a platform that treats earning player loyalty as an ongoing responsibility rather than a settled achievement.
The players finding ZunaBet through alternative searches are not leaving crypto gambling. They are upgrading it. And in 2026, ZunaBet is where that upgrade lives.
Disclaimer: This is a Press Release provided by a third party who is responsible for the content. Please conduct your own research before taking any action based on the content.


Disclosure: This article does not represent investment advice. The content and materials featured on this page are for educational purposes only.
Web3 careers evolve as professionals adopt new framework to evaluate mature, capital-driven organizations.
Summary
- Web3 matures into regulated global finance, shifting careers from hype to fundamentals and structured growth
- In 2026, crypto firms favor diversified revenue models over token-driven growth and short-term momentum
- Security leads, with firms like WhiteBIT setting standards through audits and top-tier certification
By 2026, web3 will have become the backbone of global finance. The industry has matured into a regulated, capital-heavy, and globally competitive landscape. While many professionals still evaluate web3 employers based on 2020-style hype, this outdated logic no longer works.
To help professionals navigate their next career move, we have outlined the five pillars of a mature web3 organization.
1. Look beyond growth headlines, focus on business structure
Rapid expansion isn’t always a sign of strength. In 2026, a resilient company demonstrates diversified revenue foundations and scalability that withstands market cycles.
- Green Flag: The company has multiple revenue streams (B2B, B2C, RWA integrations).
- Red Flag: Growth depends solely on a single-token model or favorable market conditions.
Candidate Tip: It is worth asking, “How does the company generate value beyond its native token or core trading fees?”
2. Prioritize regulatory and security infrastructure
Compliance and cybersecurity are no longer “optional” — they are the company’s DNA. Today’s leaders operate under evolving frameworks and strict global security standards.
- The Industry Standard: Leading organizations do not just “claim” security; they prove it. WhiteBIT, for instance, was the first crypto exchange to achieve the highest level of CCSS (Cryptocurrency Security Standard) certification, reinforced by regular independent audits.
Interview Question: “What independent security certifications or regulatory licenses does the company currently hold in Tier-1 jurisdictions?”
3. Seek ecosystem thinking, not single-product focus
Standalone products are fragile. Mature companies build ecosystems — interconnected services that reinforce each other.
- Ecosystem Synergy: Evaluation should focus on the integration between a blockchain (e.g., Whitechain), crypto-acquiring (Whitepay), and the core exchange services.
- Global Reach: Serious players form strategic partnerships beyond crypto, proving global credibility and financial stability.
Interview Question: “How does this role interact with other products in the company’s ecosystem, and what are the strategic priorities for cross-product integration this year?”
4. Analyze governance and decision-making discipline
Speed without structure leads to volatility. In a mature web3 industry, disciplined decision-making isn’t bureaucracy; it’s performance-enhancing infrastructure.
The “red flag vs. green flag” checklist:
- Green Flag: Clear ownership, coordinated execution across distributed teams, and transparent leadership communication.
- Red Flag: Using the “move fast and break things” mantra as an excuse for lack of planning and constant team burnout.
Candidate Tip: A professional should ask, “How are strategic pivots communicated to the team, and how is accountability defined in cross-functional projects?”
5. Focus on talent investment, not just role scope
Web3 can offer broad responsibility, but that doesn’t always equal growth. The key in 2026 is whether the company treats talent as long-term capital.
- Development: Are there defined career pathways?
- The Maturity Indicator: Companies like WhiteBIT build internal pipelines and nurture future leaders who can navigate the intersection of finance, law, and AI.
Interview Question: “Can you provide an example of someone who has transitioned between different ecosystem products or moved into a leadership role internally? What did their development path look like?”
Final decision-making checklist
Before signing an offer, professionals should check these four boxes:
- Ecosystem: Is the product part of a larger, stable infrastructure?
- Security: Is there a CCSS Level 3 or equivalent independent validation?
- Sustainability: Does the revenue model work in a “bear” market?
- Growth: Does the company invest in cross-functional skills?
- Compliance: Does the company adhere to legal and regulatory requirements?
Closing perspective
The question in 2026 is no longer “Who is moving fastest?” but rather “Who is built for the long term?” Companies like WhiteBIT have spent years building a global presence focused on security, operational discipline, and ecosystem-driven growth. In a mature market, these factors are the only reliable indicators of a sustainable and rewarding career path.
Explore current career opportunities at WhiteBIT here.
Disclosure: This content is provided by a third party. Neither crypto.news nor the author of this article endorses any product mentioned on this page. Users should conduct their own research before taking any action related to the company.
By Francisco Rodrigues (All times ET unless indicated otherwise)
Bitcoin is stuck in a tight range near $66,600 ahead of the Good Friday holiday, as geopolitical tensions and shifting macro expectations keep prices contained.
While the cryptocurrency saw a slight rise in the last 24 hour period it failed to break above $67,000. It’s struggling as U.S. President Donald Trump signaled a harsher stance on Iran, now threatening the country’s infrastructure.
Brent crude hit $120 per barrel on spot markets, levels not seen since 2008, over the ongoing crisis and its effects on the Strait of Hormuz, a key artery for global oil shipping that has effectively been shut down.
That surge in energy prices pushed up inflation expectations and undercut the case for rate cuts, a key support for bitcoin’s recent rally. Inflation in Europe has already risen to 2.5%, driven by energy costs.
The pressure has revealed a divide in market structure. Institutional inflows into bitcoin ETFs remain consistent, with $22 million in net inflows this week. But data from CryptoQuant show total apparent demand has flipped negative, with large holders distributing more than they accumulate.
Wallets holding 1,000 to 10,000 BTC have shed nearly 188,000 BTC since last year’s peak, the data shows. Nearly half of all bitcoin in circulation is, at current prices, trading at a loss.
Heading into the long weekend, liquidity is set to remain thin. That leaves bitcoin exposed to potentially higher volatility based on developments in the Middle East or macro-linked statements. Stay alert!
Read more: For analysis of today’s activity in altcoins and derivatives, see Crypto Markets Today
What to Watch
For a more comprehensive list of events this week, see CoinDesk’s “Crypto Week Ahead“.
- Crypto
- Macro
- April 3, 8:30 a.m.: U.S. Nonfarm Payrolls for March est. 48K (Prev. -92K)
- April 3, 8:30 a.m.: U.S. Unemployment Rate for March est. 4.5% (Prev. 4.4%)
- April 3, 10:00 a.m.: U.S. ISM Services PMI for March (Prev. 56.1)
- Earnings (Estimates based on FactSet data)
Token Events
For a more comprehensive list of events this week, see CoinDesk’s “Crypto Week Ahead“.
- Governance votes & calls
- SSV Network DAO is voting across two proposals to integrate ENS names for core protocol contracts to enhance security against phishing, and to establish a soft fee floor for public operators to ensure economic sustainability. Voting ends April 3.
- Unlocks
- Token Launches
Conferences
For a more comprehensive list of events this week, see CoinDesk’s “Crypto Week Ahead“.
Market Movements
- BTC is down 0.35% from 4 p.m. ET Thursday at $66,785.73 (24hrs: +0.65%)
- ETH is unchanged at $2,058.20 (24hrs: +0.94%)
- CoinDesk 20 is up 0.26% at 1,902.32 (24hrs: +0.80%)
- Ether CESR Composite Staking Rate is up 1 bps at 2.77%
- BTC funding rate is at -0.0007% (-0.7731% annualized) on Binance

- DXY is unchanged at 99.99
- Gold futures are up 1.07% at $4,701.30
- Silver futures are up 0.60% at $73.17
- Nikkei 225 closed up 1.26% at 53,123.49
- Hang Seng closed down 0.70% at 25,116.53
- FTSE 100 is unchanged at 10,436.29
- Euro Stoxx 50 is down 0.26% at 5,678.00
- DJIA closed on Thursday down 0.13% at 46,504.67
- S&P 500 closed up 0.11% at 6,582.69
- Nasdaq Composite closed up 0.18% at 21,879.18
- S&P/TSX Composite closed up 0.46% at 33,108.20
- U.S. 10-Year Treasury rate is down 1 bps at 4.31%
- E-mini S&P 500 futures are up 0.12% at 6,613.00
- E-mini Nasdaq-100 futures are up 0.10% at 24,167.25
- E-mini Dow Jones Industrial Average futures are up 0.10% at 46,678.00
Bitcoin Stats
- BTC Dominance: 58.54% (-0.24%)
- Ether to bitcoin ratio: 0.030821 (0.23%)
- Hashrate (seven-day moving average): 997 EH/s
- Hashprice (spot): $30.68
- Total Fees: 2.54 BTC / $170,134
- CME Futures Open Interest: 106,230 BTC
- BTC priced in gold: 15.9 oz
- BTC vs gold market cap: 4.46%
Technical Analysis

- The chart shows daily swings in tether’s dominance rate in candlestick format. The dominance rate represents the share of stablecoin tether in the total crypto market.
- The dominance rate is rising again after a temporary pullback, or counter-trend correction. This breakout suggests that the broader uptrend in dominance has likely resumed.
- This has bearish implications for the broader market, as dollar-pegged assets like Tether typically gain dominance during market-wide sell-offs.
Crypto Equities
- Coinbase Global (COIN): closed on Thursday at $171.46 (–0.88%), unchanged in after-hours
- Galaxy Digital (GLXY): closed at $17.64 (+1.55%), +0.28% at $17.69
- MARA Holdings (MARA): closed at $8.71 (+8.33%), –1.03% at $8.62
- Riot Platforms (RIOT): closed at $12.86 (+2.47%), unchanged at $12.86
- Core Scientific (CORZ): closed at $16.23 (+6.08%), –0.62% at $16.13
- CleanSpark (CLSK): closed at $8.79 (+1.97%), unchanged at $8.80
- Exodus Movement (EXOD): closed at $6.10 (–8.68%), –0.80% at $6.05
- CoinShares Bitcoin Miners ETF (WGMI): closed at $35.76 (+2.58%), –0.17% at $35.70
- Circle Internet Group (CRCL): closed at $90.26 (–0.53%), +0.60% at $90.80
- Bullish (BLSH): closed at $36.37 (+3.71%), –0.19% at $36.30
Crypto Treasury Companies
- Strategy (MSTR): closed at $119.83 (–2.40%), +0.34% at $120.24
- Strive Asset Management (ASST): closed at $9.75 (–4.04%), +0.10% at $9.76
- SharpLink Gaming (SBET): closed at $6.19 (–4.18%), +0.32% at $6.21
- Upexi (UPXI): closed at $0.98 (–1.32%), –2.12% at $0.95
- Lite Strategy (LITS): closed at $1.12 (–0.88%), unchanged at $1.12
ETF Flows
Spot BTC ETFs
- Daily net flow: $9 million
- Cumulative net flows: $55.93 billion
- Total BTC holdings ~ 1.28 million
Spot ETH ETFs
- Daily net flow: -$71.2 million
- Cumulative net flows: $11.51 billion
- Total ETH holdings ~ 5.69 million
Source: Farside Investors
While You Were Sleeping
French ship crosses Strait of Hormuz in first Western European transit during Iran war (euronews): The news could encourage other carriers to resume operations if the corridor proves reliable in the coming days and it follows Iran’s deputy foreign minister Kazem Gharibabadi announcement of a deal with Oman to secure traffic through the Strait of Hormuz.
U.S. repatriates Chinese drug fugitive in a sign of stabilizing ties (The Wall Street Journal): This is the first case of its kind in recent years and is described as a rare move that points to cooperation ahead of the planned Trump-Xi summit next month.
Iran strikes Gulf energy sites as Trump warns of further attacks (Bloomberg): Iran targeted more sites in Arab Gulf states, including in Kuwait Friday morning, hours after Trump issued fresh threats against Iranian infrastructure to pressure Tehran to start peace negotiations.
Japan turns up FX heat as volatility rises, signals readiness to act (Reuters): The yen, trading near the psychologically key 160-per-dollar mark, lingered at levels that stoke concerns of market intervention, highlighting growing unease over the speed and scale of its decline.

Key Highlights
- Google unveiled two additional Gemini API service tiers: Flex and Priority
- Flex provides 50% cost reduction for non-urgent, background processing tasks
- Priority commands 75–100% premium pricing for mission-critical, real-time operations
- Batch API maintains 50% discount with latency extending to 24 hours
- Caching tier uses token volume and retention time for pricing calculations
On April 2, Google rolled out a comprehensive pricing update for its Gemini API, introducing five separate service tiers: Standard, Flex, Priority, Batch, and Caching. This expansion provides developers with greater flexibility to optimize their applications based on cost efficiency, response time, and performance reliability.
The newly introduced Flex tier targets non-time-sensitive background operations that can tolerate delayed responses. By leveraging underutilized computing resources during off-peak periods, it delivers a 50% price reduction compared to standard rates. Response latency varies between 1 and 15 minutes without guaranteed delivery times. Ideal applications include CRM data synchronization, computational research models, and automated agent workflows.
What distinguishes Flex from the pre-existing Batch API is its synchronous endpoint architecture. Developers avoid the complexity of managing file-based inputs/outputs or monitoring job completion status. This streamlined approach maintains identical cost benefits while simplifying implementation.
Conversely, the Priority tier addresses high-stakes, time-critical applications. With pricing 75% to 100% above standard rates, it guarantees rapid response times measured in milliseconds to seconds.
Google positions Priority for use cases like live customer service chatbots, real-time fraud prevention systems, and automated content filtering. When Priority tier usage exceeds allocated quotas, surplus requests gracefully shift to Standard tier processing instead of generating errors.
Complete Tier Structure
The original Batch API continues operating with 50% cost savings and accepts latency windows extending to 24 hours. This option suits intensive offline computations where immediate results aren’t necessary.
The Caching tier employs pricing models based on token quantities and content storage duration. Google recommends this tier for conversational AI with extensive system prompts, recurring analysis of large video datasets, or searches across substantial document collections.
Both Flex and Priority tiers utilize identical service_tier parameters within API calls. Developers can switch between tiers through simple configuration adjustments, with API responses confirming the tier that processed each request.
Flex accessibility extends to all paid tier subscribers using GenerateContent and Interactions API endpoints. Priority remains restricted to Tier 2 and Tier 3 paid accounts accessing identical endpoints.
Developer Benefits
The standardized interface represents the most significant advancement. Previously, managing both background operations and interactive workloads necessitated separate architectural frameworks for synchronous and asynchronous processing. The current update consolidates both through unified synchronous endpoints.
Google positioned this enhancement as integral to supporting AI agent development, which frequently requires simultaneous handling of low-priority background tasks and time-sensitive interactive functions.
Gemini API product manager Lucia Loher and engineering lead Hussein Hassan Harrirou announced the update on April 2, 2026.
Crypto World
Google unveils Gemma 4 as its most advanced open AI model for reasoning and agentic tasks


Google has introduced Gemma 4, its latest open artificial intelligence model family focused on advanced reasoning and agent-style workflows.
Summary
- Google launches Gemma 4, its latest open AI model family focused on advanced reasoning and agent-style workflows.
- The model is available in four sizes, ranging from edge-device variants to high-performance systems, and supports over 140 languages.
- Gemma 4 introduces features such as multi-step reasoning, agent tools, and offline code generation, with models accessible via AI Studio and Edge Gallery.
In an April 2 post on X, Demis Hassabis, chief executive of Google DeepMind, announced the launch of Gemma 4, its latest open artificial intelligence model family focused on advanced reasoning and agentic workflows.
Open models are designed to be modified and adapted by developers, allowing them to tailor systems for specific use cases.
The release comes amid strong uptake of the Gemma ecosystem. Since the first version launched, developers have recorded over 400 million downloads and created more than 100,000 variants, according to Google.
Hassabis said Gemma 4 is available in four sizes, each suited to different workloads and hardware setups, and can be fine-tuned for specialised tasks.
The largest version, 31B, is a dense model built for “great raw performance,” prioritising accuracy and depth of output, though it requires high-end computing resources.
Alongside it is the 26B Mixture of Experts (MoE) model, which is designed for lower latency. It activates fewer parameters during inference, allowing faster responses and improved efficiency, albeit with some trade-offs in output quality.
For lighter use cases, Google has introduced the 2B and 4B models. These are optimised for edge devices such as smartphones and compact systems, enabling on-device execution with lower computational demands.
What can you do with Google Gemma 4?
Gemma 4 introduces improved reasoning capabilities, allowing it to handle tasks that require multi-step logic and structured problem-solving. It has also shown stronger performance in benchmarks tied to mathematics and instruction-following.
The models support agent-style workflows through native function calling, structured JSON outputs, and system-level instructions. These features allow developers to build autonomous systems that can interact with APIs, tools, and external services. Gemma 4 also enables high-quality offline code generation, turning local machines into AI coding assistants.
Another key feature is its expanded context window. The edge models support up to 128K tokens, while the larger variants extend this to 256K tokens, allowing the processing of long documents or codebases in a single prompt. The models are trained across more than 140 languages, which allows for global deployment.
Sundar Pichai reposted the announcement, saying Gemma 4 is “packing an incredible amount of intelligence per parameter.”
The models are built to run across a vast range of hardware, from smartphones and laptops to GPUs and developer workstations, with smaller variants capable of running locally without constant internet access.
Developers can start testing Gemma 4 across multiple platforms, with the 31B and 26B MoE models available on Google AI Studio for higher-performance use cases, while the smaller E2B and E4B variants are accessible through Google AI Edge Gallery for on-device and lightweight applications.
Disclosure: This article does not represent investment advice. The content and materials featured on this page are for educational purposes only.

LIVE : New Financial Year 2026, Major Changes From April 1st | V6 News

Vance to focus fraud efforts on Democratic states, Trump says

Bitcoin weathered 85% drawdown, eyes $34K

Smart energy pays enters the US market, targeting scalable financial infrastructure

Why Israel is blocking foreign journalists from entering

Bitcoin: We’re Entering The Most Dangerous Phase
LIVE : New Financial Year 2026, Major Changes From April 1st | V6 News

Ethereum to $40,000 by 2030: Why ETH Could MASSIVELY Outperform Bitcoin

Cathie Wood & Larry Lepard: “This Is Exactly What Happened Before Bitcoin Did a 10x”
-

 NewsBeat7 days ago
The Story hosts event on Durham’s historic registers
-

 NewsBeat18 hours ago
Steven Gerrard disagrees with Gary Neville over ‘shock’ Chelsea and Arsenal claim | Football
-

 Sports7 days ago
Sweet Sixteen Game Thread: Tide vs Michigan
-
Entertainment4 days ago
Fans slam 'heartbreaking' Barbie Dream Fest convention debacle with 'cardboard cutout' experience
-

 Crypto World2 days ago
Gold Price Prediction: Worst Month in 17 Years fo Save Haven Rock
-

 Business12 hours ago
No Jackpot Winner and $194 Million Prize Rolls Over
-
 Entertainment6 days ago
Lana Del Rey Celebrates Her Husband’s 51st Birthday In New Post
-

 Tech4 days ago
The Pixel 10a doesn’t have a camera bump, and it’s great
-
Crypto World3 days ago
Dems press CFTC, ethics board on prediction-market insider trades
-

 Sports3 days ago
Tallest college basketball player ever, standing at 7-foot-9, entering transfer portal
-

 Tech3 days ago
EE TV is using AI to help you find something to watch
-

 Fashion5 days ago
Amazon Sundays: Soft Spring Layers
-

 Business1 day ago
Login and Checkout Issues Spark Merchant Frustration
-

 Tech4 days ago
Avatar Legends: The Fighting Game comes out in July and it looks pretty slick
-

 Fashion6 days ago
When Evening Dressing Gets Colorful for Spring
-

 Tech3 days ago
How to back up your iPhone & iPad to your Mac before something goes wrong
-

 Tech5 days ago
Elon Musk’s last co-founder reportedly leaves xAI
-

 Tech4 days ago
Apple will hide your email address from apps and websites, but not cops
-

 Crypto World4 days ago
U.S. rule change may open trillions in 401(k) funds to crypto
-

 Politics4 days ago
Should Trump Be Scared Strait?
You must be logged in to post a comment Login