
Crypto World
Will It Shock Gold & Silver?
Few major commodities have displayed the kind of price volatility Palladium has since 2020. After a wild ride, boom and bust included, the price of the metal approaches a key area that will help determine its medium- and long-term outlook.
In the space of just a few years, the metal surged above $3,400 during a supply-driven panic, only to collapse back toward $1,000 as industrial fears, substitution dynamics and the electric vehicle transition narrative took hold.
The amplitude of that move rivals some of the most dramatic commodity cycles of the past two decades.

From Scarcity Panic to Structural Unwind
The 2020-2022 rally was fuelled by a perfect storm: tight supply, heavy reliance on Russian production, strong autocatalyst demand, and limited above-ground inventories.
When geopolitical tensions intensified, the scarcity premium exploded.
But blow-offs rarely stabilise gently.
Once peak fear subsided and EV adoption accelerated, the narrative flipped. Investors began pricing a future where internal combustion
engine demand gradually erodes and platinum substitution gains traction.
As that theme gathered momentum, palladium retraced violently.
By late 2023 and into 2024, the market looked washed out.
Volatility and Reset
The decline toward the $1,000-$1,100 zone coincided with extreme pessimism.
Sentiment shifted from “structural shortage” to “structural obsolescence” in less than 24 months. That kind of narrative swing is typically accompanied by positioning liquidation, and price action reflected it.
Technically, the metal moved back toward long-term support levels that had anchored prior cycles. Momentum indicators reset and volatility compressed. The excess was purged.
2025-2026: Reclaim Phase Underway?
Over the past year, price behaviour has changed meaningfully.
Palladium has reclaimed medium- and long-term moving averages on the weekly and monthly timeframes. Higher lows have begun to form. Momentum has improved without yet reaching euphoric territory.
This rally is not a parabolic breakout, but base construction.
The key zone to watch sits around $1,900-$2,000. A sustained move above that area would mark a structural shift in the longer-term chart and challenge the prevailing “terminal decline” narrative.
Until then, the metal remains in recovery mode, not full revival.
What Drives Palladium?
Unlike Gold, Palladium is not a monetary hedge. It is tied primarily to industrial demand, particularly autocatalysts used in internal combustion and hybrid vehicles.
That means the macro drivers are different:
● Global auto production trends
● China’s manufacturing cycle
● US consumer resilience
● Platinum substitution dynamics
● Russian supply concentration
● The US Dollar trend
If global manufacturing stabilises and hybrid vehicle demand remains robust, Palladium retains its demand base. If the US Dollar softens and industrial sentiment improves, the cyclical tailwind strengthens.
But the structural headwind from electrification remains. This dynamic is precisely what sustains volatility.
Technical Outlook: Compression Before Expansion?
From a chart perspective, Palladium no longer looks like a market in freefall. Instead, it appears to be shifting from liquidation mode into something more constructive.
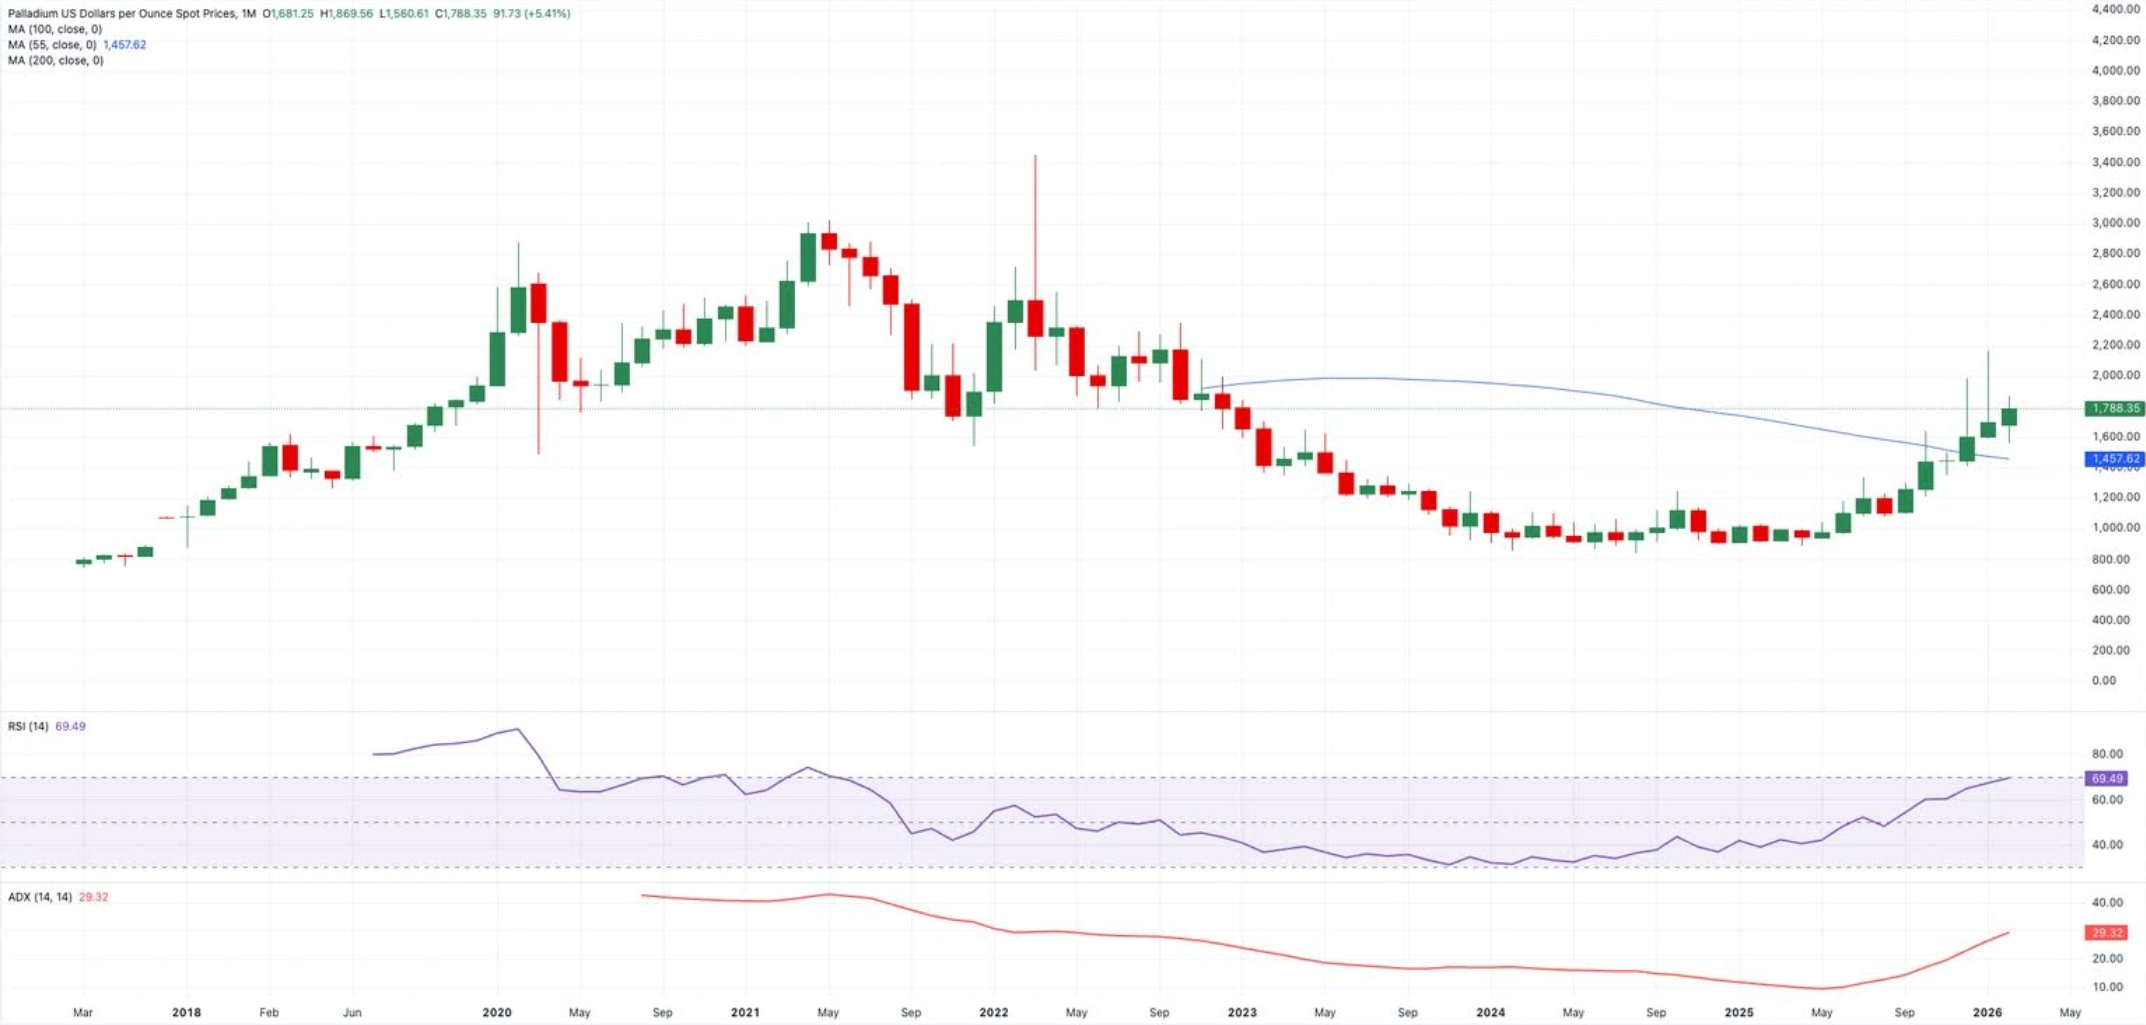
On the monthly chart, price has managed to climb back above its 55-month moving average and is now pressing up against the 100-month average in the $1,600-$1,700 area.
That may sound technical, but in simple terms it means the metal is rebuilding above levels that had previously defined the long slide.
Momentum has also turned. The Relative Strength Index (RSI), which collapsed during the 2023 washout, has recovered steadily and is now moving back toward bullish territory.
Taken together, the longer-term picture looks less like structural decay and more like a market trying to form a durable base.
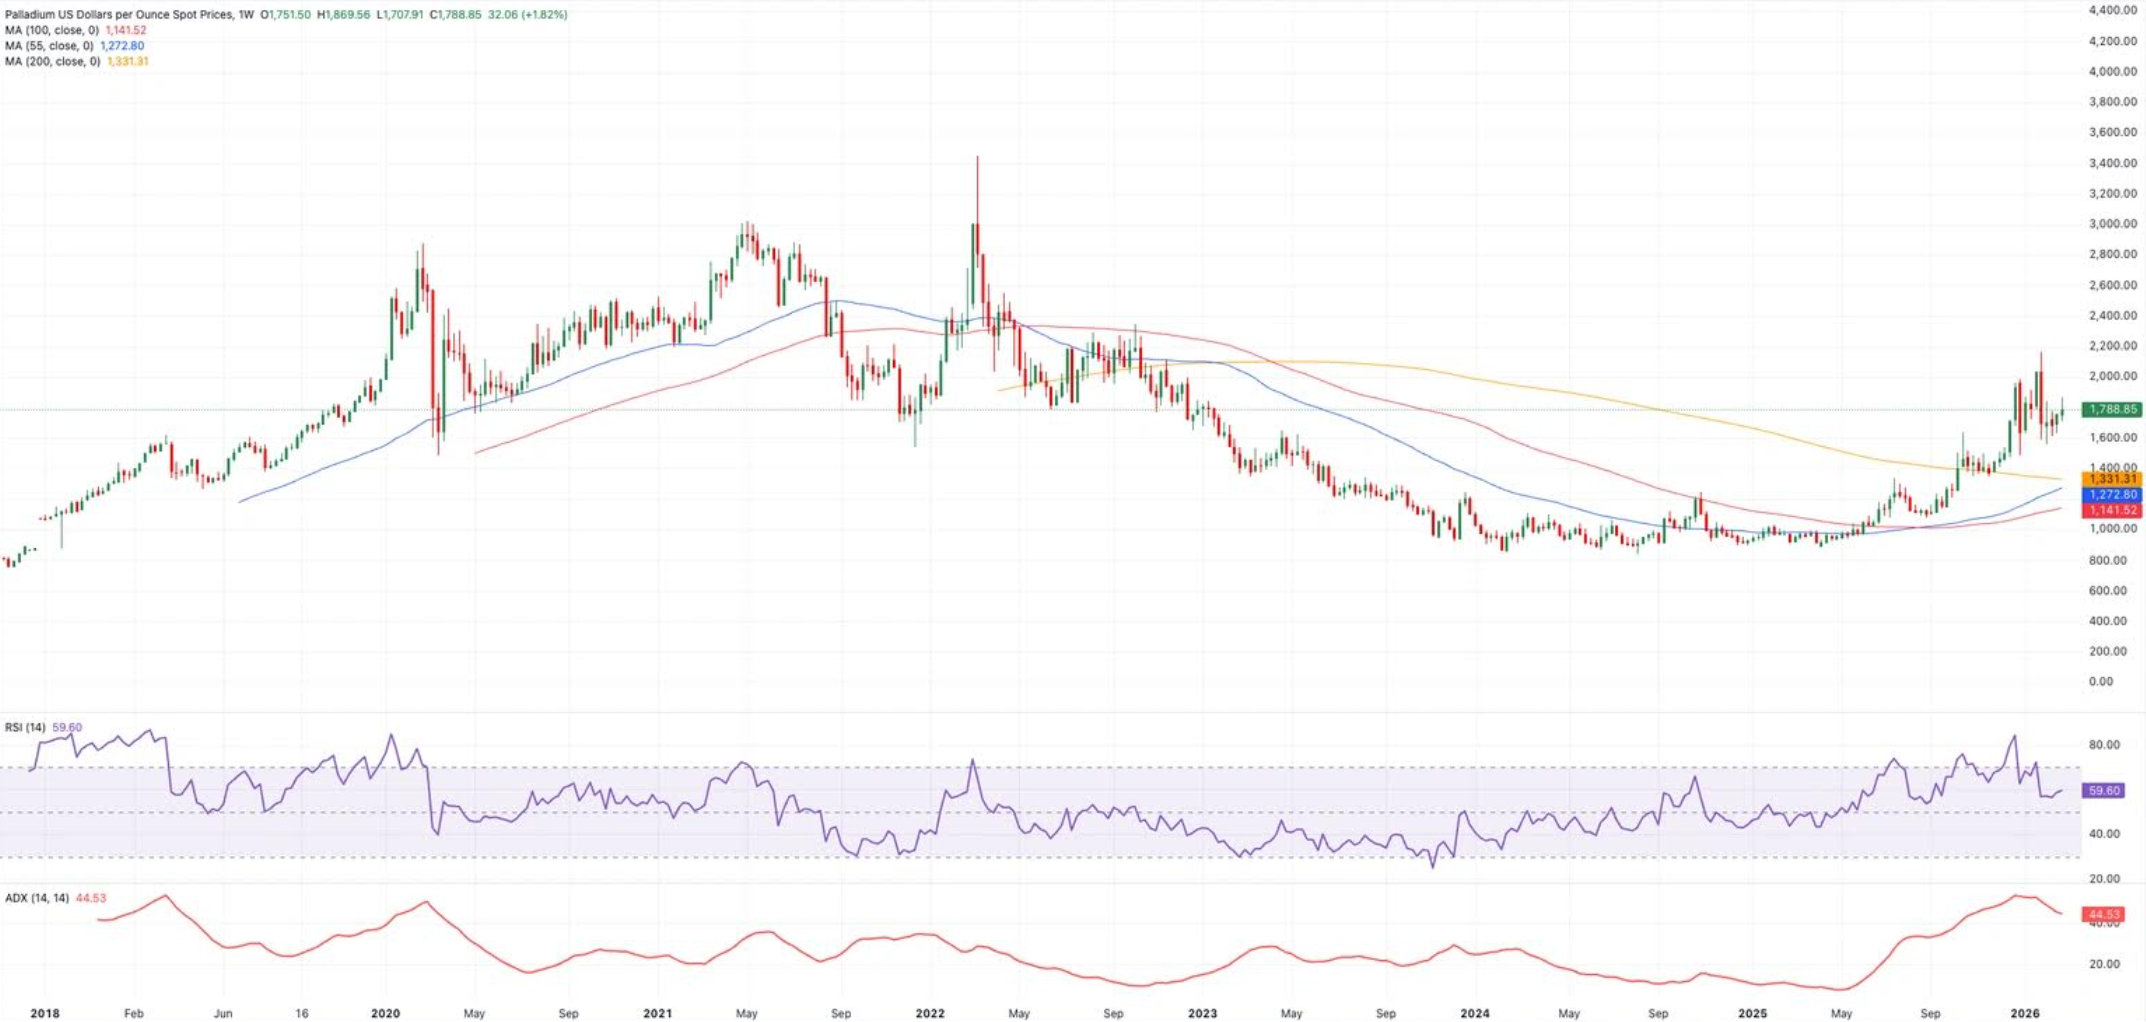
On the weekly chart, higher lows have begun to form since the $1,000 floor held. The trend strength indicators are expanding again, signalling that directional conviction is returning after a prolonged period of compression.
Price is now approaching a key resistance band between $1,900 and $2,000, a zone that previously acted as a distribution during the early stages of the collapse.
A sustained weekly break above that area would materially alter the medium-term outlook and likely trigger a reassessment of the “terminal decline” narrative.
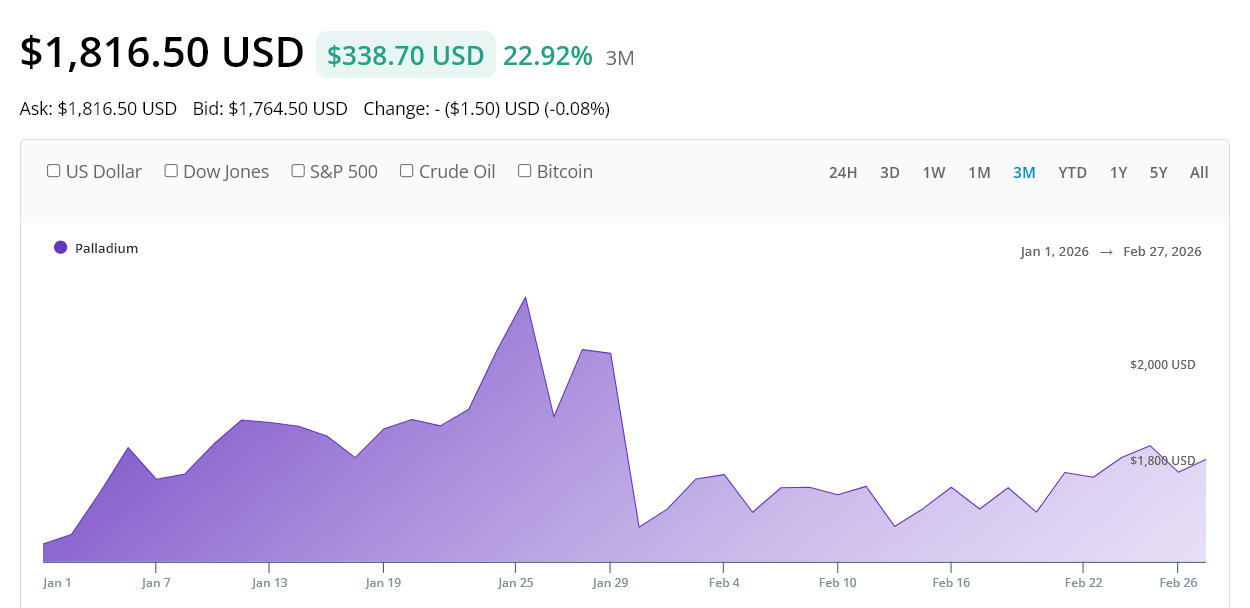
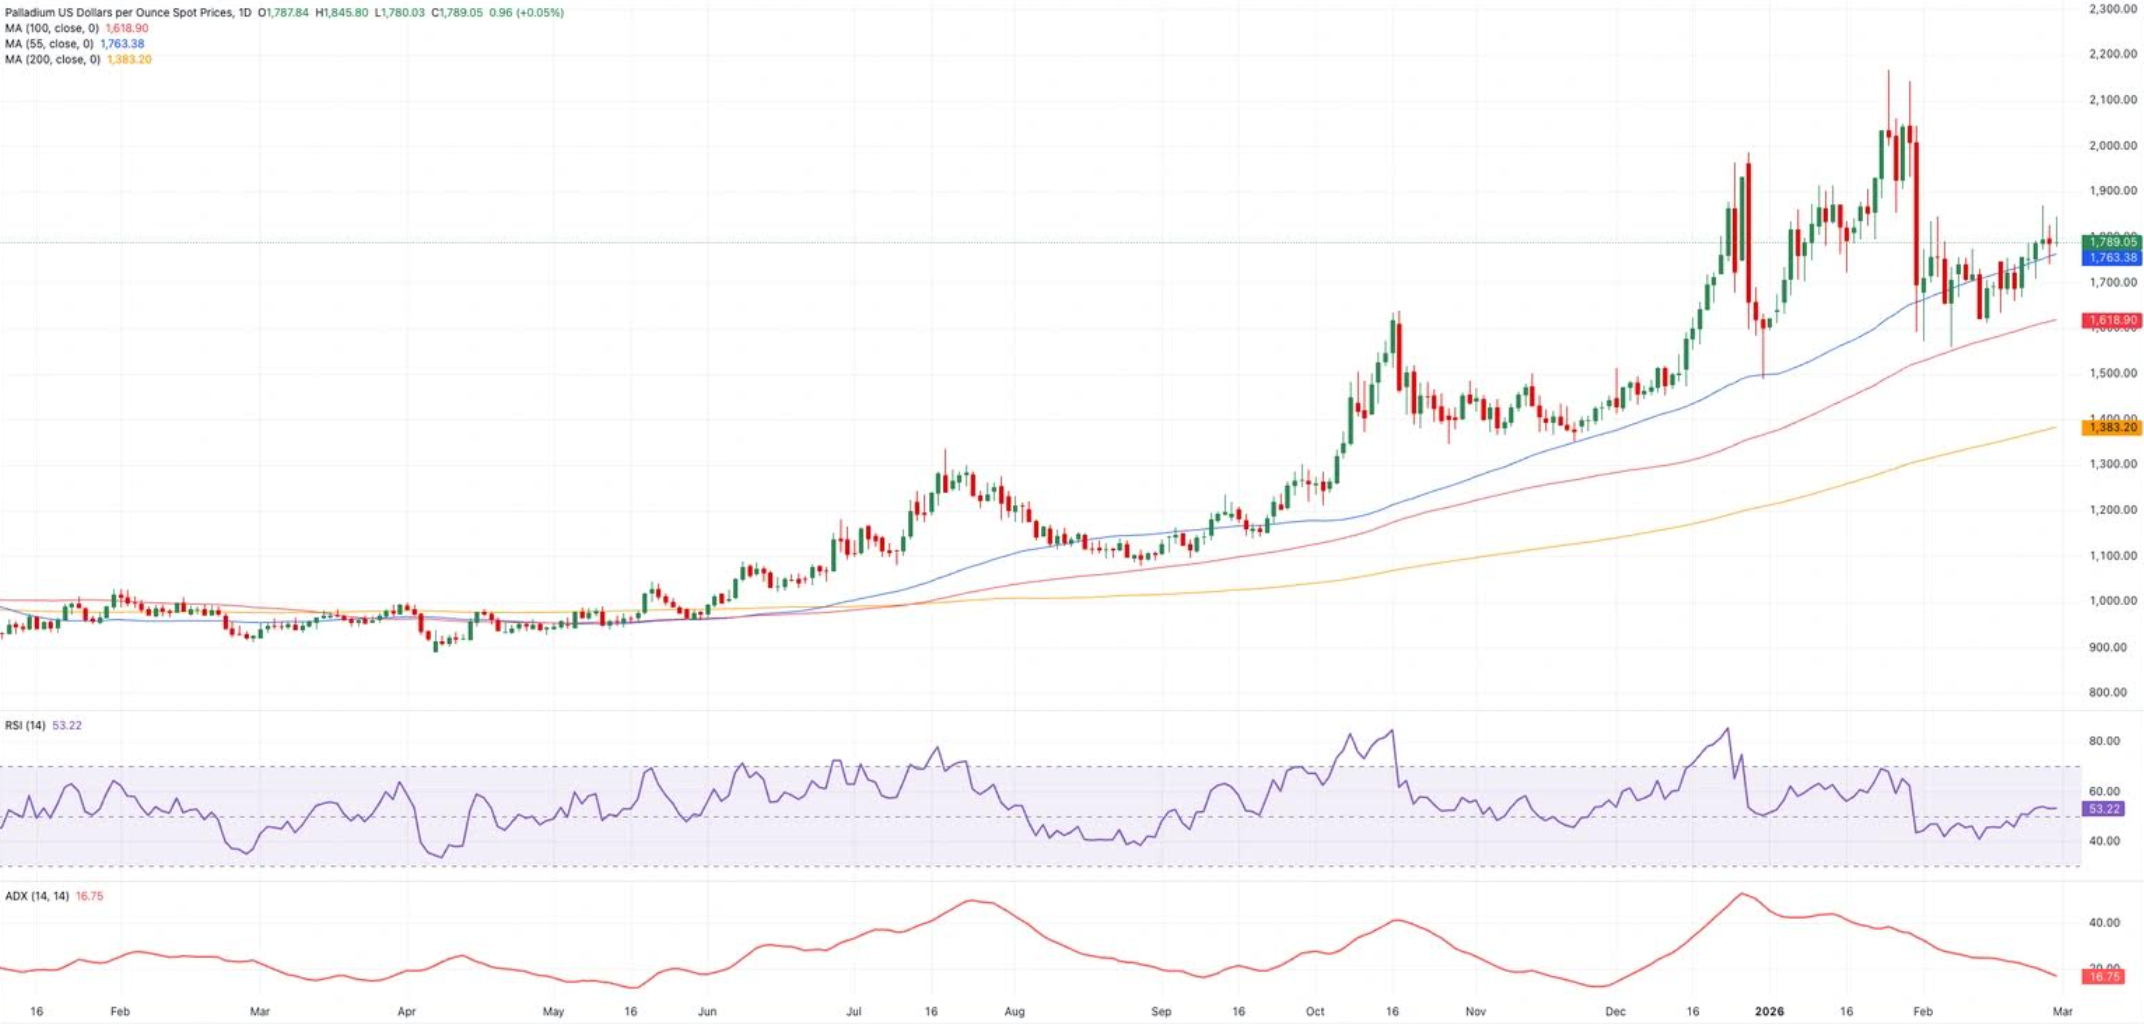
After a big jump, Palladium has settled into a holding pattern around the $1,750-$1,800 area on the daily chart.
The move up has stopped in a fairly orderly way instead of getting too hot. Momentum indicators remain in the middle range, indicating that the market is retaining its gains rather than losing momentum.
For now, the $1,700 to $1,720 range serves as a near-term cushion. On the upside, a convincing break above $1,850 would signal that buyers are ready to press the recovery further.
Until one of those levels gives way, the metal looks more like it is coiling than collapsing.
In short, the technical picture aligns with the broader macro narrative: the worst of the decline appears to be behind us, but confirmation of a new structural leg higher requires a decisive break above the $1,900-$2,000 region.
Until then, Palladium remains a rebuilding story: volatile, sensitive to macro inputs, and poised at an inflection point rather than in a confirmed breakout.
In a market defined by extremes, Palladium may once again be preparing for a decisive move; the only question is whether conviction ultimately resolves higher or whether volatility reasserts itself before a true structural recovery takes hold.


TLDR:
- Binance Gold trading volume surged from $1.5M to $7.6B daily in approximately 90 days.
- Silver trading on Binance peaked at nearly 20% of total daily COMEX trading volume.
- BlackRock and Franklin Templeton have launched tokenized funds on blockchain infrastructure.
- US Oil trades at $760M and Tesla stock at $190M daily on the Binance crypto platform.
Real-world asset tokenization is changing how investors access commodities and equities. Crypto platforms now offer direct exposure to traditional markets, attracting both retail and institutional participants globally.
Real-world asset (RWA) tokenization converts ownership rights of physical assets into blockchain-based digital tokens. These tokens represent fractional ownership and trade on crypto platforms alongside standard cryptocurrencies.
Smart contracts power the process, cutting out intermediaries and reducing settlement times considerably.
Ali Charts recently noted the growing overlap between crypto trading and traditional financial markets. Platforms like Binance now offer direct access to commodities, equities, and digital assets in one place.
This shift is visible in rising trading volumes across multiple asset classes on crypto exchanges.
Binance Volume Data Points to a Measurable Market Shift
Gold trading on Binance climbed from $1.5 million in daily volume to $7.6 billion within approximately 90 days. Silver followed a similar path, reaching $6.4 billion in daily volume at its peak.
That peak represented nearly 20% of total daily COMEX trading volume, a widely recognized commodity benchmark. Beyond precious metals, other traditional assets are recording notable figures on crypto platforms.
Binance’s daily trading volume for US Oil is $760 million, while Tesla stock trades approximately $190 million daily. Products like MicroStrategy stock and crude oil futures are also showing strong activity compared to traditional market equivalents.
Traditional exchanges like COMEX and NYMEX operate within fixed trading hours and involve multiple intermediaries. Crypto exchanges operate around the clock, allowing traders to act on real-time events without delay.
This availability is drawing investors who previously found traditional commodity markets difficult to access.
Institutional Adoption and the Regulatory Path Ahead
As more investors trade real-world assets through crypto platforms, liquidity in these markets continues to build. Investors no longer have to choose between crypto and traditional assets, as both are now accessible on a single platform.
This removes geographic and institutional barriers that once limited broader market participation. Major financial institutions are moving steadily into blockchain-based asset tokenization.
BlackRock and Franklin Templeton have both launched tokenized funds and blockchain investment products. Their involvement adds credibility to the long-term infrastructure supporting RWA tokenization.
Decentralized finance platforms are integrating tokenized assets to build new lending and yield products. Regulatory clarity remains a key factor shaping the pace of adoption globally.
Jurisdictions that balance blockchain innovation with investor protection are positioned to attract sustained industry growth.


Bitcoin’s recent rally has proven fragile as a confluence of geopolitical tensions and macro headwinds weighs on sentiment. About a week into its rebound, BTC was hovering near the $71,000 level, with traders watching for signs of sustained strength in the face of ongoing Middle East conflict and uncertain policy signals. Data from TradingView put the spot around $71,276 as of the latest sessions, underscoring the challenge of building a durable upside from here.
“Even if the war ends now, its repercussions will likely define the story for 2026 and, at minimum, dominate the narrative through Q2,” said Nic Puckrin, a crypto market analyst and founder of Coin Bureau. In an interview with Cointelegraph, Puckrin framed the current setup as fragile, arguing that a sustained push higher would depend on a confluence of favorable developments beyond the immediate conflict.
For a push toward $90,000, we would need to see a combination of a ceasefire that ends geopolitical tensions, a sustained drop in oil prices toward $80, and ideally also softer-than-expected economic data that calms stagflation fears.
Beyond the headline risk, price action remains tethered to macro dynamics. If Bitcoin closes the week above the $71,000 mark, Puckrin suggested the next leg higher could unfold toward the $74,000 zone, though the path remains contingent on a broader risk-on environment and how geopolitical headlines evolve.
Key takeaways
- Bitcoin trades near $71,000, with resistance eyed around $74,000; a weekly close above $71,000 could signal more upside.
- The market currently faces an inflationary impulse linked to ongoing conflict, a factor that dampens expectations for near-term rate cuts in 2026.
- A sustained rally toward $90,000 would require a ceasefire, oil around $80, and softer-than-expected economic data, according to Nic Puckrin.
- Macro policy remains uncertain: the Fed’s stance on rate cuts in 2026 is still debated in light of inflation pressures and war-related risks.
- Near-term price action has shown volatility: BTC briefly crossed above $73,000 in early April before retreating toward $71,000 as headlines from the Middle East and policy signals evolved.
Bitcoin’s price action in the shadow of geopolitics and policy
The latest price movement reflects a delicate balance between risk appetite and safety-driven demand. After a surge to just over $73,000 in early April—driven by a broader risk-on tone—the market retraced as news of stalled negotiations between the U.S. and Iran fed into risk-off sentiment. The Kobeissi Letter captured the tone, describing the peace talks as “arguably the worst-case scenario” when they appeared to falter, a sentiment that rippled through markets as traders recalibrated expectations for geopolitical risk premiums embedded in crypto prices.
In a separate development, former U.S. President Donald Trump stated on Truth Social that he had directed the U.S. Navy to form a naval blockade around the Strait of Hormuz and to interdict vessels that paid tolls to Iran. While such statements escalate geopolitical risk discourse, traders often weigh them against the practical likelihood and timing of policy changes that would meaningfully shift Bitcoin’s trajectory.
The ongoing macro backdrop is reinforced by inflation data, with the U.S. Bureau of Labor Statistics’ CPI report highlighting an inflationary spike tied to the war. The CPI release cooled hopes for rapid further rate cuts in 2026 and reinforced the narrative that monetary policy will remain restrictive while inflation remains elevated.
Policy signals, market expectations, and what comes next
The policy landscape remains a crucial driver for crypto risk assets. Minutes from the March FOMC meeting underscored ongoing debate among policymakers about the path of rate cuts in 2026, influenced by inflation concerns tied to wartime dynamics. The market’s expectations around the federal funds rate have shifted in response to these tensions.
According to CME Group’s FedWatch tool, the probabilities indicate a very high likelihood—over 98%—that the FOMC will keep the current target range of 3.50%–3.75% at the next two meetings (April 29 and June 17). The probability of a rate cut by the July 29 meeting sits at roughly one-third, with about a 33.6% chance of a 25 basis point cut. This landscape suggests a prolonged period where policy remains restrictive until inflation shows clearer signs of easing.
For Bitcoin traders, the combination of policy certainty on hold with a potential future rate cut remains a central tension. The market is watching whether softer data emerges to push expectations for easing, or whether inflationary momentum persists in the face of geopolitical shocks. Meanwhile, BTC’s technical backdrop—trading below the 200-day exponential moving average, as reflected in traders’ charts—adds another layer of caution for near-term bets.
Beyond the immediate price dynamics, the broader crypto narrative continues to hinge on how investors interpret risk, and whether a stabilizing ceasefire and lower oil prices could unlock a more durable risk-on environment. While the path to $90,000 remains a conditional and uncertain proposition, the scenario Puckrin outlines—courtesy of a ceasefire, oil around $80, and a favorable macro backdrop—provides a benchmark against which market moves will be measured in the coming weeks and months.
As the market absorbs mixed signals from geopolitics and policy, traders will be watching several indicators: a potential shift in oil prices that alleviates energy-driven inflation, a softer-than-expected economic data flow that could prompt earlier policy loosening, and, importantly, any development toward de-escalation of regional tensions that might remove some of the near-term risk premium baked into crypto assets.
Reading the tea leaves for Bitcoin now means focusing on the confluence of headlines and data: price action around $71,000, an upcoming test of resistance near $74,000, and the evolving expectations for 2026 policy moves. The coming weeks could reveal whether the current recovery gains traction or whether the market reverts to a more cautious posture as macro and geopolitical risks persist.
Readers should remain attentive to how geopolitical developments unfold, how oil prices respond to those dynamics, and how inflation and policy guidance shape risk appetite across crypto markets. The next movements in these areas will likely define whether Bitcoin’s recovery gains durability or remains a fragile bounce in uncertain times.
TLDR:
- Analyst Aaron Dishner warns April’s BTC rally is a deceptive move within a larger bear market.
- Historical bottom-year patterns show April relief rallies precede sharper May and June corrections.
- On-Balance Volume and TBO divergence signals suggest Bitcoin’s April recovery lacks real conviction.
- Dishner targets $49,000 as Bitcoin’s key support if the $60,000 price floor breaks down in Q2.
Bitcoin bull trap fears are mounting as analyst Aaron Dishner warns that April’s price recovery is not a sign of bear market reversal.
Drawing on historical bottom-year patterns and technical indicators, Dishner argues that a deceptive relief rally is forming ahead of a sharper May and June correction.
He cautions retail investors against mistaking short-term green candles for a sustained trend shift, noting that the broader bearish structure for Bitcoin remains firmly in place.
April’s Rally Could Be Setting Up Retail Investors for a Fall
Bitcoin has shown sharp price swings this week, drawing fresh attention from traders across the market. Analyst Aaron Dishner urges caution against reading too deeply into recent gains.
He argues the bear market structure remains intact despite the short-term price uptick. Dishner’s analysis draws on the Better Crypto Calendar, tracking monthly returns for BTC, ETH, and the broader crypto market.
The data reveals a recurring pattern in bottom years, where relief rallies appear but stay contained within a larger bearish structure. He believes 2026 is following that same path.
He previously flagged a 4.3% price pump triggered by unverified geopolitical news, which reversed quickly. He sees that kind of move as a textbook example of low-liquidity manipulation. Similar fake-outs, he warns, are likely to repeat through April.
On X, Dishner wrote: “The data is pointing to a mini rally in April that could fool a lot of people before things get uglier in May and June.”
Potential tests of the $70,000 to $80,000 range are part of what he describes as a relief rally phase. Those levels could pull in retail buyers expecting a full trend reversal.
That enthusiasm, he notes, is exactly what makes a bull trap effective. The TradFi phrase “sell in May and walk away” lines up well with his broader outlook this year.
Bottom years, he explains, often include an April bounce, followed by further pain in May and June. A secondary bounce around July is also possible, but only after a more significant drawdown has already occurred.
Technical Signals and Downside Targets Reinforce the Bearish Case
Dishner tracks On-Balance Volume alongside his TBO Indicator to assess the conviction behind any rally. Both metrics are currently weak, despite the recent price move higher.
He reads this as a clear sign that genuine buying pressure is missing from the market. Fresh Trending Breakout divergence warnings have appeared on higher timeframes as well.
These signals, in his view, point toward lower price lows ahead in May and June. His primary downside target for Bitcoin sits at $49,000, should the $60,000 support level fail to hold.
Dishner advises traders to stay patient and avoid chasing short-term green candles in this environment. He recommends waiting for bearish confirmation before entering heavy positions.
Bottom years do create long-term accumulation opportunities, but only for those who remain disciplined through the volatility and false signals along the way.
Crypto World
Europe Moves to Place Crypto-Asset Providers Under Centralized EU Supervision Through ESMA
TLDR:
- The ECB fully endorsed the EU Commission’s plan to transfer crypto-asset supervision to ESMA in Paris.
- Crypto-asset service providers would move from national regulators to a single EU-wide supervisory framework.
- The ECB warned that ESMA must be adequately staffed and funded before taking on expanded crypto oversight.
- The proposal now enters EU government and Parliament negotiations, a process expected to take several months.
Europe is moving toward centralized oversight for crypto-asset service providers across the bloc. The European Central Bank endorsed the European Commission’s proposal on Friday.
The plan shifts supervision of key financial entities, including crypto firms, to EU level. The European Securities and Markets Authority in Paris would take on this expanded role.
France and Germany have championed this regulatory integration effort. The move aims to strengthen Europe’s position against the US and China.
Crypto-Asset Providers Face Direct EU Supervision Under New Proposal
Crypto-asset service providers are now formally included in the EU’s centralized oversight push. The ECB confirmed its full support for transferring supervision of these entities to ESMA.
This marks a clear shift in how Europe intends to regulate the crypto sector. Crypto firms operating across EU borders would fall under a single supervisory framework.
Currently, crypto-asset service providers answer to national regulators in each member state. The Commission’s proposal would move that authority directly to ESMA in Paris.
This change would create a unified approach to crypto oversight across the entire EU. The goal is to remove fragmentation and close regulatory gaps between member states.
The ECB made its position clear in a formal opinion required under EU legislative procedures. “The ECB fully supports the Commission proposals, which constitute an ambitious step towards deeper integration of capital markets and financial market supervision within the Union,” the central bank stated
. While the opinion is not binding on lawmakers, it carries considerable weight in the ongoing debate. It signals institutional alignment behind the push for centralized crypto supervision.
Smaller EU states such as Ireland and Luxembourg have shown hesitation toward the plan. Both countries currently host a significant number of crypto and financial firms.
However, the ECB’s backing may gradually ease resistance from these governments. Centralized oversight could also bring greater legal certainty for crypto businesses operating in those markets.
ESMA Must Be Ready to Handle Crypto Supervision at Scale
The ECB warned that ESMA must be properly staffed and funded before taking on crypto oversight. Expanding supervision to include crypto-asset service providers adds significant operational demands.
Without adequate resources, effective enforcement of crypto regulations could fall short. The central bank stressed that resourcing must be addressed before the transition begins.
A sequenced transition from national to EU-level supervision was also recommended by the ECB. For crypto firms, an abrupt regulatory handover could create compliance uncertainty in the short term.
A phased approach would give both ESMA and crypto providers time to adjust. This measured rollout is seen as key to maintaining stability during the changeover.
The ECB also requested a non-voting seat on the ESMA board as part of this process. It wants its expertise reflected in technical standards, guidelines, and recommendations that will govern crypto supervision.
These standards will shape how crypto-asset service providers are monitored going forward. Getting this framework right matters for both investor protection and market confidence.
The Commission’s proposal now heads into negotiations between EU governments and the European Parliament. This legislative process is expected to span several months before becoming law.
For the crypto sector, the outcome of these talks will define the regulatory landscape ahead. Industry participants across Europe will be watching each stage of the negotiations closely.
TLDR:
- Dynamix Corporation and The Ether Reserve LLC mutually terminated their Business Combination Agreement on April 8, 2026.
- Unfavorable market conditions were cited as the primary reason behind the immediate termination of the planned merger deal.
- The Payor is required to pay Dynamix $50,000,000 within 15 days of the April 8, 2026 termination effective date.
- Dynamix has until November 22, 2026 to close a new business combination or face mandatory liquidation of public shares.
Dynamix Corporation business combination termination has sent ripples through the SPAC landscape, closing the door on what was once a promising path to bringing The Ether Reserve LLC to public markets.
On April 8, 2026, both parties pulled the plug on their July 2025 merger agreement, with unfavorable market conditions bearing the blame.
The exit comes with a hefty price tag — a $50 million termination payment now due within 15 days, leaving Dynamix racing against its November 2026 deadline to find a new deal or face liquidation.
Ether Machine Cites Market Conditions in Merger Exit
The Ether Machine, a planned public company, confirmed the mutual termination of its business combination with Dynamix Corporation and The Ether Reserve LLC effective immediately.
The deal was originally signed on July 21, 2025, and was widely seen as a path to taking the company public via Nasdaq. Market conditions, however, shifted that trajectory.
The termination dissolved the Sponsor Support Agreement between DynamixCore Holdings, LLC, Dynamix, and The Ether Machine, Inc. alongside it. The ETHM Subscription Agreements and the Contribution Agreement also ended in accordance with their own terms.
These agreements were all structurally tied to the original business combination. Multiple entities were party to the Termination Agreement, including ETH SPAC Merger Sub Ltd. and ETH Partners LLC.
Three Delaware-incorporated SPAC subsidiaries were also signatories to the deal. Each played a defined role within the originally planned transaction structure.
The termination filing was submitted to the U.S. Securities and Exchange Commission as a Current Report on Form 8-K.
Dynamix, trading on Nasdaq under ticker ETHM, disclosed the full details within that report. The document is publicly available through the SEC’s filing system.
$50M Payout and a November 2026 Deadline Set the Next Clock
Under the Termination Agreement, the Payor named in Annex A must pay Dynamix $50,000,000 within 15 days of April 8, 2026. The agreement includes mutual releases for all known and unknown claims tied to the original Business Combination Agreement.
A covenant not to sue and a mutual non-disparagement clause also form part of the terms. Dynamix still has until November 22, 2026, to complete a new initial business combination.
This window was established in its final prospectus filed on November 21, 2024. Should no deal close by that date, the company must begin winding down operations and redeem public shares from its trust account.
The Sponsor and Dynamix officers have waived their rights to liquidating distributions from the trust account on founder shares. They remain entitled to distributions from assets held outside the trust account.
That pool could include portions of the $50 million termination payment remaining after company expenses are settled.
Crypto World
Justin Sun Accuses World Liberty Financial of Hidden Token Freeze Backdoor Amid $175M Dispute
TLDR:
- Justin Sun invested roughly $175 million across WLFI and TRUMP memecoin before the public fallout began.
- WLFI froze 595 million of Sun’s unlocked tokens worth $107 million, citing a breach of his investor agreement.
- WLFI borrowed $75 million in stablecoins on Dolomite against its own token, sending $40 million to Coinbase Prime.
- The WLFI token has dropped 76% from its all-time high, now trading near $0.079 amid ongoing legal threats.
World Liberty Financial and Justin Sun are locked in a public dispute over frozen tokens, alleged misconduct, and a contract backdoor claim.
Sun, the project’s largest investor with roughly $175 million in Trump-linked crypto exposure, accused WLFI of hiding a wallet freeze function from investors. WLFI denied the claims and threatened legal action.
On-chain data has made portions of both sides’ activities visible to the public, raising questions across the crypto community.
Justin Sun Alleges Hidden Freeze Function in WLFI Token Contract
Sun first invested $30 million in WLFI in late 2024. By January 2025, he scaled that position to $75 million and was named a project advisor. He also committed $100 million to the TRUMP memecoin, bringing his total exposure to roughly $175 million.
The WLFI token launched on September 1, 2025, at around $0.25 and reached a high near $0.33. Only 20% of presale tokens were unlocked at launch.
Three days after launch, Sun moved approximately 50 million WLFI tokens to HTX, an exchange where he holds an advisory role.
Around that same time, HTX began offering WLFI presale investors high yields for depositing and locking their newly unlocked tokens.
WLFI alleges that Sun was selling tokens on the back end of his own exchange, including tokens tied to locked user balances.
According to WLFI, the plan was to exit early using retail users’ locked tokens as liquidity. Sun would then use future token vestings to refill HTX user balances. WLFI says it obtained logs supporting this claim and froze his wallet on breach-of-agreement grounds.
The freeze locked approximately 595 million unlocked tokens worth $107 million, along with billions more in vesting tokens. On-chain data from Nansen showed Sun’s wallet transfer occurred after the price dropped that day, not before.
Sun publicly described himself as “the first and single largest victim” of what he called a hidden backdoor blacklisting function.
He added that governance votes used to justify the freeze had key information hidden from voters and predetermined outcomes.
WLFI’s Dolomite Loan and Coinbase Prime Transfers Draw Further Scrutiny
Starting in February 2026, WLFI’s treasury began borrowing on Dolomite, a DeFi lending platform. It deposited its own stablecoin and governance token as collateral, then borrowed real stablecoins against them.
By April 9, 2026, WLFI had deposited 5 billion tokens as collateral and borrowed around $75 million in stablecoins. Over $40 million of those funds were sent to Coinbase Prime, a platform commonly used for institutional fiat conversion.
Dolomite was co-founded by Corey Caplan, who also serves as a WLFI advisor and has been described as acting in a CTO capacity. WLFI’s own token made up roughly 55% of Dolomite’s total liquidity at that point.
The USD1 stablecoin pool on Dolomite reached 93 to 100% utilization during this period, making it difficult for regular depositors to withdraw their funds. The $40 million transfer to Coinbase Prime took place hours before Trump’s US-Iran ceasefire announcement.
WLFI responded to the criticism by calling it FUD. The project stated the position was far from liquidation and described itself as an “anchor borrower” generating yield for other lenders on the platform.
WLFI’s official account addressed Sun directly on X, stating: “See you in court pal.” Sun responded by demanding the team identify themselves publicly rather than operating behind an anonymous account. The Dolomite loan remains open, and the WLFI token was trading near $0.079 at the time of writing, down 76% from its all-time high.
Crypto World
Morpho Borrowers Generate $170M in Interest as DeFi Lending Competition With Aave Heats Up
TLDR:
- Morpho borrowers paid $170M in interest over the past year, reflecting strong borrower demand on the protocol.
- At a 10% take rate, Morpho DAO earns roughly $17M annually against a $1.7B valuation, a 1:100 revenue multiple.
- Aave generated $140M in annualized revenue against a $1.5B valuation, giving it a far stronger revenue-to-valuation ratio.
- Morpho’s modular lending structure limits DAO revenue capture, making its take rate model a key factor for token pricing.
Morpho borrowers have paid approximately $170 million in interest over the past year, new data from Token Terminal shows.
This figure places the lending protocol in direct comparison with Aave, one of the longest-standing decentralized finance platforms.
The numbers have drawn attention from analysts tracking on-chain revenue metrics. Both protocols are now being evaluated side by side, giving investors a clearer picture of where value is being generated in DeFi lending.
Morpho’s Revenue Math at a 10% Take Rate
Token Terminal recently shared data showing Morpho’s borrower interest payments over a 12-month period. Based on a 10% take rate assumption, the Morpho DAO would have generated around $17 million in annualized revenue. That revenue figure sits against a current protocol valuation of approximately $1.7 billion.
Token Terminal posted on X, noting that “borrowers on Morpho have paid ~$170M in interest during the past year.”
The post further stated that at a 10% take rate, the DAO would have generated roughly $17M in annual revenue. That framing gave markets a concrete way to assess the protocol’s earnings relative to its size.
The revenue-to-valuation ratio for Morpho currently stands at roughly 1:100. For context, that means the protocol is valued at about 100 times its estimated annual revenue.
This kind of multiple is common in early-stage crypto protocols but remains a key figure for fundamental investors watching the space.
How Aave Stacks Up Against Morpho
Aave, by contrast, has generated approximately $140 million in annualized revenue. Its current valuation sits at around $1.5 billion, which places it at a revenue-to-valuation ratio closer to 1:11.
That gap between the two protocols is notable for anyone comparing lending platforms on a fundamentals basis.
Token Terminal’s post drew a direct comparison between the two, stating that “Aave has generated ~$140M in annual revenue against a ~$1.5B valuation.”
The contrast makes clear that Aave is generating far more revenue relative to its market cap than Morpho. However, Morpho’s total interest paid by borrowers is higher at $170M, showing strong borrower activity on the platform.
The difference in take rates between the two protocols drives much of the revenue gap. Morpho’s modular lending structure means the DAO captures a smaller portion of total interest paid.
As the protocol matures, its revenue capture model will likely be a key factor in how the market continues to price MORPHO tokens going forward.
TLDR:
- Sei Network daily active users dropped from over 2M to between 1M and 1.2M in April 2026.
- Sei Network TVL fell sharply to $41.6M from a peak of $626M recorded in July 2025.
- Sei Network DEX and perpetuals volumes hit $6.55M and $12.25M respectively in 24 hours.
- Sei Network FDV of $549M exceeds its $369M market cap, signaling more token supply ahead.
Sei Network is currently navigating a consolidation phase marked by steady user retention but softening capital inflows.
On-chain data from April 2026 shows the network maintaining a functional base of activity while key growth metrics trend downward.
Trading volumes remain active across decentralized exchanges and perpetuals markets. However, liquidity and new user acquisition have slowed, painting a picture of a network in pause rather than decline.
User Engagement Holds Steady as New Growth Loses Steam
Daily active users on Sei Network have pulled back from over 2 million earlier in April to between 1 million and 1.2 million. That decline, while notable, does not point to a collapse in network participation.
Returning users continue to make up the bulk of on-chain activity, which shows the existing community remains engaged.
New user growth, on the other hand, has softened considerably over the same period. This pattern often appears when a network exhausts its initial wave of adoption and enters a slower, more organic phase. It does not signal failure, but it does mean fresh momentum has cooled for now.
As noted by crypto analyst Kingjaz on X, Sei is “showing a mix of resilience and weakness,” with user activity holding but capital inflows clearly slowing.
That balance defines where the network stands today. The core community is present, but expansion is not happening at the pace seen earlier this year.
Trading activity across the network tells a similar story. DEX volume reached $6.55 million in 24 hours, while perpetuals volume hit $12.25 million over the same window.
App fees and revenue remain thin at $11,155 and $2,872 respectively, showing usage without meaningful protocol-level earnings.
TVL Decline and Capital Rotation Raise Questions for Sei
The sharper concern within current data is the drop in total value locked. TVL on Sei sits at roughly $41.6 million, down from a peak near $626 million recorded in July 2025. That gap represents a substantial outflow of capital from the ecosystem over a relatively short time.
Bridged liquidity remains higher at approximately $251 million, and stablecoin market cap stands near $179 million.
These figures suggest capital has not entirely exited the ecosystem. Rather, it may be waiting on clearer market conditions or rotating into other opportunities.
Sei’s current price ranges between $0.055 and $0.057, with a market cap of around $369 million. The fully diluted valuation sits at approximately $549 million, meaning a portion of the total token supply has yet to enter circulation. That gap could add selling pressure down the line.
The network, therefore, sits at a crossroads between holding its ground and rebuilding momentum. Consistent trading and a loyal user base offer a stable floor, while weak inflows and limited revenue remain the metrics to watch going forward.
TLDR:
- TAO is trading at $261, below the critical 200-day moving average resistance level near $281.
- A lower high at $390 after November’s $475 peak signals a potential bearish distribution phase.
- The $143 Fibonacci support held earlier in 2025, producing a near tripling of TAO’s price value.
- Real subnet usage and institutional interest in Bittensor keep the bullish fundamental case alive.
Bittensor’s TAO token is navigating a pivotal technical crossroads at $261, drawing sharp attention from traders and analysts.
The asset sits below its 200-day moving average while red volume spikes signal rising selling pressure. A lower high at $390 following November’s $475 peak adds to growing concern.
Yet strong subnet fundamentals continue to challenge the purely bearish reading of the chart.
TAO Bears Point to Distribution Pattern After Lower High
The March lower high has become the central talking point among TAO watchers. Price ran from the $143 Fibonacci floor to $390, a move that nearly tripled in value.
However, that rally failed to reclaim the 200-day moving average sitting near $281. That failure now stands as a textbook warning signal for trend traders.
Analyst @2xnmore laid out the concern plainly, stating that “a lower high after a failed 200 MA reclaim is one of the cleanest bearish signals in technical analysis.”
That pattern, combined with today’s volume spike to the downside, raises valid questions about who is actually selling. Distribution phases often look exactly like this before price rolls over completely.
Below the current $261 level, the next visible support sits between $200 and $220. A breakdown through that zone opens the door to a retest of the $143 lows.
That would represent a near 45% drop from current prices, a scenario that would reset the entire 2025 narrative around TAO.
Smart money often exits into retail momentum. The dTAO narrative and subnet expansion attracted fresh buyers in Q1.
If institutions used that interest to offload positions, the lower high becomes more than just a technical signal. It becomes evidence of a completed distribution cycle.
Fundamentals Offer a Counter Case for TAO Bulls
On the other side of the argument, TAO’s underlying ecosystem has not deteriorated. Real usage on Chutes, growing subnet activity, and institutional interest in Bittensor infrastructure remain active. These are not paper narratives. They reflect building utility across the network.
@2xnmore acknowledged this tension directly, noting that “the fundamentals on this subnet ecosystem are unlike anything else in crypto right now.”
That kind of divergence between price and utility has historically preceded strong recoveries in emerging crypto sectors. The 0.618 Fibonacci level at $143 held earlier in the year and produced a near tripling of price.
A clean reclaim of the $281 moving average, supported by above-average volume, would structurally shift the chart back to bullish.
That level now acts as both resistance and a defining line for trend direction. Bulls need that reclaim to invalidate the lower high pattern.
Until that happens, TAO trades in a zone where both outcomes remain technically valid. The chart and the fundamentals are currently pointing in opposite directions.
Crypto World
WLFI Token Controversy: $5B Collateral Move, Withdrawal Crisis, and Justin Sun Blacklist Claim
TLDR:
- WLFI deposited $5B of its own token on Dolomite, borrowing $75M and sending $40M to Coinbase Prime.
- Dolomite’s utilization hit 100%, blocking ordinary depositors from withdrawing their stablecoins on the platform.
- Justin Sun alleged WLFI used a smart contract backdoor to blacklist his wallet, freezing $107M of his funds.
- Investor losses reached $3.87B across 600,000 wallets while related entities collected $350M in fees total.
World Liberty Financial (WLFI) is back at the center of crypto controversy following a series of financial moves that have raised serious questions about governance, transparency, and conflict of interest.
The token, currently trading at $0.07, has seen social activity surge sharply even as its price falls 18% this week and 67% from September highs.
With 600,000 wallets holding the token, losses now stand at $3.87B while related entities have collected $350M in fees.
Conflict of Interest Raises Questions Over WLFI’s Dolomite Transaction
WLFI deposited $5 billion worth of its own token as collateral on Dolomite, a DeFi lending protocol. Against that collateral, it borrowed $75 million in stablecoins. Shortly after, $40 million of those funds moved directly to Coinbase Prime.
The transaction structure drew immediate scrutiny due to the relationships involved. Dolomite was co-founded by Corey Caplan, who also holds an advisory role at World Liberty Financial. Essentially, the borrower had direct ties to the lender, the collateral, and the protocol itself.
When WLFI deposited the $5B in tokens, Dolomite’s utilization rate hit 100% almost immediately. That spike left ordinary depositors unable to withdraw their stablecoins, even though their balances appeared intact on paper.
This kind of arrangement has led many in the crypto community to question whether the transaction served the broader user base.
LunarCrush reported that social mentions, engagements, and crypto market share for WLFI are all climbing sharply, driven largely by these controversies.
Justin Sun Blacklist Claim Adds Another Layer to WLFI’s Growing Troubles
Beyond the Dolomite situation, WLFI now faces a separate and equally serious allegation. Justin Sun, founder of TRON, publicly claimed that WLFI blacklisted his wallet using a backdoor function embedded in the project’s smart contract.
According to Sun, this action froze approximately $107 million of his holdings without notice or recourse. The claim raised immediate concerns about centralized control within what was marketed as a decentralized finance project.
A backdoor function capable of freezing wallets runs counter to core DeFi principles. It suggests that specific parties may hold override authority over the protocol, which is not a standard feature in genuinely decentralized systems.
Meanwhile, WLFI’s circulating supply has reached 31.7 billion tokens. That growth in supply, combined with a price drop of 67% from its September peak, points to ongoing pressure on token value.
The Trump family and associated business entities have reportedly collected $350M in fees throughout this period, while investor losses have reached $3.87 billion across 600,000 wallets.
Yaya Mayweather Reacts To Jayda Cheaves & Dess Dior Fight

Teni – Money (Lyrics)

Primark launches app so shoppers can check stock in stores


-

 Politics2 days ago
US brings back mandatory military draft registration
-

 Fashion2 days ago
Weekend Open Thread: Veronica Beard
-

 Tech5 days ago
How Long Can You Drive With Expired Registration? What Florida Law Says
-
 Sports2 days ago
Man United discover Nico Schlotterbeck transfer fee as defender reaches Dortmund agreement
-

 Politics10 hours ago
World Cup exit makes Italy enter crisis mode
-

 Crypto World4 days ago
Canary Capital Files SEC Registration for PEPE ETF
-

 Fashion7 days ago
Massimo Dutti Offers Inspiration for Your Summer Mood Board
-

 Business2 days ago
Tesla Model Y Tops China Auto Sales in March 2026 With 39,827 Registrations, Beating Cheaper EVs and Gas Cars
-

 Fashion5 days ago
Let’s Discuss: DEI in 2026
-

 Crypto World4 days ago
Bitcoin recovers as US and Iran Agree a Ceasefire Deal
-

 Politics3 days ago
Malcolm In The Middle OG Turned Down ‘Buckets Of Money’ To Appear In Reboot
-
 NewsBeat2 hours ago
Pep Guardiola and Gary Neville agree over Arsenal title problem that benefits Man City
-

 Business3 days ago
OpenAI Halts Stargate UK Data Centre Project Over Energy Costs and Copyright Row
-

 Tech7 days ago
Italian court says Netflix must refund customers up to $576 over price hikes
-

 Business1 day ago
Ireland Fuel Protests Enter Day 5 as Blockades Spark Shortages and Government Prepares Support Package
-

 Tech7 days ago
Haier is betting big that your next TV purchase will be one of these
-

 Tech7 days ago
Gamer Restores the Original PlayStation Portal From Two Decades Ago
-

 Tech7 days ago
The Xiaomi 17 Ultra has some impressive add-ons that make snapping photos really fun
-

 Tech7 days ago
Samsung just gave up on its own Messages app
-

 Tech7 days ago
Save $130 on the Samsung Galaxy Watch 8 Classic: rotating bezel, sleep coaching, and running coach for $369
You must be logged in to post a comment Login