

Crypto World
Worldcoin (WLD) Plummets to Record Low as Foundation Offloads $65M in Tokens

Key Highlights
- World Assets, operating under the World Foundation umbrella, executed $65M in OTC token transactions with four buyers beginning March 20.
- The sale price averaged approximately $0.2719 per token, representing about 239 million WLD in total volume.
- Tokens valued at $25M are restricted by a six-month lock-up arrangement.
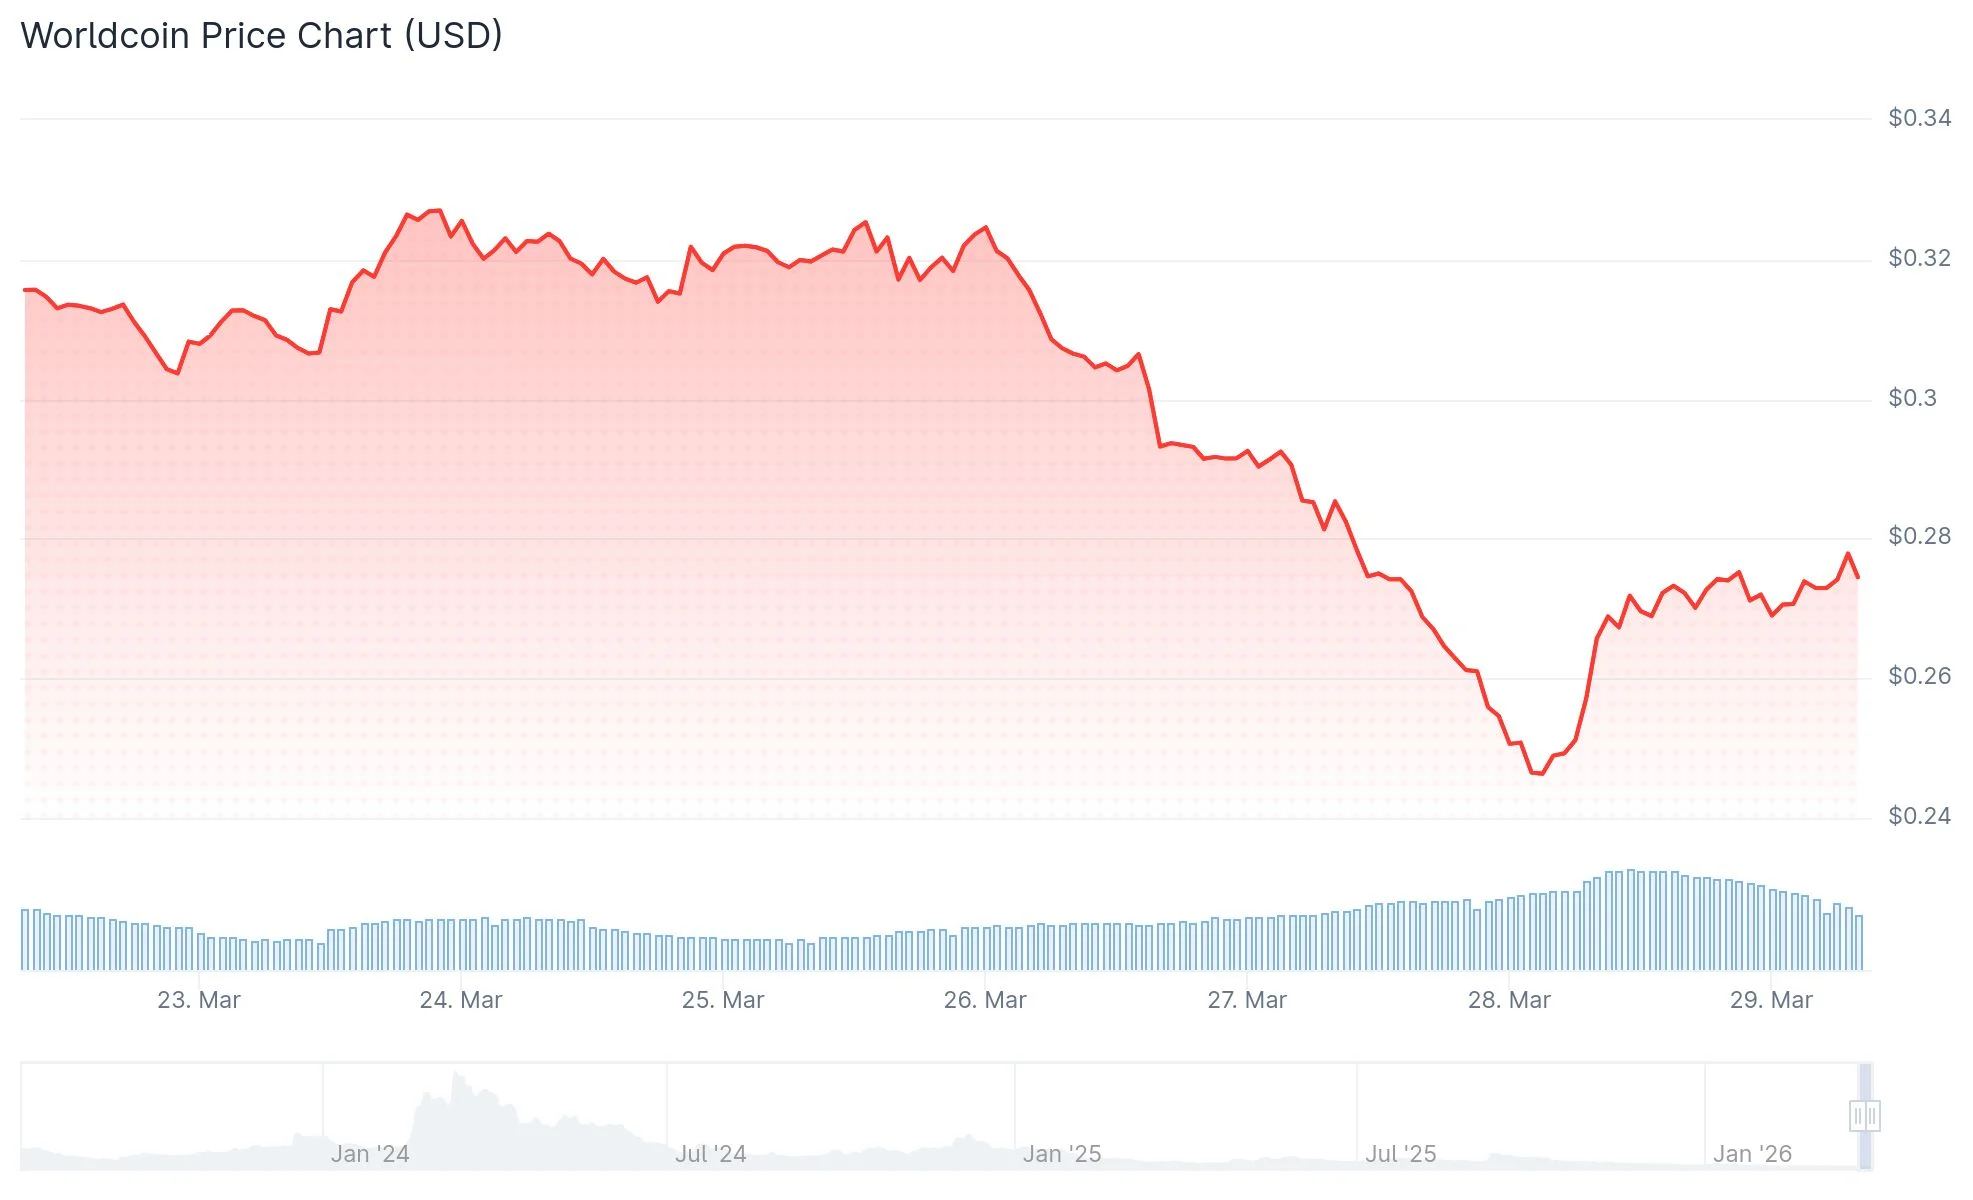
- The WLD token plunged to an unprecedented low of roughly $0.24 on Saturday, marking a ~97% decline from its $11.82 March 2024 high.
- An extensive unlock event affecting approximately 52.5% of the total token supply is slated for July 23, 2026.
The World Foundation’s operational arm, World Assets, has finalized over-the-counter sales totaling $65 million in WLD tokens across four separate counterparties during the past seven days. The initial settlement occurred on March 20, 2026.
Each token was sold at a mean price of roughly $0.2719, indicating a total transfer of approximately 239 million WLD tokens. All transactions were executed through World Assets’ designated multisignature wallet infrastructure.
From the $65 million proceeds, tokens representing $25 million are bound by a six-month restriction period. This mechanism prevents immediate resale of these holdings in secondary markets.
The capital raised will be allocated toward operational expenses, research initiatives, manufacturing of Orb verification devices, and comprehensive ecosystem expansion efforts.
Blockchain intelligence platform Lookonchain previously identified a movement of 117 million WLD tokens—valued at approximately $39 million—to Binance and FalconX on March 21. The organization received roughly $35 million in USDC as compensation, suggesting a per-token price around $0.30 during that transaction.
Coin Bureau’s analyst account on X highlighted the development, observing that World Foundation finalized OTC transactions worth $65M across four parties, with individual tokens priced at ~$0.2719 and $25M subject to a six-month restriction.
This transaction continues a recurring trend of WLD treasury liquidations. During April 2024, the organization—then operating as Worldcoin Foundation—outlined intentions to distribute between 0.5 million and 1.5 million WLD weekly to institutional purchasers. By May 2025, the initiative secured $135 million from investors including Andreessen Horowitz and Bain Capital Crypto.
The current OTC rate of $0.2719 represents a significant discount compared to previous funding rounds. WLD was valued at $1.13 during the May 2025 capital raise and $5.43 when the April 2024 distribution plan was announced.
WLD Token Reaches Historic Price Floor
WLD recorded an unprecedented low of approximately $0.2444 this past Saturday. Currently, the digital asset is trading near $0.27. The token has experienced roughly a 97% correction from its March 2024 zenith of nearly $11.82.
WLD presently maintains a market capitalization hovering around $850 million with a fully diluted valuation estimated at approximately $2.7 billion.
Substantial Token Unlock Event on Horizon
A significant community token release is programmed for July 23, 2026, according to DefiLlama information. This event encompasses approximately 52.5% of WLD’s aggregate 10 billion token allocation—representing about 169% of existing circulating supply—with tokens becoming available at a daily rate of roughly 4.79 million WLD.
Nasdaq-listed Eightco Holdings, which established a WLD treasury position in September 2025, maintains 277 million WLD tokens as of March 20, positioning it as the largest publicly traded institutional holder.


Three of DeFi’s relatively young applications — Hyperliquid, EdgeX and Pump.fun — collectively returned $96.3 million to token holders over the last 30 days, according to data compiled by DefiLlama. The results underscore a shift in the sector’s focus from pure on-chain activity to actual earnings that can be distributed to holders.
Hyperliquid led the pack, distributing $50.95 million in revenue to token holders for the period, with zero incentives spent, DefiLlama’s figures show. Pump.fun ranked second, returning $22.09 million to holders from $38.81 million in total revenue. EdgeX distributed $23.26 million to holders from $8.26 million in protocol revenue, a pattern that suggests the project is leveraging reserves or alternative income streams to reward its holders.
On an annualized basis, the momentum is even more pronounced: Hyperliquid has generated $945.87 million in revenue over the past year, all returned to holders; Pump.fun sits at $481.15 million; and EdgeX at $236.42 million.
Across the broader DeFi landscape, other major protocols reported distributions as well: Chainlink returned $4.63 million to holders, Aerodrome $3.53 million and Uniswap $3.29 million, spread across 44 chains. PancakeSwap generated $3.94 million in revenue, but returned $2.48 million to holders while spending $905,260 on incentives.
Related: DeFi can freeze stolen funds, but not everyone agrees it should
Crypto community now focuses on revenue
The data comes as revenue is becoming the metric that matters most in crypto, with token holders pushing protocols to justify their valuations through actual earnings rather than transaction volumes or network growth figures.
“Nobody cares that your chain does 10x the TPS anymore,” wrote Robbie Klages, co-founder of The Rollup, in a widely cited post on X. “The market is ‘show me the money right now.’ Treat it like a business, not a network-growth thesis.”
Another commentator on X framed the shift as potentially permanent: the move from a narrative-driven backdrop to a transparency of earnings could reprice projects that fail to demonstrate real revenue, especially in a rising-rate environment where capital becomes more expensive for speculative assets.
Top DeFi protocols by Holders Revenue. Source: DefiLlama
DeFi is becoming backend for onchain economy
Andre Cronje, founder of Yearn.Finance, described a future where DeFi resembles essential financial infrastructure rather than a speculative playground. In his view, stablecoins have grown into a $320 billion market led by Tether and Circle, decentralized exchanges are processing over $160 billion in monthly spot volume, and perpetuals are handling roughly $540 billion in monthly volume. Lending protocols like Aave, Morpho and Maple Finance collectively support around $28 billion in active loans, while real-world assets increasingly appear as on-chain collateral. “DeFi is no longer just competing for APY. It is becoming the backend for the onchain economy,” Cronje wrote on X.
The broader context is shaping how market participants assess risk and opportunity in the sector. As traditional finance channels scrutinize on-chain revenue and the sustainability of distributed earnings, observers are watching whether more protocols will translate engagement into verifiable cash flows that can be shared with holders.
For readers seeking deeper context on DeFi’s evolving role, Cointelegraph’s coverage on related topics remains a useful resource, including discussions around recovery plans and real-world asset integration within DeFi ecosystems.
Magazine: Guide to the top and emerging global crypto hubs — Mid-2026
Notes: This article relies on data from DefiLlama for revenue distributions and is intended to reflect observed patterns in the DeFi sector. Citations include public posts and prior reporting from industry figures and outlets referenced above.
What to watch next: as more protocols publish holder distributions and audited revenue figures, investors will increasingly evaluate projects on earnings quality and sustainability rather than growth narratives. The next several quarters could reveal whether the current revenue-centric approach endures, or if broader market dynamics reintroduce balance between on-chain activity and real-world cash flows.
Digital Asset Holdings, the firm behind the Canton Network, is reportedly raising about $300 million at a roughly $2 billion valuation, according toBloomberg, which cited people familiar with the matter. The round is said to be led by a16z crypto and could close in the coming weeks, signaling continued investor appetite for enterprise-grade, privacy-forward blockchain rails designed for regulated finance.
The potential financing would come less than a year after Digital Asset disclosed a $135 million strategic round led by DRW Venture Capital and Tradeweb Markets to accelerate Canton Network adoption. The fresh capital would help scale Canton Network’s ecosystem as financial institutions explore on-chain workflows that preserve privacy and governance controls while enabling asset-tokenization use cases.
In December, Digital Asset, the Canton Network, and the Depository Trust & Clearing Corporation (DTCC) announced a collaboration to tokenize DTCC-custodied assets on Canton Network, underscoring a concrete path to moving regulated instruments onto a private, interoperable ledger.
DTCC’s latest push adds to a broader momentum around on-chain asset handling. The clearinghouse said it would pilot trading of tokenized versions of a portion of the $114 trillion in assets it custody, with activity slated to begin in July and a full-service launch planned for October, according to reports linked to the initiative.
Meanwhile, Moody’s announced in March that it had deployed its ratings data on the Canton Network, enabling financial institutions to use independent credit analysis directly within blockchain workflows. The move marked Moody’s as the first credit ratings agency to publish data on-chain for use in a financial-infrastructure context.
In April, the Japan Securities Clearing Corporation (JSCC) announced that it would test the use of on-chain government bonds on Canton Network, evaluating whether ownership of Japan’s sovereign bonds can be transferred on-chain and used as digital collateral.
Swiss crypto bank Amina disclosed custody and trading support for Canton Coin, the network’s utility token, becoming the first FINMA-regulated bank to back the token, according to an announcement from Amina.
As the Canton Network pushes deeper into regulated rails, it has drawn mixed reactions within the broader crypto community regarding its approach to decentralization and governance. Yet institutional actors—from clearinghouses to credit-rating agencies—continue to experiment with Canton as a bridge between traditional assets and on-chain processes.
Key takeaways
- Fresh funding at a $2 billion valuation signals ongoing investor confidence in Canton Network’s enterprise-use case and privacy-oriented design for regulated finance.
- The ecosystem is expanding beyond pilots to tangible tokenization workflows, with DTCC’s collaboration, Moody’s on-chain data, and JSCC’s government-bond testing illustrating a broadening operational agenda.
- Regulated adoption is advancing alongside the Canton Coin ecosystem, highlighted by Amina’s custody and trading support as a FINMA-regulated bank.
- The funding cycle comes amid persistent debates about decentralization versus controlled, permissioned rails in the traditional-finance layer of the crypto stack.
- Investors will watch how the upcoming DTCC tokenization pilots and related on-chain implementations perform in real markets and how regulators respond to tokenized assets and on-chain collateralization.
Enterprise rails in motion: what’s changing for investors and users
The reported $300 million round, if completed, would place Digital Asset in a clearer position to accelerate Canton Network’s commercial ambitions. By drawing capital into a permissioned, privacy-preserving ledger tailored for banks, asset managers, and other financial institutions, the project aims to reduce counterparty risk and operational friction traditionally associated with moving complex assets onto public blockchains. The leadership by a16z crypto—an investor with a broad portfolio in infrastructure and selective, enterprise-grade blockchain bets—underscores a continuing tilt toward assets and workflows that require regulatory-grade controls.
Meanwhile, the DTCC collaboration and its tokenization agenda are particularly noteworthy. Tokenizing DTCC-custodied assets on Canton could serve as a proving ground for how institutional-grade custody, settlement, and risk management operate when assets exist as tokenized representations on a private, auditable ledger. The announced July pilot and October full rollout set clear milestones for market participants watching for scalable, on-chain settlement and collateral frameworks.
Moody’s on-chain data integration adds a complementary dimension: credit analytics flowing into blockchain workflows could streamline risk assessment and due diligence across tokenized instruments. The once-dominant silos between credit ratings and settlement infrastructure may gradually blur as data becomes clickable within tokenized processes. The on-chain access to independent credit analysis signals a maturation of the use cases anchored in Canton’s network design.
The on-chain government-bond experiments by JSCC push further the notion that sovereign debt can function as digital collateral within a regulated, interoperable environment. If successful, such tests could influence how central-bank-like operations or cross-border collateral agreements evolve in a hybrid of traditional and digital finance.
Finally, Amina’s Canton Coin custody and trading support marks a visible step for regulated banks toward integrating native network tokens into their custody and liquidity frameworks. As the first FINMA-regulated bank to back Canton Coin, Amina’s move may serve as a reference point for other regulated banks considering similar digital-asset rails, while also inviting regulatory scrutiny and clarity about tokenization standards and custody risk.
Taken together, these developments illustrate a broader shift: institutional finance is quietly exploring controlled, auditable, and privacy-conscious blockchain networks as the backbone for on-chain asset tokenization, while investors seek clarity on governance and long-term decentralization dynamics.
As the Canton Network ecosystem pursues live deployments and scale, readers should watch how regulatory signals unfold around on-chain assets and collateral, how tokenized workflows perform in real-market conditions, and which traditional institutions partner most aggressively to harness private-ledger innovation.
Crypto World
Quantum-Proof Wallets: Crypto Firms Race to Secure Digital Assets Ahead of Protocol Upgrades

TLDR:
- Crypto firms are upgrading wallets to post-quantum MPC signatures before blockchain protocols make the same shift.
- NIST-approved algorithms like ML-DSA are being evaluated for distributed signing compatibility across wallet systems.
- Institutions with existing MPC infrastructure can migrate to quantum-resistant wallets through a simple code upgrade.
- Wallet-level upgrades alone cannot fully protect users if underlying blockchain networks do not follow with protocol changes.
Quantum-proof wallets are becoming a priority for crypto companies as the threat of quantum computing draws closer. Firms are now upgrading their wallet infrastructure faster than blockchain networks can update their core protocols.
The concern stems from estimates suggesting a “Q-Day” scenario could arrive as early as 2030. One recent report by Project Eleven warns that quantum computers could break the cryptographic foundations securing trillions in digital assets within four to seven years.
Wallet-Level Upgrades Lead the Charge
Crypto infrastructure firms are not waiting for blockchain-level changes to roll out quantum-resistant protections. Silence Laboratories recently added support for distributed multi-party computation (MPC) signatures using ML-DSA.
This is a cryptographic algorithm selected by the National Institute of Standards and Technology (NIST). The company spent six months evaluating three NIST-approved algorithms: SPHINCS+, Falcon, and CRYSTALS-Dilithium.
Not every algorithm suits every use case, however. Silence Laboratories CEO Jay Prakash addressed this directly, stating: “Not all of SPHINCS+, Falcon, and CRYSTALS-Dilithium will meet the criteria of MPC friendliness — whether they support efficient distributed transaction signing.”
He added that fragmentation across chains is also a factor, as each network is optimizing for different criteria. This complexity makes a one-size-fits-all approach difficult to achieve.
The approach used by Silence Laboratories generates private key shares across isolated nodes. A signature is then produced jointly without ever reconstructing the full key.
This method protects against quantum attacks while staying compatible with existing MPC infrastructure. Prakash noted that institutions have already embraced this model: “Whether it’s a partner like BitGo or a bank building a digital asset practice, they all understand that keys can’t sit in one place.”
Prakash confirmed that the transition would be seamless for end users. Whether using MetaMask or another wallet interface, users would not notice any change. The upgrade happens entirely at the infrastructure level.
As he explained: “Any bank or custodian with existing MPC infrastructure can now migrate to a post-quantum MPC-based wallet, without changing their infrastructure. It’s a code upgrade.”
Alternative Approaches and Remaining Gaps
Other developers are exploring protocol-adjacent solutions rather than pure wallet-level fixes. Developers behind Postquant Labs are building quantum-resistant signatures on top of Bitcoin using a separate smart contract layer.
This avoids changes to the Bitcoin base protocol entirely. StarkWare researcher Avihu Mordechai Levy has proposed replacing Bitcoin’s elliptic-curve cryptography with hash-based signatures that operate within the existing network rules.
That proposal, however, is described as a last-resort option rather than a scalable solution. It could also prove costly to implement at scale.
Meanwhile, a researcher recently cracked a 15-bit elliptic curve cryptography key using a quantum computer and a variant of Shor’s algorithm. Project Eleven awarded its 1 Bitcoin “Q-Day Prize” to the researcher for this demonstration.
Coordination between wallet providers and blockchain networks remains a key challenge. Prakash was direct about the limits of a wallet-only fix: “If wallets are upgraded to post-quantum and chains are not upgrading, it won’t work.”
The timeline pressure is pushing firms to act now, even as true quantum threats have not fully materialized. User behavior and coordination across the ecosystem remain the weakest links in the rollout.
TLDR:
- Hyperliquid channels trading fees into buybacks, linking perpetual volume directly to token demand
- Pump.fun monetizes memecoin launches, turning speculative cycles into recurring protocol revenue
- EdgeX shows a payout-revenue mismatch, raising questions over the sustainability of the distribution model
- Revenue-sharing tokens now prioritize fee generation over inflation-based incentive structures
DeFi $96.3M token holder payouts reflect a growing shift toward fee-backed distribution models across leading decentralized protocols.
Hyperliquid, EdgeX, and Pump. fun now channel real trading and launch revenue directly to users, reshaping how token economics is evaluated in 2026 markets.
Hyperliquid and Pump.Fun Drive Fee-Based Market Cycles
Hyperliquid continues to anchor the largest share of distributions through derivatives trading activity across decentralized markets. Its fee structure converts perpetual futures volume into direct token buybacks, linking usage with holder returns.
Pump.fun operates differently by monetizing memecoin launches, where each token creation contributes to platform revenue streams. Both models demonstrate how trading behavior and viral engagement now serve as direct revenue engines in crypto.
Together, they contribute a major portion of the recent market-wide distribution tracked across decentralized finance ecosystems.
Market participants’ revenue generation is at the center of valuation models across leading decentralized applications.
Liquidity depth and fee consistency now carry more weight than short-term token sentiment across trading platforms. As a result, protocols are increasingly evaluated based on how effectively they convert activity into revenue.
Hyperliquid’s dominance reflects deeper liquidity participation from perpetual traders across global markets. Pump.fun sustains relevance through continuous launch activity, even as broader memecoin cycles fluctuate sharply.
Together, these mechanisms form a fee-driven loop that supports recurring token holder distributions. Structure continues shaping how decentralized exchanges and launchpads compete for sustainable on-chain revenue.
EdgeX Distribution Gaps and the Rise of Revenue-Backed Tokens
EdgeX contributes to the overall distribution but shows a mismatch between revenue and token payouts. Reported figures indicate higher holder distributions compared to organic revenue generation from platform activity.
This gap introduces scrutiny around funding sources and the long-term sustainability of payout structures. Market observers note that such models may rely on reserves or incentive-driven liquidity programs. Despite this, EdgeX remains part of the broader trend toward fee-linked token economics.
Protocols across decentralized finance increasingly adopt buyback mechanisms tied to trading or launch activity. This structure reduces reliance on inflation-based rewards and shifts focus toward measurable cash flows.
Investors now compare revenue coverage ratios when evaluating token models across competing ecosystems. Buybacks funded through fees are increasingly treated as a benchmark for protocol maturity.
However, volatility in trading cycles means revenue-linked payouts remain sensitive to market conditions. The combined $96.3M distribution demonstrates how far token economics has shifted in recent cycles.
Across protocols, fee generation now competes directly with traditional valuation narratives in crypto markets. This environment places a stronger emphasis on real transaction activity rather than speculative token growth stories
EdgeX remains under observation as analysts evaluate its ability to sustain payouts without external support. Revenue-backed models continue to reshape expectations across decentralized trading infrastructure.
TLDR:
- UNI has broken above long-term weekly descending resistance after months of bearish market pressure.
- Weekly RSI breakout signals improving momentum structure and possible bearish exhaustion for UNI.
- A bullish crossover on the Stochastic RSI supports the case for sustained upside continuation on higher timeframes.
- The $3.90 level remains the decisive reclaim zone needed to confirm UNI’s broader trend reversal.
Uniswap price analysis shows UNI approaching a critical market structure test after breaking long-standing weekly resistance.
Momentum indicators are improving, and traders are now focusing on whether the price can reclaim $3.90 to validate a broader bullish trend reversal.
Uniswap Breakout Strengthens Weekly Technical Setup
UNI has finally broken above a descending resistance trendline that controlled price action for months. This breakout marks an important technical shift after a prolonged sequence of lower highs limited bullish momentum across the broader market cycle.
For most of the recent downtrend, sellers defended every recovery attempt near trendline resistance. Price repeatedly failed to establish sustained upside, which kept UNI trapped inside a weakening market structure. However, the latest breakout changes that narrative significantly.
The move above the diagonal resistance suggests bearish control is starting to weaken. On higher timeframes, these breakouts often signal the early stages of structural recovery. Still, diagonal breakouts alone rarely confirm full reversals in crypto markets.
What adds strength to this setup is the supporting momentum breakout beneath price action. UNI’s weekly RSI has also moved above its descending resistance line after months of rejection. Since momentum often leads price during macro reversals, this breakout increases the probability of continuation.
At the same time, stochastic RSI is forming a fresh bullish crossover from oversold territory. On weekly charts, these signals usually support multi-week upside expansion instead of short-lived recovery rallies.
This alignment between price and momentum creates a stronger technical foundation than isolated breakout attempts seen earlier this cycle.
Uniswap Price Analysis Focuses on $3.90 Reclaim
Despite the breakout, UNI is challenging the $3.90 horizontal resistance zone, which previously acted as a major support level before the breakdown.
In technical analysis, former support often turns into resistance after market breakdowns. This usually happens when trapped holders use recovery rallies to reduce exposure near previous entry zones.
That behavior appears visible around the current reclaim area. While UNI has pushed above trendline resistance, price has not yet secured a decisive weekly close above $3.90.
This distinction matters because trend reversals require more than a breakout. Price must reclaim lost market structure and convert resistance back into support to validate stronger continuation.
Meanwhile, UNI’s market capitalization is reinforcing the improving outlook. Over the past week, market cap climbed from roughly $2.05 billion toward the $2.5 billion region, reflecting sustained capital inflows.
More importantly, the expansion has been orderly rather than speculative. UNI continues printing higher highs and higher lows while maintaining elevated levels after each breakout attempt.
If the price closes above $3.90 and holds that level, the bullish case strengthens considerably. Until then, Uniswap price analysis suggests UNI remains in a transition phase between recovery and confirmed macro reversal.
TLDR:
- $PENGU is backed by a brand generating roughly one billion social media views daily across global platforms.
- Pudgy Penguins holds retail placement in over 10,000 stores, including Walmart, Target, and GameStop worldwide.
- $PENGU became only the second memecoin after DOGE to enter the SEC’s formal 19b-4 ETF filing process.
- Asia expansion into Japan, Korea, and China positions $PENGU inside a proven global IP-scaling cultural system.
$PENGU, the token tied to the Pudgy Penguins brand, is drawing comparisons to Dogecoin across crypto circles. Built on years of consumer brand development, $PENGU combines cultural reach with real-world retail presence.
Unlike most memecoins, it operates through a structured distribution engine. Analysts point to its institutional backing, Asia expansion, and mainstream recognition as key differentiators. The question now is whether the market has fully priced in what the brand has already built.
From Meme to Social Currency: How $PENGU Differs From Past Tokens
Most memecoins follow a predictable cycle — launch, narrative, peak, and fade. Once attention shifts, the token loses relevance because nothing sustains it. $PENGU is structured differently, with continuous content, retail, and partnerships driving ongoing momentum.
The Pudgy Penguins brand currently generates roughly one billion views per day across social and GIF platforms. It holds over five million followers and has retail placement in more than 10,000 stores globally. Those stores include Walmart, Target, Walgreens, and GameStop.
Dogecoin captured global attention through organic internet culture. However, it never built a structured system to sustain or expand that attention. $PENGU is designed to do exactly that, through coordinated brand activity across multiple channels.
Retail Presence and Institutional Backing Drive Mainstream Credibility
Pudgy Penguins rang the NASDAQ opening bell alongside VanEck, marking a rare milestone for a crypto-native brand.
Firms like Bitwise and Canary Capital have publicly aligned with the ecosystem. The brand also appeared in Ethereum ETF commercials, reaching traditional finance audiences directly.
$PENGU became only the second memecoin-style asset after DOGE to enter the SEC’s formal 19b-4 ETF filing process.
That regulatory recognition carries weight in institutional circles. It separates $PENGU from the vast majority of tokens that never reach that stage.
Beyond finance, the brand has expanded into politics and media. Congressman William Timmons publicly engaged with Pudgy Penguins, and outlets like the New York Times and Forbes have covered the brand. Partnerships with Manchester City, NASCAR, PEZ, and Sotheby’s further extend its mainstream reach.
Asia Expansion Opens a New Growth Chapter for $PENGU
Pudgy Penguins is actively entering the Japanese collectibles market, valued at $15.4 billion. Distribution agreements with Don Quijote, 7-Eleven, and FamilyMart place the brand inside high-traffic retail environments. This move targets a market that already understands how to scale character-based IP globally.
In Korea, a partnership with Lotte strengthens retail distribution across one of Asia’s most brand-conscious markets. In China, Suplay provides a similar foothold. These agreements reflect a deliberate strategy, not casual expansion.
Cultural trends in Asia frequently move westward, compounding global brand recognition over time. If Pudgy Penguins gains traction across these markets, the effect on $PENGU’s visibility and adoption could grow steadily. The brand is aligning itself with a proven cultural system that scales.
The gap between DOGE and $PENGU in market valuation still exists, but the trajectory tells a different story. DOGE built cultural relevance without a structured engine behind it.
$PENGU has retail, institutions, content, and global expansion working together. Markets price future adoption, and $PENGU is building the infrastructure for exactly that.
TLDR:
- Jensen Huang says AI will make intelligence a commodity accessible to billions worldwide for the first time.
- NVIDIA chips power data centers at Amazon, Microsoft, Google, and Meta, driving the global AI buildout.
- Huang argues AI automates tasks but elevates human purpose, pushing back against job displacement fears.
- The NVIDIA CEO urges scientists, engineers, and policymakers to advance AI capabilities and safety together.
NVIDIA chief executive Jensen Huang addressed graduates at Carnegie Mellon University on Sunday, May 10. He received an honorary doctorate at the commencement ceremony.
Huang said artificial intelligence will make intelligence a commodity for everyone. He argued the technology will reach billions who have never accessed computing power before. His remarks touched on jobs, safety, and America’s industrial future.
AI as a Tool for Closing the Technology Divide
Huang told graduates that AI represents a historic opportunity to reach underserved populations. He stated, “We have the opportunity to close the technology divide—and bring the power of computing and intelligence to billions of people for the very first time.”
He named carpenters and shopkeepers as people who would benefit from this shift. These are groups that have traditionally been left outside the technology economy.
He framed the current AI buildout as America’s reindustrialization moment. According to Huang, building chip factories and data centers requires plumbers and ironworkers, not just engineers.
NVIDIA’s chips currently power data centers run by Amazon, Microsoft, Google, and Meta. This positions the company at the center of the global AI supply chain.
Huang pushed back against the view that AI will displace human workers. He drew a clear line between tasks and purpose in his argument.
A radiologist, he explained, does more than read scans — they care for patients. AI handles the repetitive task, while the human focus shifts to higher-level care.
He closed this section with a broader historical point. “Every major technological revolution in history created fear alongside opportunity,” he told the graduating class.
When society engages technology openly and responsibly, human potential expands, he added. He urged graduates to approach AI with optimism rather than resistance.
Safety and Innovation Must Advance Together
Huang called on scientists, engineers, and policymakers to develop AI capabilities and safety in parallel. He warned that guardrails must keep pace with the technology’s rapid growth.
Addressing this directly, he said society must engage technology “openly, responsibly, and optimistically” to expand human potential. His remarks added a measured voice to the ongoing global debate on AI regulation.
He honored Carnegie Mellon’s long history in AI research during the address. The university’s Logic Theorist program from the 1950s was among the examples he cited.
He also referenced its Robotics Institute, founded in 1979, calling both pillars of American technological leadership. Huang described these contributions as a foundation the current generation must build upon.
He challenged graduates to treat AI as an inclusive tool, not one reserved for the elite. The moment, he said, is a mandate to build.
That charge was directed at everyone in the room — scientists, engineers, and policymakers alike. The message was clear: progress requires active participation, not observation.
TLDR:
- Strategy’s software revenue grew 12% in Q1 2026, marking its strongest financial quarter in ten years.
- Cloud revenue surged 59% year-over-year, with controllable margin expanding 27% to fund Bitcoin operations.
- Strategy launched Mosaic, an AI data foundation integrating LLMs, hyperscalers, and data warehouses in one platform.
- CEO Phong Le says Bitcoin and software create unique synergies, energizing staff and winning over skeptical customers.
Strategy’s software division recorded its best financial quarter in ten years during Q1 2026, according to CEO Phong Le. Revenue grew 12% year-over-year, driven by 59% growth in cloud revenue.
Controllable margin expanded 27%, helping offset Bitcoin operating expenses. Le outlined how the enterprise software business and Bitcoin treasury strategy create mutual benefits for the company. The update offers a rare inside look at Strategy’s dual business model.
Software Business Drives Financial Growth for Strategy
Strategy has been operating since 1989 and went public in 1998. Today, it employs 1,500 people across nearly every major city worldwide.
The company operates in over 25 countries and maintains partnerships with Amazon, Google, Microsoft, Snowflake, and HCL.
Le took to X to share the milestone, writing, “Q1 2026 was the strongest financial quarter in the last decade for our software business.”
He added that revenue growth was fueled by a 59% rise in cloud revenue. The company serves over 3,000 customers and more than 500,000 active users globally.
Strategy holds SOC 2 Type 2, ISO 27001, and FedRAMP certifications. It also complies with PCI DSS, HIPAA, DPF, and GDPR standards. These credentials directly strengthen the company’s credibility as a Bitcoin treasury operator.
Over 100,000 employees, partners, and customers have built careers around Strategy Software. Many have gone on to found startups and lead public companies near its Tysons Corner headquarters. Le noted, “No company in the digital asset ecosystem has this depth of institutional experience.”
AI Investment and Bitcoin Synergies Shape Strategy’s Future
Le addressed a common question about Strategy’s dual business model on X. He wrote, “I’m sometimes asked why a Bitcoin Treasury Company should also operate a software business.” His answer was direct: “The two create powerful and unique synergies.”
Strategy recently launched an AI data foundation called “Mosaic.” It integrates large language models, hyperscalers, and data warehouses into one trusted platform. The system uses AI agents to serve enterprise data needs through a simple semantic layer.
The company is also rebuilding many internal workflows using multiple AI models. Le stated, “Over the next year, I expect we will automate many core workflows and replace much of our internal enterprise software.” He added that systems will become “increasingly autonomous, adaptive, self-healing, and self-improving.”
On the human side, Le noted that Bitcoin has energized the workforce and attracted strong talent. He wrote, “Our customers have evolved from skeptical to curious to supportive.” The software business and Bitcoin treasury continue to reinforce each other’s growth, according to Le.
TLDR:
- XRP’s Taker Buy/Sell Ratio is nearing 1.0, showing a gradual shift from seller control to market balance.
- XRP has held the $1.35–$1.45 range despite weak momentum, signaling that buyers are absorbing sell orders.
- Taker buy and sell volumes have dropped sharply from January highs, pointing to a possible accumulation phase.
- A sustained ratio above 1.0 with rising buy volume could push XRP toward the $1.50–$1.60 resistance zone.
XRP price action has remained range-bound in recent weeks, but underlying market data tells a different story. The Taker Buy/Sell Ratio is now hovering near the 1.0 level, showing a gradual shift from seller dominance to a more balanced market.
Meanwhile, overall trading volume has dropped sharply from earlier highs. These combined signals are pointing toward a possible upside move rather than a continued decline.
Buyer and Seller Activity Points to Market Balance
The Taker Buy/Sell Ratio is one of the more reliable indicators for reading short-term market sentiment. When the ratio sits below 1.0 consistently, prices tend to fall under sustained pressure.
However, XRP has managed to hold the $1.35–$1.45 range despite the ratio staying close to neutral for an extended period.
This holding pattern shows that buyers are still absorbing available sell orders in the market. The price has not broken down sharply, which would be expected if sellers were clearly in control. That alone suggests some degree of underlying demand at current levels.
CryptoQuant analyst PelinayPA noted that the recovery in the ratio while price stays stable is worth watching.
The analyst pointed out that fading sell pressure and stable price action often appear during accumulation phases before a larger market move.
As things stand, the current structure does not point toward panic. Neither aggressive selling nor strong buying momentum is present right now. That balance is consistent with a market that is pausing before its next directional move.
Lower Volume and Stable Price Raise Breakout Probability
Both taker buy volume and taker sell volume have dropped significantly compared to January and February levels. The large sell spikes seen in those months are no longer present in current data. This shift shows that seller strength has weakened, even if buyer conviction has not fully returned.
Lower volume during a sideways price trend is a pattern often associated with accumulation. It suggests that large market participants may be quietly building positions without triggering major price swings. The absence of a breakdown despite weaker volume adds to this reading.
PelinayPA stated that whales appear to be stabilizing the market while energy builds ahead of a larger move. The analyst added that if the ratio stays above 1.0 for several consecutive days, a move toward the $1.50–$1.60 range becomes more likely.
Still, no strong buying momentum has entered the market yet. A confirmed upside move would require rising buy volume alongside a sustained ratio above 1.0.
Until those conditions are met, XRP remains in a sideways-to-slightly-bullish posture rather than a confirmed breakout phase.
TLDR:
- HBAR is trading between $0.094 and $0.0955, posting weekly gains of around 8% in May 2026.
- The Canary HBAR ETF recorded roughly $2.5M in fresh inflows as of May 8, ending weeks of stagnation.
- FedEx joined Hedera’s Governing Council post-HederaCon 2026, alongside McLaren and insurance sector partners.
- Analysts are targeting $0.12 and above for HBAR if price sustains a breakout beyond the $0.10 resistance level.
Hedera’s HBAR token is showing renewed strength in May 2026. The asset is trading between $0.094 and $0.0955, posting gains of roughly 2.9% to 3.1% over the past 24 hours.
Weekly performance also stands at approximately 8%, placing it among the better-performing assets in the current cycle. The $0.10 psychological resistance level remains the key price point traders are watching closely.
ETF Inflows and Institutional Positioning Signal Returning Confidence
Institutional interest in HBAR appears to be making a quiet comeback. The Canary HBAR ETF recorded approximately $2.5 million in fresh inflows as of May 8. This came after several weeks of stagnant activity, making it a notable shift in sentiment.
Grayscale has also maintained its position in the asset. The firm continues to hold a 7.41% HBAR allocation within its Smart Contract Platform Fund. That allocation has remained stable, showing consistent institutional conviction in the network’s long-term role.
Crypto analyst account Cryptofic noted on X that “fundamentals (enterprise council, real usage, ETF flows) are bullish and decoupling from broader market noise, but price action lags.” The observation points to a growing gap between on-chain activity and market price movement.
Price is currently testing a resistance zone that has not been sustained since earlier this year. A confirmed break above $0.10 could open the door toward analyst targets near $0.12 and beyond.
HederaCon 2026 Momentum Continues With Major Enterprise Additions
HederaCon 2026 took place in Miami in early May and left a noticeable trail of announcements. FedEx has since joined the Hedera Governing Council, expanding the network’s enterprise footprint further. The event also drew White House crypto policy representation, reflecting growing regulatory attention.
Beyond logistics, the insurance sector has begun integrating Hedera for property data management. McLaren’s involvement was also confirmed, adding another high-profile name to the council’s growing roster. These partnerships point to a network increasingly embedded in real-world industries.
On the financial infrastructure side, organizations such as DTCC and Euroclear have been linked to Hedera’s stablecoin, RWA, and tokenization efforts.
HashSphere, the network’s private ledger offering, also reached general availability. Cross-ledger protocol development adds another layer to the ecosystem’s growing infrastructure.
Hedera’s transaction volumes and fee metrics continue to trend positively. Combined with commodity classification discussions at the regulatory level, the network is positioning itself for longer-term institutional adoption.
The convergence of enterprise use, ETF activity, and regulatory clarity makes HBAR one of the more closely watched assets in the current market environment.

Marcus Rashford gets what he wants from Barcelona transfer as Man United handed ideal scenario

Which Fitbit should you buy?

The Big Nintendo ’25/’26 Fiscal Year Financial Report Video
Manchester United reach agreement with Casemiro over contract clause amid transfer speculation

US brings back mandatory military draft registration

Steven Gerrard disagrees with Gary Neville over ‘shock’ Chelsea and Arsenal claim | Football


-
 Crypto World3 days ago
HarrisX Poll Found 52% of Registered Voters Support the CLARITY Act
-

 Crypto World4 days ago
Upbit adds B3 Korean won pair as Base token gains Korea access
-

 Fashion2 days ago
Weekend Open Thread: Marianne Dress
-

 Tech6 days ago
Image AI models now drive app growth, beating chatbot upgrades
-
 NewsBeat4 days ago
NCP car park operator enters administration putting 340 UK sites at risk of closure
-
 Business2 days ago
Ignore market noise, India’s long-term story intact, say D-Street bulls Ramesh Damani and Sunil Singhania
-

 Politics2 days ago
Politics Home Article | Starmer Enters The Danger Zone
-

 Entertainment7 days ago
Olivia Wilde Reacts To Viral ‘Corpse’ Comparison
-

 Sports7 days ago
Inter Milan Win Serie A Title After Victory Over Parma
-
 Sports7 days ago
2026 NHL playoff picks: Second-round predictions, series odds, Stanley Cup bracket
-

 Crypto World6 days ago
UAE Free Zone Deploys Blockchain IDs to Verify Registered Firms
-
 Sports7 days ago
Every word of Arne Slot’s heated rant after Manchester United win vs Liverpool
-

 Crypto World4 days ago
BlackRock CEO Larry Fink Discusses a New Asset Class
-

 Crypto World4 days ago
Robinhood says Wall Street is building onchain
-

 Sports7 days ago
Manchester United Return To Champions League After Dramatic Win Over Liverpool
-

 Entertainment7 days ago
Kylie Jenner and Timothee Chalamet Hold Hands in NYC Outing
-
Entertainment6 days ago
Serena Williams hits Met Gala in metallic dress after GLP-1 reveal
-

 Fashion4 days ago
The Best Work Pants for Women in 2026
-
 Entertainment7 days ago
HBO’s Forgotten 3-Part Detective Series Has Quietly Become One of TV’s Funniest Crime Shows
-

 Tech7 days ago
The best life advice I ever followed was deleting Instagram, and it soothed my frustrated soul
You must be logged in to post a comment Login