Crypto World
WTI Crude Reaches February High

As the XTI/USD chart shows, the price of a barrel has today moved above the highs of 4 and 11 February, rising beyond the $66 level and marking its highest point since the start of the month. Bullish sentiment is being driven by escalating geopolitical tensions, primarily linked to Iran. According to media reports:
→ Negotiations between the parties remain inconclusive. Although Tehran stated that a “general agreement” had been reached with Washington on the framework of a potential nuclear deal, US Vice-President JD Vance indicated that Iran had failed to meet US demands.
→ President Donald Trump, in turn, maintains that the use of military force remains an option.
This raises the prospect of Iran attempting to block the Strait of Hormuz — a key route for global oil and gas shipments. Any US military action could evolve into a prolonged campaign, unlike the short-lived operation in Venezuela.
Heightened geopolitical risk is therefore pushing oil prices towards fresh yearly highs.
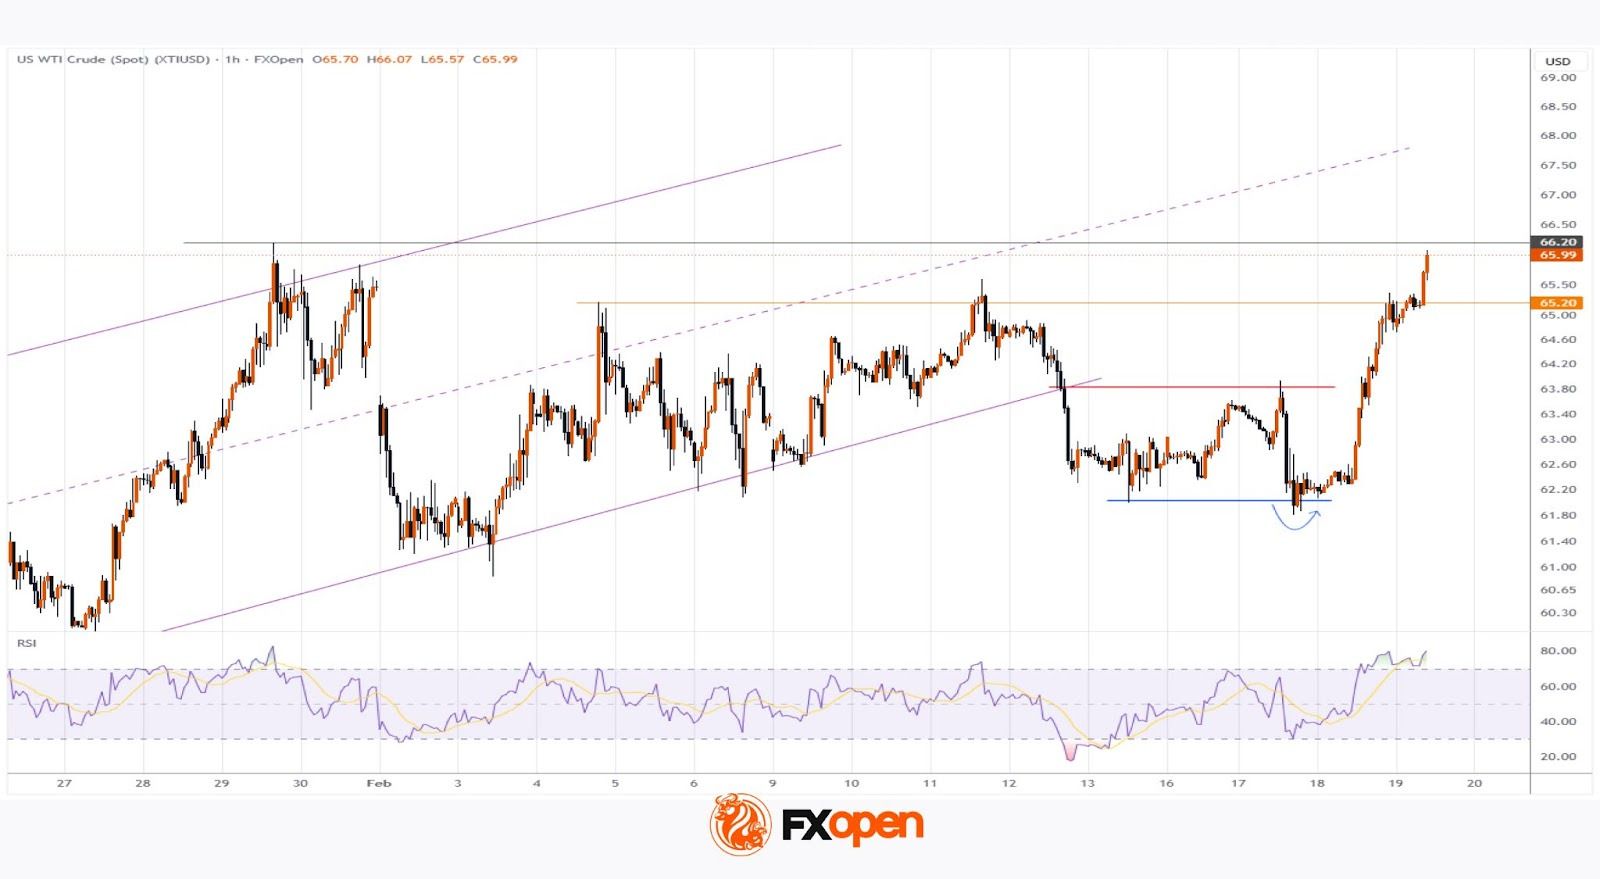

Technical Analysis of the XTI/USD Chart
When analysing the oil price chart on 12 February, we:
→ used WTI price swings to construct a broad ascending channel (shown in purple);
→ identified patterns suggesting that initiative was shifting to the bears.
Since then, oil prices not only retreated to the lower boundary of the channel but also broke below it on the same day. The breakout level later acted as local resistance on 17 February.
Subsequently, a false bearish breakout (indicated by the arrow) signalled that selling pressure had been exhausted. Bulls then capitalised on the tense news backdrop to push prices higher.
It is possible that the 65.20 level will now act as support, with scope for a fresh yearly high in the near term. Should signs of military action emerge, traders should be prepared for a scenario in which WTI prices move well above $66.20.
Start trading commodity CFDs with tight spreads (additional fees may apply). Open your trading account now or learn more about trading commodity CFDs with FXOpen.
This article represents the opinion of the Companies operating under the FXOpen brand only. It is not to be construed as an offer, solicitation, or recommendation with respect to products and services provided by the Companies operating under the FXOpen brand, nor is it to be considered financial advice.