
Crypto World
WTI Oil Prices Volatile Ahead of Potential Talks

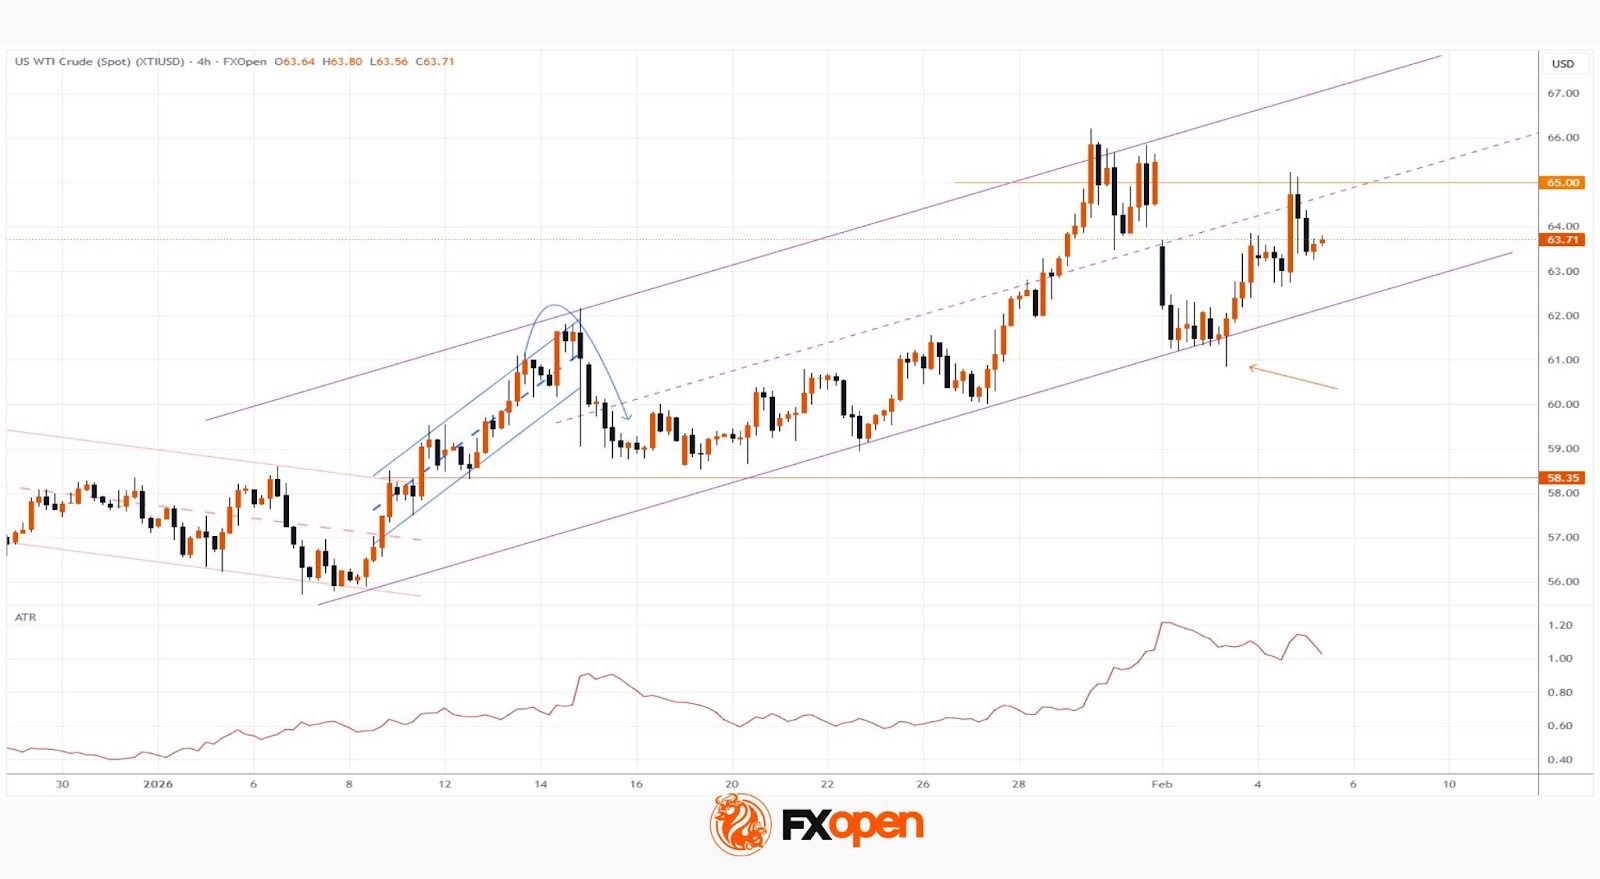
As the XTI/USD chart shows, the price of a barrel rose above $65 yesterday, reacting to the risk of talks between Iran and the United States on the nuclear deal breaking down. These negotiations could begin on Friday.
According to Axios, Arab world leaders have urged Donald Trump not to follow through on his threats to withdraw from the talks and shift towards military action after demands put forward by Iran. This news prompted a pullback in prices below $64.
The news backdrop is further complicated by conflicting reports regarding India’s refusal to purchase Russian oil, alongside other global factors. All of this is contributing to heightened volatility in the oil market, a trend also confirmed by the ATR indicator.
Technical Analysis of XTI/USD
On 14 January, we:
→ analysed swings in WTI crude prices to identify a breakout from a descending channel (shown in red) and outline an upward trajectory (shown in blue);
→ noted that the breakout level (around $58.35) was acting as support;
→ suggested that the market was vulnerable to a corrective move.
Indeed, on the same day (as indicated by the blue arrow), the price formed a bearish impulse towards this support, where the market found some balance.
However, geopolitical developments since the second half of January have supported higher prices, providing grounds to draw a broad ascending channel (shown in purple). In this context:
→ its lower boundary is acting as support, with the long lower wick on the 3 February candle confirming aggressive buying interest;
→ the $65 level appears to be a key resistance. Broad price swings formed there on 29–30 January — a sign of “smart money” activity — after which prices declined. Yesterday, the market again reversed sharply from this level.
It is therefore reasonable to assume that this resistance will pose a significant hurdle for bulls if they attempt to keep prices within the ascending purple channel. At the same time, the further direction of WTI oil price movements will most likely be determined by developments surrounding Friday’s Iran–US nuclear talks in Oman.
Start trading commodity CFDs with tight spreads (additional fees may apply). Open your trading account now or learn more about trading commodity CFDs with FXOpen.
This article represents the opinion of the Companies operating under the FXOpen brand only. It is not to be construed as an offer, solicitation, or recommendation with respect to products and services provided by the Companies operating under the FXOpen brand, nor is it to be considered financial advice.

What appeared to be a down day in crypto markets has turned positive after Israeli Prime Minister Benjamin Netanyahu said he told his cabinet to start negotiations with Lebanon as soon as possible. This came after NBC News reported that President Trump had requested Netanyahu scale back bombing in Lebanon as it threatened Monday’s announced ceasefire.
Bitcoin quickly rose about 3% as the news hit, now trading at $72,300, up 2% over the past 24 hours. U.S. stocks also reversed modest early losses, with the Nasdaq now ahead 0.65%. Having surged to nearly $103 per barrel earlier in the day, WTI crude oil quickly pulled back to $98.60.
Bitcoin is notably outperforming other crypto majors, with ether (ETH), solana (SOL) and XRP (XRP) all higher by less than 1%.
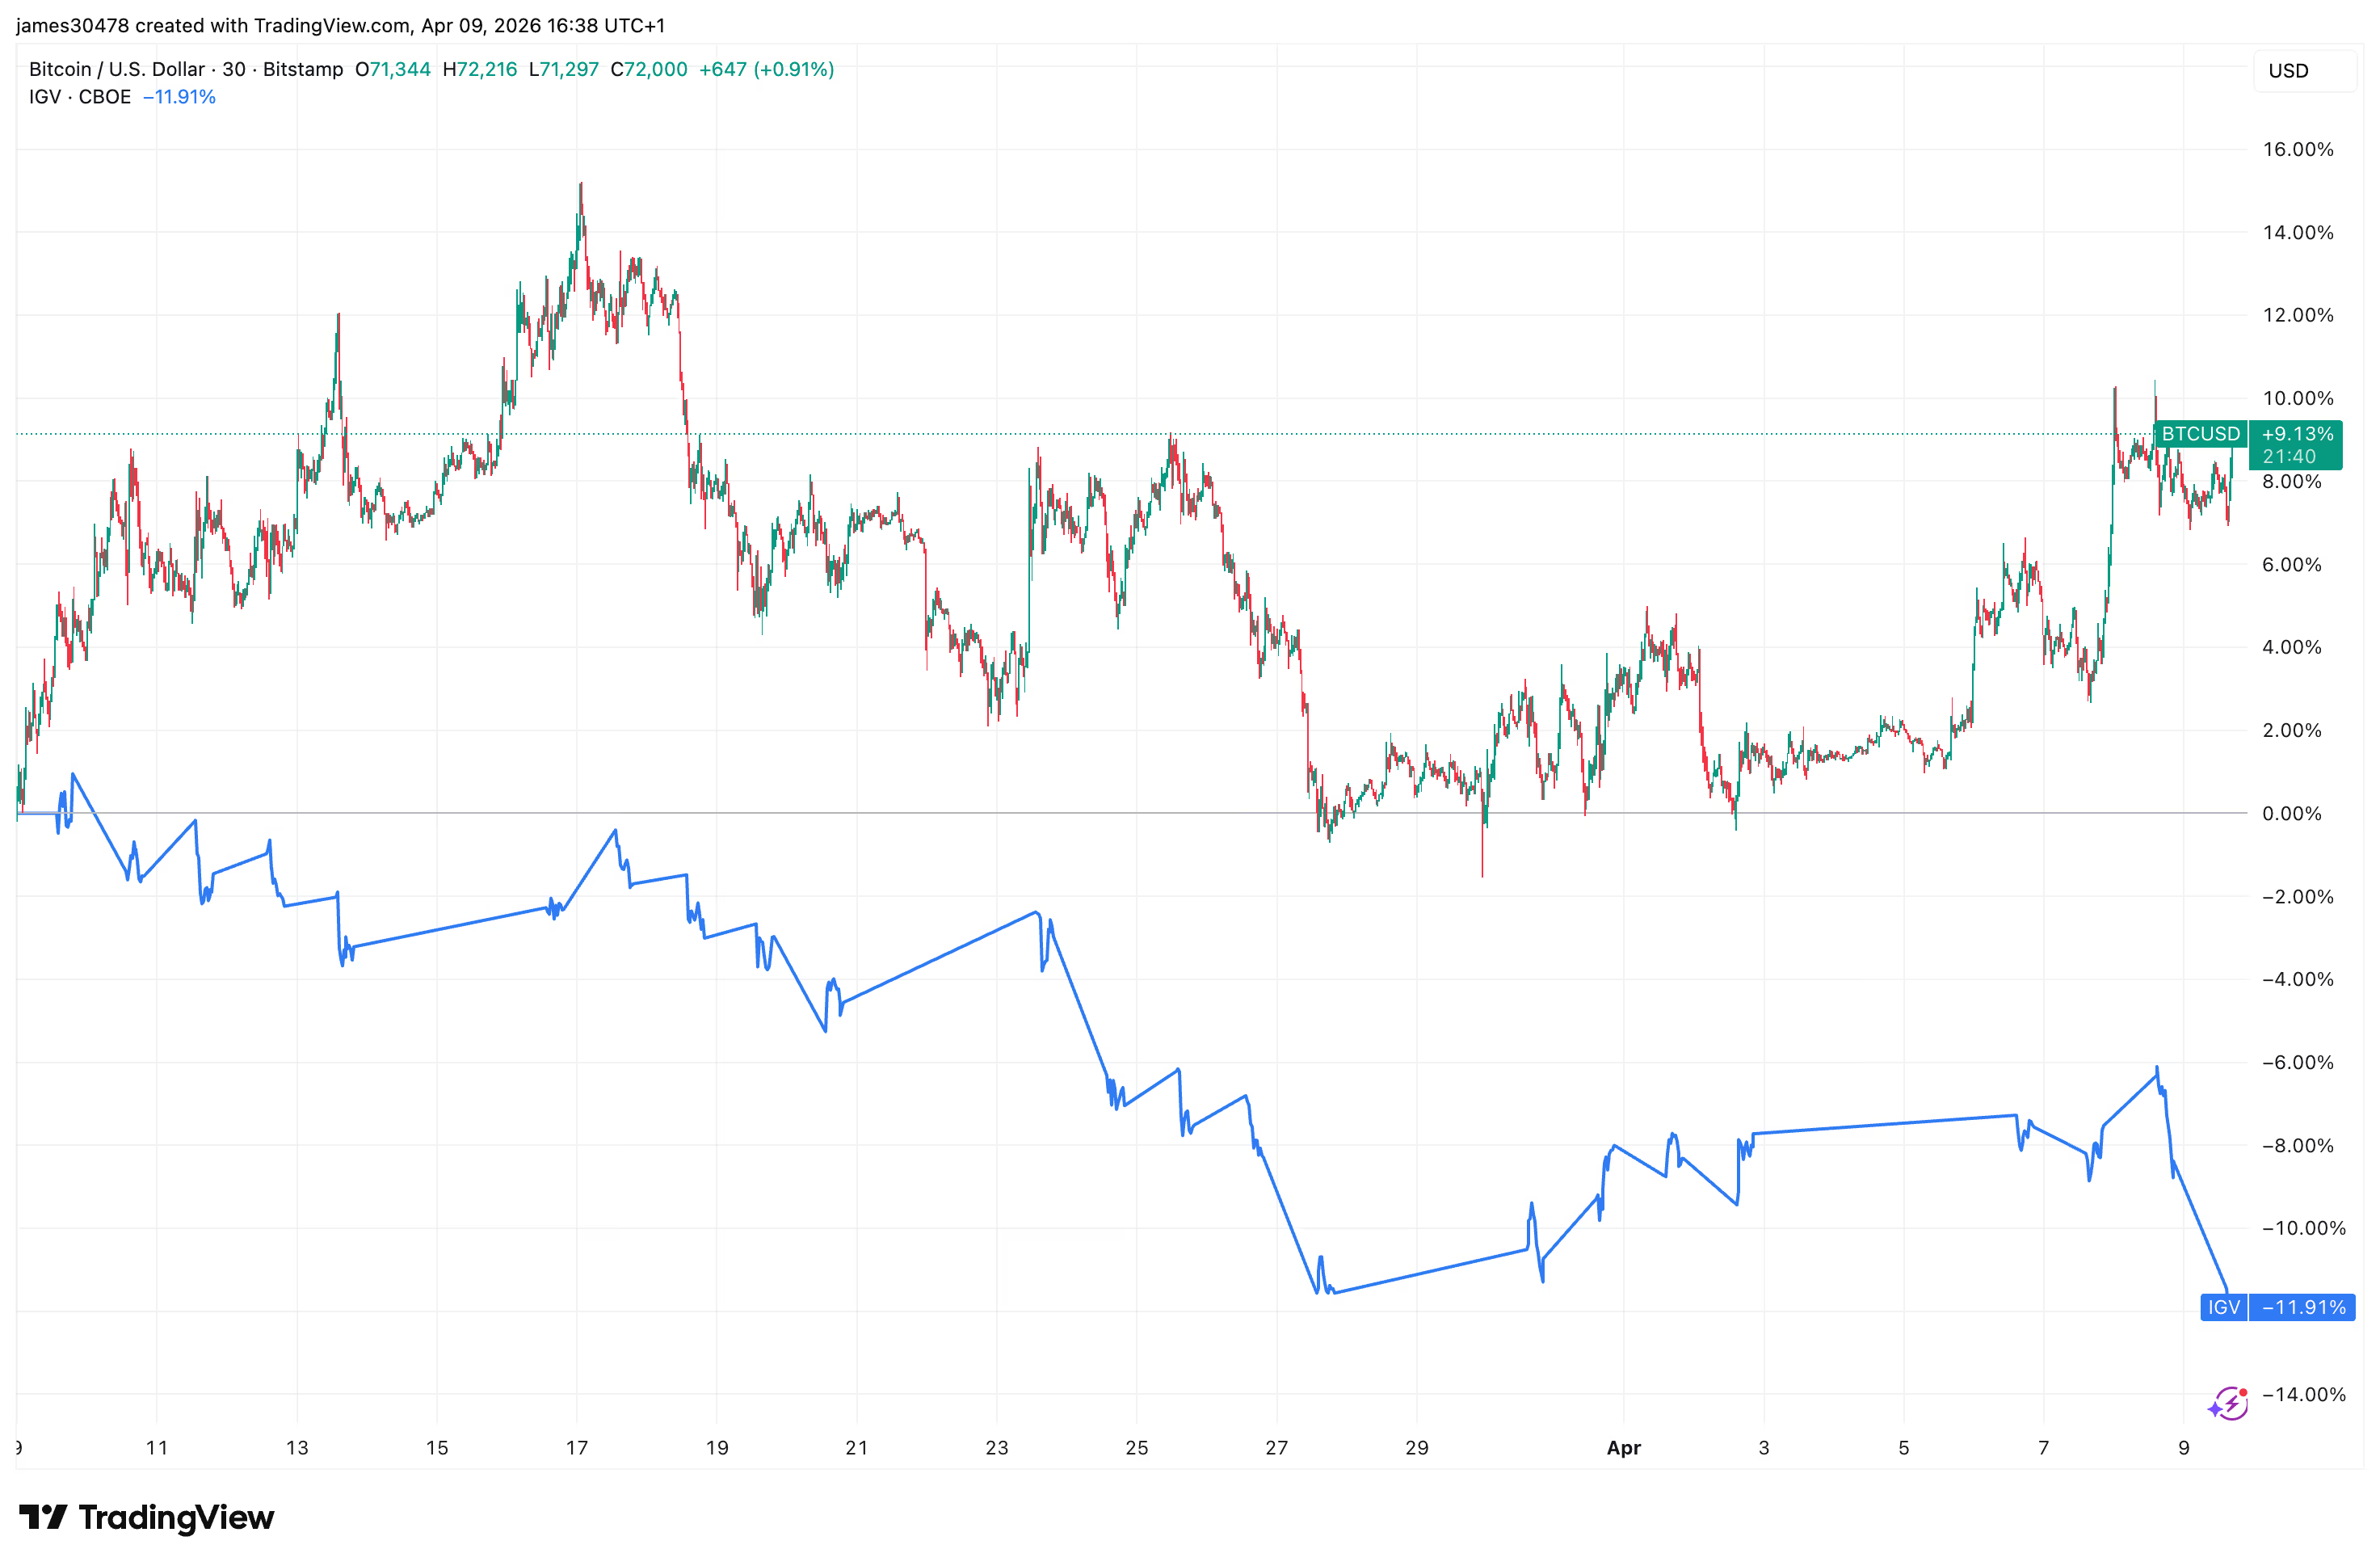
Continued divergence with software stocks
Firmly linked at the hip in recent months, bitcoin and software stocks continued to diverge on Thursday. The iShares Expanded Tech-Software ETF (IGV) fell 4%, approaching a key support level around $76, a level it has tested and rebounded from multiple times.
Over the past month, bitcoin is up 9%, while IGV is down 12%.
On a 20-day moving average basis, the correlation coefficient between Bitcoin and IGV has dropped to a relatively low 0.34, reinforcing the recent divergence in their price movements.

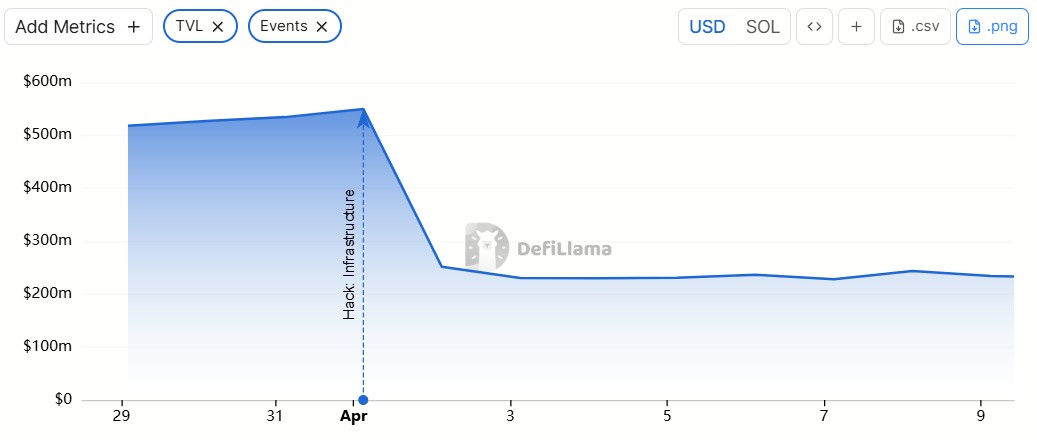
This month’s $285 million exploit on Drift, a decentralized exchange (DEX), was the largest crypto hack in over a year, when exchange Bybit lost $1.4 billion. North Korean state-backed hackers were named as prime suspects in both attacks.
This past autumn, attackers posed as a quantitative trading firm and approached Drift’s protocol team in person at a major crypto conference, said Drift in an X post Sunday.
“It is now understood that this appears to be a targeted approach, where individuals from this group continued to deliberately seek out and engage specific Drift contributors, in person, at multiple major industry conferences in multiple countries over the following six months,” said the DEX.
Until now, North Korean cyber spies have targeted crypto firms online, through virtual calls and remote work. An in-person approach at a conference would not typically raise suspicion, but the Drift exploit should be enough for attendees to review connections made at recent events.

North Korea expands crypto playbook beyond hacks
Blockchain forensics firm TRM Labs described the incident as the largest DeFi hack of 2026 (so far) and the second-largest exploit in Solana’s history, just behind the $326 million Wormhole bridge hack in 2022.
The initial contact dates back about six months, but the exploit itself traces to mid-March, according to TRM. The attacker began by moving funds from Tornado Cash and deploying the CarbonVote Token (CVT), while using social engineering to persuade multisig signers to approve transactions that granted elevated permissions.
They then manufactured credibility for CVT by minting a large supply and inflating trading activity to simulate real demand. Drift’s oracles picked up the signal and treated the token as a legitimate asset.
When the pre-approved transactions were executed on April 1, CVT was accepted as collateral, withdrawal limits were increased and funds were withdrawn in real assets, including USDC.

Related: North Korean spy slips up, reveals ties in fake job interview
According to TRM, the speed and aggressiveness of the subsequent laundering exceeded that seen in the Bybit hack.
North Korea is widely believed to be using large-scale crypto thefts such as the Drift and Bybit attacks alongside longer-term tactics, including placing operatives in remote roles at tech and crypto firms to generate steady income. The United Nations Security Council has said such funds are used to support the country’s weapons program.
Security researcher Taylor Monahan said infiltration of DeFi protocols dates back to “DeFi summer,” adding that around 40 protocols have had contact with suspected DPRK operatives.
North Korean state media reported Thursday that the country tested an electromagnetic weapon and a short-range ballistic missile, known as the Hwasong-11, fitted with cluster munition warheads.

Infiltration network fuels steady crypto revenue
A separate investigation revealed how a network of North Korea-linked IT workers generated millions through prolonged infiltration.
Data obtained from an anonymous source shared by ZachXBT showed the network posing as developers and embedding themselves across crypto and tech firms, generating roughly $1 million a month and more than $3.5 million since November.
The group secured jobs using falsified identities, routed payments through a shared system, then converted funds to fiat and sent them to Chinese bank accounts via platforms such as Payoneer.

Related: Are you a freelancer? North Korean spies may be using you
The operation relied on basic infrastructure, including a shared website with a common password and internal leaderboards tracking earnings.
The agents applied for roles in plain sight using VPNs and fabricated documents, pointing to a longer-term strategy of embedding operatives to extract steady revenue.
Defenses evolve as infiltration tactics spread
Cointelegraph encountered a similar scheme in a 2025 investigation led by Heiner García, who spent months in contact with a suspected operative.
Cointelegraph later took part in García’s dummy interview with a suspect who went by “Motoki,” who claimed to be Japanese. The suspect rage quit the call after failing to introduce himself in his supposed native dialect.
The investigation found operatives bypassed geographic restrictions by using remote access to devices physically located in countries such as the US. Instead of VPNs, they operated those machines directly, making their activity appear local.
By now, tech headhunters have realized that the person at the other end of a virtual job interview may indeed be a North Korean cyber spy. A viral defence strategy is to ask suspects to insult Kim Jong Un. So far, the tactic has been effective.

However, as Drift was approached in person and García’s findings showed operatives finding creative methods to bypass geographic restrictions, North Korean actors have continued to adapt to the cat-and-mouse dynamic.
Requesting interviewees to call North Korea’s supreme leader a “fat pig” is an effective strategy for the time being, but security researchers warn that this won’t work forever.
Magazine: Phantom Bitcoin checks, China tracks tax on blockchain: Asia Express

Key Highlights
- Shares of Zscaler (ZS) declined approximately 8% on April 9, 2026, reaching a 52-week low of $127.88
- BTIG analyst downgraded the stock from Buy to Neutral, removing it from the firm’s preferred picks
- Research involving five industry sources highlighted intensifying competitive threats from Cloudflare and Netskope
- The stock has tumbled 39% since the start of the year and 56% over the previous half-year period
- BTIG lowered its fiscal 2027 ARR projection to $4.355B, trailing Street expectations of $4.447B
Shares of Zscaler experienced a significant decline of approximately 8% during Wednesday’s trading session on April 9, sliding to a 52-week low of $127.88. The sharp downturn followed a rating cut by BTIG analyst Gray Powell, who moved the stock from Buy to Neutral and eliminated it from the firm’s top picks roster for the first half of 2026.
Powell’s rating adjustment stemmed from proprietary research conducted with five industry sources throughout the previous week. Although near-term business trends appeared relatively steady, the outlook for the coming six to twelve months revealed more cautious sentiment among the majority of contacts surveyed.
The analyst highlighted escalating competitive dynamics as the primary concern. Cloudflare and Netskope emerged as the most significant competitive challenges. Additionally, traditional firewall providers have demonstrated improved success in cross-selling their proprietary SASE solutions to their existing customer base, creating obstacles for Zscaler’s ability to capture additional market opportunities.
According to the firm’s analysis, the broader platform expansion narrative for Zscaler has failed to materialize as anticipated half a year ago.
Analyst Lowers Revenue Projections
BTIG has adjusted its fiscal 2027 financial model, now forecasting annual recurring revenue of $4.355 billion, representing 16.5% growth compared to the previous year. This revised figure marks a reduction from the firm’s earlier projection of $4.391 billion and falls short of the Street consensus estimate of $4.447 billion.
The security software provider’s shares have declined 39% since the beginning of the year. This performance contrasts with a 24% drop observed across BTIG’s entire coverage portfolio during the identical timeframe. Over a six-month horizon, the stock has surrendered 56% of its value.
Despite BTIG’s more conservative stance, the broader Wall Street analyst community maintains a more optimistic view. The consensus rating for ZS remains at Buy. Target prices among analysts span a wide range from $155 to $335.
Cantor Fitzgerald maintained its Overweight recommendation following Zscaler‘s impressive second-quarter fiscal 2026 earnings report. The cybersecurity firm exceeded projections across multiple metrics including revenue, ARR, earnings per share, and free cash flow generation, while also elevating its full-year outlook across critical performance indicators.
Additional Recent News
Freedom Capital Markets preserved its Buy recommendation while reducing its price objective from $320 to $270, reflecting a broader recalibration of SaaS sector valuations. Wells Fargo launched coverage with an Overweight stance and established a $200 target, emphasizing the company’s platform expansion trajectory and resilient core operations.
The cloud security provider recently disclosed plans to enhance its data sovereignty offerings through an upcoming deployment in Canada. The organization presently operates 160 data centers across the globe.
Evercore analysts noted that Anthropic’s recently launched Claude Mythos model, designed specifically for cybersecurity applications, could create headwinds for cybersecurity sector stocks, with Zscaler among those potentially affected.
As of the latest reporting period, ZS commanded a market capitalization of $22.17 billion. The stock’s average daily trading volume stands at approximately 2.75 million shares. Technical indicators currently signal a Sell rating.
The shares were hovering near their 52-week trough of $128 as of April 9, 2026.

Stablecoins are rapidly evolving beyond their original role in crypto trading, emerging as a key layer of financial infrastructure, according to new research from S&P Global Market Intelligence.
The report highlights a growing shift toward institutional use cases, particularly in cross-border payments, treasury operations, and capital markets, while traditional banks continue to take a cautious, exploratory approach.
Stablecoins Move Beyond Trading
“Stablecoins are evolving beyond a crypto trading tool into a new layer of financial infrastructure,” said Jordan McKee, Director of Fintech Research at S&P Global Market Intelligence.
According to the report, the most meaningful adoption is happening behind the scenes, where stablecoins are improving settlement speed, capital efficiency, and liquidity movement rather than being widely used at the consumer level.
Market Growth Accelerates
The stablecoin market is expanding rapidly:
- Circulation reached approximately $269 billion in 2025
- Projected to grow to around $434 billion by 2028
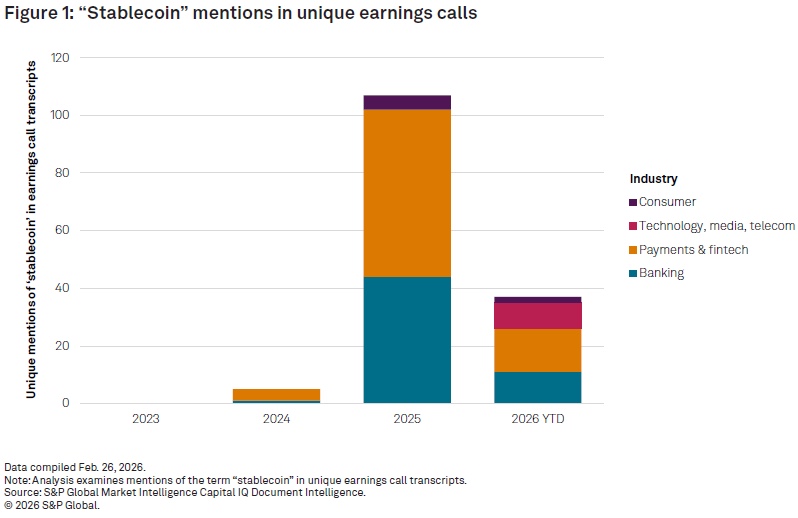
- Mentions in earnings calls surged to 107 in 2025, up from just five in 2024

This sharp increase reflects rising interest from banks, fintech firms, and payment providers exploring the role of stablecoins in modern financial systems.

Institutional Use Cases Lead Adoption
Adoption remains concentrated in infrastructure-level applications, including:
- Cross-border payments
- Treasury and liquidity management
- Tokenized capital markets
In these areas, stablecoins are helping reduce settlement times and improve capital mobility across global markets.
Consumer Adoption Still Limited
Despite the growing institutional interest, consumer adoption remains low, especially in developed markets.
Only 12% of U.S. consumers report familiarity with stablecoins, with concerns around security, fraud, and lack of clear use cases acting as key barriers.
Banks Take a Wait-and-See Approach
The report also reveals a significant gap between infrastructure development and institutional readiness.
Among 100 primarily smaller U.S. financial institutions surveyed:
- Only 7% are developing internal stablecoin frameworks
- None are actively piloting stablecoin initiatives
This suggests that while the technology is advancing quickly, many banks are still evaluating how and when to engage.
Regulation and Competition to Shape the Future
Since the start of 2025, at least 19 applications for banking charters related to digital asset services have been submitted to the Office of the Comptroller of the Currency (OCC).
As the market matures, S&P Global Market Intelligence expects adoption to be driven less by consumer usage and more by:
- Institutional integration
- Regulatory frameworks
- Competition across issuance, liquidity, and distribution
The report concludes that stablecoins are entering a critical infrastructure buildout phase, which will likely define their role in the global financial system over the coming years.
A crypto card can look simple. You tap to pay, shop online, or withdraw cash, and it works much like a regular card.
Still, the total cost is not always obvious. Depending on the provider, users may pay blockchain fees, conversion costs, foreign exchange charges, ATM fees, or merchant markups. Some of those costs appear clearly. Others are built into the rate or show up only at checkout.
That is why the real cost of a crypto card is not one single fee. It is the total cost of moving funds, converting them, and spending them.
Network fees can start before you even spend
The first cost can appear when a user moves crypto into a wallet or account linked to the card. In that case, the blockchain may charge a network fee, often called a gas fee.
That fee usually does not come from the card provider. Instead, it comes from the network that processes the transaction. As a result, the cost can change depending on which blockchain the user picks and how busy that network is.
So even before the card is used for a purchase, the funding step may already carry a cost.
The exchange rate can include a hidden conversion cost
Many crypto cards convert crypto into fiat at the moment of payment. In some cases, that conversion cost appears as a stated fee. In other cases, it sits inside the exchange rate itself.
That difference matters. A card may look cheap on paper, but the user may still pay more through the rate used to convert crypto into dollars, euros, or another currency.
So when comparing cards, users should not look only at the fee page. They should also look at how the provider handles conversion.
Foreign purchases can trigger FX fees
When a card is used in a different currency, foreign exchange fees can apply. That is common when users travel, shop on foreign websites, or withdraw cash abroad.
In some cases, the card network sets one rate and the issuer adds its own FX fee on top. That means the final cost can rise even when the transaction goes through normally.
This is one reason why cross border spending often costs more than a domestic purchase.
DCC is one of the clearest ways to overpay
Another common cost appears at the terminal. When a user pays abroad, the merchant or ATM may ask whether to charge the card in the user’s home currency instead of the local one. That is Dynamic Currency Conversion, or DCC.
It often looks convenient, but it usually costs more. BEUC, the European Consumer Organisation, said consumers are financially worse off in “practically every single case” when they accept DCC. The same paper cited research showing DCC was on average 7.6% more expensive in one study, while the highest markup reached 12.4%.
So the cleaner option is usually the local currency, not the home currency shown on the screen.
A simple DCC example
|
Option |
What happens |
Typical result |
| Pay in your home currency through DCC | The merchant or ATM converts the purchase | Often a worse rate than letting the card network handle it |
| Pay in the local currency | The card network and issuer handle the conversion | Usually the more standard and lower cost route |
That difference may look small on one purchase. Still, it adds up across repeated payments and withdrawals. BEUC’s paper also found examples where payment markups in stores ranged from 2% to 5%, while ATM DCC increases ran from 2.6% to 12% in one dataset.
ATM withdrawals can stack several fees at once
Cash withdrawals are another area where costs can pile up fast. First, the ATM operator may charge its own fee. Then the card issuer may add a withdrawal fee. If the withdrawal is in a foreign currency, an FX fee may apply as well.
So one ATM transaction can combine several charges in a single step. That is why withdrawing cash is often one of the more expensive ways to use a crypto card.
Users should check both the card provider’s fee schedule and the ATM screen before confirming the transaction.
 Card holds are not fees, but they still affect spending
Not every unexpected charge is a fee. Hotels, fuel stations, car rentals, and some online merchants often place a temporary hold on the card before the final charge settles.
That hold reduces the available balance for a period of time. Later, the merchant posts the final amount and releases the unused part.
So while a hold is not a direct cost, it can still confuse users and make the card balance look lower than expected.
Other small charges can still matter
Some crypto cards also charge for physical card shipping, replacement cards, premium plans, or inactivity. These costs are not the same across the market, so they should not be treated as universal.
That is why the fee page matters as much as the headline promise. A provider may advertise low spending fees while charging in other places.
In short, the total cost depends on the full structure, not one line in the marketing copy.
What cost can look like in practice
A user may pay one fee to move crypto onchain, another cost through the conversion rate, another fee on a foreign purchase, and another markup if DCC is accepted by mistake. Then, if the same user withdraws cash abroad, ATM and FX charges may come on top.
KAST’s public fee page offers one example of how that structure can work. It says non-USD card purchases carry a foreign exchange fee of 0.5% to 1.75%, depending on the countries involved. It also says ATM withdrawals cost $3 plus 2% of the withdrawal amount, with the same 0.5% to 1.75% FX fee added for non-USD withdrawals.
That example does not make crypto cards unusually expensive. It simply shows that the total cost often comes from several layers, not one headline fee.
If you want to see how a real fee schedule is laid out before you travel or spend abroad, take a minute to explore KAST.
The main point on cost
Crypto cards are easier to understand when each cost is separated clearly. The main ones to watch are network fees, conversion costs, FX fees, DCC markups, ATM charges, and temporary holds.
Among them, DCC remains one of the clearest traps because it can make a transaction more expensive without adding any real benefit for the cardholder. BEUC’s findings underline that point.
So the simplest rule is this: check how the card handles conversion, read the fee page before using it abroad, and choose the local currency when a terminal gives you the choice.


Enhanced Labs raised a $1 million pre-seed led by Maximum Frequency Ventures to expand options-based yield strategies across on-chain and tokenized real-world assets.
Summary
- Enhanced Labs secures $1 million pre-seed round led by Maximum Frequency Ventures.
- Backers include GSR, Selini, Flowdesk and several angel investors.
- Funds will expand options-based yield strategies to more on-chain and tokenized real-world assets.
U.S.-based DeFi infrastructure startup Enhanced Labs has closed a $1 million pre-seed funding round to expand its options-based yield products across a wider range of on-chain assets, including tokenized real-world assets. The round was led by Maximum Frequency Ventures, with market-making and trading firms GSR, Selini and Flowdesk joining alongside a group of undisclosed angel investors. According to the company, the capital will be used to support product development, operations and go-to-market efforts.
Enhanced Labs positions itself as a provider of “options-based yield strategies” designed to sit on top of existing DeFi and tokenization rails, rather than competing directly with spot lending or simple staking. By extending these structured strategies to tokenized real-world assets, the firm is effectively betting that on-chain treasuries, credit, commodities and other RWAs will need the same kind of yield engineering and risk-transfer mechanisms that already exist in traditional markets. The goal is to package those exposures in a way that can be deployed programmatically, but still remain accessible to institutions that need clearer risk parameters than typical DeFi products offer.
Backing from names like GSR, Selini and Flowdesk suggests Enhanced Labs is targeting the intersection of market-making, derivatives and on-chain liquidity rather than retail-facing savings products. For these investors, options-based yield on tokenized assets is not just a new narrative but a potential source of structured flow if RWAs continue to move on-chain. The pre-seed size is modest by bull-market standards, but at this stage the more important signal is that specialized trading firms are willing to seed infrastructure aimed at making RWAs behave more like fully featured, hedgeable collateral.
If Enhanced Labs executes, it could help close one of the gaps in today’s tokenization pitch: plenty of projects can put a bond or a real-estate claim on-chain, but far fewer can offer a robust menu of ways to hedge, lever or generate predictable income on top of those assets. Whether a $1 million war chest is enough to build those tools—while navigating the regulatory and risk constraints that come with engineering yield on real-world exposures—remains an open question.
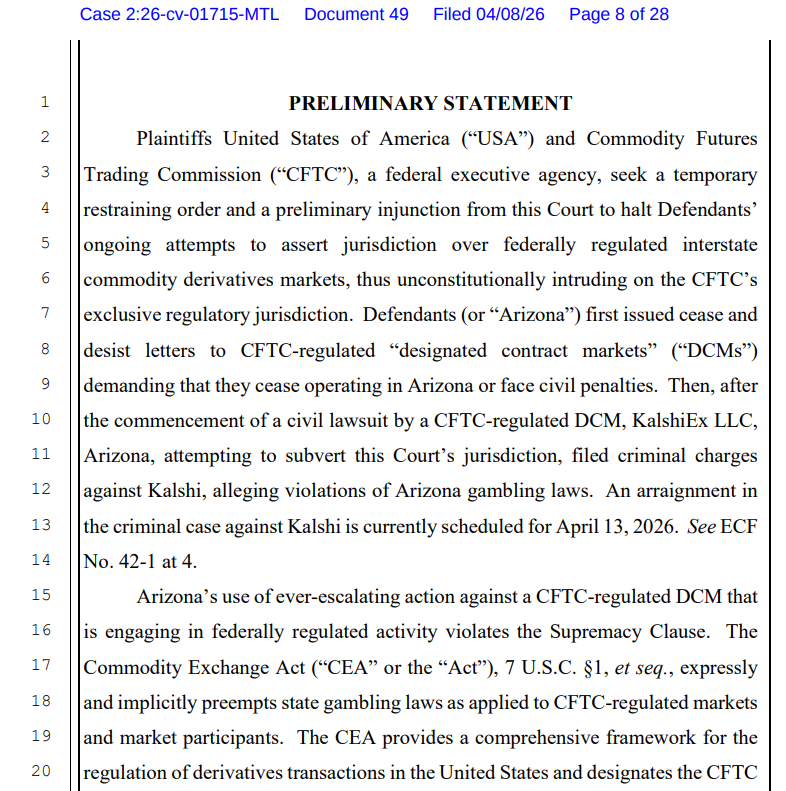
The US Department of Justice (DOJ) and Commodities and Futures Trading Commission (CFTC) asked a federal court to block Arizona from enforcing state gambling law against Kalshi’s event contracts, arguing that they fall under the CFTC’s exclusive authority over swaps markets.
The Wednesday filing argues that event contracts listed on federally regulated platforms such as Kalshi are swaps under the Commodity Exchange Act and therefore fall within the CFTC’s exclusive jurisdiction.
The filing says Arizona’s enforcement effort unlawfully intrudes on the CFTC’s exclusive jurisdiction over federally regulated event-contract markets.
If granted, the order would block Arizona from applying its gambling laws to prediction markets that are listed as federally regulated event contracts. An arraignment in the criminal case against Kalshi is currently scheduled for Monday.
Arizona Attorney General Kris Mayes announced charges against the companies behind Kalshi on March 17, accusing them of operating an “illegal gambling business in Arizona without a license” and offering illegal election wagering.
Kalshi co-founder and CEO, Tarek Mansour, claimed the charges were a “total overstep” and “not about gambling.”
Federal and state regulators clash over prediction markets
The dispute has become a major test of whether prediction market contracts belong under federal commodities law or state betting rules.

On April 2, the CFTC filed three separate lawsuits against the gaming regulators of Illinois, Connecticut and Arizona, claiming that the event contracts offered by the platforms violated state gambling laws and licensing requirements.
In those suits, the CFTC says it has exclusive jurisdiction over CFTC-registered designated contract markets that list lawful event contracts. Kalshi is the clearest example in the current litigation.
Related: Kalshi, Polymarket face trading halt in Nevada after court rulings
Prediction markets are facing growing regulatory pressure in the US, where 11 states have pursued legal action against them.
Prediction market activity has been rising since the beginning of the US and Israeli military conflict with Iran, fueling renewed insider trading allegations, after six Polymarket traders netted $1 million by accurately betting when the US would strike Iran.
In response to insider trading concerns, Democratic Party Senator Adam Schiff has introduced legislation seeking to ban prediction markets on war, death and terrorism.
Magazine: Train AI agents to make better predictions… for token rewards
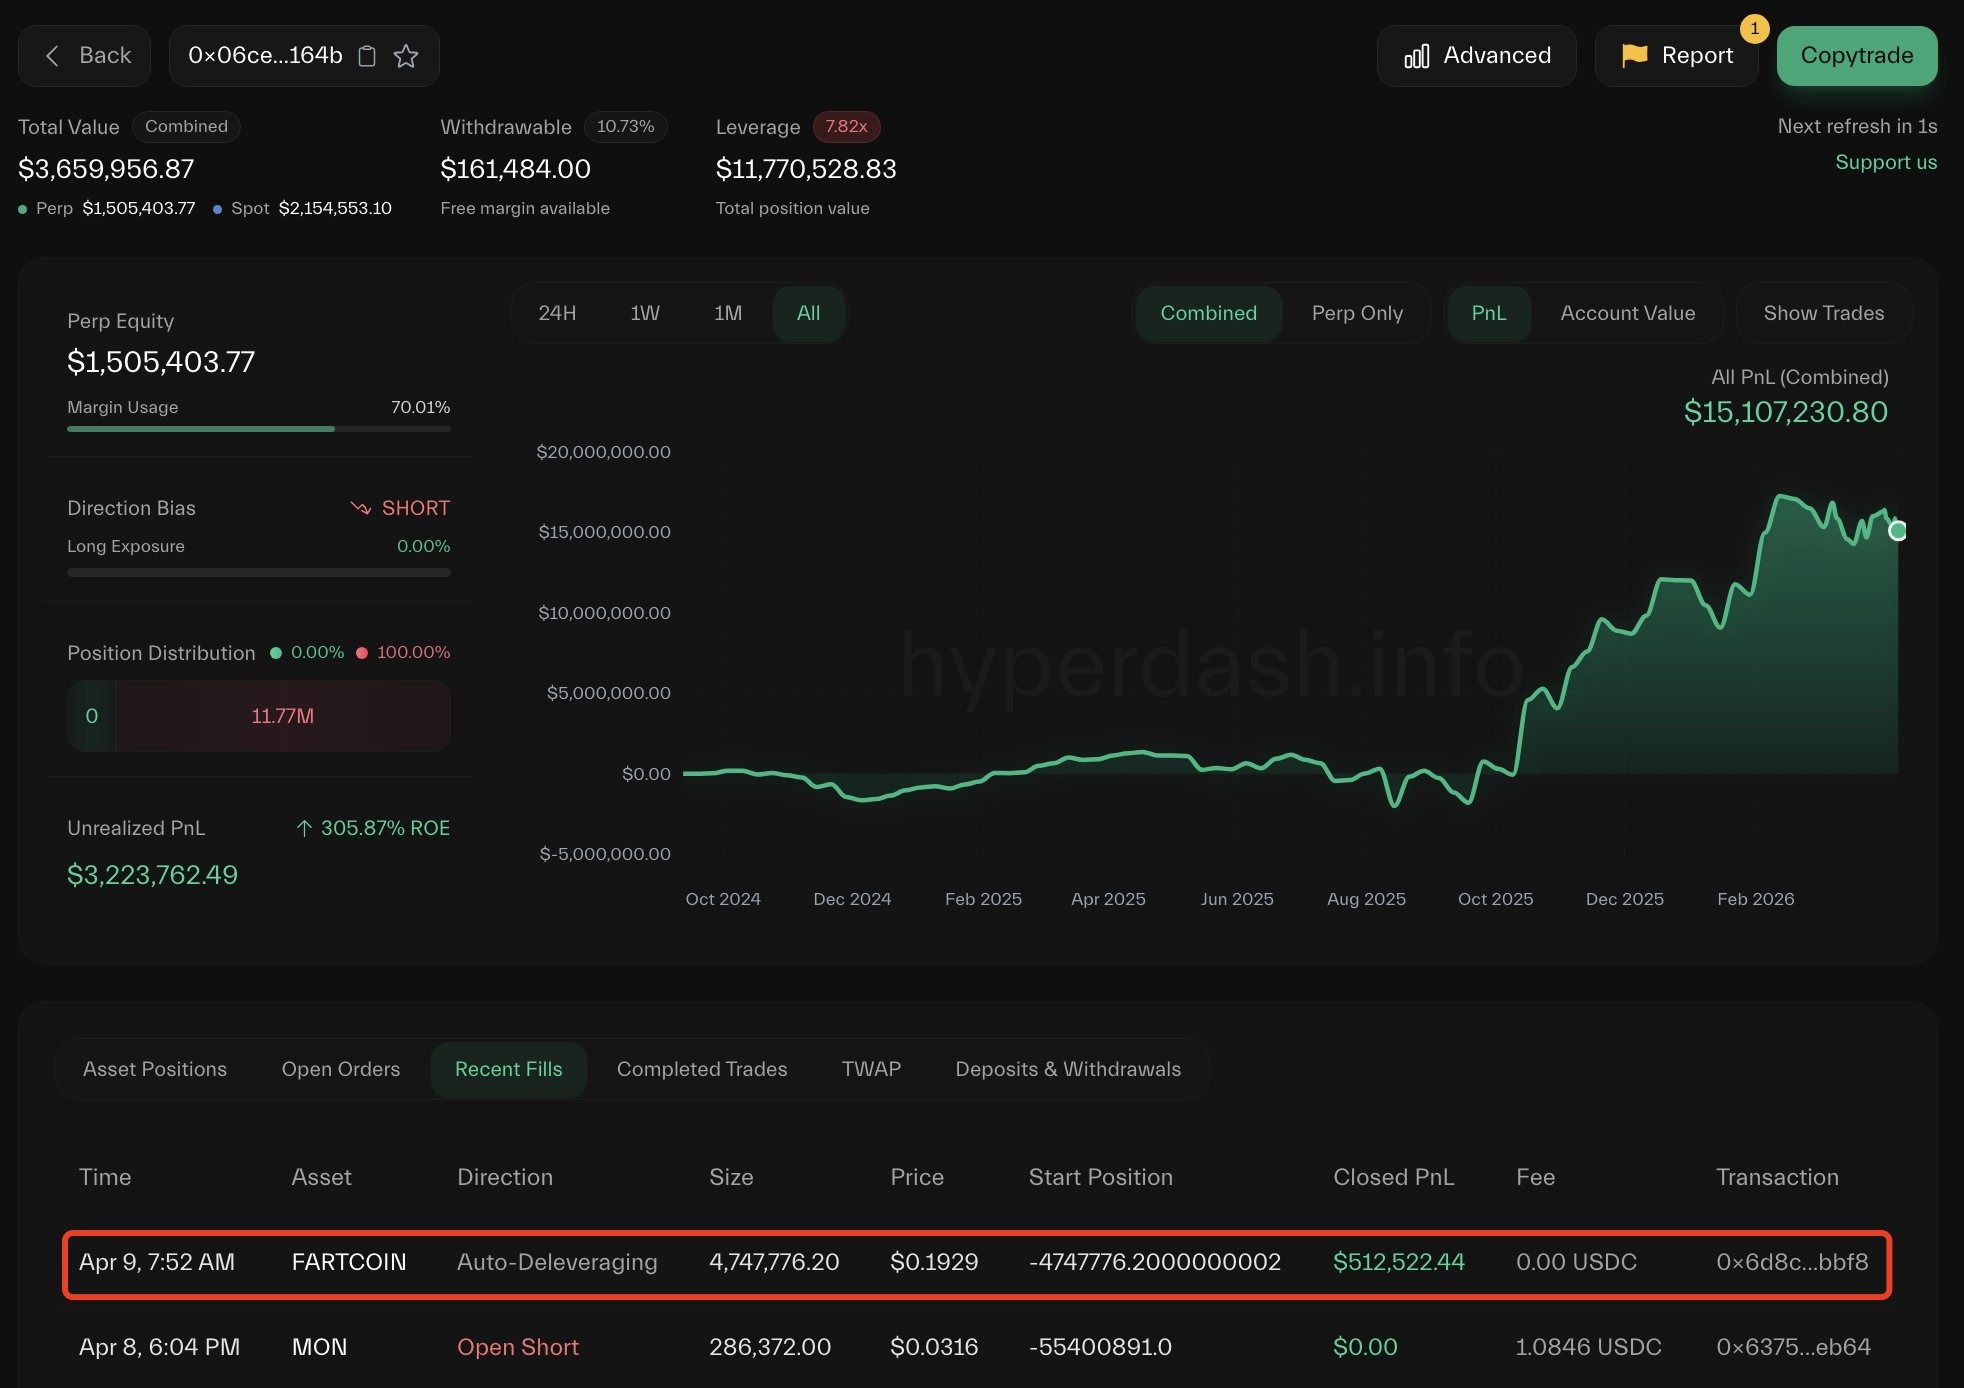
A trader lost about $3 million after building a large leveraged Fartcoin position on Hyperliquid that unraveled in thin liquidity, triggering the platform’s auto-deleveraging (ADL) mechanism.
Hyperliquid data flagged by Lookonchain shows that the trader accumulated about 145 million tokens across multiple wallets before being liquidated. The liquidation redistributed gains to opposing traders, with at least two wallets seeing around $849,000 through ADL.
PeckShield said the unwind produced about $3 million in accounting losses and left Hyperliquid’s HLP vault down roughly $1.5 million over 24 hours, though Hyperliquid had not publicly confirmed those figures by publication.
The episode highlighted how ADL can crystallize gains for traders on the other side of a collapsing position, while raising fresh questions about how Hyperliquid’s liquidation and vault structure behave in low-liquidity markets.

PeckShield said the activity appeared structured to trigger liquidations in low-liquidity conditions, potentially pushing losses onto Hyperliquid’s liquidity pool while being offset by positions elsewhere.
Cointelegraph reached out to Hyperliquid for comments, but had not received a response before publication.

Past trades exposed similar pressure on Hyperliquid’s liquidity system
This is not the first time Hyperliquid’s liquidity system has come under pressure from large, concentrated positions.
On March 13, 2025, the platform’s Hyperliquidity Provider (HLP) vault took a roughly $4 million hit after an oversized Ether (ETH) position was unwound, triggering liquidations under thin market conditions. After the incident, the team said that losses stemmed from market dynamics rather than a protocol exploit.
Related: Onchain perp DEX volumes fall for five straight months after October peak
A similar episode occurred later that month involving the JELLY memecoin. On March 27, 2025, a trader used multiple leveraged positions to exploit the platform’s liquidation system.
However, the final outcome remained unclear, with Arkham saying the trader withdrew about $6.26 million but may still have ended up down nearly $1 million.
On Nov. 13, 2025, a similar pattern occurred when a trader built large leveraged positions in the POPCAT market, triggering cascading liquidations that left a $5 million hole in the HLP vault. Community members said the strategy appeared designed to create and then remove liquidity to force the vault to absorb the impact.
Magazine: Solana exec trolls crypto gamers, Pixel tackles play-to-earn issues: Web3 Gamer
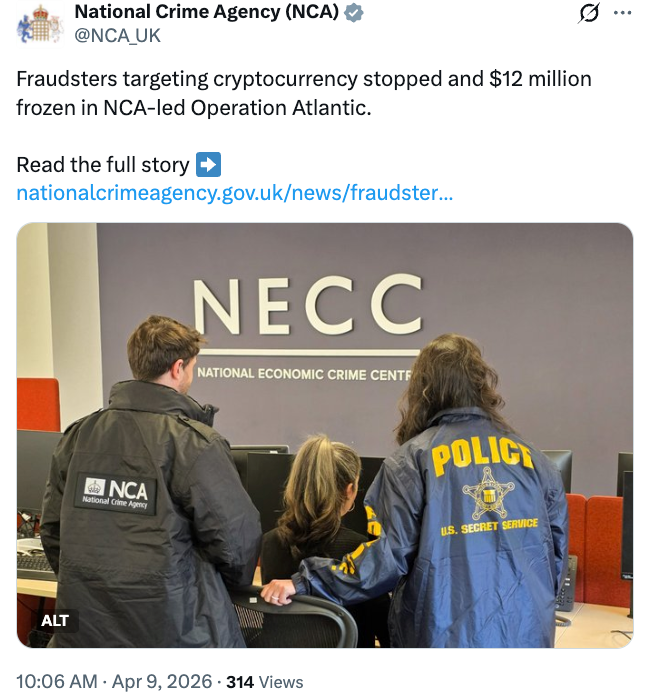
Authorities in the United States, United Kingdom and Canada have frozen millions of dollars tied to crypto scams in a joint enforcement operation called Operation Atlantic.
The operation, focused on phishing attacks, took place in March and was coordinated by the UK’s National Crime Agency (NCA), the US Secret Service, the Ontario Provincial Police and the Ontario Securities Commission.
Operation Atlantic identified more than 20,000 victims across the US, Canada and the UK, securing and freezing more than $12 million in suspected criminal proceeds, the NCA said Thursday. It also identified “more than $45 million stolen in cryptocurrency fraud schemes,” the agency added.
“Operation Atlantic is a powerful example of what is possible when international agencies and private industry work side by side,” NCA Deputy Director of Investigations Miles Bonfield said.
The operation involved assistance from major cryptocurrency exchange Binance, according to a separate statement by the company.

What is an approval phishing scam?
Approval phishing scams trick users into signing malicious permissions that allow attackers to access and drain crypto wallets.
Unlike typical scams, where perpetrators trick victims into sending them crypto, approval phishing misleads victims into unknowingly authorizing malicious transactions that allow scammers to spend specific tokens inside the victim’s wallet.

“Approval phishing is one of the most damaging types of scams targeting crypto users today,” said Flavio Tonon, Binance’s senior regional advisor for the Europe, Middle East and Africa region.
Related: Drift explains $280M exploit as critics question Circle over USDC freeze
He noted that the operation underscores how effective crime fighting is possible when private and public partners work together, adding that blockchain transparency makes it difficult for criminals to get away with phishing exploits.
No funds were frozen on Binance as part of the operation
Operation Atlantic included on-site investigations at the NCA’s London headquarters, where Binance said its Special Investigations team provided support, including live account screening and scam intelligence.
The company also provided insights on potential bad actors in order to assist with asset seizure efforts, and conducted research that identified scam websites that were still actively defrauding victims at the time of the operation.
Binance said no funds were frozen on Binance accounts.
Magazine: AI agents will kill the web as we know it: Animoca’s Yat Siu


Stablecoins are on track to become a foundational layer of global finance, with adjusted transaction volumes projected to reach $719 trillion by 2035, according to a new report by blockchain research firm Chainalysis on Wednesday.
The growth, driven by organic adoption alone, signals a structural shift in how value moves across borders and through everyday commerce, the research firm added.
Stablecoins moved more than $35 trillion on blockchain rails last year, noting that only roughly 1% was for real-world payments, according to a March report by McKinsey and blockchain data firm Atermis Analytics.
A key catalyst is the looming generational wealth transfer, with as much as $100 trillion expected to pass from Baby Boomers to Millennials and Gen Z over the coming decades. These younger cohorts, far more likely to use crypto as a financial instrument by default, are set to redefine payment preferences at scale, embedding digital assets into mainstream economic activity.
“When crypto becomes the default for the next generation of capital, the question is no longer if stablecoins compete with traditional rails, but how quickly they replace them,” Chainalysis said in its report.
At the same time, stablecoin transaction volumes are quickly converging with traditional payment networks. Chainalysis said that current trends suggest onchain payments could match Visa and Mastercard’s volumes no later than 2039, placing direct competitive pressure on legacy rails long defined by intermediaries, fees and delayed settlement.
Unlike card networks, stablecoins enable near-instant, 24/7 settlement and programmable transactions, reducing friction across remittances, business payments, and treasury operations. As merchant adoption expands, paying with stablecoins is increasingly shifting from a deliberate choice to invisible infrastructure, the firm added.
Chainalysis is also introducing a new category of blockchain intelligence agents, aimed at helping institutions navigate and operationalize this transition as digital assets move from the margins to the core of global finance.
“The institutions that build for onchain payments now will define the next era of global finance, while those that wait risk settling on someone else’s rails,” Chainalysis said.

York Space Systems Stock Soars 16% as Defense Contracts and Sector Momentum Drive YSS Past $32

Petition demands the UK Eurovision contestant drops out

BetMGM Grand National Offers | Free Bonus Bets & Promos

Why Israel is blocking foreign journalists from entering

Bitcoin: We’re Entering The Most Dangerous Phase

Alan Cumming Brands Baftas Ceremony A ‘Triggering S**tshow’
![Tom Lee & Raoul Pal: "Don't SELL Your Ethereum Before Watching This" | [2026 Crypto Prediction]](https://wordupnews.com/wp-content/uploads/2026/04/1775752451_maxresdefault-80x80.jpg)
Tom Lee & Raoul Pal: “Don’t SELL Your Ethereum Before Watching This” | [2026 Crypto Prediction]

XRP The NEW Oil *Change Now*

5 Smart Money Rules You Must Follow | Tamil Financial Tips to Save & Grow Wealth#moneytips #shorts
-

 NewsBeat7 days ago
Steven Gerrard disagrees with Gary Neville over ‘shock’ Chelsea and Arsenal claim | Football
-

 Business7 days ago
No Jackpot Winner and $194 Million Prize Rolls Over
-

 Fashion6 days ago
Weekend Open Thread: Spanx – Corporette.com
-

 Business5 days ago
Expert Picks for Every Need
-

 Business4 days ago
Three Gulf funds agree to back Paramount’s $81 billion takeover of Warner, WSJ reports
-

 Sports5 days ago
India men’s 4x400m and mixed 4x100m relay teams register big progress | Other Sports News
-

 Tech2 days ago
How Long Can You Drive With Expired Registration? What Florida Law Says
-
Business4 days ago
No Jackpot Winner, Prize to Climb to $231 Million
-

 Fashion3 days ago
Massimo Dutti Offers Inspiration for Your Summer Mood Board
-

 Fashion2 days ago
Let’s Discuss: DEI in 2026
-
Politics6 days ago
Wings Over Scotland | The quality of mercy
-

 Business5 days ago
Akebia Therapeutics, Inc. (AKBA) Discusses Pipeline Progress and Strategic Focus on Kidney Disease Treatments at R&D Day – Slideshow
-

 Fashion7 days ago
Statement Sunglasses: The Accessory Shaping Modern Fashion
-

 Crypto World1 day ago
Bitcoin recovers as US and Iran Agree a Ceasefire Deal
-

 Politics7 days ago
East Jerusalem Palestinian families eviction orders
-

 Fashion7 days ago
Coffee Break: Santa Croce Tote
-

 Fashion7 days ago
For Love & Lemons’ Spring 2026 Line is for the Romantics
-

 Politics6 days ago
Why so many children are now classified as ‘disabled’
-

 Politics7 days ago
Nuclear rockets, moon bases and NASA’s Mars plan
-

 Tech6 days ago
The Threadless Ball Screw Never Took Off, But Don’t Write It Off
You must be logged in to post a comment Login