Crypto World
XAG/USD Analysis: Silver Surges on Jobs Data, Yields Threaten to End It

Silver has had one of its strongest months in years, but this week’s price action shows just how fragile precious metals rallies can be when bond markets get nervous. The metal surged nearly 10% last week after July’s Non-Farm Payrolls badly missed expectations, printing a loss of 23,000 jobs, prompting markets to price out any chance of a September Fed hike and reviving safe-haven demand.
That momentum reversed on Tuesday, however, with silver dropping toward $64 as global bond yields spiked to multi-year highs on mounting concerns over government spending and persistent inflationary pressures. Rising oil prices added to the unease, keeping inflation risks firmly in focus even as rate-hike expectations continue to fade.
Beneath the volatility, the structural picture remains supportive: silver continues to draw solid demand from the green energy transition, solar panels, electric vehicles, and AI data centre infrastructure, all keeping a floor under prices. All eyes now turn to the Fed’s July meeting minutes and Chair Kevin Warsh’s remarks at Jackson Hole, both expected to offer fresh clues on the path ahead for rates.
Technical Analysis of XAG/USD

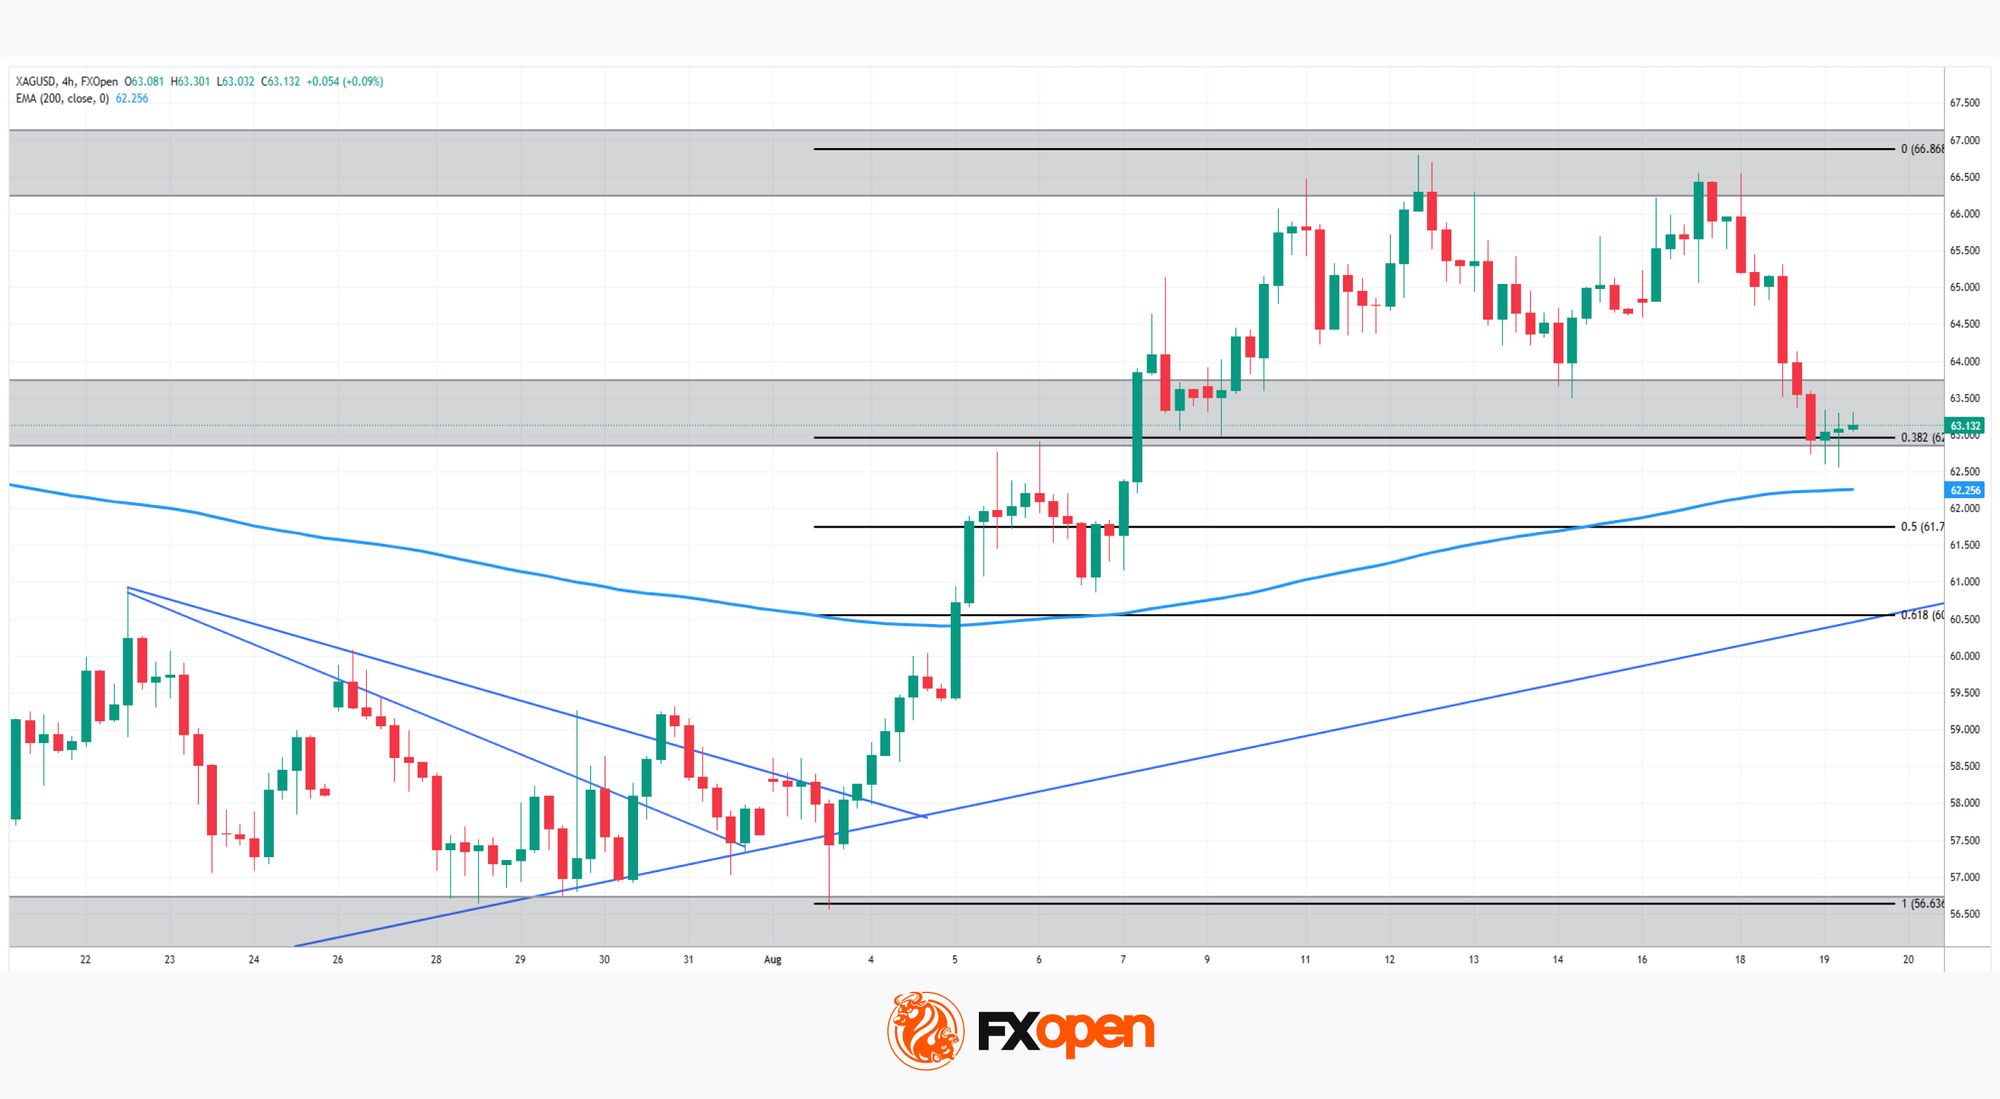
As XAG/USD chart shows, silver broke above its descending trendline from June’s highs in early August, a genuine shift after weeks of decline, and has since been holding above the 0.382 Fibonacci retracement near 62.88, right where the 200-period EMA also sits nearby at 62.27. The broader recovery has been building on an ascending trendline off the mid-July lows.
Bullish Scenario
Should buyers defend this 0.382-EMA confluence and push higher, the path would open toward a retest of the 66.73 highs, the 0 Fibonacci level marking the origin of the entire decline. A confirmed break above that zone would signal the correction is fully over.
Bearish Scenario
Conversely, a break below the 0.382 retracement and the ascending trendline would expose the 0.5 level near 61.69, with a deeper slide risking a retest of the 0.618 retracement around 60.49, or even the triangle apex near 56.64 if selling pressure accelerates.
With price sitting right at the intersection of a reclaimed trendline, the 200-period EMA, and a key Fibonacci level, silver looks poised for a decisive move, will this recovery extend toward fresh monthly highs, or does the recent bond market turmoil drag the metal back into its prior range?
Start trading commodity CFDs with tight spreads (additional fees may apply). Open your trading account now or learn more about trading commodity CFDs with FXOpen.
This article represents the opinion of the Companies operating under the FXOpen brand only. It is not to be construed as an offer, solicitation, or recommendation with respect to products and services provided by the Companies operating under the FXOpen brand, nor is it to be considered financial advice.
You must be logged in to post a comment Login