

Crypto World
XBIT DEX Opens Leverage Whitelist; Prediction Markets Enter Derivatives

XBIT DEX is expanding the toolkit for on-chain prediction markets by introducing a dedicated leverage layer, with the 2026 FIFA World Cup serving as the initial proving ground. The platform has opened whitelist applications for Prediction Leverage, signaling a shift toward more flexible risk management in on-chain forecasts.
May 27, 2026 — The once-spot-centric world of on-chain predictions is embracing leverage as users seek ways to hedge, scale, and manage exposure across event-driven markets. Industry data show a surge in activity: March 2026 alone saw monthly trading volume north of $25 billion, a stark acceleration from the year prior. In this environment, Polymarket has emerged as the official prediction market partner for XBIT DEX, and Coinbase has broadened prediction contracts across all 50 U.S. states. Yet, even as capital floods in, the underlying product architectures have struggled to keep pace with demand.
Traditional prediction markets have largely operated on a straightforward, all-in, full-amount purchase model with settlement based on binary outcomes. Participants could not easily add to positions, hedge risk, or adjust leverage in real time. This lack of flexibility mirrors an earlier phase seen in crypto derivatives before the arrival of perpetuals in 2016, which catalyzed a surge in derivatives volumes relative to spot trading. XBIT DEX is positioning Prediction Leverage as the next evolution for on-chain predictions, building a bespoke leveraged infrastructure tailored to the unique mechanics of event contracts.
Leverage system built specifically for prediction markets
Event contracts underpin prediction markets by delivering outcomes that settle to 0 or 100. Unlike perpetuals, these contracts do not rely on continuous funding rates, which leaves a misaligned incentive structure for traditional leverage. To bridge this gap, XBIT DEX has devised an independent leveraged lending framework that borrows against authentic order flow from external prediction markets. Instead of funding rates, leverage openings accrue borrowing interest that adjusts dynamically with supply and demand. The design also emphasizes resilient risk controls: extreme-value liquidation mechanics and adaptive leverage management aimed at handling the pronounced volatility as contracts approach settlement.
The result is a system that can accommodate leveraged exposure in a domain where payouts hinge on discrete, binary outcomes, while still preserving the trustless, on-chain nature of the platform. XBIT DEX describes the approach as a necessary evolution to unlock a broader range of trading strategies within event-driven markets, enabling users to hedge, scale, and diversify positions without leaving the on-chain ecosystem.
World Cup as the testing ground for Prediction Leverage
Prediction markets span politics, finance, and sports, but the World Cup offers a combination of settlement certainty, high event density, and concentrated order flow that suits automated, algorithmic trading. Sports events provide clear outcomes and synchronized global viewership, which translates into more robust liquidity for event-based derivatives. The 2026 FIFA World Cup, kicking off on June 11, is the largest edition to date, with 48 teams, 104 matches, and a 39-day schedule. This environment is being used to seed XBIT DEX’s initial Prediction Leverage offerings, featuring 2x to 5x dynamic leverage that adjusts in real time in response to market conditions.
As part of the rollout, XBIT DEX has already begun offering leveraged prediction trading around selected World Cup teams, with the leverage settings designed to respond to shifts in liquidity and risk. The white-label testing phase is specifically designed to validate the mechanics and guardrails before broader platform-wide deployment.
Whitelist rollout and incentives
Access to Prediction Leverage is currently limited to a whitelist, operating on a first-come, first-served basis. Interested traders can apply at app.xbit.com/whitelist, with eligibility unlocked by completing a series of trading milestones. Early engagement appears strong, with more than 1,700 users already on the waitlist, signaling demand for a more sophisticated toolkit in on-chain predictions. The plan is to open platform-wide access in the lead-up to the World Cup kickoff, aligning product readiness with a surge of global interest in event markets.
In conjunction with the whitelist, XBIT DEX launched a two-week trading campaign running from May 26 through June 10. The promotion includes a 35,000 USDC prize pool distributed across three categories: Early Bird Trading, Referrals, and a Leaderboard. Details are published on the whitelist page, offering participants a structured incentive to explore the new leverage features while the platform validates its risk controls and performance in a live environment.
About XBIT DEX
XBIT DEX markets itself as a decentralized aggregated trading platform that brings together multiple on-chain liquidity sources to deliver low-slippage trading across a suite of products. The platform already supports perpetual contracts, prediction markets, and plans to enable a U.S. stock trading avenue for real-world assets (RWA), with more than 150 tokens accessible to traders. By leveraging its established derivatives infrastructure, XBIT DEX positions itself as the first DEX to introduce a dedicated leverage layer for prediction markets, aiming to unlock more nuanced trading strategies for participants who want to hedge, speculate, or arbitrage across event-driven outcomes.
For more information about the platform and its offerings, readers can visit the official site at XBIT DEX Official Website.
As the World Cup shape and global participation evolve, the industry will watch closely to see how the new Prediction Leverage feature performs under real-world liquidity pressures and settlement dynamics. If successful, the model could redefine how traders approach on-chain event markets, moving beyond binary bets toward more sophisticated risk management and strategy design within the predictable cadence of major sporting events.
Readers should keep an eye on the whitelist progress and the platform’s broader rollout timeline, as well as any regulatory developments that could influence leverage-enabled prediction markets and cross-border capital flows. In the near term, the World Cup stands as a critical proving ground for whether prediction markets can scale with financial innovation while maintaining robust risk controls and transparent settlement.


Key Takeaways
- Shares of Hertz plummeted 41% to $3.00 on Wednesday following a sharp reduction in second-quarter adjusted EBITDA expectations to $50M–$80M
- Deteriorating used-vehicle market conditions drove net monthly depreciation to approximately $300 per vehicle, exceeding previous projections
- The company launched a dual capital raise: $100M in common equity and $300M in exchangeable notes (subsequently increased to $350M)
- Year-to-date losses now stand at 28%, with shares down nearly 50% over the trailing twelve months
- On June 25, Hertz priced 37,037,037 shares at $2.70 apiece, with J.P. Morgan serving as lead underwriter
Hertz (HTZ) experienced its most devastating trading session on record Wednesday, with shares collapsing 41% to close at $3.00. The unprecedented decline came after the rental car company issued a disappointing earnings preview and unveiled plans to raise hundreds of millions in fresh capital.
Hertz Global Holdings, Inc., HTZ
Management revealed that second-quarter adjusted corporate EBITDA would likely land between $50 million and $80 million. This figure sits at the bottom of the company’s earlier projections.
The primary driver? Unexpected weakness in the pre-owned vehicle marketplace. Hertz disclosed that deteriorating conditions in May erased gains achieved through April vehicle disposals, resulting in elevated depreciation expenses.
Monthly net depreciation per vehicle — representing the value decline of each rental unit over thirty days — is projected to reach approximately $300 for the second quarter. Just weeks ago, management had indicated this metric would come in substantially lower.
In response to these pressures, Hertz initiated two simultaneous financing transactions. The first involves $100 million in common equity. The second consists of $300 million in payment-in-kind (PIK) exchangeable notes, subsequently expanded to $350 million at 6.75% interest, maturing in 2030.
The company priced 37,037,037 common shares at $2.70 per share on June 25, lending them to lead underwriter J.P. Morgan Securities. The investment bank will sell these borrowed shares, establish a short position to facilitate hedging for note purchasers, and later return equivalent shares to Hertz.
Hertz receives a minimal lending fee from the equity arrangement — but captures no direct cash proceeds from the share sale. Net proceeds from the notes transaction are anticipated to total roughly $339.5 million, potentially reaching $388 million if the overallotment option is fully exercised.
Management intends to deploy the capital to reduce outstanding balances on its revolving credit facility and support general corporate operations.
Extended Downturn
Wednesday’s collapse adds to an already punishing period for shareholders. HTZ has declined 28% since January and approximately 50% over the past year. During this same timeframe, the S&P Small Cap 600 — Hertz’s benchmark index — has advanced more than 19% and 34%, respectively.
The stock currently trades 54% beneath its 52-week peak of $7.97, reached in July 2025.
Hertz has dedicated the past year to operational improvements. The company modernized its vehicle fleet, implemented cost-reduction initiatives, and announced two partnerships with Uber in April to support autonomous taxi development — announcements that temporarily boosted the share price.
However, the turnaround has proven unstable. Shares received a temporary boost earlier this year when travel disruptions linked to a partial government shutdown increased rental demand, but those gains evaporated once TSA personnel received payment and air travel normalized.
Bankruptcy Legacy
The company’s 2020 Chapter 11 bankruptcy filing continues to cast a long shadow. Hertz entered bankruptcy protection as international travel evaporated and used-vehicle valuations plummeted. The company notably became an early meme stock phenomenon, with retail investors driving shares up 800% despite its bankruptcy status.
Hertz completed its restructuring in June 2021, generating over $1 billion in value for equity holders — an uncommon bankruptcy outcome.
Legal challenges persist. In January, the Supreme Court refused to review Hertz’s appeal of a lower court decision, leaving the company responsible for $270 million in interest obligations owed to bondholders who were repaid ahead of schedule during bankruptcy proceedings.
The latest analyst recommendation on HTZ is rated as Sell, with a $3.00 price target.

Ethereum has dropped to its lowest level in weeks, and most traders asking why is Ethereum down today will blame the obvious culprit, a market-wide sell-off. The more revealing part is who used the drop to buy.
The selling is real, and the Ethereum price has fallen harder than Bitcoin. Yet on the week’s sharpest leg lower, Ethereum held the line where Bitcoin gave way, and the largest wallets shifted from sellers to buyers.
The Ethereum Drop Is Real, but One Detail Breaks the Pattern
Over the past month, the ETH price is down about 21%, a touch worse than Bitcoin (BTC) near 20%. Over the week, ETH slid close to 5% against 3.7% for BTC.
Want more token insights like this? Sign up for Editor Harsh Notariya’s Daily Crypto Newsletter here.
On the scoreboard, then, Ethereum is the weaker asset. That is the easy read, and it is also where most analysis stops. The interesting part hides in the timing. When the market flushed into June 24, Bitcoin broke to a fresh low near its early-June bottom around $59,000.

Ethereum declined to follow. It carved a higher low and defended the floor it set earlier in the month, the first crack in the bearish story.

A higher low means little, however, unless the selling driving the Ethereum down move was already losing steam.
Selling Pressure Faded as ETH Whales Turned Buyers
The sell volume exploded with a single huge bar on June 5, then thinned out steadily through the month.
Selling firmed up again between June 23 and June 24, yet never came close to that June 5 peak. The flush that began the decline simply ran out of fuel.

As sellers tired, Ethereum whales moved the other way. Santiment’s Supply Held By Whales metric, which tracks the ETH held by the largest non-exchange wallets, fell from roughly 125.68 million on June 18 to 125.23 million by June 22, then rebuilt to about 125.3 million amid the late-June crash.

On-chain trackers also caught large wallets pulling ETH off exchanges during the drop. The pattern suggests whale accumulation quietly mopping up the last of the supply.
A whale bid is hollow, though, if the network those wallets feed is emptying out.
The Network Kept Working While Price Fell
Ethereum DEX volume, the value traded on decentralized exchanges, jumped about 36% into the low, from roughly $0.9 billion on June 22 to $1.3 billion on June 24. So the network wallets are certainly not emptying.
Trade counts climbed back above 390,000 on the same day. That points to on-chain activity rebuilding into the dip, not retreating from it.

Compared with the June 5 capitulation near $3 billion, the latest pickup looks measured rather than frantic. Traders engaged the low without the panic that marked the start of the slide.
The base layer told the same story. Daily transactions on the Ethereum network held near 2.7 million through the June 21 to 24 drop, above the 1.9 million pace a week earlier. Active wallets jumped to roughly 637,000 on June 24, the flush day, up from 514,000 the session before.

Stablecoins parked on Ethereum stayed near $158 billion, down just 2% on the week. Dollars sat tight on the chain even as price fell.

Steady usage and a returning whale bid stack the odds. Now the chart has to confirm them.
The Ethereum Price Levels That Settle the Debate
ETH trades near $1,655, just above the 0.236 Fibonacci level at $1,633.
The decisive level is $1,551, the higher low from June 24. Support held there while Bitcoin was busy making a fresh low, and it sits above the early-June floor near $1,505.
To take control, buyers must reclaim $1,683, then $1,724, and eventually $1,765. A push into that band lines up with a measured move of about 7%.

Clearing it would let the Ethereum price recover before Bitcoin even turns. The catch is that thin volume cuts both ways, so a single heavy session could undo the bid fast. A daily close below $1,551 would snap the higher-low structure and put $1,505 back in play.
The $1,551 support separates an early, whale-led ETH rebound from another slide toward the June lows.
The post Ethereum Price Crash Triggers a 36% DEX Volume Surge appeared first on BeInCrypto.


All 32 of the largest US banks would stay above minimum capital requirements during a severe recession, the Federal Reserve said Wednesday, even after absorbing more than $708 billion in projected loan losses under its annual stress test.
The exercise tested whether systemically important lenders could keep credit flowing through a downturn. Aggregate capital fell just 1.6 percentage points, from 12.8% to 11.2%, leaving banks well above regulatory floors.
What the Fed Stress Test Measured
The Dodd-Frank Act requires the Fed to conduct these tests annually. Congress mandated it after the 2008 financial crisis to ensure that large banks hold sufficient capital to withstand severe economic conditions.
The requirement covers banks with at least $100 billion in assets. This year’s pool of covered firms included JPMorgan Chase, Bank of America, Citigroup, Wells Fargo, Goldman Sachs, and Morgan Stanley.
The hypothetical scenario matched last year’s severity. It assumed unemployment would climb to 10%, that commercial real estate prices would drop by 39%, and that home prices would fall by 30%.
Economic output contracted 4.6% in the model. Equity markets dropped 58%, deepening losses on business loans.
Follow us on X to get the latest news as it happens
Where the Losses Landed
Credit cards accounted for the largest share of projected losses, at roughly $200 billion. Commercial and industrial loans added about $160 billion.
Commercial real estate contributed around $75 billion. Two forces pulled capital down. Heavier loan losses from larger balances and tougher assumptions. Weaker unrealized securities gains followed smaller modeled rate declines.
Higher interest income pushed in the opposite direction. Stronger recent bank earnings and smaller modeled rate cuts lifted projected capital, more than offsetting the two drags above.
Vice Chair for Supervision Michelle Bowman framed the outcome as evidence of resilience.
“Today’s results underscore the strength of the banking system. As we work to increase the transparency and accountability of the stress test, public feedback will help us continue to improve and instill greater confidence in the stress test and its results,” Bowman stated.
The results will not change the capital requirements. Current levels hold until 2027, when revised loss models incorporating public feedback take effect.
Subscribe to our YouTube channel to watch leaders and journalists provide expert insights
The post Big Banks Survive $708 Billion Loss Scenario in Fed Stress Test appeared first on BeInCrypto.


New forensic research published yesterday suggests that Hal Finney might not have been the second person to run a BTC node.
For 17 years, the man who tweeted “Running bitcoin” earned an unofficial title. In the eyes of many Bitcoin historians, Finney was the second person after creator Satoshi Nakamo to run a Bitcoin node.
Indeed, thousands of articles credit Finney as Bitcoin’s second participant.
However, it turns out that he might actually have been the third.
Although it is an indisputable, on-chain fact that Finney earned the first coinbase reward after Nakamoto for mining a block, forensic researcher Alex Waltz argues that another man was running a mining-capable node before Finney.
According to Waltz’s timestamps, although Dustin Trammell was running a node before Finney, an idiosyncratic network connectivity issue in Bitcoin software prior to version 0.1.3 prevented Trammell from connecting to Nakamoto’s nodes fast enough to outpace Finney.
A new timeline of Finney’s Bitcoin node
Waltz reconstructed a precise timeline of events during Bitcoin’s opening days.
Based on his analysis, and despite Trammell openly admitting that Finney mined a block before him, he believes that Trammell was running BTC mining software first.
Unfortunately, Trammell hadn’t remembered to flip on the software switch to actually mine. Still, according to Waltz, he was probably technically running the node software before Finney.
It’s important to remember that in January 2009, a Bitcoin wallet holder, Bitcoin node operator, and a BTC miner were often the same thing.
The early Bitcoin software client bundled wallet, node, and CPU mining software into one program. The node turned on immediately by default, the wallet was built-in, and mining began using that same software after a simple flip of a software switch.
Critically, running a passive, non-mining node wasn’t a common practice in 2009, despite its widespread popularity today.
Indeed, there’s at least an order of magnitude more non-mining Bitcoin node operators today than BTC miners. Not so in 2009.
Anyway, given this context, Waltz’s analysis leans on an email that Nakamoto sent to Trammell to place Trammell’s node ahead of Finney’s node in the revised Bitcoin timeline.
‘You couldn’t broadcast it to the network, so it didn’t get into the chain’
Here’s what happened.
Late in the day on January 12, 2009, Trammell emailed Nakamoto that he’d still been running Bitcoin software version 0.1.1 for a while, which earned an email response from Nakamoto urging Trammell to update to v0.1.3.
Importantly, that email response from Nakamoto on January 13, 2009 confirms that Trammell would have been experiencing a silent network communication outage with his out-of-date, v0.1.1 software.
“It’s the bug that was fixed in 0.1.3,” Nakamoto said.
“The communications thread would get blocked, so you would make connections, but they would go silent after a while.”
Nakamoto continued, “When you found a block, you couldn’t broadcast it to the network, so it didn’t get into the chain.”
As the creator of the software, Nakamoto apologized for the bug that misled Trammell on-screen about his node’s uptime status when in fact his node was disconnected.
“You weren’t receiving anything either to know that the network had gone on without you… This is all fixed in 0.1.3,” he wrote.
Satoshi ended his email to Trammell with a generous offer as a sort of apology for the bug: “If you give me your IP, I’ll send you some coins.”
That is a true moment of Bitcoin history.
With that, Waltz ends his argument for Trammell being the second operator of mining node software on the Bitcoin network.
Waltz then moves along to other curiosities about Bitcoin’s early weeks of operation.
Read more: This wild Satoshi theory links Paul LeRoux and Craig Wright
Who is Bitcoin’s second user: Hal Finney or Dustin Trammell?
Although the above argument isn’t irrefutably conclusive, it is somewhat compelling.
Not only does Trammell have evidence of unbroadcasted blocks from the earliest days of Bitcoin, which support Trammell’s claim about unreliable connectivity, he also has correspondence from Nakamoto acknowledging Trammell’s reason for not being able to broadcast blocks over the internet.
Plus, Nakamoto offers to compensate Trammell for his foregone coinbase reward.
It’s a true story that few people in the Bitcoin community have heard.
Now, of course, Trammell does not appear to have actually mined a block prior to Finney earning Bitcoin’s coinbase reward for Finney’s on-chain block 78 on January 10, 2009.
Still, Trammell might have been running a mining-capable node prior to block 78.
Obviously, whether running mining software while not mining constitutes being a “miner” will probably remain a matter of public debate.
Unseating Finney as Bitcoin’s second network participant will take even more heavy lifting by cryptographers and forensic investigators, yet Waltz has provided novel questions about the preeminence of Finney over less famous participants in the early Bitcoin community.
Rest in peace, Hal Finney
All of these questions would be easy to resolve if we could simply ask Finney himself. Sadly, Finney isn’t around anymore.
After a long battle with Lou Gehrig’s disease, he passed away in 2014.
There is, however, one last piece of surprising evidence.
Trammell Venture Partners, which in 2022 launched a Bitcoin venture capital fund series, describes Dustin Trammell as “the second node on the Bitcoin network” on its own website.
Because miner and node operator were essentially the same thing at that time, Trammell has therefore quietly claimed the second-to-Nakamoto title that Finney long received as a community-ascribed belief.
After Waltz published his analysis, Trammell admitted that he hadn’t switched on the mining function to outpace Finney in actually mining a block before block 78, yet per his own website, Trammell otherwise maintains that he was running a node before Finney.
Got a tip? Send us an email securely via Protos Leaks. For more informed news and investigations, follow us on X, Bluesky, and Google News, or subscribe to our YouTube channel.
Crypto World
Bitcoin (BTC) derivatives signal price panic. A weak U.S. inflation reading could trigger snapback: Crypto Daily


Besides, both core and headline readings may be seen as stale, or backward looking, considering the recent slide in oil prices. WTI crude futures have dropped to $70, significantly below the $100-plus level seen during the Iran war in March and April. Headline inflation is expected to hit 4.1%, the highest since early 2023, driven largely by energy prices.
“The main question is less whether both headline and core go up—they are widely expected to—but rather how “stale” these numbers already are,” economist Mohamed A. El Erian, the former CEO of Pimco, noted on X.
“These numbers come before the recent sharp fall in oil prices, which will result in lower headline inflation and ease some of the pressures on core. The question being debated is by how much, including whether May will prove to be the peak inflation month.”
Beyond inflation numbers, watch out for volatility in Strategy’s common shares, MSTR, and preferred stock, STRC, plus AI names on Wall Street. MSTR is flashing a well-recognized major bearish pattern (Check the Daily Signal). Stay alert!
Read more: For analysis of today’s activity in altcoins and derivatives, see Crypto Markets Today . For a comprehensive list of events this week, see CoinDesk’s “Crypto Week Ahead.”

Many altcoins, including Ripple’s cross-border token, joined bitcoin’s ride south yesterday, painting fresh lows. In XRP’s case, the asset dumped below $1.05 for the first time in nearly two years.
Many analysts caught the move, and some predicted an even more painful future. One extreme case envisions the token plunging below $0.20.
Most Critical Moment
The first popular analyst to weigh on XRP’s most recent moves was CasiTrades, outlining that the “move we’ve been waiting for is here.” Her comments coincided with the asset’s major correction yesterday that drove it to just under $1.05.
“The market is dropping hard, exactly the type of move we’ve been preparing for, and XRP is approaching the major support levels we’ve been tracking.”
She, like other analysts, believes the most important level to watch now for the cross-border token is the psychological $1.00 line. If it falls, she said she has put buy orders at $0.93, but there’s an even lower target at $0.87, where the macro Fib 0.854 sits. Consequently, she concluded that XRP is currently in its “most critical moment” in this market cycle.
“Correction is approaching its final level. The fear will be LOUD! People will likely start calling for lower and lower prices as the level is reached. They’ll tell you the market is going to zero. But don’t let someone else’s fear cause you to miss your own opportunity,” CasiTrades added.
She concluded that every major trend begins when the broader market’s sentiment is “at its worst.” The ongoing correction is “doing exactly what it should,” which makes it the “perfect market structure.”
Ali Martinez was even more bearish on XRP’s next targets. After asking his followers at which levels they plan to buy the asset, he showed a macro chart outlining a potential breakdown to $0.70, but there are also two highly unfavorable targets of $0.32 and even $0.15. Recall that XRP hasn’t traded at such low levels since the COVID-19 crash.
On the Flipside
Despite the current market sentiment, other analysts, such as Javon Marks, remain bullish on XRP’s future performance. As recently reported, the market observer with over 60,000 followers on X argued that the asset could aim for double-digit price levels during the next bull run, and outlined $17 as the potential top.
Ted Pillows was also quite optimistic, indicating that XRP has formed a similar pattern to its 2024 rally when it rocketed from $0.50 to $3.30 in months. If history repeats, he believes the asset could top at almost $8.50.
The post Ripple’s XRP Faces ‘Most Critical Moment’ in This Cycle as Analysts Outline Buy Levels appeared first on CryptoPotato.

Key Highlights
- Meta Platforms is transitioning content moderation responsibilities to artificial intelligence powered by large language models
- Approximately 50% of content review tasks are currently managed by AI systems in 2026
- The social media giant aims to exceed 90% AI-driven moderation for specific content categories before year’s end
- This initiative aligns with broader cost reduction efforts as CEO Mark Zuckerberg invests heavily in AI development
- The company has eliminated approximately 8,000 positions (representing 10% of total staff) while maintaining Strong Buy analyst consensus at $815.82 target price
Meta Platforms is aggressively accelerating its transition toward AI-driven content moderation. The tech behemoth, valued at $1.4 trillion, is systematically replacing human content reviewers with advanced large language models throughout its social media ecosystem, based on reporting from the Financial Times this Thursday.
META shares experienced a 0.81% decline during trading.
The social media company has already transitioned approximately half of all human content moderation requests to artificial intelligence systems throughout this year. Industry observers anticipate this percentage could surge beyond 90% for particular content classifications prior to 2026’s conclusion.
This represents a significant timeline acceleration. Meta had previously communicated intentions to maintain human reviewers as part of its moderation framework, with initial projections suggesting a multi-year phased approach.
Traditionally, Meta deployed a combination of proprietary automated detection systems alongside human moderators — including external contract workers — to identify posts and advertisements violating platform policies. User dispute resolutions were similarly managed by human staff.
Currently, artificial intelligence systems are assuming the majority of these responsibilities.
Zuckerberg’s Vision for an AI-Powered Organization
The content moderation transformation represents one component of a comprehensive cost optimization and AI investment initiative championed by CEO Mark Zuckerberg.
Meta recently reduced its global employee count by 10%, eliminating roughly 8,000 positions. Zuckerberg has publicly attributed artificial intelligence technologies with generating substantial productivity improvements company-wide.
“I think that 2026 is going to be the year that AI starts to dramatically change the way that we work,” Zuckerberg said publicly.
The organization has allocated billions toward acquiring AI expertise and infrastructure development, with Zuckerberg articulating his ambition to create “personal superintelligence” — highly customized AI assistants tailored to individual users.
Reports also indicate Meta attempted implementing monitoring systems to track U.S.-based employees’ screen activity for productivity assessment purposes, though the initiative was abandoned following employee resistance.
Concerns Regarding Implementation Speed and Platform Security
The aggressive transition has encountered obstacles. A recent AI chatbot security incident at Meta has sparked concerns about whether the company is advancing too rapidly with AI deployment.
Meta’s artificial intelligence tools now serve multiple functions beyond standard moderation, including detecting fraudulent schemes and eliminating prohibited content. These responsibilities continue expanding.
The company’s moderation infrastructure has historically relied upon third-party contractors managing complex cases requiring nuanced judgment. The impact on these positions as AI assumes greater responsibilities remains unclear.
Wall Street analysts maintain strong confidence in the stock. META carries a Strong Buy consensus rating supported by 31 Buy recommendations and 6 Hold ratings from 37 analysts surveyed during the past three months.
The consensus price target stands at $815.82, suggesting approximately 46% potential appreciation from present trading levels.
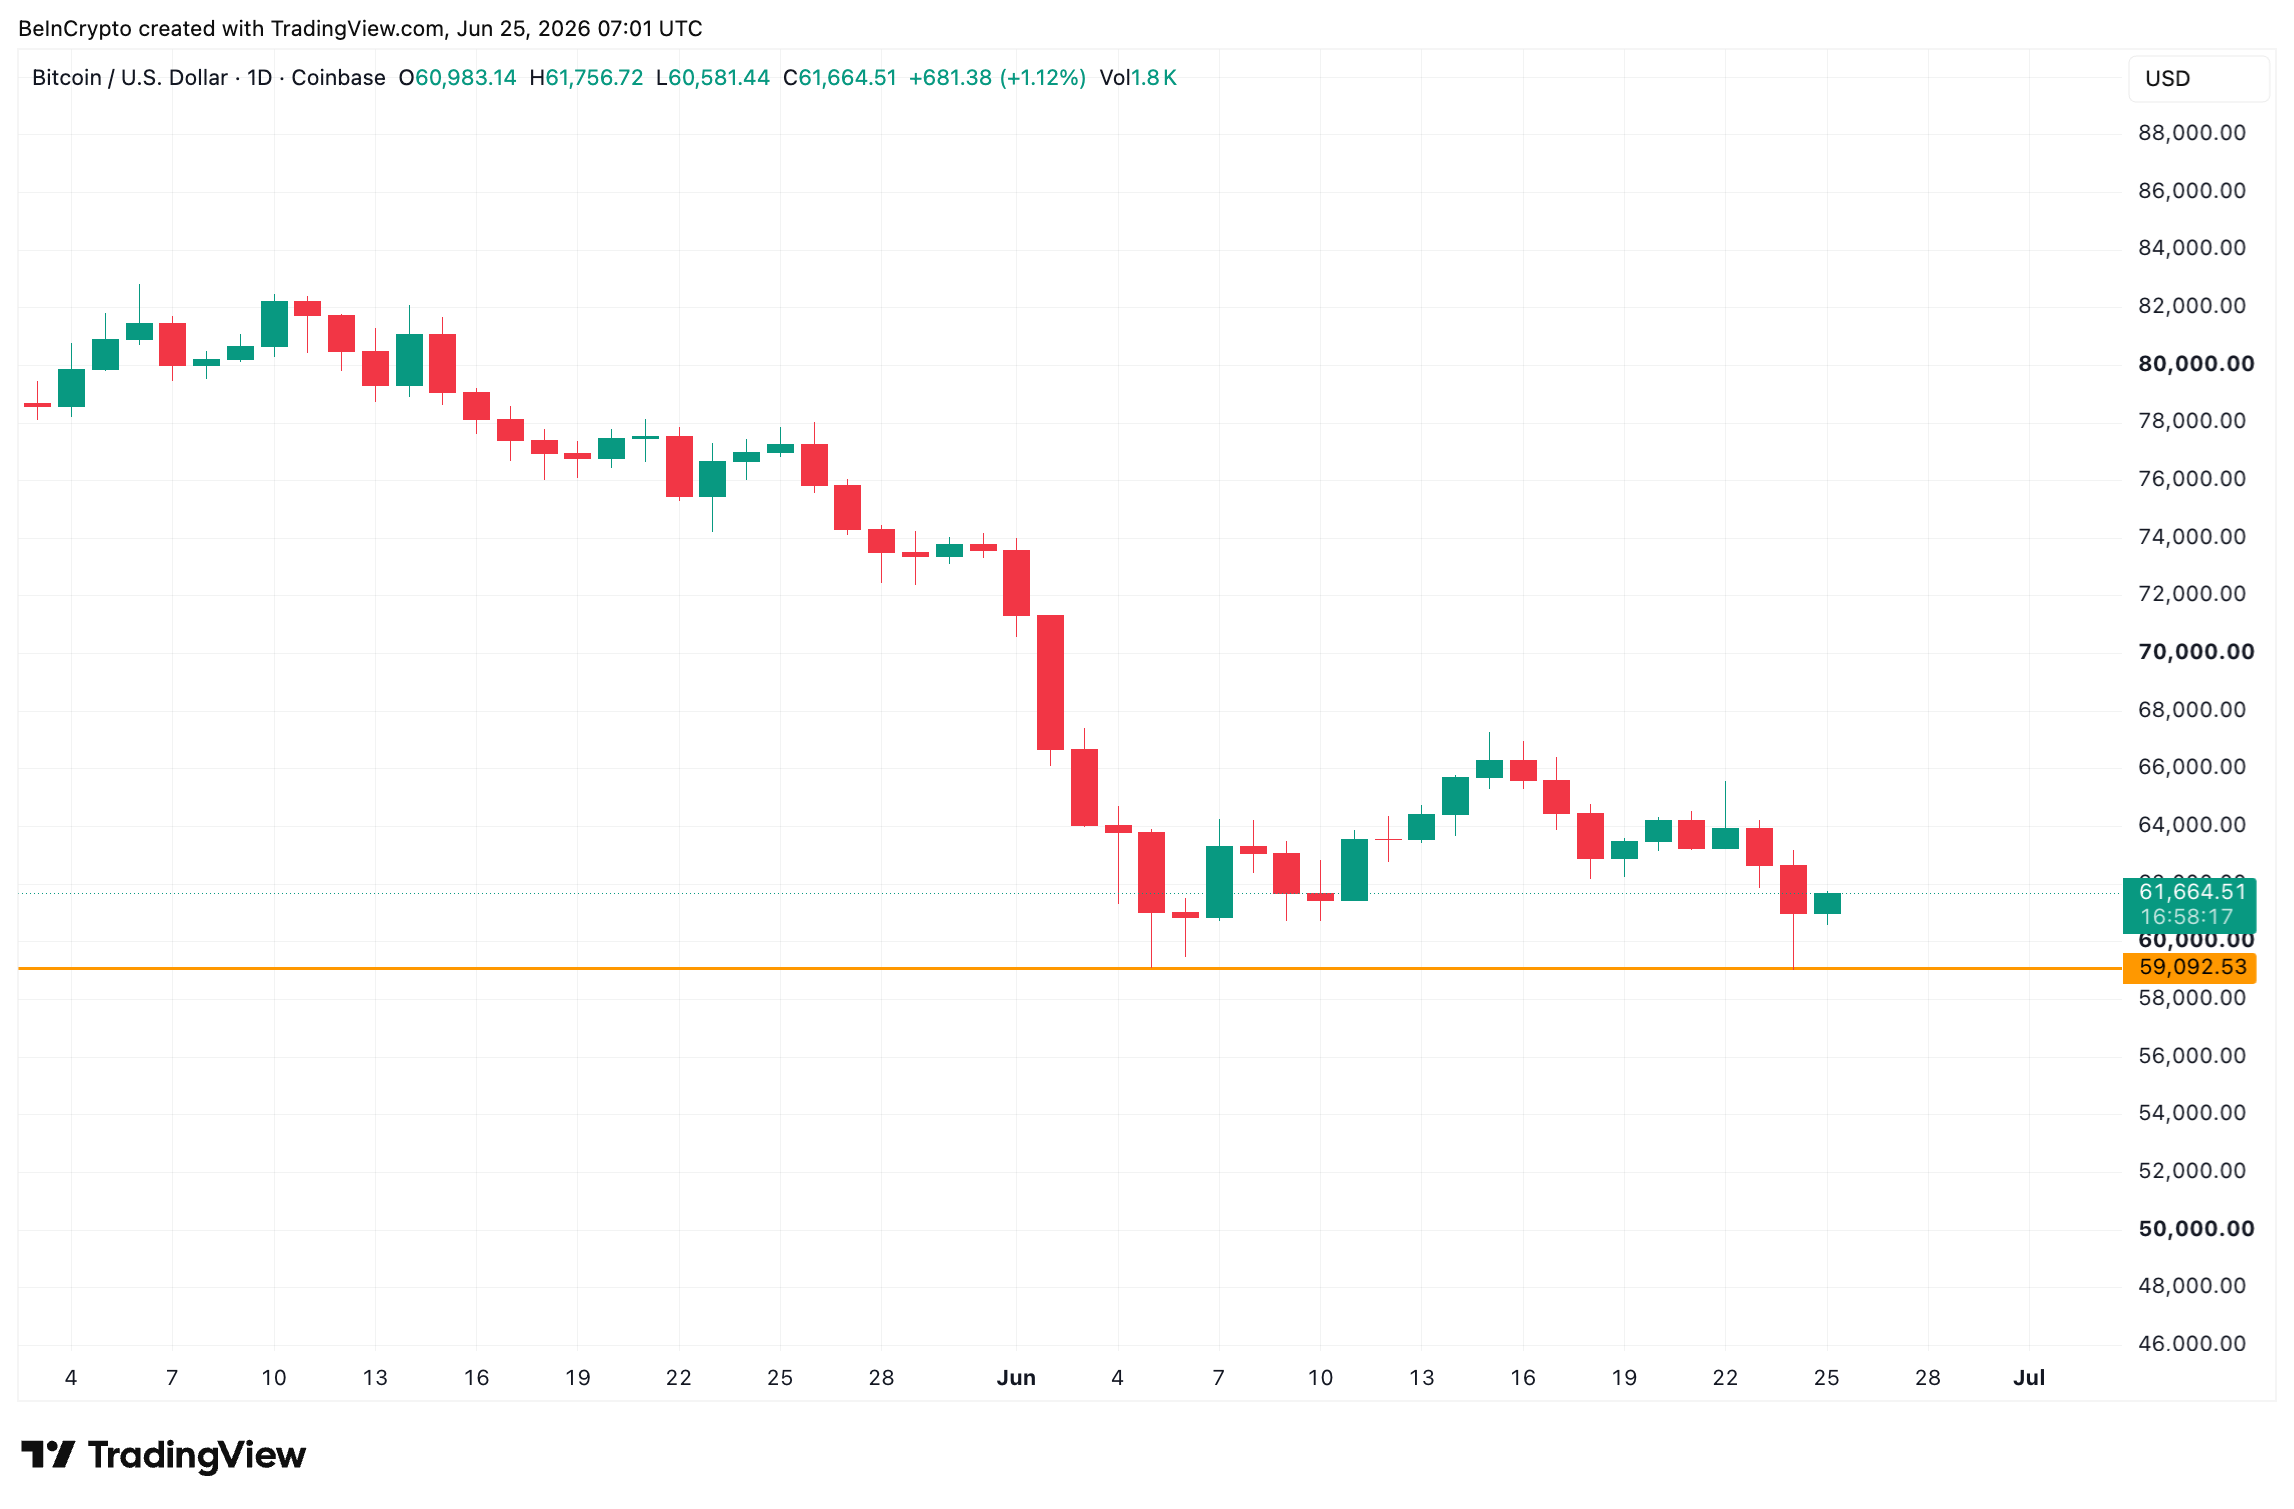
Bitcoin has come under the influence of several factors simultaneously. The wave of selling at the beginning of June was linked to Strategy’s first disclosed Bitcoin sale in several years, a prolonged series of outflows from spot ETFs, and a large transfer of funds from a Mt. Gox wallet to a new address. The run of outflows from US spot Bitcoin ETFs became one of the longest and largest since these products were launched in January 2024.
Bloomberg Intelligence analyst James Seyffart noted that around $9 billion has exited Bitcoin ETFs since their peak, although most long-term fund investors have chosen to maintain their positions.
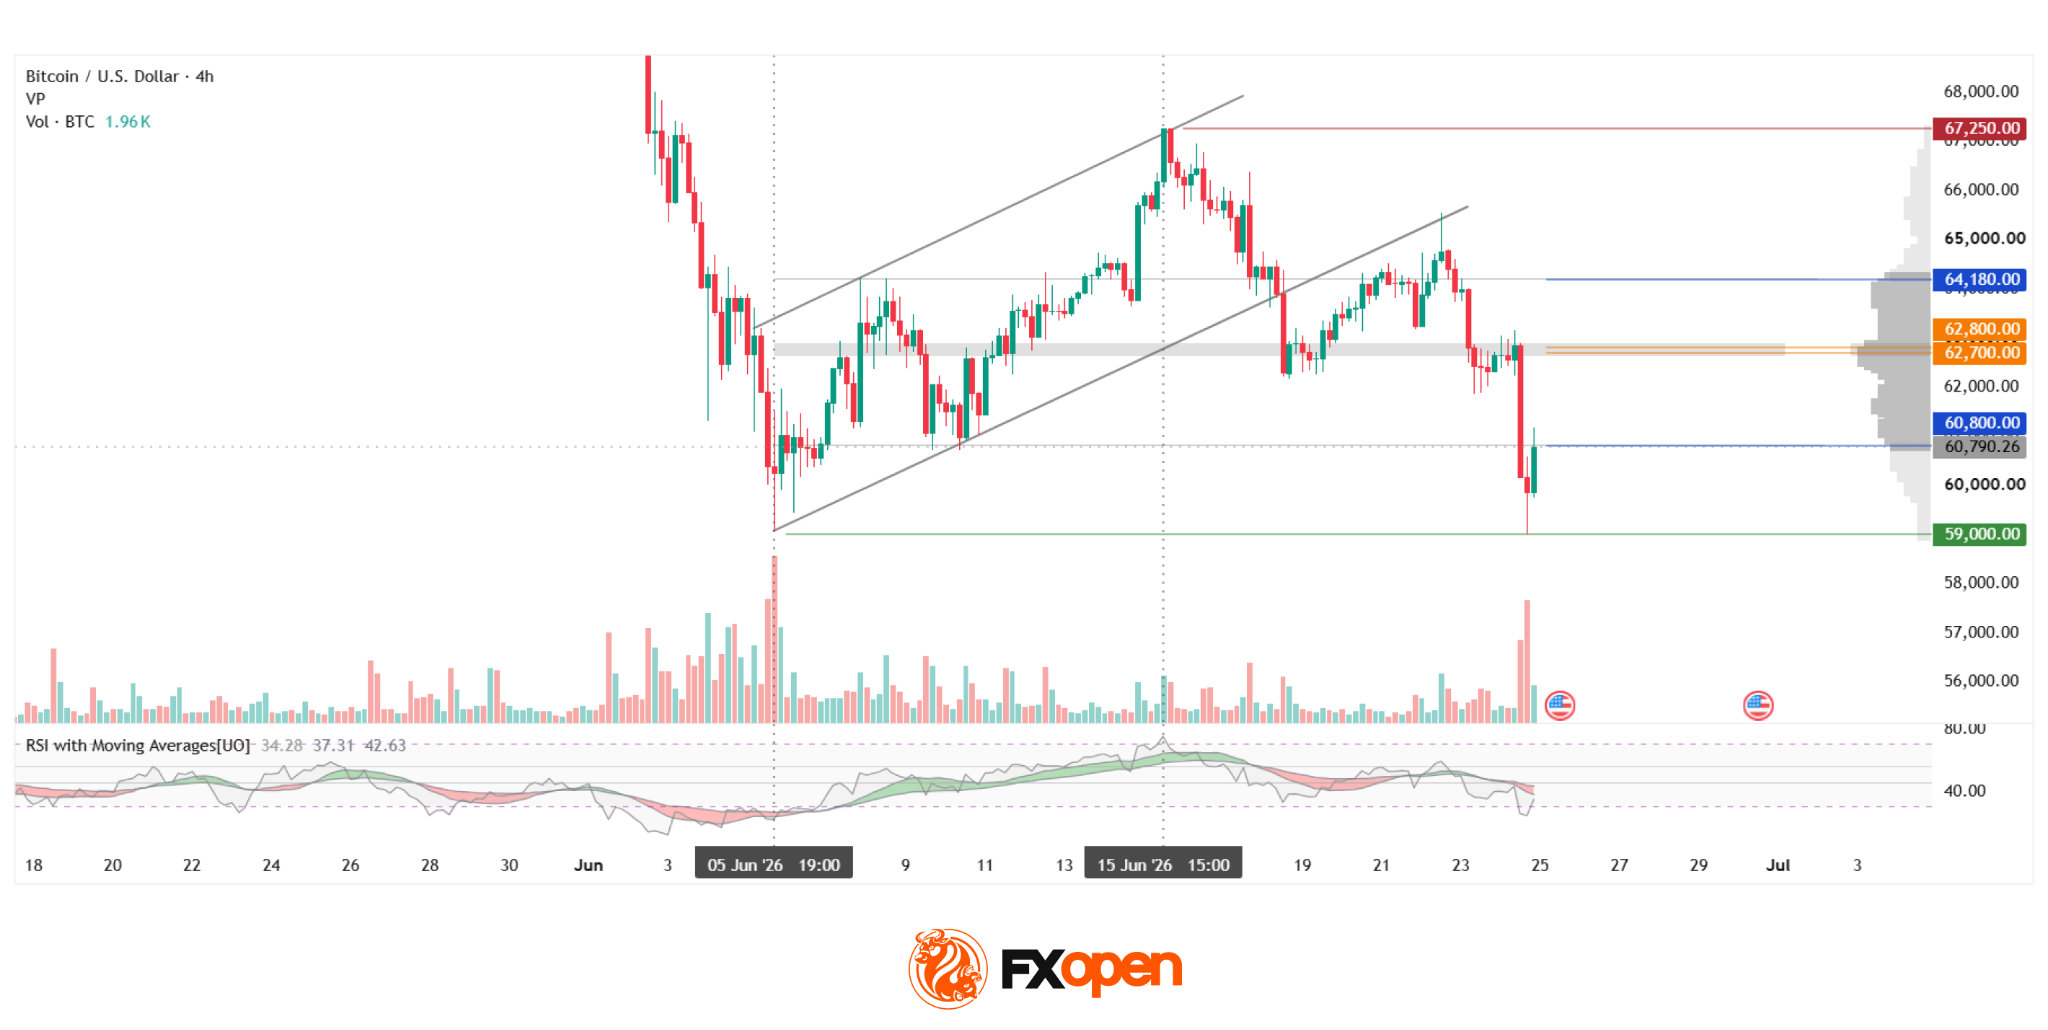
Technical picture
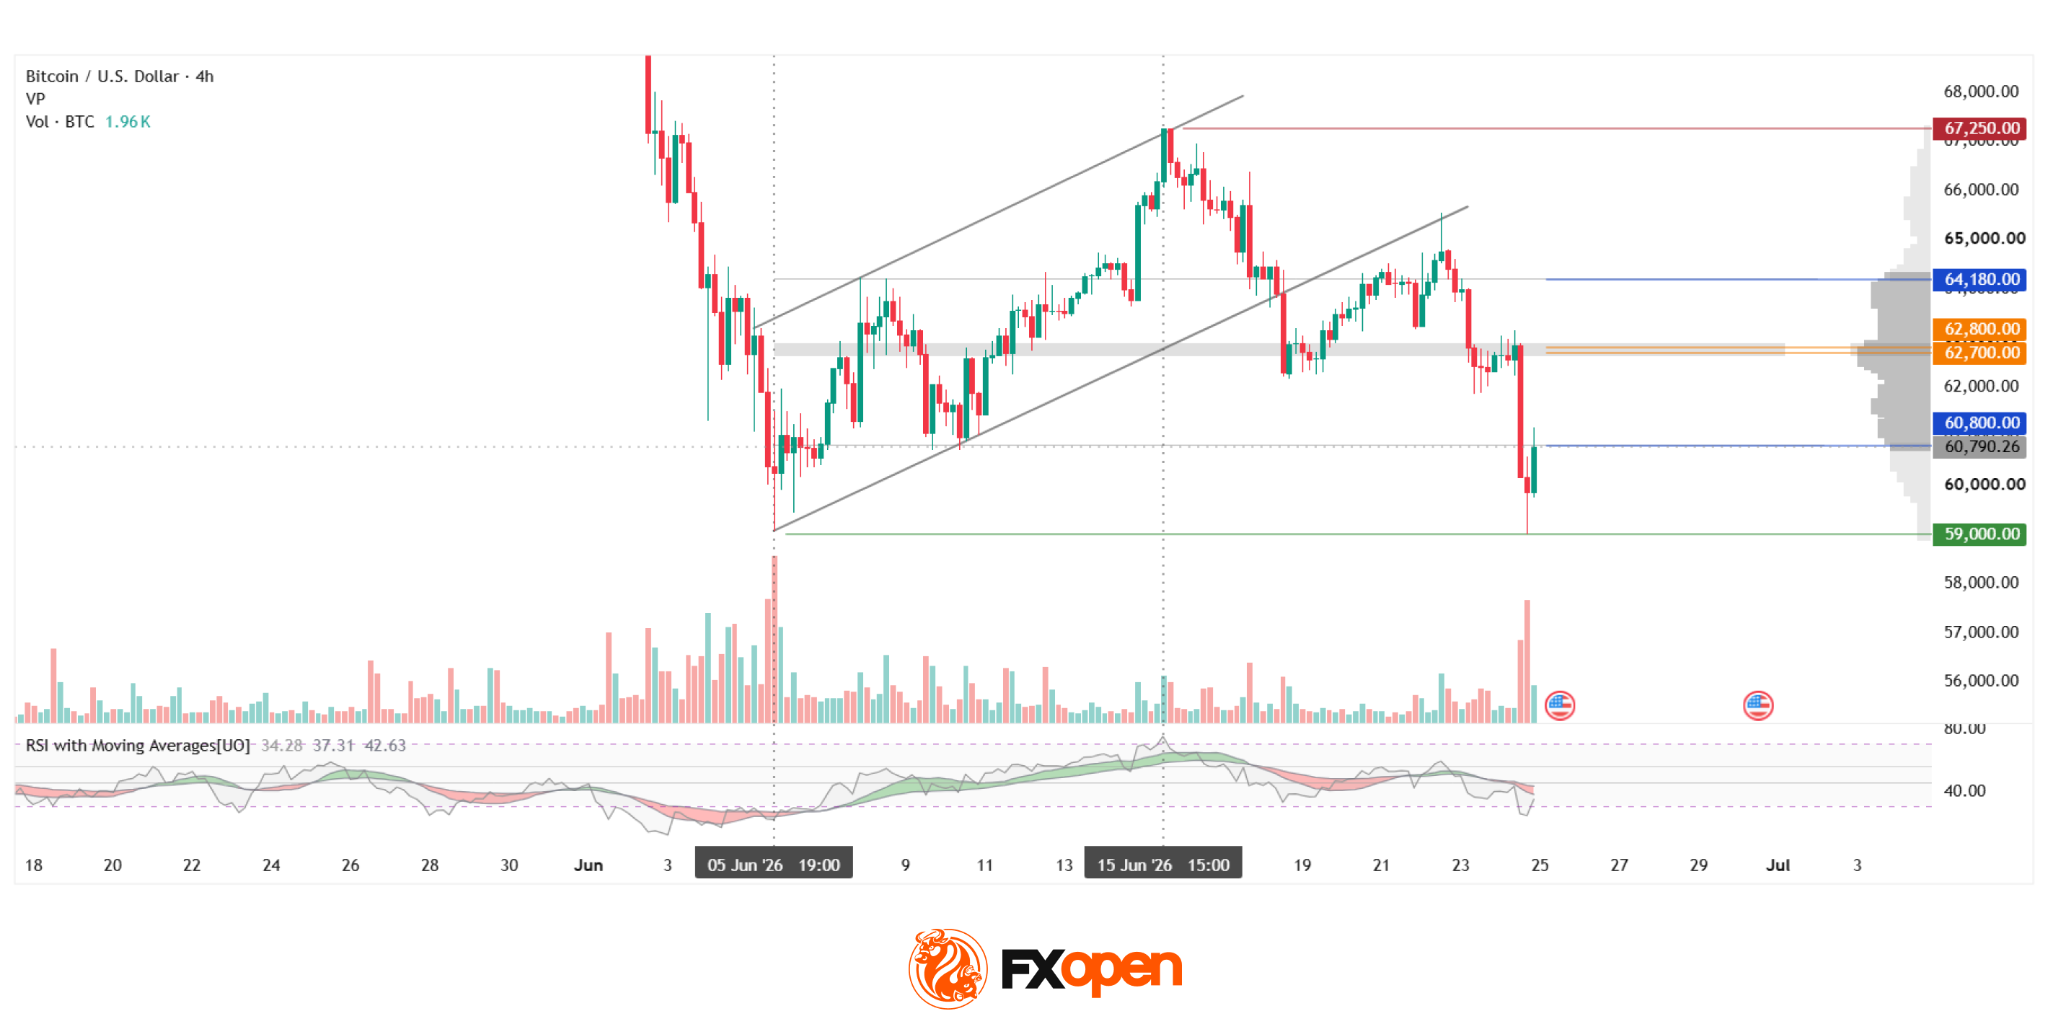
On the H4 chart of BTC/USD, an ascending corrective channel formed after an impulsive decline towards the $59,000 area. Price subsequently advanced to the upper boundary of the channel at $67,250, but failed to hold those levels. The channel was then broken to the downside, with quotations moving towards a test of the lower boundary of the current profile at $60,800.
The Point of Control (POC) is concentrated in the $62,700–$62,800 area and could attract market attention if price rebounds from the lower boundary.
The upper boundary of the profile is located near $64,180 and could act as resistance if the POC zone is breached. The RSI + MAs indicator stands at 34, 37 and 42 respectively. The oscillator remains below the neutral zone but has recovered from oversold territory, while the moving averages remain bearish and continue to point lower.
At the same time, vertical volume surged sharply during the decline on 24 June, which may have been interpreted by market participants as a sign that the local downtrend was nearing completion.
Summary
The unusually high volume recorded on 24 June, combined with the current RSI position, does not provide strong confirmation that the latest local impulse will continue, although the moving averages remain pointed lower for now.
Further price action may be influenced by upcoming US inflation data, as well as flows into Bitcoin ETFs, which experienced record outflows during June.
FXOpen offers the world’s most popular cryptocurrency CFDs*, including Bitcoin and Ethereum. Floating spreads, 1:2 leverage — at your service (additional fees may apply). Open your trading account now or learn more about crypto CFD trading with FXOpen.
*Important: At FXOpen UK, Cryptocurrency trading via CFDs is only available to our Professional clients. They are not available for trading by Retail clients. To find out more information about how this may affect you, please get in touch with our team.
This article represents the opinion of the Companies operating under the FXOpen brand only. It is not to be construed as an offer, solicitation, or recommendation with respect to products and services provided by the Companies operating under the FXOpen brand, nor is it to be considered financial advice.
Quick Summary
- Precious metal breached the $4,000 threshold for the first time since November 2025
- Yellow metal has plummeted approximately 30% from its January peak of $5,595.46
- Dollar strength at 13-month highs is pricing out international purchasers
- Traders now see 66% probability of Federal Reserve tightening by September
- Declining geopolitical risk premium has diminished safe-haven buying interest
The precious metal market is experiencing significant downward pressure as the strengthening U.S. dollar combined with mounting anticipation of Federal Reserve monetary tightening drives prices to their lowest point in seven months.
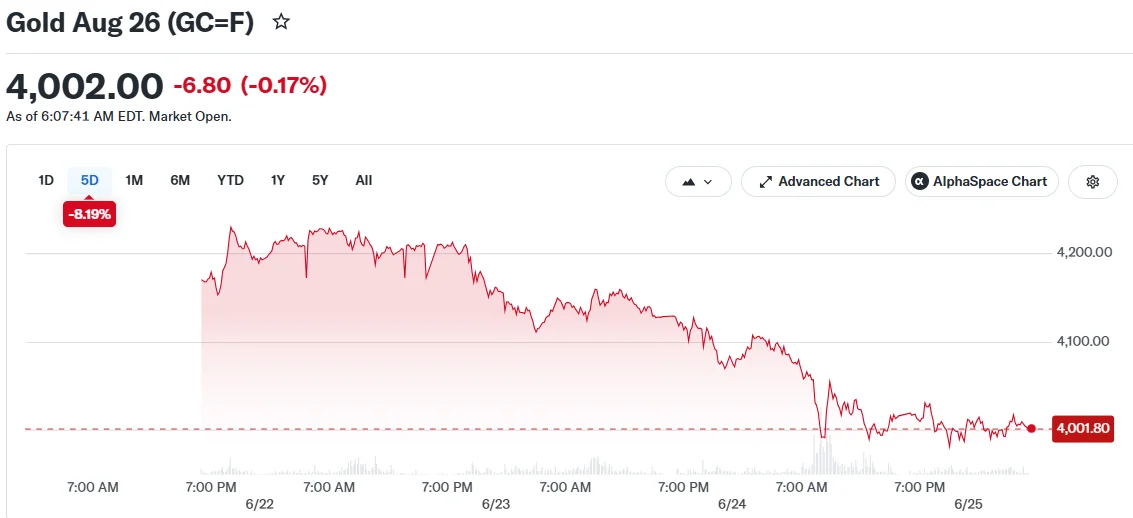
Spot gold declined 0.2% to settle at $3,984.83 per ounce during Thursday’s trading session. U.S. Gold Futures remained largely unchanged, hovering around the $4,008 level.

The yellow metal crashed through the psychologically significant $4,000 barrier on Wednesday, marking its first breach of this level since November 2025. Market participants had been closely monitoring this threshold as a critical support zone.
The precious metal has experienced a dramatic decline of nearly 30% from its all-time high of $5,595.46 recorded in January 2026. This represents a substantial correction within a relatively compressed timeframe.
The U.S. dollar’s performance has emerged as a primary catalyst behind the selloff. The currency has reached a 13-month peak following six consecutive sessions of appreciation.
A robust dollar increases the cost of gold for international buyers operating in alternative currencies. This dynamic typically suppresses demand for the precious metal.
Federal Reserve Policy Expectations Pressure Precious Metals
Market participants are currently assigning approximately one-third probability to an interest rate increase in July. These odds escalate to 66% for policy tightening by September, based on CME FedWatch analytical data.
Elevated interest rates create headwinds for gold since the commodity generates no income stream. As rates climb, investors can secure superior returns from fixed-income securities and cash equivalents, diminishing gold’s relative appeal.
ANZ research team noted that worries surrounding persistent inflationary pressure have triggered a “re-rating of monetary policy expectations.” They further observed that the Federal Reserve’s hawkish posture seems to have “derailed the debasement trade” that previously supported gold valuations.
ING market strategists indicated that gold’s underperformance demonstrates how market sentiment has pivoted away from defensive positioning toward focusing on the implications of rising rates and restrictive financial conditions.
Diminishing Geopolitical Risk Premium
Decreasing tensions across Middle Eastern regions have contributed to the downward trajectory. Advancement in U.S.-Iran diplomatic negotiations has eliminated portions of the risk premium that had underpinned gold valuations during the earlier months of this year.
Weakening oil prices have reinforced this transition. Investors demonstrate reduced appetite for gold as an insurance mechanism when geopolitical uncertainties appear to be subsiding.
Market observers are now directing attention toward Friday’s scheduled release of U.S. Personal Consumption Expenditures figures. The PCE represents the Federal Reserve’s prioritized inflation metric and could significantly influence projections for subsequent policy adjustments.
Silver registered a modest 0.1% gain to reach $57.50 per ounce on Thursday, recovering slightly after dropping more than 6% in the previous trading session. ING analysts observed that several of silver’s most robust demand catalysts are showing signs of weakening.
Platinum decreased 0.3% to settle at $1,581.60 per ounce. Copper futures advanced approximately 1.7% on the London Metal Exchange to reach $13,255.95 per ton.
Gold continues facing downward momentum with limited visible catalysts to reverse the prevailing trend ahead of the PCE data release.
Crypto World
CoinEx denies claims it served as $3.84 billion gateway to sanctioned Iranian crypto firms


Blockchain intelligence firm TRM Labs said CoinEx served as a gateway for the crypto sector in Iran, having traced more than $3.84 billion in flows between the exchange and sanctioned Iranian entities in the last seven years.
TRM Labs said CoinEx became the single biggest trading partner of Iran’s largest crypto exchange Nobitex, which accounted for around $2.7 billion of the flows, according to a report published Wednesday.
CoinEx had direct transaction exposure with more than 60 Iranian crypto platforms, according to TRM Labs’ analysis, which argued that this patterns suggested a coordinated relationship rather than organic market activity.
TRM Labs identified CoinEx exposure to several terrorist-linked entities, such as $6 million in transactions involving wallets associated with the Islamic Revolutionary Guard Corps and $374,000 of exposure associated with Palestinian Islamic Jihad.
The U.S. Treasury sanctioned an array of Iranian crypto exchanges as part of its campaign against the country’s government at the start of this month, including Nobitex, Wallex, Bitpin and Ramzinex, all of which are cited in TRM Labs’ report.

Fantasy Baseball: Nolan McLean, Tarik Skubal concerns

OPPO’s June ColorOS 16 Update Adds Dual Bluetooth Audio Sharing

Shiite Muslims mark holy day of Ashoura after months of war


-

 Fashion6 days ago
Weekend Open Thread: Miami – Corporette.com
-

 Entertainment5 days ago
Renter of Home in Anne Heche Crash Denies Settlement With Son
-
 Sports2 days ago
Two goals and an assist by sheer aura: Cristiano Ronaldo just entered the World Cup chat
-

 Tech3 days ago
Microsoft accidentally kills epic Outlook email threads
-

 Business5 days ago
Soccer-U.S. defends Iran World Cup travel restrictions, says discussions ongoing
-

 Politics5 days ago
Andy Burnham and the meaning of Makerfield
-
Crypto World1 day ago
Bitcoin (BTC) Dips Below $62K, Ethereum (ETH) Plunges 6% Daily: Market Watch
-

 Politics7 days ago
BBC Reporter Discusses Cross Party Criticism Of Trumps Iran Deal
-

 Crypto World1 day ago
Securitize Wraps Roubini's SEC-Registered ETF as Dubai VARA Digital Security
-
Business1 day ago
Entergy settles forward sale agreements, raises $672 million in cash proceeds
-

 NewsBeat6 days ago
Keir Starmer Allies Question His Chances For No 10
-
 Business5 days ago
Wall Street Week Ahead: Investors see Micron earnings as pulse check of AI rally momentum
-

 Tech7 days ago
AWS enters the context layer race with a graph that learns from agents, not manual curation
-
 Crypto World5 days ago
Can Charles Hoskinson Really Rescue Cardano?
-

 Crypto World5 days ago
HIVE shares jump as $220M AI deal speeds Bitcoin mining pivot
-

 Crypto World5 days ago
Jake Chervinsky accuses CME of protecting derivatives monopoly
-

 Entertainment5 days ago
Jose Alvarado Wants Taylor Swift at More Knicks Games
-
 Tech4 days ago
Signal’s Meredith Whittaker says AI chatbots ‘are not your friends’ and calls Copilot agents a backdoor
-

 Tech3 days ago
Nearly 7,000 fake Amazon domains registered ahead of Prime Day 2026, researchers warn
-

 Sports6 days ago
FIFA World Cup 2026: Canada beat 9-men Qatar 6-0 to register first ever win | FIFA World Cup 2026
You must be logged in to post a comment Login