
Crypto World
Bitcoin: Corrective Channel Broken as Traders Turn More Active
Bitcoin has come under the influence of several factors simultaneously. The wave of selling at the beginning of June was linked to Strategy’s first disclosed Bitcoin sale in several years, a prolonged series of outflows from spot ETFs, and a large transfer of funds from a Mt. Gox wallet to a new address. The run of outflows from US spot Bitcoin ETFs became one of the longest and largest since these products were launched in January 2024.
Bloomberg Intelligence analyst James Seyffart noted that around $9 billion has exited Bitcoin ETFs since their peak, although most long-term fund investors have chosen to maintain their positions.
Technical picture
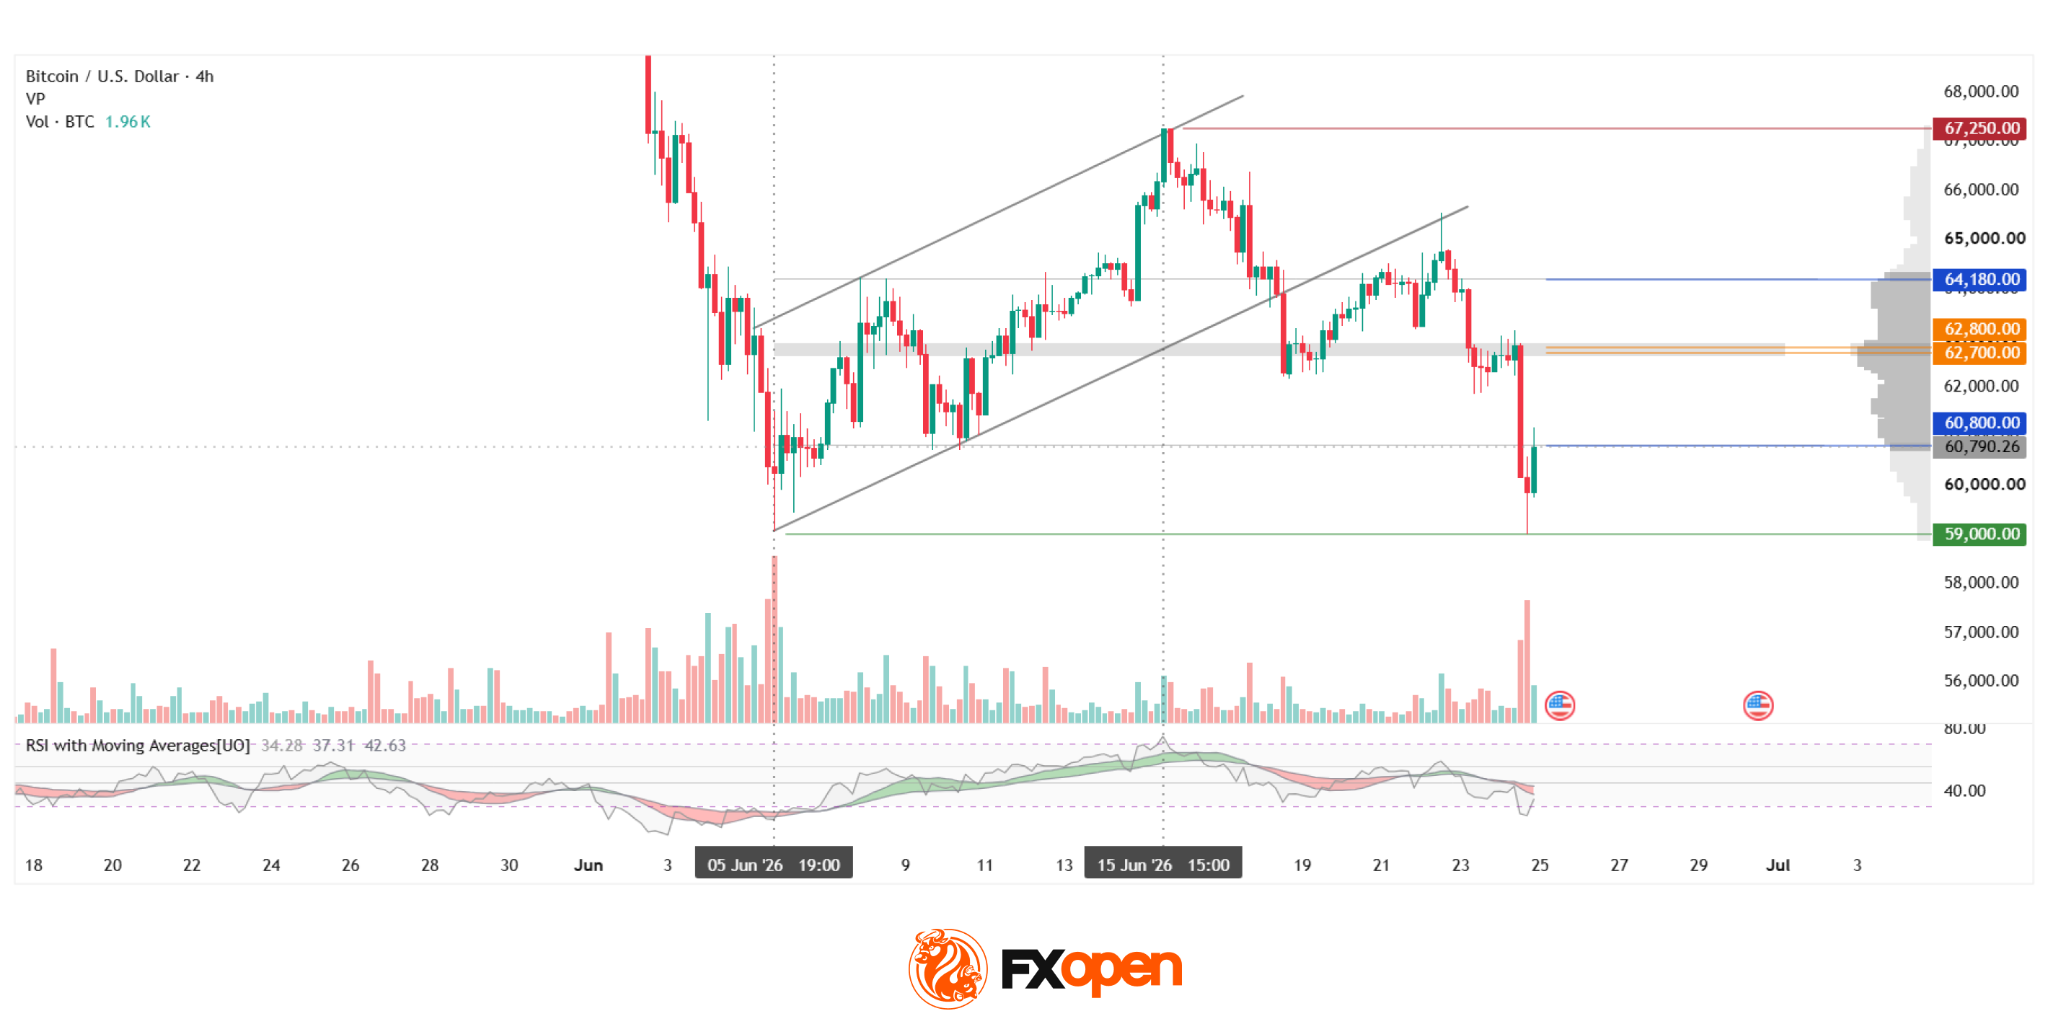
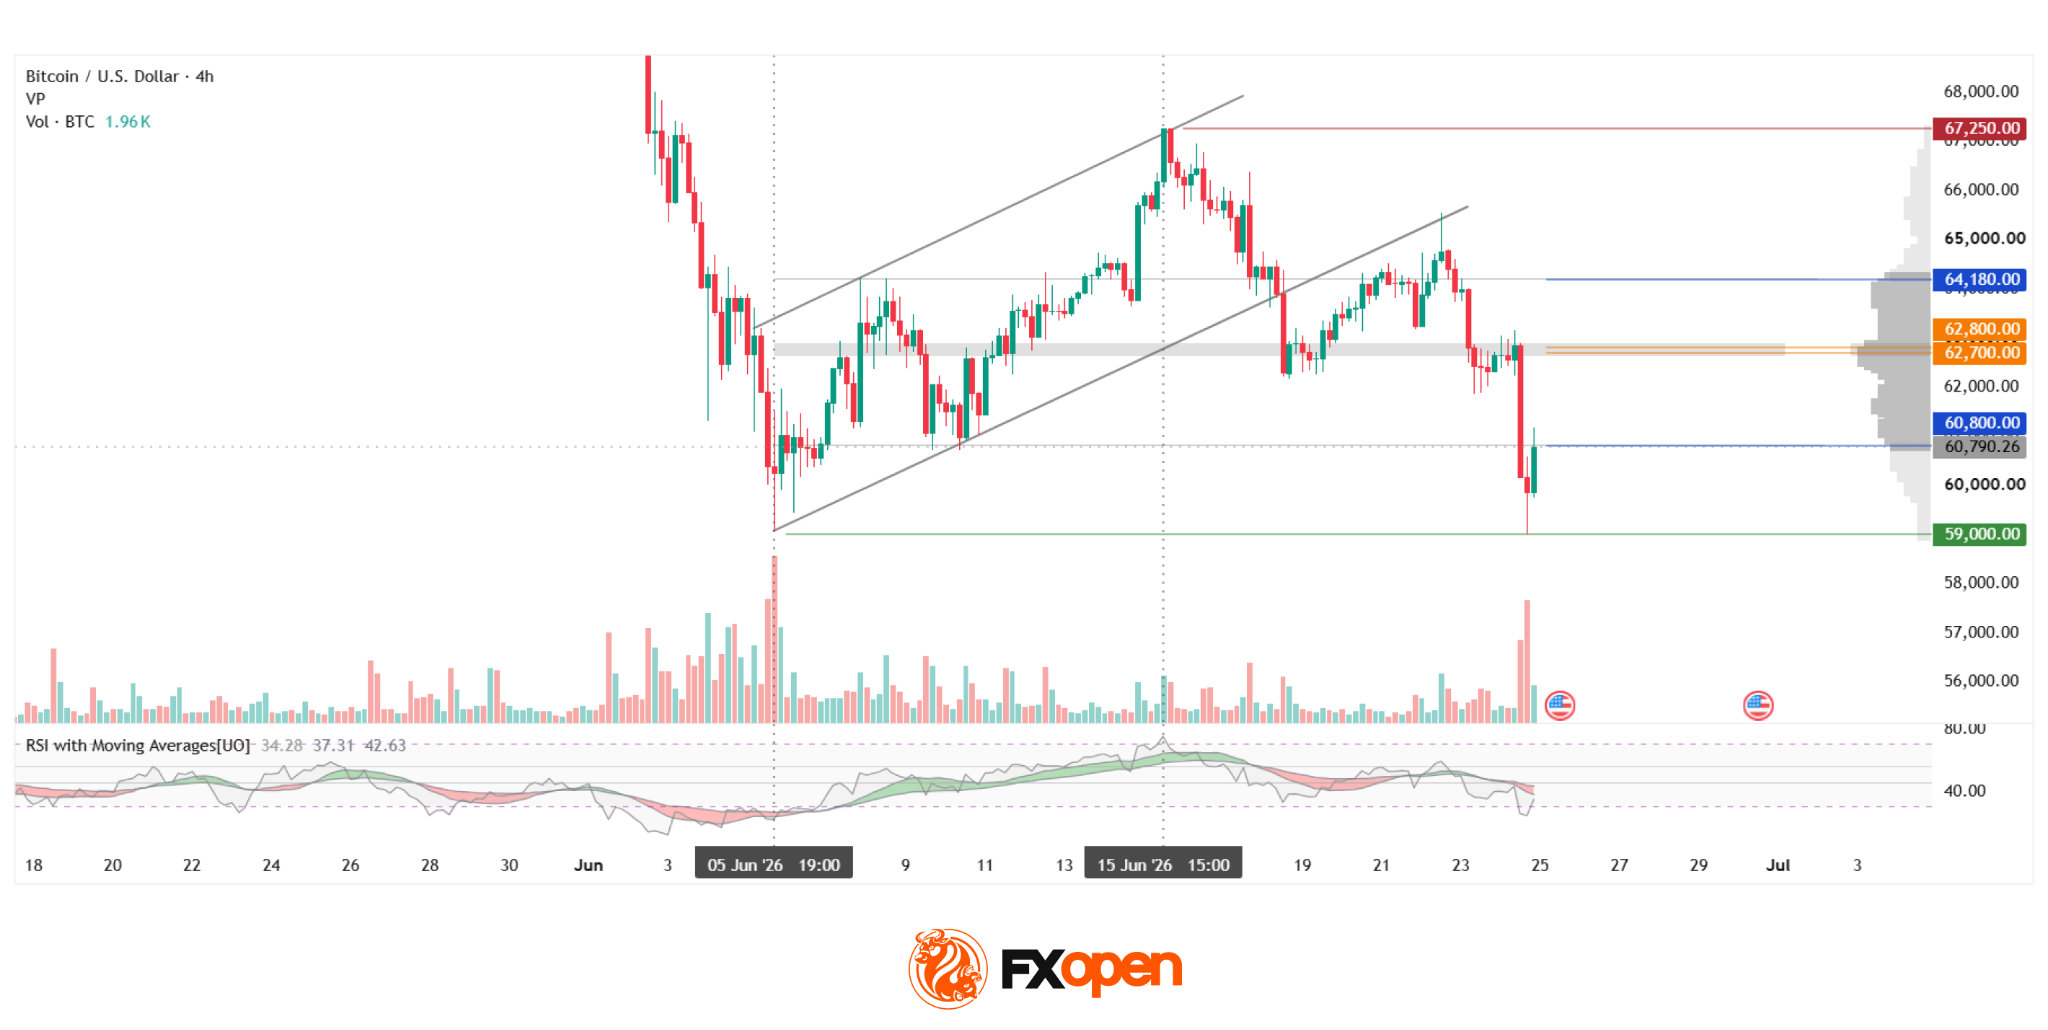
On the H4 chart of BTC/USD, an ascending corrective channel formed after an impulsive decline towards the $59,000 area. Price subsequently advanced to the upper boundary of the channel at $67,250, but failed to hold those levels. The channel was then broken to the downside, with quotations moving towards a test of the lower boundary of the current profile at $60,800.
The Point of Control (POC) is concentrated in the $62,700–$62,800 area and could attract market attention if price rebounds from the lower boundary.
The upper boundary of the profile is located near $64,180 and could act as resistance if the POC zone is breached. The RSI + MAs indicator stands at 34, 37 and 42 respectively. The oscillator remains below the neutral zone but has recovered from oversold territory, while the moving averages remain bearish and continue to point lower.
At the same time, vertical volume surged sharply during the decline on 24 June, which may have been interpreted by market participants as a sign that the local downtrend was nearing completion.
Summary
The unusually high volume recorded on 24 June, combined with the current RSI position, does not provide strong confirmation that the latest local impulse will continue, although the moving averages remain pointed lower for now.
Further price action may be influenced by upcoming US inflation data, as well as flows into Bitcoin ETFs, which experienced record outflows during June.
FXOpen offers the world’s most popular cryptocurrency CFDs*, including Bitcoin and Ethereum. Floating spreads, 1:2 leverage — at your service (additional fees may apply). Open your trading account now or learn more about crypto CFD trading with FXOpen.
*Important: At FXOpen UK, Cryptocurrency trading via CFDs is only available to our Professional clients. They are not available for trading by Retail clients. To find out more information about how this may affect you, please get in touch with our team.
This article represents the opinion of the Companies operating under the FXOpen brand only. It is not to be construed as an offer, solicitation, or recommendation with respect to products and services provided by the Companies operating under the FXOpen brand, nor is it to be considered financial advice.


US spot Bitcoin ETFs recorded $32.1 million in inflows on Wednesday despite Bitcoin dipping below $64,000, ending a four-session outflow streak.

Crypto industry watchers are increasingly pointing to revenue concentration as a sign that the market is moving into a new phase of consolidation—one where only a few protocols can command a disproportionate share of application earnings.
In a Wednesday post on X, Lorenzo Valente, a research associate at ARK Invest, argued that investors have grown more selective, channeling capital toward projects and platforms with clear product-market fit while leaving weaker offerings to struggle, shut down, or be absorbed.
Key takeaways
- ARK Invest’s Lorenzo Valente says crypto is entering a “biggest consolidation phase yet,” driven by more selective capital allocation.
- Valente cites that Hyperliquid and Pump.fun account for about 67% of total crypto application revenue.
- Including Ethena’s synthetic dollar protocol, the top three capture nearly 80% of application revenue, indicating record concentration.
- Valente expects the trend to intensify, with more mergers, bankruptcies, shutdowns, and acqui-hires likely in the months ahead.
- Recent exchange wind-down announcements reinforce the broader narrative that not all platforms can withstand current market pressures.
Why revenue concentration is becoming the center of gravity
Valente’s core thesis is that consolidation is no longer just about user growth or brand dominance—it’s increasingly about where revenue accrues. According to his post, the industry is witnessing an accelerating shift toward a small set of “dominant protocols,” while projects that fail to demonstrate strong traction find it harder to raise funds or sustain operations.
To illustrate the point, Valente highlighted two platforms—Hyperliquid, a perpetual futures exchange, and Pump.fun, a memecoin launchpad—claiming they together generate roughly 67% of total crypto application revenue. He further said that when Ethena is included, the combined share of the top three rises to nearly 80%, underscoring what he described as record-high concentration across the sector.
The practical implication for market participants is straightforward: when revenue becomes clustered, competition intensifies for everyone else. New entrants and smaller platforms face an uphill battle—not only to attract users, but to earn the kind of sustained cash flow that tends to draw institutional attention and deepen liquidity.
A consolidation cycle that may look like closures and dealmaking
While Valente acknowledged the disruption that such concentration can bring, he framed the shakeout as potentially constructive for the broader ecosystem. He expects the trend to accelerate, predicting more mergers and acquisitions as well as operational outcomes such as Chapter 11 bankruptcies, project shutdowns, and acqui-hires.
That outlook matters for investors because it reframes “risk” from being purely price-driven to being increasingly structural: business models, revenue quality, and sustainable demand may determine survival more than short-term promotional cycles. For founders and teams, it suggests that consolidation could translate into fewer independent routes to scale—and more emphasis on being acquired, integrated, or acquired talent through acqui-hire arrangements.
At the same time, it remains uncertain how quickly the consolidation will play out across all categories of crypto infrastructure. Valente’s argument hinges on revenue dominance at the application layer, but the industry could still experience pockets of strong growth outside the top performers depending on regulation, product innovation, and changes in user behavior.
Exchange wind-downs add weight to the consolidation narrative
Valente’s remarks arrive as several exchanges have announced plans to wind down operations—developments that echo his broader consolidation claim by showing pressure on parts of the trading ecosystem.
Last week, BitMEX said it would shut down its exchange in September following a strategic review by its owner, HDR Global Trading. The exchange reportedly accelerated delisting of trading pairs and derivative contracts, citing insufficient trading interest before the decision to close.
In a separate case, BitMart announced it would end trading services on Aug. 26 and then wind down fully in January 2027. The company said the move was based on a review of operating conditions, the market environment, and its future strategic direction.
Beyond closures, consolidation is also showing up through acquisitions and expansion. Earlier this month, Bybit launched a locally operated exchange in Indonesia after acquiring a majority stake in NOBI, a move aimed at strengthening its footprint in one of Asia’s largest crypto markets. That contrast—some platforms exiting while others consolidate through expansion—reflects a market that is sorting winners and losers, rather than evenly distributing momentum.
What investors and builders should watch next
If Valente’s concentration thesis holds, the most important near-term signal may not be announcement volume, but measurable shifts in application revenue share—especially whether the top protocols keep expanding and whether additional platforms climb into the dominant tier. At the same time, the industry will be watching for the next wave of exchange and project restructurings to see how broadly consolidation affects liquidity, custody, and trading access for users.
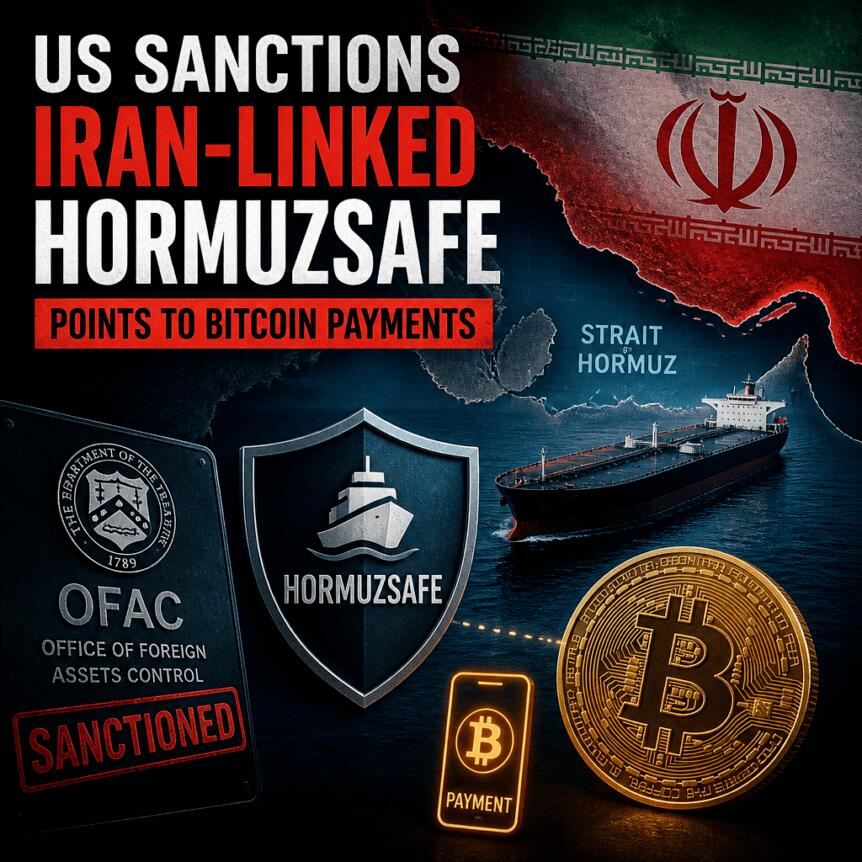
The U.S. Treasury has sanctioned two Iranian maritime insurance-related companies, alleging they are part of an Islamic Revolutionary Guard Corps (IRGC)-backed network that used cryptocurrency payments to help evade Western sanctions. In its action, the Treasury said one of the firms accepted Bitcoin and other digital assets from commercial vessels as part of a requirement to obtain approved coverage before transiting the Strait of Hormuz.
The designations were issued by the Treasury’s Office of Foreign Assets Control (OFAC) on Wednesday. OFAC named Persian Gulf Marine Insurance Company and HormuzSafe Marine Services Authority as entities it says were “integral” to an IRGC-aligned insurance structure targeting shipping flows through one of the world’s most strategically important chokepoints.
Key takeaways
- OFAC sanctioned two Iranian maritime insurance firms, alleging they supported an IRGC-linked network requiring approved coverage for vessels transiting the Strait of Hormuz.
- OFAC alleges HormuzSafe accepted Bitcoin and other crypto as part of efforts to bypass sanctions while generating revenue for the IRGC.
- The action follows earlier reporting and speculation that Iran was exploring crypto-based maritime insurance or payment mechanisms for ships moving through the strait.
- Treasury also expanded the campaign by sanctioning additional entities tied to Iran’s “shadow fleet” and identifying vessels as blocked property.
Treasury alleges a crypto-enabled insurance gate for Hormuz shipping
According to the U.S. Treasury, Persian Gulf Marine Insurance Company and HormuzSafe Marine Services Authority were connected to a sanctions-evasion scheme tied to maritime traffic in the Strait of Hormuz. OFAC said the network operated by requiring commercial vessels to buy approved insurance before proceeding through the waterway—effectively positioning insurance as a control point for shipping.
OFAC further stated that the companies were designated for operating in Iran’s financial sector and that the alleged network helped channel revenue in support of the IRGC. In its announcement, Treasury described the broader objective as enabling Iran to exert greater leverage over shipping through the strait while sidestepping U.S. and allied restrictions.
Treasury Secretary Scott Bessent framed the move as a response to threats to global commerce, saying the United States “will not allow Iran to hold global commerce hostage.”
From reported proposal to sanctioned service
The sanctions come after earlier reports that Iran was considering a Bitcoin-based maritime insurance platform. On May 18, screenshots of a HormuzSafe website circulated online, reportedly offering “digital insurance” for maritime cargo with policies payable in Bitcoin. At the time, coverage noted that the platform’s accessibility was limited when checked, and reporting suggested Iran was still evaluating the model.
State-linked media at the time, including Fars News Agency, suggested the proposed system could generate substantial revenue by issuing insurance policies and certificates related to financial responsibility. While those earlier reports were speculative and based on online materials, Wednesday’s OFAC action indicates U.S. authorities believe the crypto-enabled insurance structure was already being used—or at least that it was sufficiently operational to warrant enforcement.
For investors and market participants, the key implication is less about near-term price moves and more about how sanctions enforcement is increasingly targeting payment rails. If maritime insurance functions as a gatekeeper for transit, then the Treasury’s focus on crypto payment acceptance suggests regulators are monitoring how sanctioned actors might monetize critical infrastructure chokepoints.
Why Bitcoin, and why insurance matters
OFAC said HormuzSafe accepted BTC and other digital assets as part of efforts to evade sanctions, alleging the platform generated revenue on behalf of the IRGC while strengthening Iran’s control over shipping through the Strait of Hormuz.
This approach aligns with a broader logic U.S. authorities have cited before: sanctioned entities may favor crypto because certain assets do not rely on a centralized issuer that can freeze balances. Earlier coverage had pointed out that centralized stablecoins could be frozen by issuers, while Bitcoin’s mechanics do not feature a central operator capable of directly blocking funds in the same way. The U.S. has previously acted against crypto tied to Iran, including by freezing USDT associated with Iranian activity.
Insurance is also an especially consequential lever in international trade. The ability to secure coverage can determine whether commercial vessels can transit restricted routes. In the context of the Strait of Hormuz—which earlier reporting noted handles about one-fifth of global oil trade—any system that influences access or compliance requirements can reverberate across energy logistics.
Earlier reporting cited the Bitcoin Policy Institute in relation to claims that Iran accepted oil toll payments using a mix of payment types including Chinese yuan, USDT, and Bitcoin. However, that earlier account also emphasized that there was no onchain evidence of Bitcoin payments occurring at the time. Wednesday’s enforcement therefore represents a shift from reported consideration to alleged operational enforcement.
Broader sanctions campaign: shadow fleet and blocked vessels
This latest OFAC action does not stand alone. The Treasury said it also sanctioned eight companies linked to Iran’s “shadow fleet” and identified eight vessels as blocked property. While the details of every entity and vessel were not repeated in Wednesday’s summary, the combined package signals a wider effort to disrupt maritime activity tied to sanctions evasion.
For the industry, this means compliance risk may extend beyond ship-to-ship transactions or cargo handling. If insurance approval is part of the operational workflow, then insurers, shipping counterparties, and compliance teams may face increased scrutiny and additional due diligence requirements—particularly around payment methods and counterparties involved in risk coverage and transit documentation.
It also highlights how sanctions enforcement is converging across sectors: Treasury’s approach ties together maritime control, financial services, and crypto payment channels in a single enforcement narrative.
What to watch next
Readers should watch for follow-on enforcement actions and for how shipping and insurance counterparties adjust their compliance processes, especially regarding any crypto-related payment requests connected to transit coverage through the Strait of Hormuz. The U.S. Treasury’s allegations suggest that regulators view digital asset rails not as a peripheral topic, but as part of the infrastructure that can enable sanctions-evasion in high-impact trade corridors.


India’s burgeoning youth-led protest movement won a key victory over the weekend with the resignation of the country’s Education Minister, Dharmendra Pradhan.
The Cockroach Movement, which took its name from a derogatory remark made by India’s Chief Justice comparing young unemployed people to “cockroaches” and “parasites,” has quickly established itself as a formidable political force. You can read our primer on it here.
To discuss the movement and its future, TIME spoke with Mukul Kesavan, a historian, novelist, and one of India’s best-known writers.
This interview has been condensed and edited for clarity.
Q: What is your view of the Cockroach Movement, and what do you think is unique about it?
MK: I’ve spent my life in Delhi. I’ve been to hundreds of demos because Jantar Mantar is the place where you go off and shout your slogans from the time I was an undergraduate, and I have to say, I’d never seen anything like this—not necessarily in terms of its size, though it was very large—but because it was so young.
Normally, demos in Jantar Mantar are fairly organized. Invariably, you will have unions, college or university associations, or left-wing groups organizing people into chanting and slogans. But if it’s possible to imagine 30,000 or 40,000 people in a state of perfect political innocence… I don’t mean to sound condescending, but it just seemed that these people had turned up because they felt there was a kind of existential crisis in their young lives. Because the one last thing that India has to even suggest that hard work might get you a reasonable job is, in fact, its examination system.
Q: How much of a threat do these protests pose to Narendra Modi?
MK: This movement is interesting. It’s a movement of the urban salariat. You know, these are very middle-class people. They are largely Hindus, very young, and so they pose a peculiar kind of challenge… What do you do with a group of young people who theoretically are the very basis of your political constituency? You know, middle class, broadly middle upper caste, salaried urban Hindus. And so I think that is one of the reasons you see this weird fluctuation between brutality and detentions on the one hand, and, on the other, these clumsy, appeasing noises the government makes.
I think it’s evident, in some ways, that this is bigger than just the education thing. Take, for example, the inspired insolence of the attacks on Modi. So, for example, there’s one slogan that translates as: “The real truth is bitter. Modi is a pimp.” To see a 17-year-old saying this in a culture like India, where the very young are sort of deferential, is remarkable.
The Modi juggernaut is generally seen as sinister but efficient at what it does, and the entire tenor of the taunting, the calling out, is that you’re an old, dysfunctional guy, that’s unusual because it seems to open the possibilities of this movement. Not because there’s a constructive program that’s been put forward, but simply because it seems to be open season on a man who, up to now, has seemed sort of inevitable.
Q: Where does the movement go from here?
MK: I’m so bewildered by the scale, intensity, and coming-from-nowhere part of this movement that it’s not clear to me how it sustains itself or where it goes. I’m not saying it won’t, but it surprised everybody, including its organizers.
Youth unemployment amongst the middle classes in India is massive. So entrance examinations that put you into courses that might get you jobs are, if you will, a kind of metaphor for that general sense of anomie about, where do we go? What will happen to us? And to the extent that this narrowly focused thing about examination represents a larger angst, I don’t know.
Asian markets traded without clear direction on Thursday. Investors weighed a divided Federal Reserve decision against fresh volatility in South Korean equities.
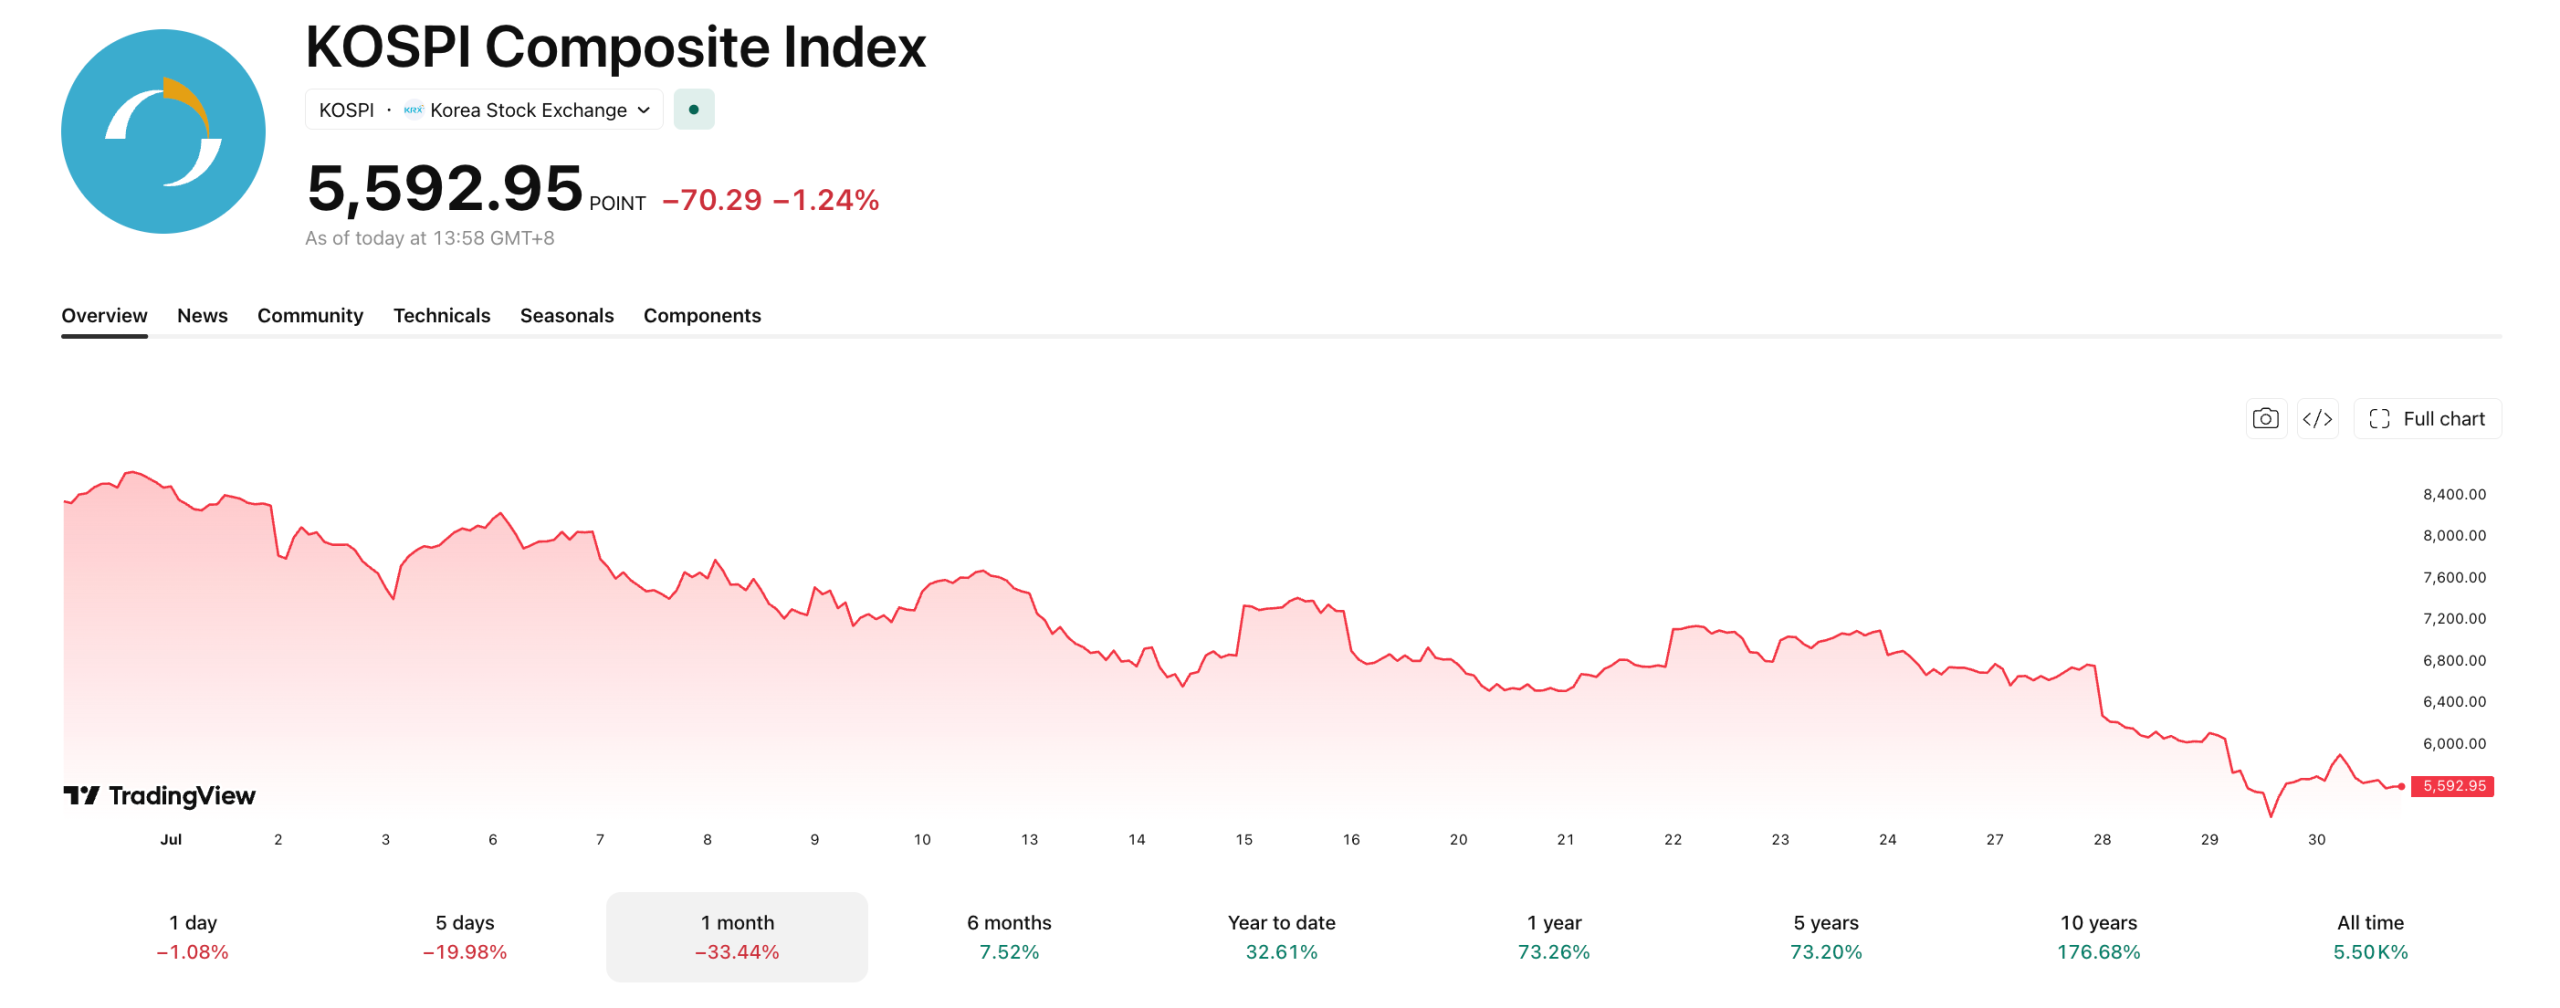
Japan’s Nikkei 225 climbed nearly one percent, trading above 62,000. South Korea’s KOSPI slipped about one percent, extending a stretch that has erased a large share of the index’s value since its June peak.
A Divided Fed Leaves Rates Unclear
The Fed voted 9 to 3 on Wednesday to hold its benchmark rate at 3.5% to 3.75%. Three regional presidents, Cleveland’s Beth Hammack, Minneapolis’s Neel Kashkari and Dallas’s Lorie Logan, dissented in favor of a hike.
The split marked the most contested vote of Chair Kevin Warsh’s short tenure. Warsh again declined to signal the central bank’s next move, and that ambiguity pushed 30-year Treasury yields to their highest level since 2007.
Traders responded by sending the Dow to its worst session in over a year. Bitcoin and gold, meanwhile, climbed on the split vote.
Korea’s Selloff Deepens as Chipmakers Wobble
South Korea remains the epicenter of the regional selloff. The KOSPI plunged nearly six percent on Wednesday, triggering a circuit breaker for a second straight session and prompting an emergency market meeting.
Regulators have since moved to cap retail allocation in single-stock leveraged exchange-traded funds (ETFs, funds that trade like stocks) at 20%. The cap aims to curb the kind of amplified losses that have driven the index down roughly 40% from its June high.

The volatility has hit chipmakers hardest. SK Hynix fell as much as six percent in Thursday trading, extending a steep two-day slide. Samsung Electronics, however, offered a rare bright spot.
The company posted a record quarterly profit surge of more than 1,800% year over year on booming AI memory chip demand. Investors have largely shrugged off the news amid broader fears over AI-related valuations.
Oil added another layer of uncertainty. Brent crude held below $90 a barrel on Thursday. It had jumped more than four percent a day earlier, snapping a three-day slide. Renewed Iranian strikes on U.S. forces and drone attacks on Saudi facilities drove that rally, just days after diplomatic progress over the Strait of Hormuz had pushed prices lower.
Gina Kim, a portfolio manager at Nordea Asset Management, told CNA that retail margin balances in Korea and Taiwan would be the key signal to watch for when the panic subsides.
The Fed offers no clear signal ahead of its September meeting. Korean regulators are still working to contain retail leverage. The coming days may depend less on new data than on whether investor sentiment settles on its own.
The post Asian Stocks Diverge as Divided Fed Leaves Global Stocks Guessing appeared first on BeInCrypto.
The U.S. Treasury has sanctioned two Iranian maritime firms it says were central to an IRGC-linked insurance network operating around the Strait of Hormuz—an arrangement the Treasury claims used cryptocurrency payments, including Bitcoin (BTC), to help Iran bypass Western sanctions.
According to the Treasury’s Office of Foreign Assets Control (OFAC), Persian Gulf Marine Insurance Company and HormuzSafe Marine Services Authority were designated for operating in Iran’s financial sector. OFAC says the network required commercial vessels to purchase “approved coverage” before transiting the strategic waterway.
Key takeaways
- OFAC sanctioned Persian Gulf Marine Insurance Company and HormuzSafe Marine Services Authority for helping an alleged IRGC-backed maritime insurance system.
- OFAC alleges HormuzSafe accepted Bitcoin and other digital assets as part of efforts to evade U.S. sanctions.
- The Treasury says the scheme helped generate revenue for the IRGC and increased Iranian leverage over shipping through the Strait of Hormuz.
- The action follows earlier reports about Iran considering a Bitcoin-based maritime insurance platform.
- OFAC also sanctioned eight additional companies linked to Iran’s shadow fleet and identified eight vessels as blocked property.
OFAC’s sanctions target an insurance mechanism tied to Strait of Hormuz transit
In an OFAC announcement released via the U.S. Treasury, the agency said the designated firms were “integral” to what it described as an IRGC-backed insurance network. The Treasury’s claim is that the network functioned as a gatekeeper for maritime traffic: commercial vessels would need to buy coverage that met the network’s requirements before moving through the Strait of Hormuz.
From an investor and market perspective, the important point is less about a single payment rail and more about control of a chokepoint. The Strait of Hormuz is widely cited as handling roughly one-fifth of global oil trade, meaning even incremental changes to how transit insurance is structured can have outsized implications for shipping compliance costs and energy-market risk perceptions.
Crypto payments alleged: why Treasury focused on Bitcoin
OFAC specifically alleged that HormuzSafe accepted BTC and other cryptocurrencies as part of an effort to “evade sanctions.” The Treasury’s position is that the platform generated revenue on behalf of the IRGC while helping Iran exert greater influence over shipping through the strait.
While sanctions announcements do not establish operational details for every reported component of such systems, this designation matters because it highlights how U.S. authorities believe digital assets can reduce the effectiveness of traditional compliance barriers. Bitcoin is decentralized and, unlike some centrally issued stablecoins, does not have an issuer that can selectively freeze funds. That distinction has been a recurring theme in U.S. crypto enforcement actions and in related reporting about how sanctioned entities look for payment options that are harder to block at the source.
Earlier coverage had suggested that Iran was exploring mechanisms that could include crypto in oil-related settlement processes, though the reporting also noted a lack of onchain evidence at the time for completed Bitcoin payments. OFAC’s latest action indicates that U.S. authorities believe the maritime insurance angle is no longer merely speculative.
From reported proposal to formal designation
The sanctions follow an information trail that began with public online references to HormuzSafe. On May 18, screenshots of the HormuzSafe website circulated online, describing a “digital insurance” service for maritime cargo with policies payable in Bitcoin. At the time, reports characterized the effort as potentially being under consideration, and the site reportedly appeared inaccessible when checked.
Additional context from state-linked media, as carried in earlier reporting, suggested the platform could issue marine insurance policies and certificates of financial responsibility and possibly generate substantial revenue. In the current Treasury action, OFAC has moved from describing a potential concept to sanctioning entities it says were already part of an actionable IRGC-backed network.
OFAC’s statement also comes amid broader U.S. measures targeting Iran-linked crypto activity. In April, U.S. authorities froze $344 million in USD Tether (USDT) stablecoin linked to Iran, underscoring that Treasury views digital assets as a persistent enforcement challenge when sanctions evasion is involved.
Broader enforcement: shadow fleet links and blocked vessels
This round of sanctions was not limited to the two maritime insurance firms. Alongside Persian Gulf Marine Insurance Company and HormuzSafe Marine Services Authority, OFAC sanctioned eight companies it linked to Iran’s “shadow fleet” and identified eight vessels as blocked property.
Taken together, the actions suggest the Treasury is mapping the maritime compliance ecosystem: not only ship operators and vessels, but also the insurance or financial services layered around them. If vessels must obtain specific coverage to transit a strategic route, insurance providers and related platforms can become leverage points—commercially and strategically.
Treasury Secretary Scott Bessent framed the move as a response to Iran using shipping to generate funds for the IRGC. “The United States will not allow Iran to hold global commerce hostage,” he said, according to the Treasury statement.
For markets and shipping participants, the immediate watch item is how insurers, ship operators, and compliance teams respond to these designations—especially whether alternative coverage arrangements emerge for transiting vessels and whether additional related entities are targeted next. Longer term, the key uncertainty remains whether crypto-based payment rails will expand across other sanctioned maritime services beyond the specific structure OFAC outlined this week.
Crypto World
Bitcoin analysts agree the Fed’s hold was hawkish. They don’t agree on what happens next.


The hawkishness wasn’t subtle. The Federal Open Market Committee held rates at 3.5%-3.75%, but three policymakers – Cleveland Fed president Beth Hammack, Minneapolis Fed president Neel Kashkari, and Dallas Fed president Lorie Logan – dissented in favor of a hike, pushing the decision through on a 9-3 vote. Warsh then opened his press conference saying “there is no soft inflation target,” reiterating that any inflation print above 2% is unacceptable to him.
“This is the Fed telling markets it will not tolerate inflation above target even at the cost of a growth scare,” Grachev said. “For digital assets, that’s the least favorable outcome on the table this cycle.”
His reasoning simple. “Tighter policy, less liquidity, [means] more expensive carry.” Tighter liquidity makes leveraged and carry-funded crypto positions more expensive to hold, which can pressure bitcoin’s price. Grachev expects the shift in positioning to happen immediately, not gradually. “Institutional positioning should shift defensive immediately, and risk-on assets will take the biggest hit, he said.
He gave bitcoin some credit for resilience so far, but not much comfort looking ahead: “Bitcoin has held up through a hawkish stretch already, but a fresh hawkish surprise would negatively impact prices.”
Can-Luca Köymen, investment strategist at Sygnum Bank, took a nearly opposite view, largely because he’d already priced in the hawkish hold.

A Russian court has sent Bitriver founder Igor Runets to a pretrial detention facility. Runets will spend two months at the facility while investigators build their case.
Runets was detained and placed under house arrest by law enforcement on January 30, 2026. He was formally charged with three counts of concealing money and assets to evade taxes.
The Charges Against Runets
Runets has been charged under Part 4 of Article 159 of the Russian Criminal Code. The section covers fraud committed by organized groups. According to investigators, the fraud led to nearly 1 billion rubles in damages to EN+, a group of metallurgical and energy companies operating in Russia. Investigators allege that a company linked to Runets received advance payments from an EN+ subsidiary to supply mining equipment. However, the company did not deliver the equipment to the firm and failed to return the funds.
Court Sides With Prosecutors
Prosecutors pushed to transfer Runets to a detention facility, citing the scale of the fraud and concerns that he could influence witnesses in the case. The court agreed with the prosecution and granted the motion to detain Runets. Representatives for Runets and Bitriver have yet to issue a public statement about the developments. Investigators will now begin examining equipment and gathering witness testimony from EN+.
Bitriver’s Troubles Deepen
Meanwhile, Bitriver’s financial troubles deepened. Once the largest mining company in Russia by revenue, Bitriver is facing bankruptcy and looking for new ownership. Fox Group, the mining company’s parent entity, is $9.2 billion in debt, and a commercial court has initiated bankruptcy monitoring proceedings against the company.
Disclaimer: This article is provided for informational purposes only. It is not offered or intended to be used as legal, tax, investment, financial, or other advice.
The notice puts the aggregate market value at $53,394.95, or $20.45 per share, with Cantor Fitzgerald handling the sale on NYSE Arca.
Mintzberg acquired the shares on October 3, 2024, through a privately negotiated transaction with the issuer and paid cash. He reported no sales of the security in the previous three months. A Form 144 registers an intention to sell and does not confirm a completed trade.
Third Insider to File on GXRP
Mintzberg took over as Grayscale’s CEO on August 15, 2024, arriving from Goldman Sachs, which put the purchase seven weeks into the job. The fund was a private placement for accredited investors at the time, holding close to $17 million across 301,500 shares by its first anniversary in September 2025.
Two other Grayscale insiders filed notices on the same security in January. For example, Digital Currency Group founder Barry Silbert, listed as a 10% stockholder, reported 9,158 shares worth $336,373.34, held through a Roth IRA and routed via Capital Institutional Services.
Moreover, Chief Legal Officer Craig Salm reported 7,123 shares worth $266,970.04 through Canaccord Genuity. Silbert’s notice names OTCQX as the venue, while Salm’s and Mintzberg’s both name NYSE Arca.
All three insiders bought inside the same seven-week window in 2024. Silbert took 4,407 shares on September 14 and 4,751 on October 4. Salm took 2,319 on October 8 and 4,804 on October 31.
Both January notices reached the SEC on January 26, and Salm signed his three days earlier. The January filings imply share prices of $36.73 and $37.48, against the $20.45 in Mintzberg’s notice, a decline of 44% over the six months between them.
Trust Float Halves in Six Months
The January filings each listed 5,790,100 shares outstanding. Mintzberg’s July notice lists 2,840,100, a reduction of 2,950,000 shares, or 51%. At $20.45 a share, the remaining count values the trust near $58 million, behind the category leaders at close to $500 million for Bitwise’s fund and below $470 million for Canary’s XRPC.
Grayscale uplisted the fund eleven days after the first US spot XRP ETF began trading on Nasdaq on November 13, 2025, with GXRP shares opening on NYSE Arca on November 24.
Across the category, seven of the ten business days to July 19 recorded zero net flows, at US spot XRP funds, against close to $1.5 billion in cumulative inflows since launch.
XRP traded at $1.07 on July 30, 70.5% below the $3.65 high it set on July 17, 2025.
The post Grayscale CEO Files to Sell $53K of GXRP Shares Bought Before Ripple ETF Listing appeared first on CryptoPotato.


South Korea should introduce interim stablecoin licensing guidance before lawmakers complete the wider Digital Asset Basic Act.
Summary
- South Korea’s report urges stablecoin licensing guidance before lawmakers complete the Digital Asset Basic Act.
- Bank majority ownership could coexist with fintech management under a compromise discussed by lawmakers publicly.
- Ten pending proposals may be combined into one government-backed digital asset bill during 2026 negotiations.
According to a policy report published July 29 by Hashed Open Research and the Solana Policy Institute.
The report summarises a June 23 symposium attended by lawmakers, lawyers and digital-asset industry representatives. It recommends a phased approach addressing stablecoin issuance, payments and foreign tokens while lawmakers continue negotiating a comprehensive market framework. The recommendations are advisory and do not change current law.
South Korea stablecoin rules could arrive in stages
The report argues that waiting for the full Digital Asset Basic Act could leave businesses without clear rules for issuing or using won-backed stablecoins. It recommends interim guidance on licensing, permitted activities and payment services so regulated firms can prepare before the final law takes effect.
Bae, Kim & Lee partner Kim Hyo-bong also urged South Korea to consider the European Union’s rollout of the Markets in Crypto-Assets Regulation. MiCA’s stablecoin provisions began applying on June 30, 2024, six months before the framework became fully applicable. The comparison supports introducing stablecoin rules before completing every part of the broader crypto framework.
Bank control remains the central dispute
Democratic Party lawmaker Ahn Do-geol said policymakers were considering a “compromise” under which banks would retain majority ownership of stablecoin issuers while fintech or other non-bank partners managed operations. The model has not been adopted and remains part of negotiations.
As previously discussed a structure in which banks would own more than 50% of an issuer and a fintech company could hold 34% with management rights. Supporters say the model could combine bank oversight with technical expertise. However, critics of strict bank control argue it could narrow competition.
The Bank of Korea has supported a bank-led approach because of monetary, foreign-exchange and financial-stability concerns. Central bank officials have warned that easier conversion between won and U.S. dollar stablecoins could complicate capital-flow management.
Ten proposals may be folded into one bill
The Financial Services Commission told the National Assembly ahead of a July 29 policy briefing that it plans to prepare a consolidated Digital Asset Basic Act with the ruling Democratic Party. Ten digital-asset and stablecoin proposals are already pending, but the regulator has not announced a filing date or final wording.
The proposed framework is expected to cover stablecoin issuance and circulation, exchange conduct, disclosures, internal controls and system resilience. South Korea’s existing Virtual Asset User Protection Act mainly governs custody, unfair trading and customer safeguards, leaving issuer and market-structure rules for the second stage.
The policy report also asks lawmakers to look beyond issuer eligibility. Its wider recommendations cover payment networks, public blockchains, tokenised assets and links between traditional markets and decentralised finance. These proposals reflect symposium participants’ views rather than agreed government policy.
Foreign stablecoins and financial institutions need clarity
Kim said policymakers should define which digital-asset activities banks and other financial institutions may conduct. The report also calls for clear licensing treatment for stablecoin payments and rules covering foreign-issued tokens offered to Korean users.
Expected policy questions include whether overseas issuers must establish a local branch, meet reserve and custody standards, or obtain domestic approval. These details remain unsettled, so the report’s recommendations should not be read as current legal requirements.
As previously reported, South Korea has outlined a wider roadmap for won-backed stablecoins alongside foreign-exchange reforms, central bank digital-currency pilots and tokenised government bonds.
In addition, the FSC said it wants to combine ten pending proposals into a government-backed bill during 2026. Lawmakers must still reconcile bank ownership, non-bank participation, reserve safeguards and the treatment of overseas stablecoins.
No parliamentary vote or implementation deadline has been announced. Moreover, no verified crypto-market movement has been directly linked to the policy report’s publication.

From just 11, Sarah was enslaved by paedophile Muslim men who plied her with alcohol and drugs and raped her. Now, thanks to Labour’s early release scheme, they could be out in just five years…

Griesson – de Beukelaer to buy Piroulines maker DeBeukelaer

Bitcoin ETF inflows return as Ether funds slip into outflows

Renter of Home in Anne Heche Crash Denies Settlement With Son

No Jackpot Winner as $257 Million Prize Rolls Over to $269 Million Monday Draw

Weekend Open Thread: Staud – Corporette.com

Manage your Salary Like a PRO | Salary Planning Formula | Sanjay Kathuria

Crypto Is Going To Take A LOT Of You By Surprise Bitcoin Could Enact A Major Altcoin Season In 2026

Let’s Go MASSIVE for NO REASON! #gambling #casino #money #comedy #slots
-

 Fashion6 days ago
Weekend Open Thread: Brooks Brothers
-
 Sports3 days ago
Commonwealth Games boxing: Jadumani Singh seals dominant 5-0 win over Pakistan’s Sumama Rehman to enter quarter-finals | Commonwealth Games News
-

 Business11 hours ago
Why Trees Belong on the Risk Register
-

 Tech3 days ago
Intel is reversing course and bringing hyper-threading back to its server chips
-

 Politics3 days ago
Luke Littler dismantles Gerwyn Price to retain title in Blackpool
-

 Crypto World5 days ago
Ripple bought a bank in pieces. The $4 billion audit
-

 Politics2 days ago
The Part of the Electric Transition Nobody Wants to Discuss
-
 Entertainment6 days ago
A New Post-Apocalyptic Gundam Anime Series Blasts Into SDCC
-

 News Videos3 days ago
BITCOIN JUST ENTERED THIS CRITICAL ZONE…
-

 Fashion6 days ago
16 Dresses for the High Summer Event
-

 Sports6 days ago
2026 3M Open leaderboard: Scottie Scheffler finds putter in Round 1, sits three back
-

 News Videos7 days ago
The Peugeot Family: How 200 Years of an “Old Money” Dynasty Died in A Boardroom
-

 Business1 day ago
Major shareholder moves on Canyon
-

 Crypto World4 days ago
XRP Ledger adds $2.6B as RWA inflows rank second
-

 Politics4 days ago
Spain sweeps the board at 2026 World Cup with individual awards
-

 Crypto World7 days ago
Uniswap (UNI) pushes deeper into tokenized RWAs with permissioned trading pools
-
 Entertainment2 days ago
‘Stargate’ Creator’s New Sci-Fi Series Returns for Season 3 Tomorrow
-

 Tech5 days ago
Anthropic launches Claude Opus 5, a cheaper AI model for coding, agents and enterprise workflows
-

 Entertainment4 days ago
Sara Gilson Killed By Husband After Viral “Pedophile” TikTok Video
-

 News Videos1 day ago
Claude: Build Financial Dashboards in Minutes (2026)
You must be logged in to post a comment Login