
Crypto World
XRP and BNB Battle for 4th Spot, BTC Price Calms at $66K: Market Watch

Binance Coin took the lead today by surpassing its XRP rival.
Although the traditional financial markets in Asia and Europe opened earlier this morning and the US futures markets joined, BTC’s price has actually remained relatively calm at around $66,000 following the weekend developments.
Most altcoins are also unexpectedly quiet today, but minor losses continue to dominate. Ethereum continues to struggle below $2,000.
BTC Calms at $66K
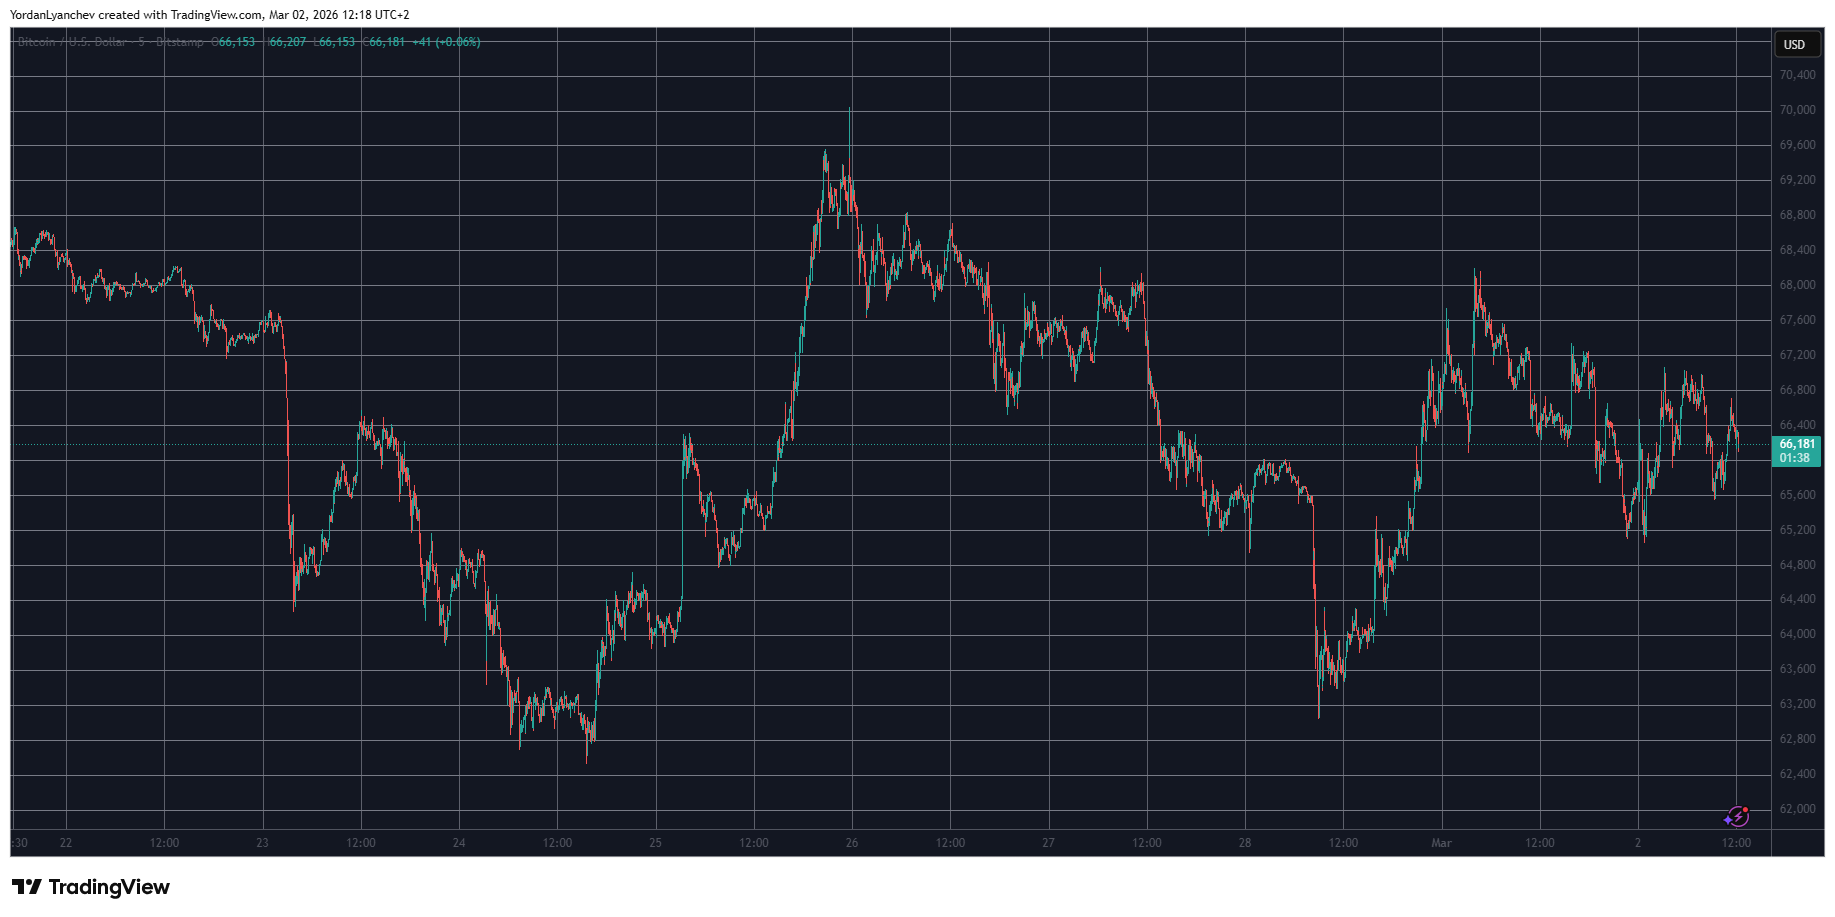
After last Wednesday’s rejection at $70,000, the primary cryptocurrency dropped below $67,000 a day later but found support and entered the weekend at $68,000. However, Saturday began with intense volatility as the US and Israel launched numerous airstrikes against Iran.
The Middle East country retaliated against several nations in the region, including the UAE, Qatar, and Bahrain, and BTC’s price tumbled to a new multi-day low of $63,000. However, reports emerged later that day that Iran’s Supreme Leader was killed during the attacks, and bitcoin erased all losses and touched $68,000 once again.
It failed there and dipped to $65,200 on Sunday, and even more volatility was expected on Monday morning when the futures and some legacy markets opened. However, BTC has remained relatively stable and now sits around $66,000.
Its market capitalization remained inches above $1.320 trillion, while its dominance over the alts is north of 56%.
BNB Back to 4th
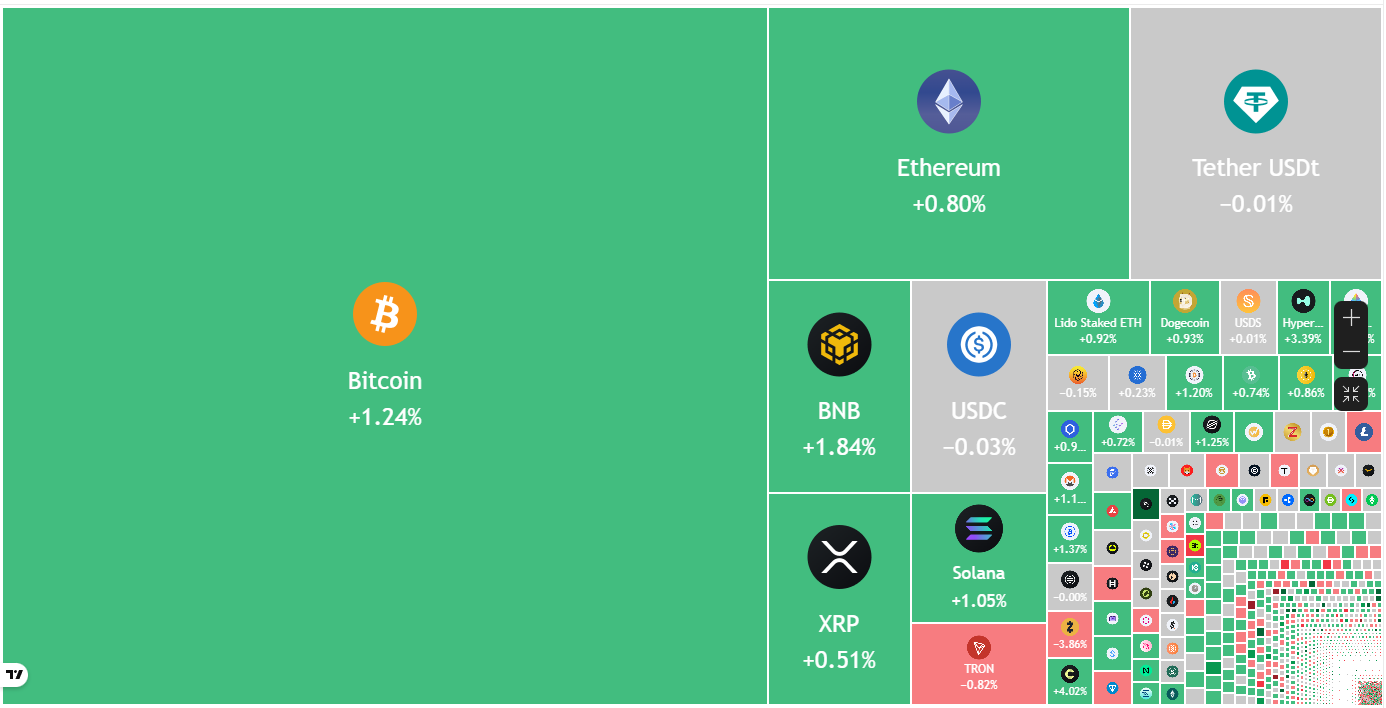
XRP was among the poorest performers after the attacks began, which allowed BNB to surpass it in terms of market cap. The two changed positions yesterday once again, but BNB has the upper hand today with a price tag of $617 and a market cap of $84.2 billion compared to XRP’s $82.5 billion.
Most other larger-cap alts are slightly in the red, with ETH losing the $2,000 support once again. SOL, DOGE, ADA, BCH, HYPE, and LINK are down by around 2-3%, while CC and DOT have lost more than 4% daily. In contrast, HTX is up by over 3%.
The total crypto market cap has declined by about $30 billion in a day and is down to $2.350 trillion on CG.

Binance Free $600 (CryptoPotato Exclusive): Use this link to register a new account and receive $600 exclusive welcome offer on Binance (full details).
LIMITED OFFER for CryptoPotato readers at Bybit: Use this link to register and open a $500 FREE position on any coin!
Disclaimer: Information found on CryptoPotato is those of writers quoted. It does not represent the opinions of CryptoPotato on whether to buy, sell, or hold any investments. You are advised to conduct your own research before making any investment decisions. Use provided information at your own risk. See Disclaimer for more information.

The slide that began Saturday night, after Vice President J.D. Vance left Pakistan without securing a peace deal in Iran, has, for the moment, somewhat reversed.
After falling to as low as $70,500 at one point Sunday, the price of bitcoin has bounced back to $72,100 during U.S. Monday morning trading hours. Helping were reports suggesting Iran was considering the abandonment of its enriched uranium as a concession towards ending the war.
U.S. stocks have also reversed big early losses, the Nasdaq now higher by 0.3% after sliding more than 1%.
Meanwhile, the promised U.S. blockade of the Strait of Hormuz — scheduled for 10 am ET — has apparently gone into effect.
“Security in the Persian Gulf and the Sea of Oman is either for everyone or for NO ONE,” the Islamic Republic of Iran Broadcasting reported Monday. “NO PORT in the region will be safe,” based on a statement from Iran’s military and the Revolutionary Guards.
Crypto-related stocks are on the move higher as well, led by a 8.3% gain for stablecoin issuer Circle (CRCL). Coinbase (COIN) is up 3.1% and Strategy (MSTR) by 1.5%.
Read more: Strategy buys 13,927 bitcoin for $1 billion, entirely through STRC
Does lightning strike twice?
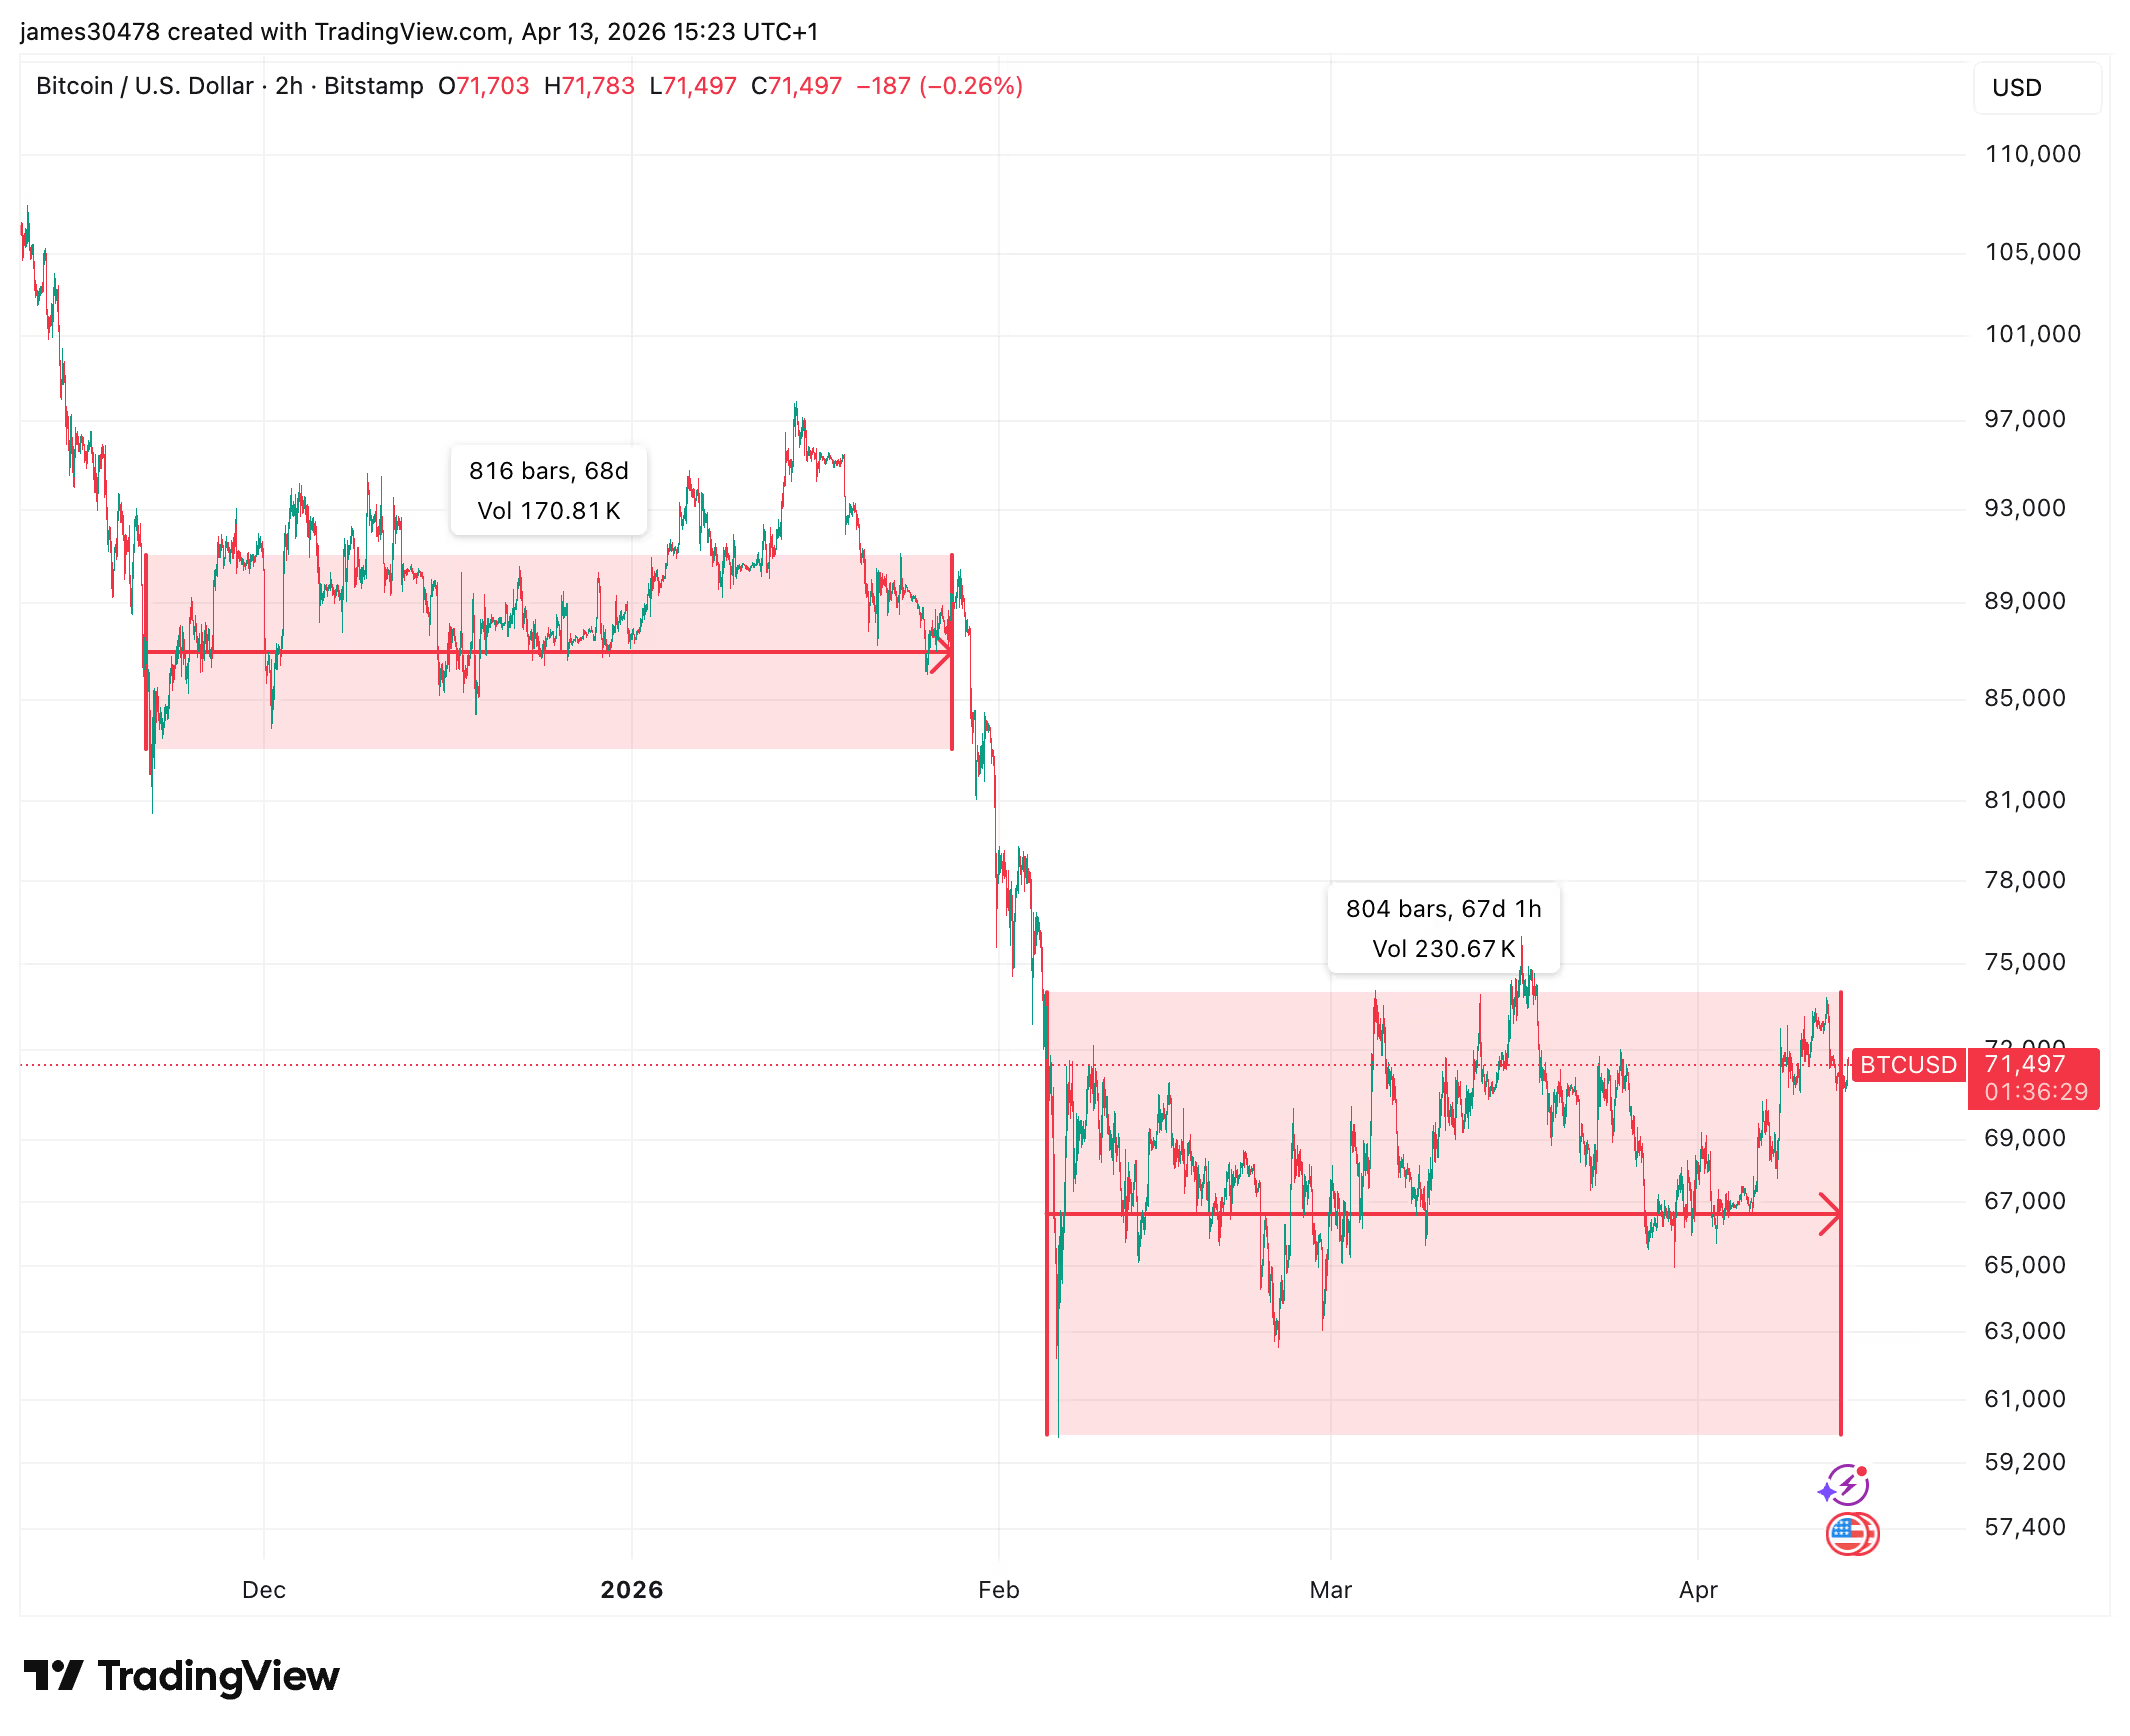
Bitcoin has now been consolidating for 67 days since its local bottom on Feb. 5 at $60,000, almost identical to the 68-day consolidation period between Nov. 21 and Jan. 28, which preceded a sharp drop from roughly $90,000 to $60,000 in the span of a week. Bears anticipate a similar outcome, which may include a retest of the 200-week moving average around $60,000.

Crypto World
Could This New Cryptocurrency Backed by the Pepe Creator Outrun SOL and BNB Before the Listing Opens

A two week ceasefire between the U.S. and Iran wiped out $600 million in short positions and pushed BTC past $72,700 in hours. One headline erased weeks of fear in a single flash, and the new cryptocurrency conversation is no longer about which token might move, it is about which entry catches the wave first and turns it into real wealth.
While SOL and BNB grind higher from multi billion dollar caps, the wallets that spotted the clearest path to life changing returns are loading Pepeto because a working exchange, a confirmed Binance listing, and $8.9 million in committed capital make this the one setup nobody building a serious portfolio can afford to walk past.
New Cryptocurrency Capital Flows Jump After Ceasefire Triggers $600M in Forced Selling
BTC jumped to $72,700 after President Trump announced a ceasefire with Iran, triggering $600 million in forced crypto position closures with over $400 million from short sellers per CoinDesk.
Oil dropped more than 10% easing inflation fears per Bloomberg. When one headline wipes $600 million in bearish bets off the board, every fresh token with a confirmed catalyst catches the wave of capital that follows.
SOL at $82.16, BNB at $592, and Pepeto at $8.9M: Where the Real Move Starts
Pepeto: The Entry You Either Catch Today or Miss Forever
While the ceasefire sent capital flooding back into risk assets, the presale already holding more than $8.9 million stands to multiply that capital the fastest, and here is why: every other new cryptocurrency presale is selling you a promise and a timeline, but Pepeto is not asking you to imagine anything because the product is already live, already running, and already protecting the capital inside it.
The risk scanner catches every bad contract before you buy so projects built to steal get blocked before your money ever leaves your wallet, and PepetoSwap charges nothing on any trade so your gains stay whole instead of shrinking across dozens of positions.
The creator of the original Pepe coin, the meme token that hit $11 billion with zero products behind it, built Pepeto on the same 420 trillion supply with SolidProof going through every contract line by line. More than $8.9 million came in while fear dominated the entire market, and the wallets inside are not hoping for a lucky break.

They did the research, saw what was built, and moved with conviction while everyone else waited for clarity that never comes until it is too late. Staking pays 185% APY, growing your tokens daily while the listing gets closer and closer.
At $0.000000186 per token, analysts project 100x to 300x from the Binance listing alone. Picture what that means in real money you can hold: $2,000 today turns into $200,000 at the low end and $600,000 if the full target hits. This kind of setup does not come around twice in the same cycle, and it does not wait for the people who need another week to decide.
Today is the day that matters, not tomorrow, not next week, because the entry available right now will not exist in a few days. Every person who built real wealth from early crypto says the exact same thing: I moved today instead of coming back tomorrow, and that one choice made all the difference between watching and owning. The listing ends this price, and it does not come back.
SOL (Solana)
SOL trades near $82.16 with a $40 billion cap, 65% below its all time high per CoinMarketCap. The Alpenglow upgrade targets one second finality, but even a full recovery to $200 delivers 138%, returns that take the full year from a cap that limits rally speed.
BNB (Binance Coin)
BNB trades near $592 with a $80 billion cap per CoinMarketCap. The Binance ecosystem generates steady fee revenue and BNB burns cut supply.
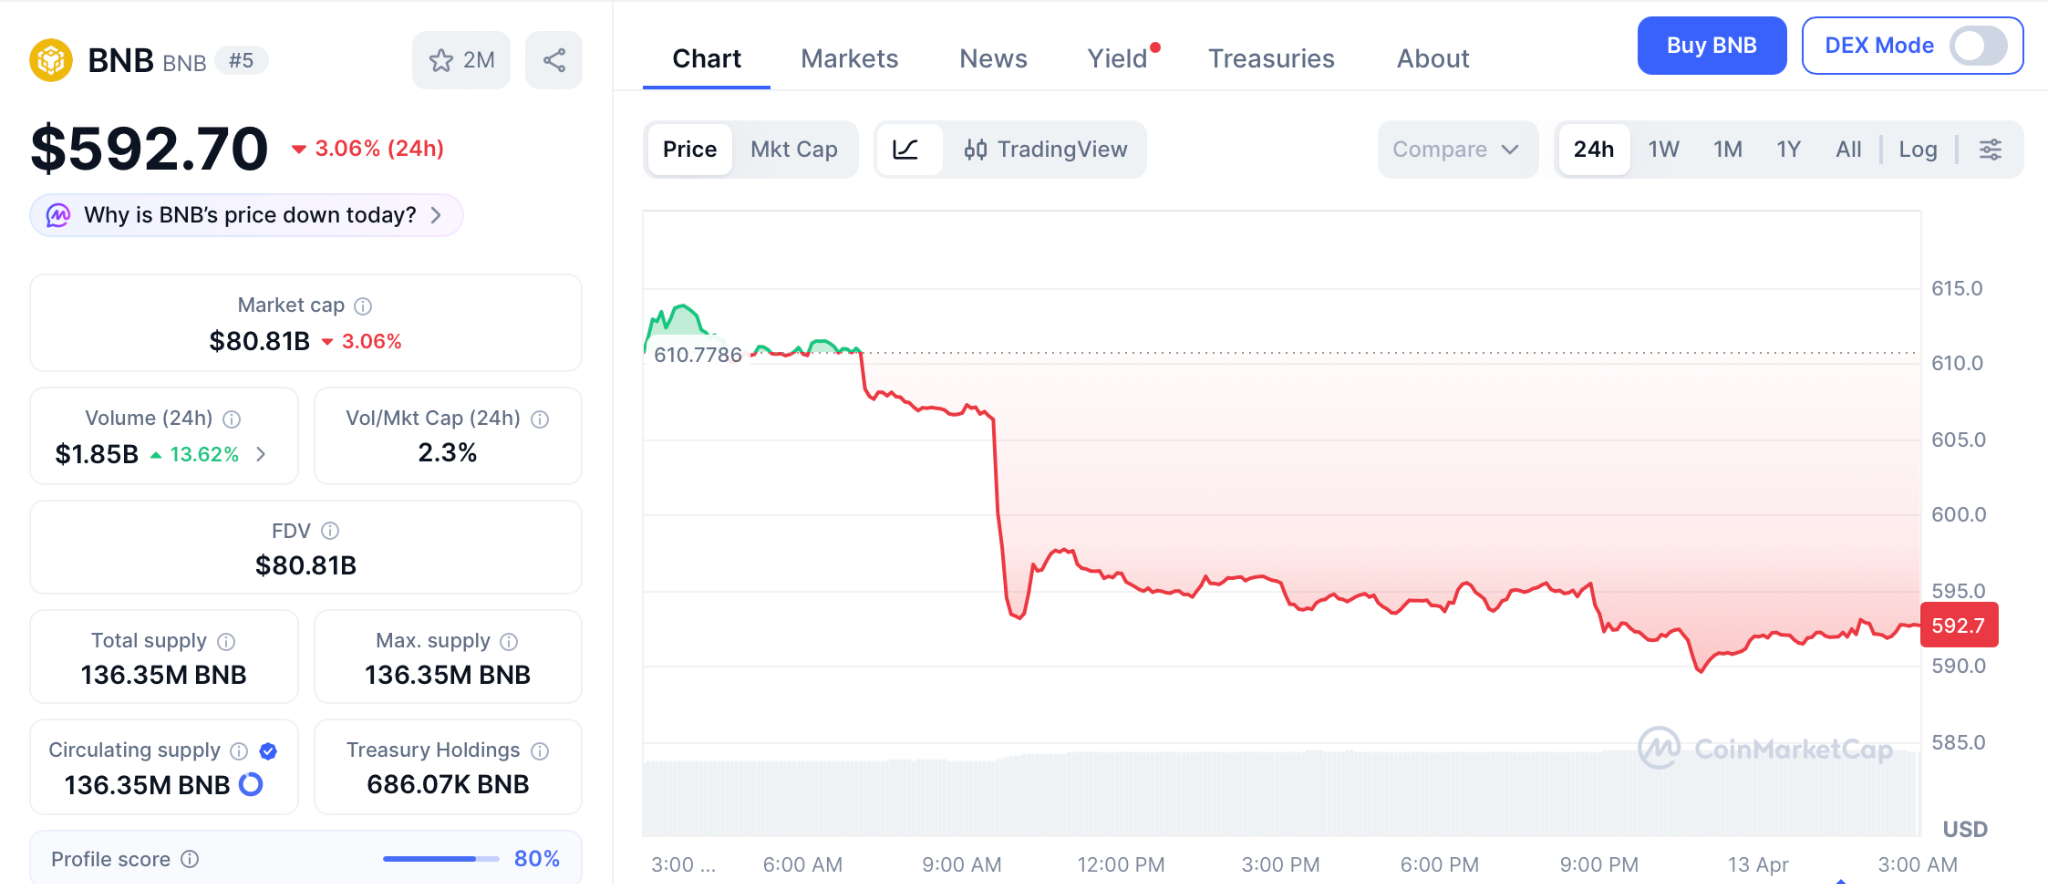
But the strongest return sits at presale pricing, not at $80 billion needing massive inflows just to double.
Conclusion
SOL carries the speed upgrades and BNB holds the exchange revenue story, both are credible long term plays for patient money. But wealth in crypto has never come from patience with large caps. Wealth comes from one entry, at one moment, before the listing forces the entire market to pay what you already hold. That moment is Pepeto, right now.
The creator of the $11 billion Pepe token built a working exchange, SolidProof signed every contract, a Binance veteran runs the build, and $8.9 million from the most informed wallets in the market already filled this presale while retail sat on the sideline frozen by fear.
$2,000 inside Pepeto at 100x becomes $200,000. At 300x it becomes $600,000. SOL needs to triple just to get you 138%. BNB needs massive volume just to double from $80 billion. The math is not close, and the math is what builds wealth, not hope. The Pepeto official website is where you get in before the listing opens, and once it does, this price becomes the one thing every person who waited kicks themselves for missing.
You can watch SOL and BNB grind out gains over the next year, or you can be the person who caught the listing that changed everything. One of those stories ends with wealth. The other ends with regret.
Click To Visit Pepeto Website To Enter The Presale

FAQs
Why does the Iran ceasefire matter for the crypto market right now?
The ceasefire pushed BTC past $72,700, and the new cryptocurrency closest to listing catches that returning capital before large caps absorb it.
Is SOL or BNB a better hold than a presale entry?
Both deliver steady returns from large caps, but a presale to listing move from the Pepeto official website delivers gains SOL and BNB need years to match.
What makes Pepeto the strongest new cryptocurrency presale this cycle?
Pepeto built by the Pepe creator with SolidProof audits, more than $8.9 million raised, and a confirmed Binance listing delivers returns large cap entries take full cycles to produce.
Disclaimer: This is a Press Release provided by a third party who is responsible for the content. Please conduct your own research before taking any action based on the content.


Director of National Intelligence Tulsi Gabbard declassified closed-door 2019 transcripts tied to President Donald Trump’s first impeachment.
The documents had been withheld for more than seven years. They detail briefings with then-Intelligence Community Inspector General Michael Atkinson about the whistleblower complaint that triggered impeachment proceedings.
Transcripts Allege Undisclosed Partisan Ties
The newly released records show the whistleblower was a registered Democrat. The individual had a prior professional relationship with then-Vice President Joe Biden on Ukraine policy. He also worked as a CIA detailee at the White House.
The transcripts also indicate the whistleblower met with Schiff’s committee staff before filing the formal complaint in August 2019. That contact was not disclosed on official intake forms.
HPSCI Chairman Rick Crawford released the papers after Gabbard finished the declassification review late last week.
Atkinson Accused of Bypassing Safeguards
The released materials suggest Atkinson fast-tracked the complaint despite knowing the whistleblower’s political affiliations.
He reportedly accepted the individual’s self-assessment of impartiality without an independent investigation.
The Department of Justice’s Office of Legal Counsel separately ruled at the time that the complaint involved foreign diplomacy.
It also found the filing relied on secondhand information and failed to meet the “urgent concern” threshold.
Political Fallout and Market Implications
Gabbard framed the documents as proof of intelligence community misconduct. However, critics have accused Gabbard of withholding intelligence from Congress.
Whistleblower Aid filed a separate complaint against the DNI director earlier this year.
The disclosure adds political volatility ahead of 2026 midterm elections. Crypto regulation and Trump administration policy remain central issues for digital asset voters.
The post Trump Impeachment “Hoax” Narrative Explodes in New Intelligence Report appeared first on BeInCrypto.
Bitcoin (BTC) reversed its losses after Monday’s Wall Street open as markets digested the newest developments in the US-Iran war.
Key points:
-
Bitcoin joins US stocks in a relief bounce despite the US blockade of the Strait of Hormuz going ahead.
-
The measures exclude shipping traffic from non-Iranian ports, analysis notes.
-
BTC price perspectives warn of a fresh downward reversal next.
Crypto “panic has faded” over Iran
Data from TradingView showed BTC price action abruptly heading higher, reaching $72,530 on Bistamp.

The US blockade of the Strait of Hormuz began Monday at 10 a.m. EDT, but markets appeared relieved that traffic not going to or from Iranian ports would be unaffected.
According to trading resource The Kobeissi Letter, the US would “not impede freedom of navigation for vessels transiting the Strait of Hormuz to and from non-Iranian ports.”
“A successful blockade of Iranian ports would cut off the majority of the already restricted oil exports from the region,” it wrote in a post on X, warning over US gas prices hitting $4.25 per gallon.
WTI crude oil circled $102 per barrel, having briefly retested the $100 mark that it passed at the start of futures trading.

US stocks, meanwhile, canceled out the initial downside from the news that negotiations between the US and Iran had failed.
Both the S&P 500 and Nasdaq Composite Index were green on the day at the time of writing.

Commenting, trading company QCP Capital flagged the increasing role of Chinese trade as a factor in the Iran saga.
“China sits at the centre of this. With Iranian crude largely flowing east, any blockade would cut directly into Beijing’s supply chain,” it wrote in its latest “Market Color” update.
QCP argued that “even with a strong US naval presence, the question is not intent but enforcement.”
“Intercepting Chinese vessels in international waters would risk a materially larger escalation, and markets are not priced for that outcome. Instead, they are leaning on a familiar playbook: rhetoric escalates, reality softens,” it continued.
“Crypto is reflecting that view. Despite renewed blockade threats, implied vols and risk reversals have drifted back toward pre-conflict levels, a signal that panic has faded even if uncertainty has not.”
Trader warns of “Bart Simpson” BTC price reversal
Traders maintained a risk-off stance on short-term BTC price action.
Related: Oil price surges 8% on Iran tensions: Five things to know in Bitcoin this week
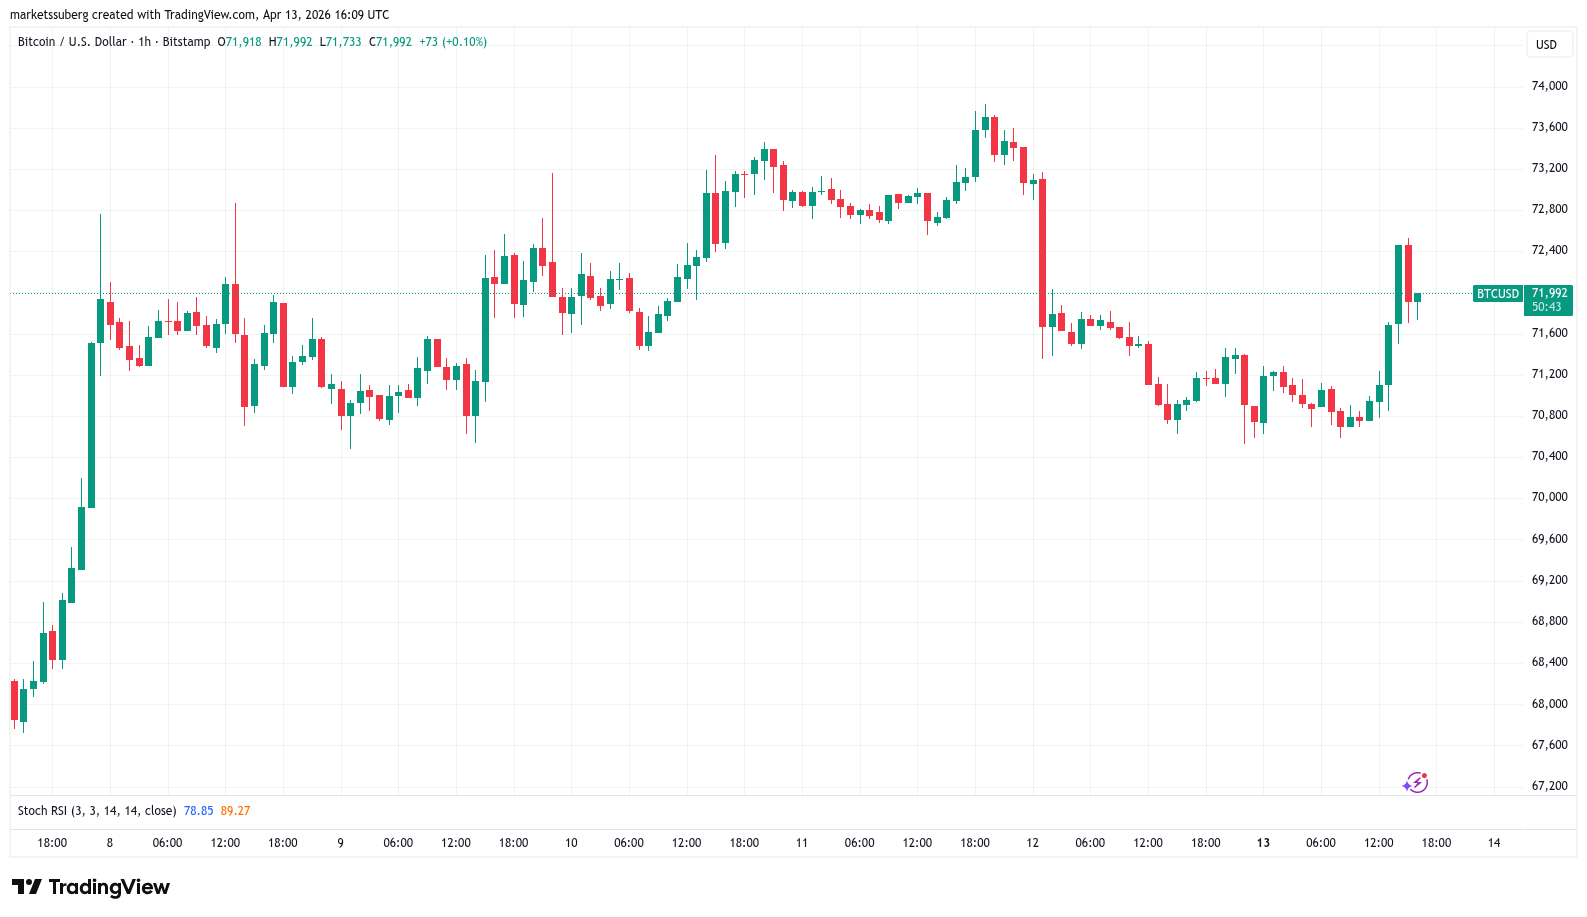
Trader Jelle warned that BTC/USD may print a classic “Bart Simpson” failed breakout pattern next, effectively erasing its gains from earlier in April.
“As said earlier today, eyes on $70.5k,” he advised X followers.
$BTC looking more and more ready to complete the Bart move here.
H&S-like structure, potentially forming the right shoulder here.
As said earlier today, eyes on $70.5k.
Lose that and we likely full retrace the ‘ceasefire’ pump. pic.twitter.com/F3K0bG2aj6
— Jelle (@CryptoJelleNL) April 13, 2026
In a previous post, Jelle said that Bitcoin’s bear flag pattern on daily time frames was “still in play.”
As Cointelegraph reported, the pattern threatened a repeat of the January price action, with Bitcoin risking new macro lows.

In his latest analysis, meanwhile, trader CrypNuevo saw few actionable moves in the current trading range.
“It’s the clearest chart in a long time: Nothing to do here at mid-range – wait for price to trade at one of the extremes, probably this week or the next,” an X thread on Sunday stated.
CrypNuevo flagged the area between $59,000 and $61,000 for entering swing long positions.

This article is produced in accordance with Cointelegraph’s Editorial Policy and is intended for informational purposes only. It does not constitute investment advice or recommendations. All investments and trades carry risk; readers are encouraged to conduct independent research before making any decisions. Cointelegraph makes no guarantees regarding the accuracy or completeness of the information presented, including forward-looking statements, and will not be liable for any loss or damage arising from reliance on this content.
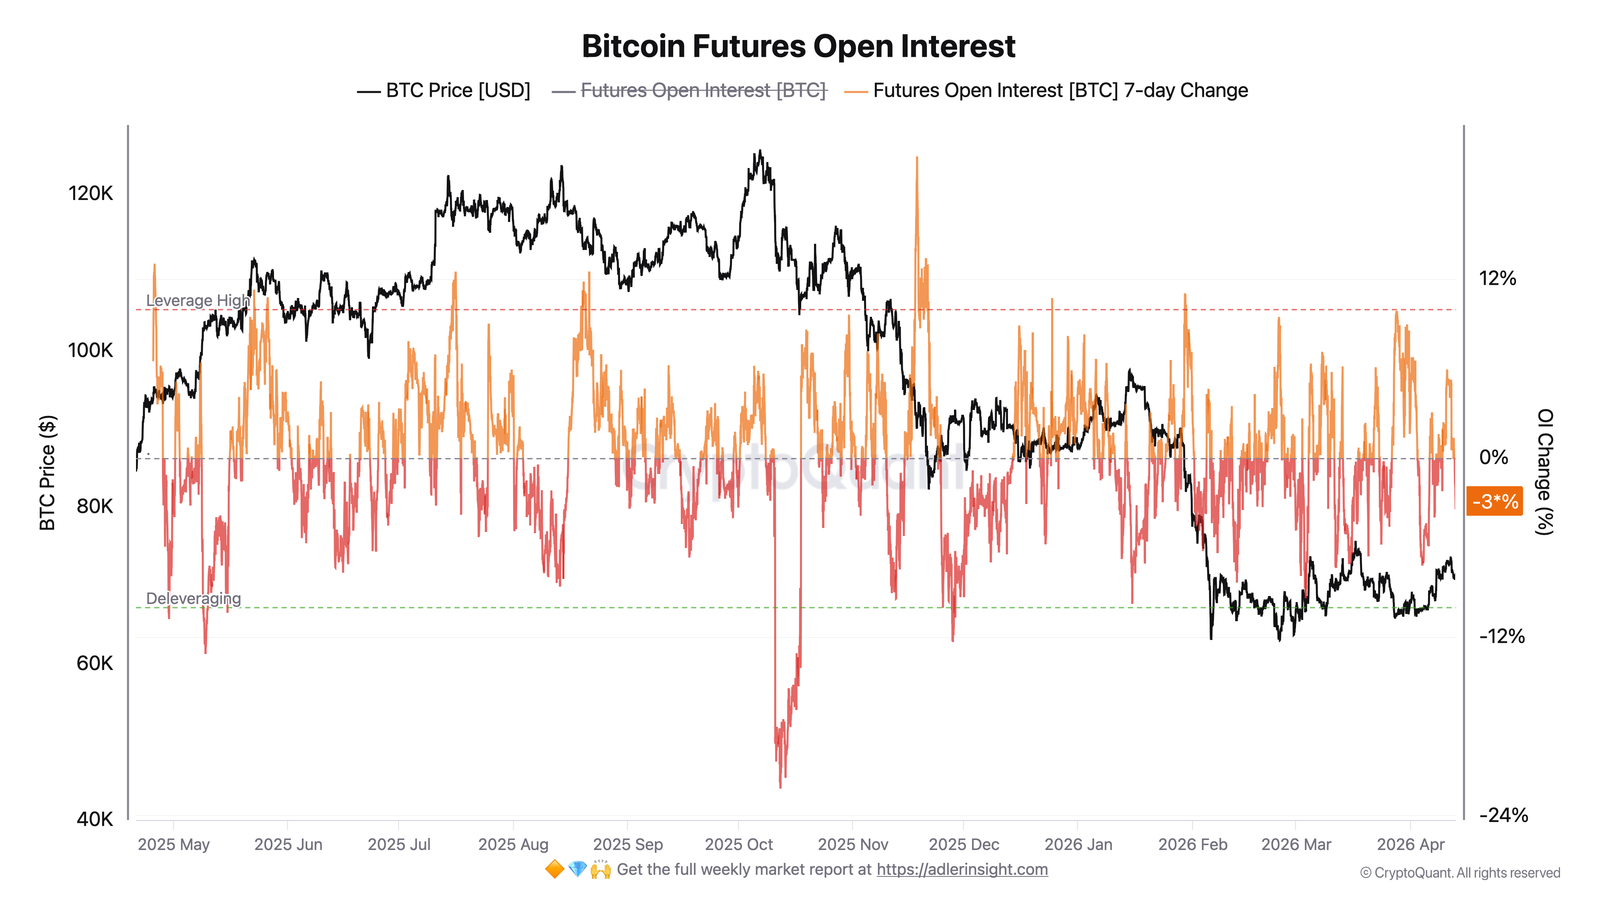
Bitcoin (BTC) futures data shows that traders who opened new short positions above $70,000 over the weekend could be at risk of liquidation as a wave of leveraged positions were closed on Monday.
The weekly change in Bitcoin futures market open interest fell to -2.46% on Monday, down from a 8.9% increase on March 31, suggesting a decline in leverage.
Multiple long-term Bitcoin valuation metrics also sit at historic lows, with analysts estimating that nearly 90% of the downside has already been priced in.
Bitcoin futures leverage reset meets rising short bias
Bitcoin researcher Axel Adler Jr noted the weekly change in aggregate Bitcoin futures open interest (OI) measured in BTC. The metric peaked at 8.9% on March 31 as the price pushed above $73,000. By April 4, it flipped to -7.2%, marking the sharpest contraction in the period. The seven-day change stands at -2.46% on Monday, with the total OI near 318,000 BTC.

The shift into negative territory occurred on Sunday, placing the deleveraging phase in its early stage. Adler said that the price holding above $70,000 during this contraction shows that a large portion of long-side leverage has been closed without a cascading liquidation that crashed the BTC price.
OI does not distinguish between voluntary closures and forced liquidations, so the move is described as a broad leverage reset.
Funding rate data adds a second layer. The seven-day average funding rate across Binance, Bybit and OKX has dropped from 0.33% on March 31 to -0.1738% by April 13.
Bybit and OKX show deeper negative values, signaling a stronger short-side tilt. The negative funding means sellers are paying buyers to hold positions.
This indicates growing pressure on the short positions if the price holds steady, as the positioning is leaning against the current uptrend.

The current setup shows long positions under pressure exited first, then shorts stepped in. A stable price above $70,000 in the face of this shift creates conditions where late short exposure can be squeezed if BTC demand returns.
Related: Oil price surges 8% on Iran tensions: Five things to know in Bitcoin this week
Data says Bitcoin is still undervalued
MN Capital Founder Michaël van de Poppe pointed to three long-term indicators sitting at extreme lows. The Puell Multiple Z-Score, which compares the Bitcoin miner revenue to historical averages, is at its lowest reading in a decade. Similar levels appeared near the 2018, 2020, and 2022 BTC price bottoms.
The spent output profit ratio (SOPR) Z-Score, which tracks whether coins are sold at a profit or a loss, has reached its lowest point on record. It shows widespread realization of losses, often seen near exhaustion phases.
The market-value-to-realized-value (MVRV) Z-Score has also printed its weakest reading ever, placing the BTC price near aggregate cost-basis zones.

Together, these metrics show that most investors are no longer sitting on large profits, and much of the earlier euphoric buying has cooled.
This type of reset often follows heavy selling, where short-term traders exit positions and coins shift toward holders with a longer-term outlook.
While the price levels between $64,000 and $66,000 show visible liquidity, $74,000 remains a tested ceiling. Van de Poppe said,
“For sure, markets can tumble and sweep the lows for liquidity, but I don’t think we’ll see much more downside in the markets, or at least 90% of the downside is already captured.”
Related: Strategy buys 13,927 Bitcoin for $1B, holdings near 800,000 BTC
This article is produced in accordance with Cointelegraph’s Editorial Policy and is intended for informational purposes only. It does not constitute investment advice or recommendations. All investments and trades carry risk; readers are encouraged to conduct independent research before making any decisions. Cointelegraph makes no guarantees regarding the accuracy or completeness of the information presented, including forward-looking statements, and will not be liable for any loss or damage arising from reliance on this content.
Bitcoin (BTC) reclaimed the $72,000 level as bulls attempt to push the price closer to its multi-month range highs. While lower levels are attracting buyers, sustaining the higher levels might pose a challenge.
Coin Bureau founder and market analyst Nic Puckrin told Cointelegraph that for BTC to reach $90,000, the geopolitical tensions must end, bringing oil prices to $80. Additionally, economic data must soften in order to calm investors’ fear that stagflation may hamper the US economy.
Another cautious view came from CoinEx exchange chief analyst Jeff Ko, who told Cointelegraph that the short-term sentiment “remains fragile and heavily macro-driven, especially by oil, the dollar and inflation expectations.” The analyst sounded more confident over the medium term as he does not expect oil prices to remain elevated due to the supply-demand fundamentals.

As far as price levels are concerned, macro analyst Jordi Visser said on the Anthony Pompliano podcast that a sustainable move could begin if BTC trades above $76,000 and Ether (ETH) above $2,400.
Could buyers pierce the overhead resistance in BTC and the major altcoins? Let’s analyze the charts of the top 10 cryptocurrencies to find out.
S&P 500 Index price prediction
The S&P 500 Index (SPX) gapped up and closed above the 50-day simple moving average (6,761) on Wednesday, indicating that the corrective phase may be over.

The 20-day exponential moving average (6,657) has started to turn up, and the relative strength index (RSI) is in the positive territory, indicating a slight edge to the bulls. Any pullback is expected to find support at the 20-day EMA. If the price remains above the 20-day EMA, the bulls will strive to push the index toward the all-time high of 7,002.
On the contrary, if the price turns down and breaks below the 20-day EMA, it suggests that the bears are selling on rallies. That increases the likelihood of a range formation in the near term.
US Dollar Index price prediction
Sellers are attempting to sink the US Dollar Index (DXY) below the 50-day SMA (98.67), but the bulls have held their ground.

The bounce off the 50-day SMA is expected to face selling at the 20-day EMA (99.34). If the price turns down from the 20-day EMA and breaks below the 50-day SMA, it suggests that the index may continue to oscillate inside the large range between 95.55 and 100.54 for some more time.
Contrarily, a close above the 20-day EMA suggests demand at lower levels. The bulls will then again attempt to thrust the price above the 100.54 resistance.
Bitcoin price prediction
BTC pulled back to the 20-day EMA ($70,209), indicating that the bears are fiercely defending the $74,000 to $76,000 zone.

The bounce off the 20-day EMA on Monday indicates that the bulls are buying on dips. That increases the possibility of a retest of the critical $76,000 resistance. Sellers are expected to defend the level with all their might, as a close above $76,000 will complete a bullish ascending triangle pattern. That clears the path for a potential rally to $84,000.
Sellers are likely to have other plans. They will attempt to pull the BTC/USDT pair below the moving averages. If they succeed, the BTC price may drop to the support line. A close below the support line tilts the advantage in favor of the bears.
Ether price prediction
ETH has pulled back to the 20-day EMA ($2,154), which is a crucial support to watch out for in the short term.

If the ETH price rebounds off the 20-day EMA with force, it suggests that the bulls are buying on dips. That improves the prospects of a rally above the $2,386 resistance. If that happens, the ETH/USDT pair may surge toward $2,800.
Alternatively, a break below the moving averages indicates that the bears are active at higher levels. That may signal a consolidation between $1,916 and $2,386 for a while.
BNB price prediction
Buyers are struggling to push BNB (BNB) above the moving averages, indicating that the bears are attempting to retain control.

Sellers will try to strengthen their position by pulling the BNB price below the $570 level. If they manage to do that, the BNB/USDT pair may resume the downtrend toward the next target objective at $500.
On the contrary, if the price turns up from the current level or the $570 support and rises above the moving averages, it suggests that the pair may remain range-bound for a few more days.
XRP price prediction
XRP (XRP) remains stuck between the $1.27 level and the 50-day SMA ($1.37), indicating a balance between supply and demand.

Sellers will attempt to gain the upper hand by pulling the XRP price below the $1.27 support. If they can pull it off, the XRP/USDT pair may descend to $1.11 and thereafter to the support line of the descending channel pattern.
This negative view will be invalidated in the near term if the price turns up and breaks above the moving averages. That opens the gates for a rally to the downtrend line, which is expected to act as stiff resistance.
Solana price prediction
Solana (SOL) turned down from the 50-day SMA ($85) on Sunday, indicating that the bears are selling on minor rallies.

Sellers will strive to pull the SOL price down to the $76 level, which is likely to attract buyers. If the price rebounds off the $76 level, the bulls will again attempt to pierce the 50-day SMA. If they succeed, the SOL/USDT pair may extend its stay inside the $76 to $98 range for some more time.
A close below the $76 level indicates that the bears have seized control. That increases the likelihood of a drop below the $67 level.
Related: Strategy buys 13,927 Bitcoin for $1B, holdings near 800,000 BTC
Dogecoin price prediction
Dogecoin (DOGE) is getting squeezed between the moving averages and the $0.09 support, signaling a potential range expansion in the next few days.

If the DOGE price continues lower and closes below the $0.09 support, it shows that the bears have overpowered the bulls. The DOGE/USDT pair may plummet to $0.08 and subsequently to the $0.06 support.
Time is running out for the bulls. They will have to push and maintain the price above the moving averages to begin a relief rally. The pair may then rise to $0.11 and, after that, to the $0.12 level.
Hyperliquid price prediction
Buyers failed to propel Hyperliquid (HYPE) above the $43.76 overhead resistance on Saturday, indicating that the bears are aggressively defending the level.

A positive sign in favor of the bulls is that they have not ceded much ground to the bears. That enhances the prospects of a break above the $43.76 level. If that happens, the HYPE price may soar to $50.
Contrary to this assumption, if the price turns down and breaks below the 20-day EMA, it suggests that the bulls have given up. The HYPE/USDT pair may then slump to the 50-day SMA ($35.99).
Cardano price prediction
Cardano (ADA) plunged below the $0.25 level on Sunday, signaling that the bears are attempting to take charge.

The $0.23 level is the crucial support to watch out for on the downside. If the level breaks down, the ADA price may drop to the Feb. 6 low of $0.22 and later to the support line of the descending channel pattern.
The first sign of strength will be a break and close above the 50-day SMA ($0.26). Sellers will attempt to halt the relief rally at the downtrend line; if the bulls prevail, the ADA/USDT pair could signal a potential trend change.
This article does not contain investment advice or recommendations. Every investment and trading move involves risk, and readers should conduct their own research when making a decision. While we strive to provide accurate and timely information, Cointelegraph does not guarantee the accuracy, completeness, or reliability of any information in this article. This article may contain forward-looking statements that are subject to risks and uncertainties. Cointelegraph will not be liable for any loss or damage arising from your reliance on this information.


The US politics story with the most direct impact on American households went live Monday morning when the Navy blockade of Iranian ports took effect at 10 AM ET, pushing Brent crude above $103, WTI to $104, and keeping average US gasoline above $4.12 per gallon at a moment when March inflation has already confirmed a jump to 3.3 percent.
Summary
- The blockade went live after 21 hours of US-Iran talks in Islamabad collapsed Saturday night, with VP Vance announcing Iran refused to commit to giving up its nuclear program; oil has now risen more than 50 percent since the war began February 28, and gas prices are up 38 percent from pre-war levels despite a brief dip following the April 7 ceasefire.
- March CPI confirmed Friday at 3.3 percent annual rate, up sharply from 2.4 percent in February, driven by the largest one-month jump in fuel costs since at least 1957; food prices, airline fees, and mortgage costs are all expected to follow energy higher in April as supply chain pressures from the Strait of Hormuz disruption compound through the economy.
- Trump acknowledged on Fox News Sunday that gas prices could be “the same or maybe a little bit higher” by the midterm elections, a rare admission from the White House that the economic costs of the blockade are not expected to resolve quickly.
CNN’s analysis of the blockade’s economic impact noted that while the move is designed to pressure Iran by cutting off its oil export revenue, which was approximately $45 billion last year and represents 13 percent of Iran’s GDP, it also threatens to worsen the war’s impact on American consumers who are already managing the most severe energy shock since the 1970s. Quincy Institute executive vice president Trita Parsi warned Monday that taking more Iranian oil off the market could drive prices “around $150 per barrel.” Karen Young at the Middle East Institute told CNN: “It could be a long time from now” before oil prices come down.
The blockade also carries structural risks beyond its direct energy price impact. China is Iran’s largest oil buyer, and a blanket ban on tankers carrying Iranian crude threatens to draw Beijing directly into the confrontation at a moment when Trump has a planned trip to China scheduled for next month.
The transmission from oil to everyday costs is already underway. Gasoline at $4.12 per gallon is just the most visible line item. Fertilizer prices, which are tied to natural gas and petroleum inputs, affect grocery costs over a six-to-eight week lag. Food packaging, transportation, and heating costs all carry an energy component that has not yet fully passed through to consumer prices. The March CPI reading of 3.3 percent captured only the initial shock. Oxford Economics projected in its pre-release analysis that headline CPI would climb above 4 percent in April as the energy price increase reaches a broader range of goods and services.
What the Fed Can and Cannot Do
The Federal Reserve held rates steady at its last meeting and has effectively scrubbed rate cut expectations from its 2026 calendar. The Fed typically prefers to look through energy-driven inflation as temporary, but the blockade introduces the possibility that energy prices do not mean-revert on a predictable timeline. If the ceasefire expires April 22 without an extension and the blockade tightens further, the Fed faces a genuine stagflation scenario: inflation rising from the energy shock while economic growth slows from higher input costs across the economy.
What to Watch Before the Ceasefire Expires April 22
The crypto and broader market implications of the Iran situation are now centered on whether the blockade produces enough economic pressure on Tehran to restart talks before April 22, or whether the ceasefire expiry triggers a return to full hostilities. The diplomatic path that ended the Islamabad talks on Iran’s nuclear program remains unresolved, and neither the blockade nor the ceasefire extension question has a clear resolution. As this week’s developments confirm, every escalation step in the Iran conflict has produced a direct and immediate response in energy prices, equity markets, and crypto simultaneously.
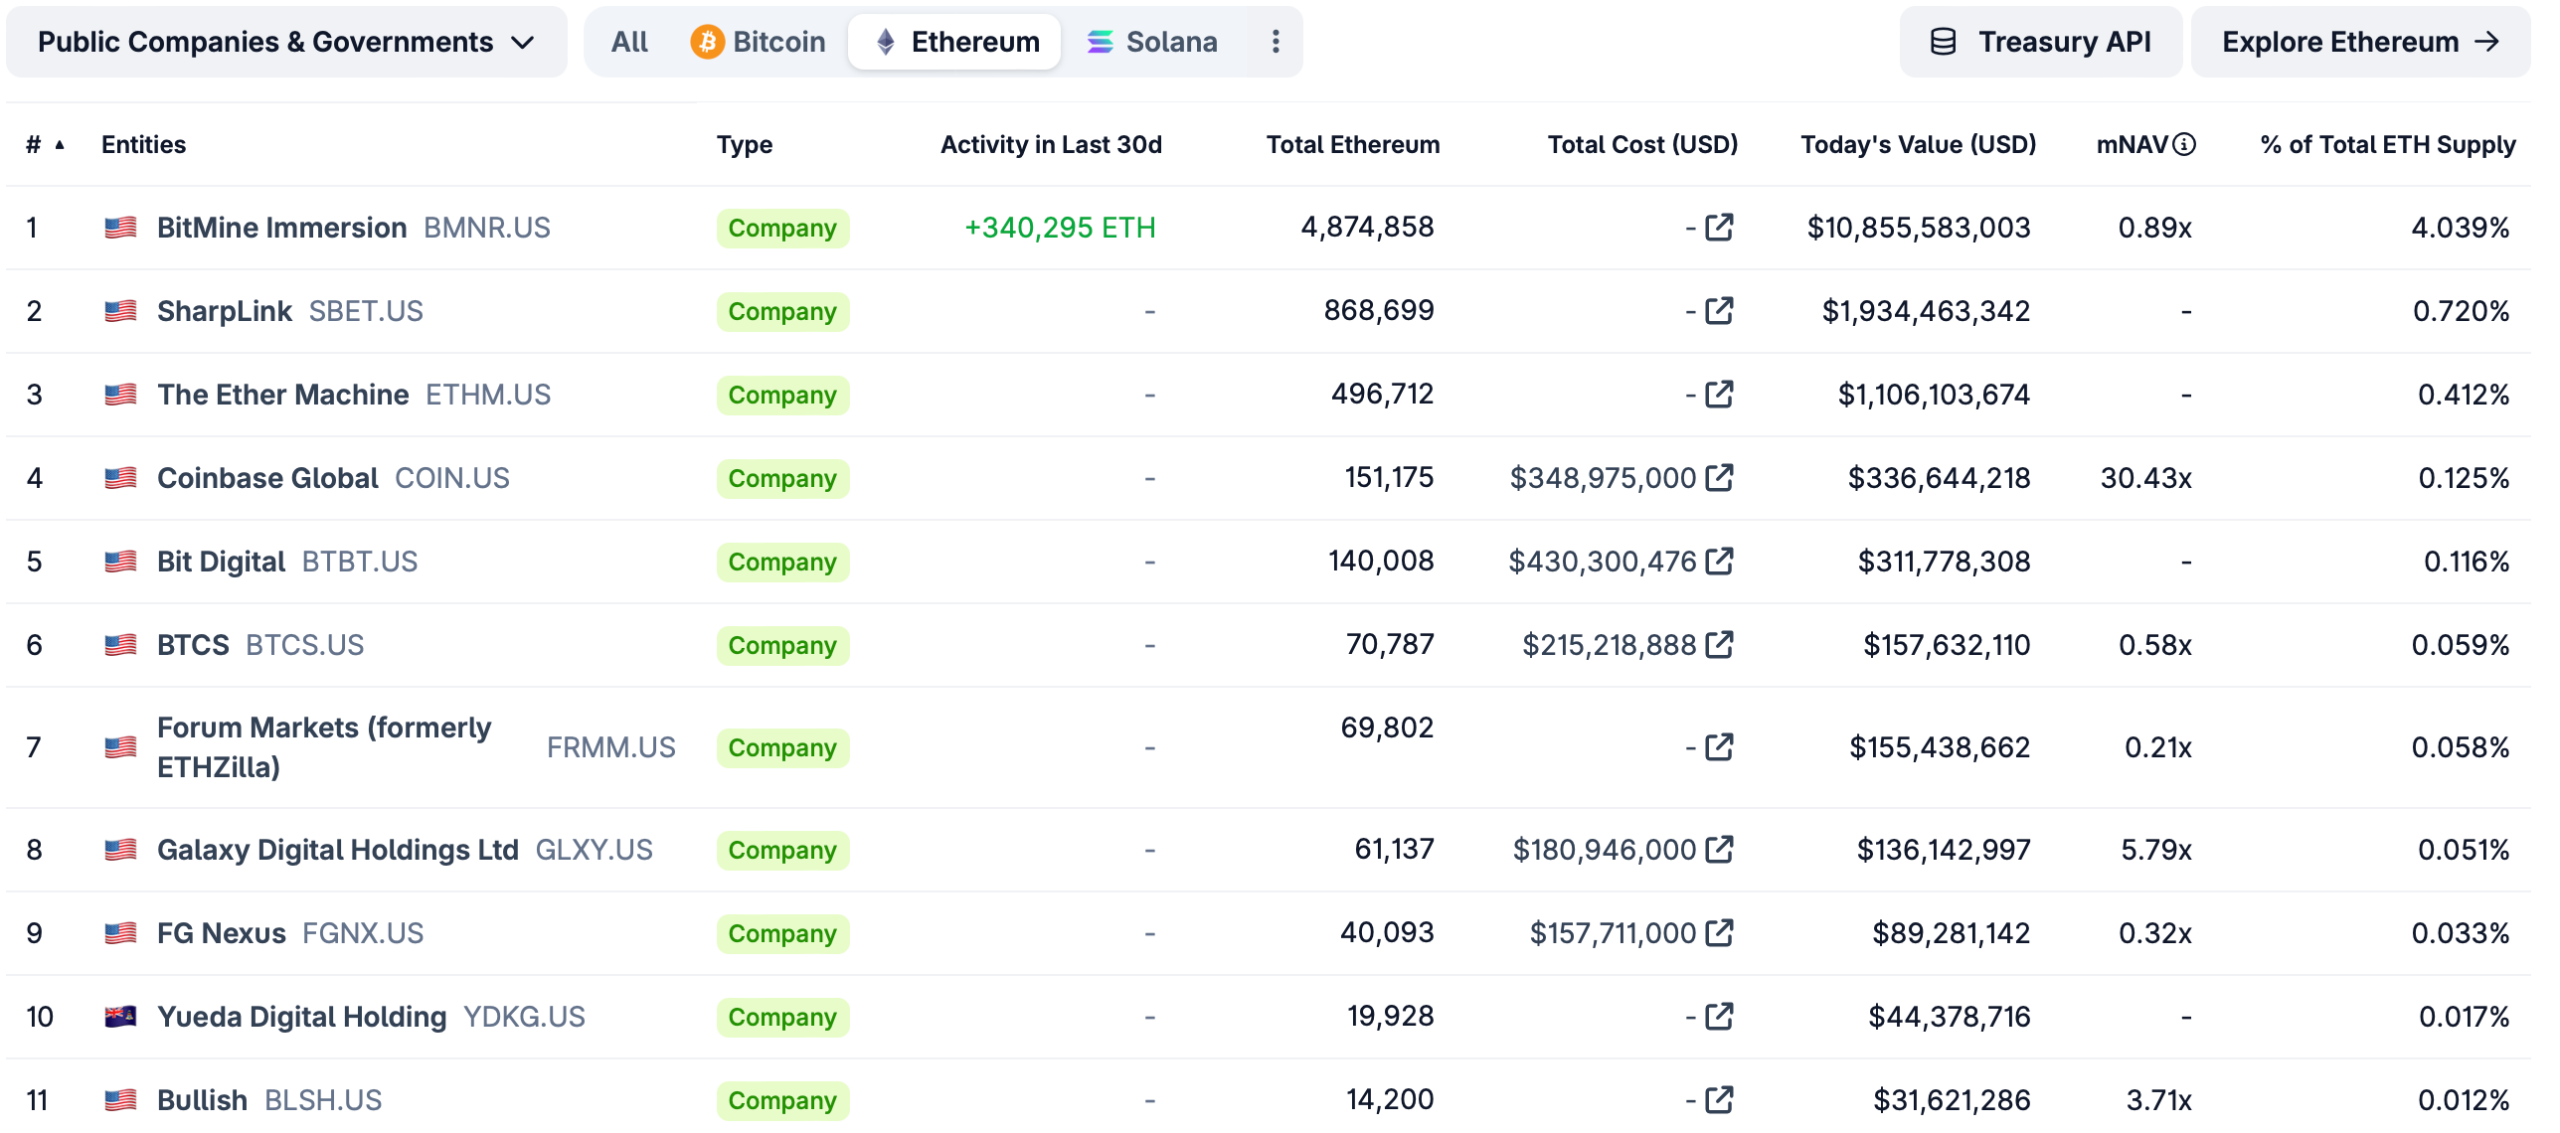
Bitmine Immersion Technologies said Monday that it purchased 71,524 Ether over the past week, bringing its total holdings to about 4.87 million tokens.
The company said the position represents roughly 4.04% of the total Ether (ETH) supply, based on about 120.7 million tokens outstanding, as it continues to pursue a target of acquiring up to 5% of global supply. Its balance sheet also includes 198 Bitcoin (BTC) and about $719 million in cash.
Bitmine said the latest purchase marks its fastest weekly pace of Ether accumulation since December 2025.
According to data from CoinGecko, Bitmine is the largest Ethereum treasury company by a wide margin, with SharpLink holding about 868,699 ETH and The Ether Machine holding 496,712 ETH.
It is also one of the few Ethereum treasury companies to increase its holdings over the past 30 days. Exodus Movement was the only other company in the dataset to do so, adding 17 ETH to reach a total of 1,857 ETH.
Chairman Tom Lee said Ether has outperformed traditional assets in recent weeks, citing demand tied to tokenization activity on Wall Street and growing use of public blockchains by AI systems.
Ether is up about 7% over the past month, limiting its year-to-date decline to about 25%, according to CoinGecko data.
A portion of the holdings is staked through MAVAN, the company’s in-house platform, with about 3.33 million ETH currently staked and projected annual rewards of roughly $310 million based on recent yields.
The announcement follows Bitmine’s April 9 debut on the New York Stock Exchange after uplisting from NYSE American, a move that typically signals stricter listing standards and broader access to institutional capital.

Related: Ether Machine scraps SPAC merger with Dynamix, citing market conditions
Strategy buys as most treasury companies hold or sell
Bitmine wasn’t the only crypto treasury company to buy in recent days, as Strategy on Monday also disclosed another major accumulation, bringing its Bitcoin’s total holdings closer to 800,000 BTC.
The world’s largest public BTC holder said it acquired 13,927 Bitcoin for $1 billion between April 6 and April 12, at an average price of $71,902 per coin, below its overall average purchase price of $75,577. Strategy now holds 780,897 BTC, purchased for a total of $59.02 billion, with just over 19,000 BTC remaining to reach the 800,000 mark.
Bitcoin treasury activity over the past 30 days shows a divergence between accumulation and selling. Strategy led buying by a wide margin, adding 42,166 BTC, while Japan’s Metaplanet increased its holdings by 5,075 BTC. Smaller additions came from companies like Strive, which added 430 BTC.

In contrast, Bitcoin miners drove most of the selling, with MARA Holdings offloading 15,133 BTC, while Riot Platforms reduced holdings by 2,325 BTC.
Magazine: Asia Express: Phantom Bitcoin checks, China tracks tax on blockchain


Weekend panics followed by Monday reversals have become the norm in 2026, and the action over the last 48 hours has continued that pattern.
Down about 4% from late Saturday night into early Monday morning on news that U.S. Vice President J.D. Vance had left Pakistan without an Iran peace deal and President Trump’s ordering of a blockade of the Strait of Hormuz, bitcoin erased those losses in Monday U.S. action.
Trading at $73,400 as U.S. stocks closed for the day, bitcoin was higher by more than 3% over the last 24 hours. Ether (ETH), solana (SOL) and XRP (XRP) were also in the green, though posting slightly smaller gains than BTC.
Leading crypto-related stocks higher were Circle (CRCL), up 11%, Gemini (GEMI), up 9%, and MARA Holdings (MARA) and Bullish (BLSH), each up just over 8%.
In traditional markets, the Nasdaq was higher by 1.2%, and WTI crude oil had pulled all the way back to $98 per barrel after topping $105 at one point on Sunday.
No let-up from Strategy
Away from Middle East issues, Michael Saylor’s Strategy (MSTR) continues to hoover up bitcoin at a mighty pace. The company last week bought 13,927 BTC for $1 billion. Interestingly, Saylor and team issued no common stock to fund the purchases, but instead $1 billion worth of their STRC preferred stock, which yields 11.5%.
The action today in STRC suggests more big buys are coming this week. Volume Monday on STRC (when checked just before 3 pm ET) was a record $770 million. With the stock continuing to trade at par, it suggests sizable additional issuance by Strategy, and thus more large bitcoin buys.

Netflix enters Q1 with a clearer narrative after shelving the Warner Bros. Discovery acquisition, shifting investor attention toward fundamentals and growth drivers. The company reiterates a Q1 revenue target of $12.16 billion, about 15% higher than a year earlier, and an EPS of $0.76, while guiding full-year revenue of $50.7–$51.7 billion and a 31.5% operating margin (up from 29.5% in 2025). The message also notes the resumption of its buyback program, US price increases, and a rapidly expanding advertising business that could diversify revenue beyond subscriptions. With $20 billion planned for content this year, the question is whether growth remains profitable.
Key points
- Q1 revenue guidance of $12.16B with about 15% YoY growth and EPS of $0.76.
- Full-year revenue guidance of $50.7–$51.7B and an operating margin of 31.5% (vs 29.5% in 2025).
- Warner Bros. Discovery deal abandoned; buyback program resumed; US price increases implemented.
- Advertising revenue rose sharply in 2025 (to about $1.5B) and is expected to reach roughly $3B in 2026.
Why it matters
The preview signals Netflix is balancing strong content investment with profitability, as investors assess whether growth can continue alongside margin expansion. The removal of the Warner deal overhang, renewed buybacks, and a rising ad-supported tier give a more complete picture of Netflix’s revenue mix and potential for higher-margin growth beyond subscriptions.
What to watch
- Q1 actual results: revenue, EPS, and how they compare to guidance.
- Performance of the ad-supported tier and total ad revenue progression toward $3B in 2026.
- Impact of US price increases and content spending on margins and subscriber dynamics.
Disclosure: The content below is a press release provided by the company or its PR representative. It is published for informational purposes.
Netflix Q1 Preview: $12.16B Revenue, 15% Growth
Abu Dhabi, UAE -13 April 2026: Netflix enters its first-quarter earnings in a notably different position compared to three months ago, with renewed investor focus on fundamentals following key strategic shifts, according to the latest market commentary from eToro.

Josh Gilbert, Market Analyst at eToro, highlighted that Netflix’s decision to walk away from the Warner Bros. Discovery acquisition in March has removed a major overhang for investors, while the resumption of its share buyback programme and recent US price increases have further reshaped sentiment around the stock.
“Netflix is heading into this earnings season with a cleaner narrative,” said Gilbert. “With the Warner deal off the table, investor attention can now return squarely to fundamentals and growth drivers.”
Netflix has guided for Q1 revenue of $12.16 billion, representing approximately 15% year-on-year growth, alongside earnings per share of $0.76. For the full year, the company expects revenue between $50.7 billion and $51.7 billion, with an operating margin of 31.5%, up from 29.5% in 2025.
Gilbert noted that the company’s previous earnings fell short of analyst expectations, particularly around forward guidance, placing added pressure on this quarter’s results.
“With $20 billion earmarked for content spend this year, the market will be looking closely at whether Netflix can sustain growth without eroding profitability,” he added.
A key area of focus for investors this quarter will be Netflix’s advertising business. Following a milestone of more than 325 million subscribers last quarter, the company’s advertising revenue more than doubled in 2025 to approximately $1.5 billion and is expected to double again to $3 billion this year.
“Advertising is quickly becoming a critical second revenue engine for Netflix,” Gilbert explained. “If Q1 results show the ad-supported tier remains on track, it strengthens the case that Netflix can drive higher-margin growth beyond subscriptions.”
With the Warner deal no longer a factor, the buyback programme back in motion, and its advertising business scaling rapidly, Gilbert believes Netflix has an opportunity to reinforce its leadership position in the streaming sector.
“This is a pivotal quarter for Netflix to remind the market why it continues to lead the streaming space,” he concluded.
About eToro
eToro is the trading and investing platform that empowers you to invest, share and learn. Founded in 2007 with the vision of a world where everyone can trade and invest in a simple and transparent way, today eToro has 40 million registered users from 75 countries.
eToro believes in the power of shared knowledge and that investors can become more successful by investing together. The platform has built a collaborative investment community designed to provide users with the tools they need to grow their knowledge and wealth. On eToro, users can hold a range of traditional and innovative assets and choose how they invest: trade directly, invest in a portfolio, or copy other investors.
Visit eToro’s media centre for the latest news.

BITCOIN: it failed.
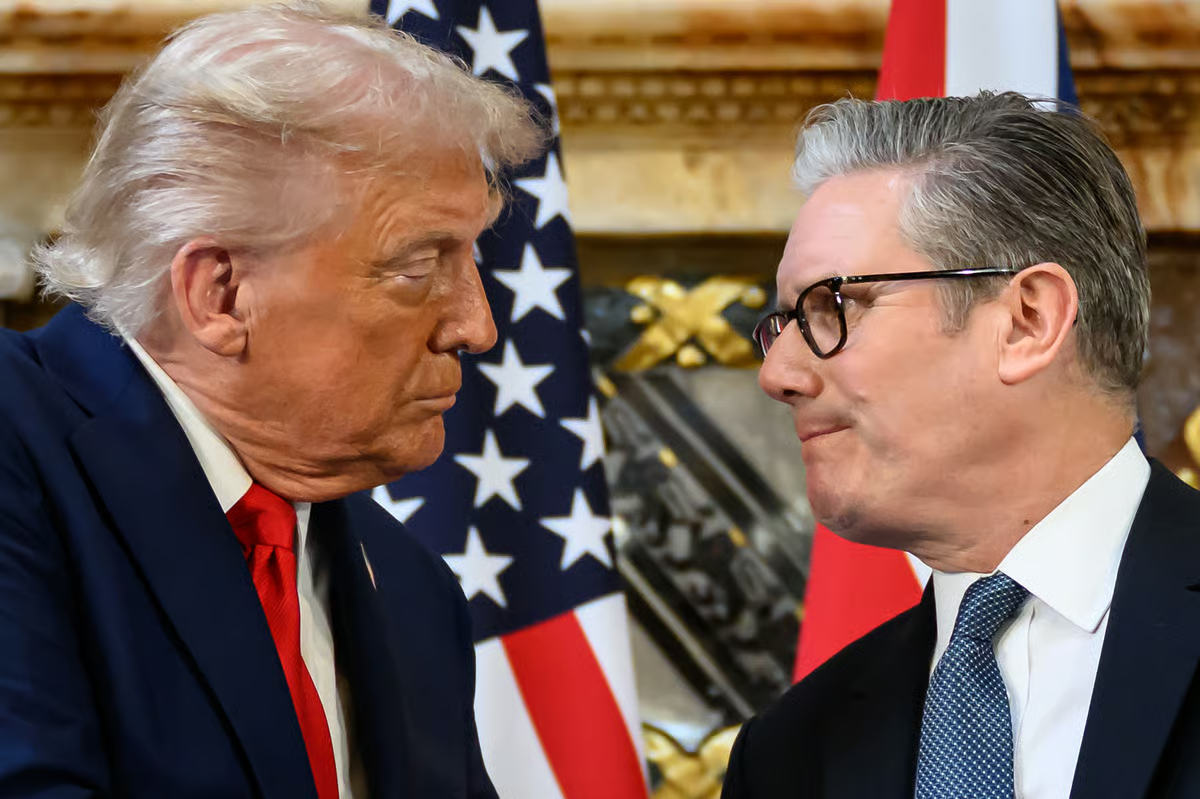
Strait of Hormuz blockade comes into effect as Starmer rejects Trump’s plan

LARRY KUDLOW: Trump Jiu-Jitsu aims to bankrupt and starve the Iranian regime


-

 Politics3 days ago
US brings back mandatory military draft registration
-

 Fashion3 days ago
Weekend Open Thread: Veronica Beard
-
 Sports3 days ago
Man United discover Nico Schlotterbeck transfer fee as defender reaches Dortmund agreement
-

 Tech6 days ago
How Long Can You Drive With Expired Registration? What Florida Law Says
-

 Politics1 day ago
World Cup exit makes Italy enter crisis mode
-

 Crypto World4 days ago
Canary Capital Files SEC Registration for PEPE ETF
-

 Business3 days ago
Tesla Model Y Tops China Auto Sales in March 2026 With 39,827 Registrations, Beating Cheaper EVs and Gas Cars
-

 Politics4 days ago
Malcolm In The Middle OG Turned Down ‘Buckets Of Money’ To Appear In Reboot
-

 Crypto World5 days ago
Bitcoin recovers as US and Iran Agree a Ceasefire Deal
-

 Fashion6 days ago
Let’s Discuss: DEI in 2026
-
 NewsBeat23 hours ago
Pep Guardiola and Gary Neville agree over Arsenal title problem that benefits Man City
-

 Business3 days ago
OpenAI Halts Stargate UK Data Centre Project Over Energy Costs and Copyright Row
-

 Business2 days ago
Ireland Fuel Protests Enter Day 5 as Blockades Spark Shortages and Government Prepares Support Package
-

 Crypto World3 hours ago
The SEC Conditionalises DeFi Platforms to Be Avoided for Broker Registration
-

 Politics4 days ago
LBC Presenter Mocks Trump Over Iran War Failures
-

 Crypto World3 days ago
Federal judge blocks Arizona from bringing criminal charges against Kalshi
-

 Tech4 days ago
A version of Windows 10 released a decade ago is now eligible for additional security patches
-
 NewsBeat2 days ago
JD Vance announces ‘no agreement’ with Iran over nuclear weapons fear
-

 Business3 days ago
IMF retains floor for precautionary balances at SDR 20 billion
-
 Entertainment4 days ago
A ‘Bridgerton’ Star’s New Survival Thriller Is a Must-Watch on Netflix This Weekend
You must be logged in to post a comment Login