

Crypto World
BTC modestly bounces after weekend tumble
The slide that began Saturday night, after Vice President J.D. Vance left Pakistan without securing a peace deal in Iran, has, for the moment, somewhat reversed.
After falling to as low as $70,500 at one point Sunday, the price of bitcoin has bounced back to $72,100 during U.S. Monday morning trading hours. Helping were reports suggesting Iran was considering the abandonment of its enriched uranium as a concession towards ending the war.
U.S. stocks have also reversed big early losses, the Nasdaq now higher by 0.3% after sliding more than 1%.
Meanwhile, the promised U.S. blockade of the Strait of Hormuz — scheduled for 10 am ET — has apparently gone into effect.
“Security in the Persian Gulf and the Sea of Oman is either for everyone or for NO ONE,” the Islamic Republic of Iran Broadcasting reported Monday. “NO PORT in the region will be safe,” based on a statement from Iran’s military and the Revolutionary Guards.
Crypto-related stocks are on the move higher as well, led by a 8.3% gain for stablecoin issuer Circle (CRCL). Coinbase (COIN) is up 3.1% and Strategy (MSTR) by 1.5%.
Read more: Strategy buys 13,927 bitcoin for $1 billion, entirely through STRC
Does lightning strike twice?
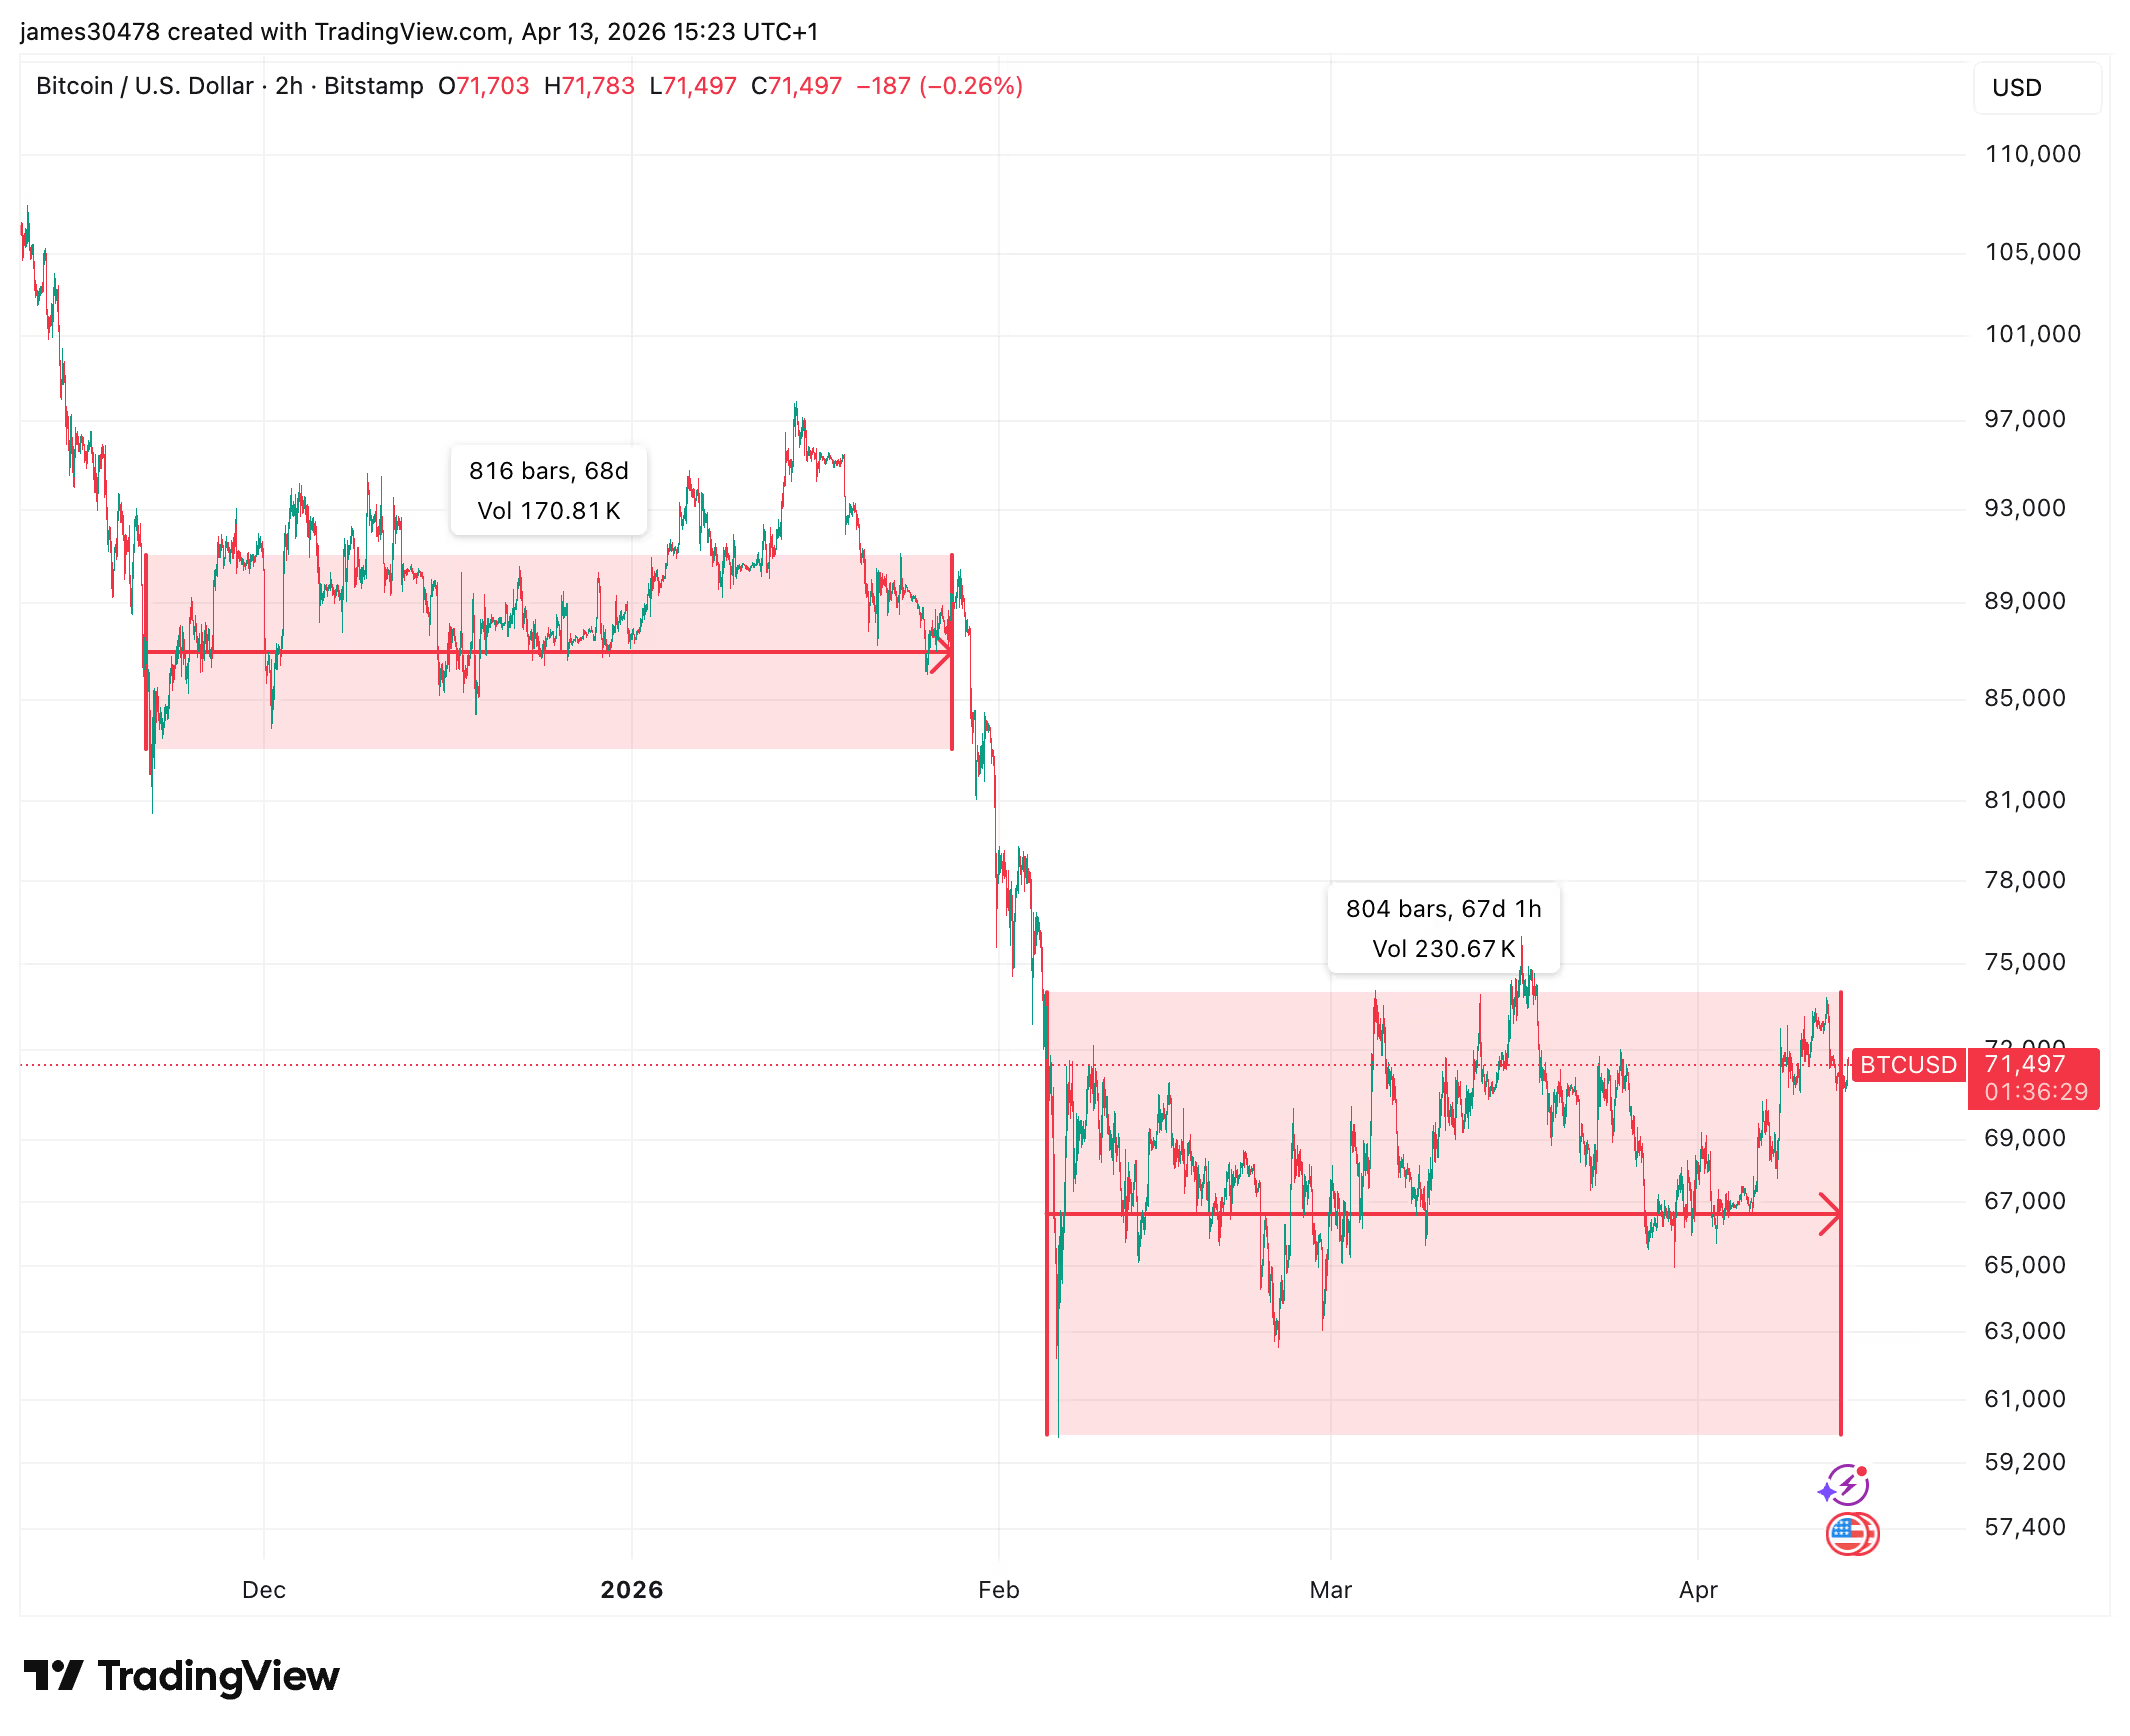
Bitcoin has now been consolidating for 67 days since its local bottom on Feb. 5 at $60,000, almost identical to the 68-day consolidation period between Nov. 21 and Jan. 28, which preceded a sharp drop from roughly $90,000 to $60,000 in the span of a week. Bears anticipate a similar outcome, which may include a retest of the 200-week moving average around $60,000.


Shares in MARA Holdings fell after the bell on Monday as the Bitcoin miner’s first-quarter losses deepened from a year ago and its revenues missed analyst estimates.
MARA’s earnings released on Monday reported its revenue for the quarter ending March 31 dropped 18% year-on-year to $174.6 million, missing Wall Street expectations of $192.7 million.
The company reported a loss of $1.3 billion for the quarter, widening from its $533.4 million loss from the year-ago quarter. Its earnings per share were a loss of $3.31, compared to estimates of a loss of $2.20.
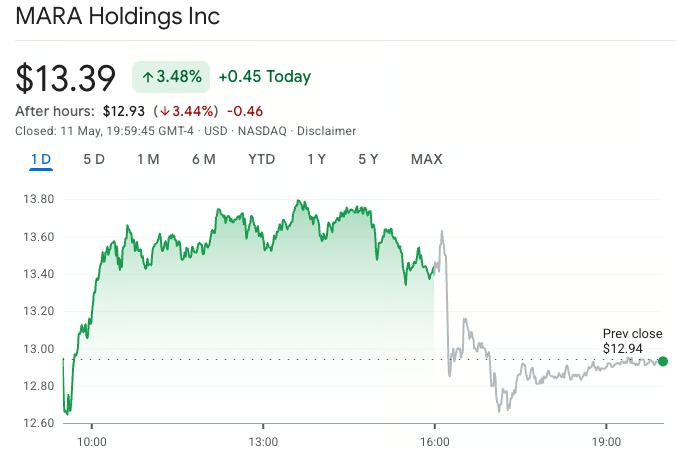
Shares in MARA Holdings (MARA) fell 3.44% in after-hours trading on Monday to $12.93, erasing gains over the trading day, which ended at a gain of 3.48% to $13.39.

MARA Holdings erased gains after the bell on Monday after the company’s earnings missed expectations. Source: Google Finance
MARA stock has fallen 16% over the last 12 months, but has begun to mount a return this year as it has focused on pivoting to build artificial intelligence data centers.
The company reported its first-quarter losses were largely attributed to unrealized losses in its 38,689 Bitcoin treasury as the cryptocurrency fell 23% during the quarter. MARA said it sold more than 15,100 Bitcoin worth $1.1 billion in the final week of March.
MARA said that Bitcoin mining remains the company’s “operational foundation,” even as it continues expanding into AI and high-performance computing to pursue additional revenue streams.
MARA is one of several US-based Bitcoin miners that have seen profits turn into losses as challenging mining conditions continue to weigh on the sector.
Bitcoin is trading more than 35% below its all-time high of $126,080, significantly reducing miner revenues per block, while mining difficulty, a measure of how computationally difficult it is to mine a block, has risen nearly 30% over the past year.
MARA has also lost ground to competitors, falling from the largest Bitcoin miner by market cap to seventh place as rivals have more aggressively expanded into AI.
Related: Saylor signals another Bitcoin buy after hinting at selling in Q1 earnings call
MARA’s current AI strategy centers on its partnership with Starwood Capital, aimed at converting Bitcoin mining sites into AI and HPC data centers, and Long Ridge Energy & Power, a gas-fired power plant and data center that it acquired for $1.5 billion in late April.
“Our strategy centers on co-locating new infrastructure with existing Bitcoin mining operations,” MARA said. “This approach creates flexibility: we can generate revenue today through Bitcoin mining while preserving the option to redirect power toward AI and critical IT loads as those opportunities mature on the same sites.”
MARA added that the Long Ridge Energy & Power acquisition could eventually support 600 megawatts of AI computing capacity and that around 90% of its non-hosted mining capacity could be redeployed for AI and IT compute.
The company said it does not have any plans to purchase additional Bitcoin mining hardware.
Magazine: Bitdeer sells all Bitcoin, Metaplanet rejects misconduct claims: Asia Express
Google’s Threat Intelligence Group says it identified what it believes is the first-ever case of hackers using artificial intelligence to develop a zero-day exploit.
The group said in a Tuesday blog post that it had “observed prominent cyber crime threat actors partnering to plan a mass vulnerability exploitation operation,” using a zero-day vulnerability allowing them to bypass the two-factor authentication of an unnamed “popular open-source, web-based system administration tool.”
The exploit required valid user credentials first, but bypassed the second authentication factor, which is often also used to secure crypto accounts and wallets.
AI has been increasingly used in both cybersecurity and by crypto hackers seeking to carry out exploits or scams. AI company Anthropic claimed last month that its recent AI model, Claude Mythos, found thousands of software vulnerabilities across major systems.
Google said it had “high confidence that the actor likely leveraged an AI model to support the discovery and weaponization of this vulnerability,” as the script for the exploit included a hallucination and a format “highly characteristic” of an AI model’s training data.
The report did not specify the threat actor, but Google said that China and North Korea have “demonstrated significant interest in capitalizing on AI for vulnerability discovery.”
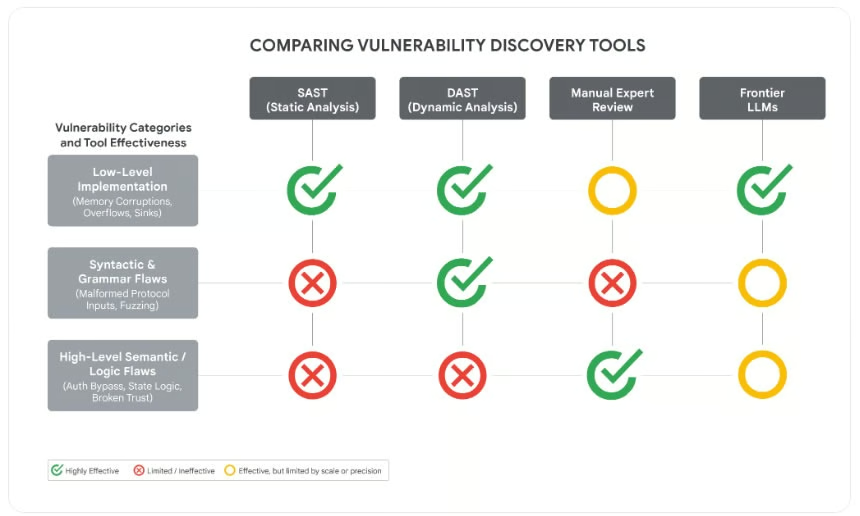
LLMs excel at high-level flaw identification
Google said the vulnerability did not stem from “common implementation errors” like memory corruption, but a “high-level semantic logic flaw” where the developer hardcoded a trust assumption.
This implies the attackers used a frontier large language model (LLM), as the models excel at identifying high-level flaws and “hardcoded static anomalies,” Google added.
Related: AI agents like OpenClaw could drain crypto wallets via ‘malicious skills’: CertiK
Several malware families, such as PROMPTFLUX, HONESTCUE and CANFAIL also use LLMs for defense evasion, generating decoy or filler code to camouflage malicious logic, Google said.

LLM vulnerability discovery capabilities compared with other discovery mechanisms. Source: Google
Industrialized LLM abuse is increasing
LLM access abuse is becoming industrialized as threat actors have built automated pipelines to cycle through premium AI accounts, pool API keys, and bypass safety guardrails at scale — effectively running adversarial operations subsidized by trial account abuse.
“By leveraging anti-detect browsers and account-pooling services, actors are attempting to maintain high-volume, anonymized access to premium LLM tiers, effectively industrializing their adversarial workflows.”
Google concluded that as organizations continue integrating LLMs into production environments, the AI software ecosystem has emerged as a primary target for exploitation.
It observed adversaries increasingly targeting the integrated components that grant AI systems their utility, such as autonomous skills and “third-party data connectors,” but threat actors have yet to achieve breakthrough capabilities to bypass the core security logic of frontier models, it stated.
Magazine: How AI just dramatically sped up the quantum risk for Bitcoin
Ether treasury company Bitmine Immersion Technologies has slowed the pace of its Ether purchases after previously increasing its buying rate and acquiring more than 100,000 tokens over the last three weeks.
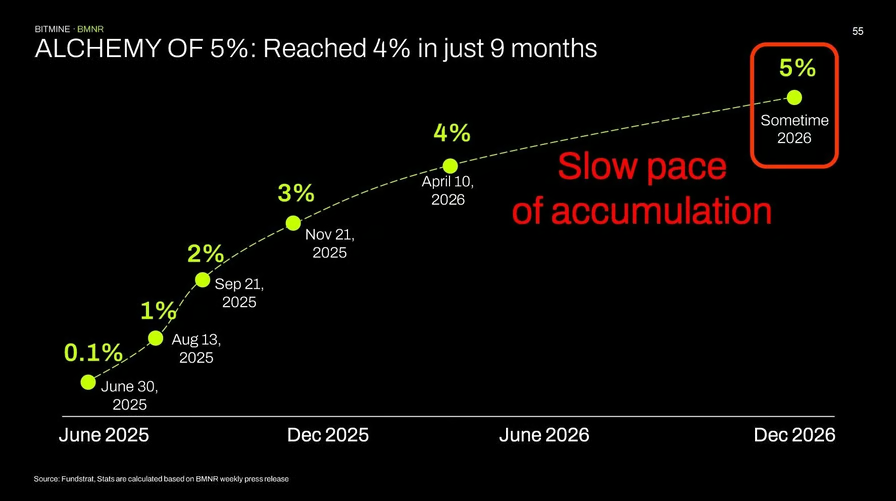
Bitmine said on Monday that it purchased 26,659 ETH over the last week, down from the over 100,000 tokens a week it was previously maintaining, but that it was still on track for its goal to buy 5% of the token’s 120.7 million circulating supply by the end of the year.
“We have decided to slow down our pace of weekly accumulation from >100,000 per week as we originally targeted reaching the ‘alchemy of 5%’ target in late 2026,” Bitmine Chairman Tom Lee said. “Our previous pace of >100k weekly buys would have us reach 5% by mid-July.”
Bitmine is the largest Ether treasury company and one of the most frequent buyers of the token, a business model it adopted from Michael Saylor’s Bitcoin treasury firm Strategy.

Bitmine estimates it will reach its goal of holding 5% of the Ether supply by the end of 2026. Source: Bitmine
Bitmine plans staking of entire Ether stash
Bitmine’s total staked Ether stands at over 4.7 million, and the company estimates its annual staking rewards will be roughly $352 million once its entire stash is staked. Blockchain explorer beaconcha.in has tracked over 38 million Ether staked as of Sunday.
Lee said the goal is for Bitmine to eventually stake its entire stash.
“We intend to hold and stake our ETH holdings, which means our ETH holdings are essentially reducing available supply of ETH and removed 4.3% of ETH supply since June 30th, 2025. In other words, ETH supply has been disinflationary since June 2025,” he said.

Bitmine has staked over 4.7 million Ether. Source: Bitmine
Ether hit an all-time high of $4,946 in August 2025, but it dropped in line with the rest of the crypto market towards the end of last year. It’s still down 52% from its peak and has been drifting between $2,274 and $2,411 over the last seven days, according to CoinGecko.
Crypto spring in full swing
Lee also doubled down on his belief that a so-called “crypto spring has started and pointed to Ether’s price rising in correlation with software stocks as further evidence.
“Crypto spring has commenced and we wanted to highlight the importance of owning ETH as a source of diversification, and the likely drivers of this coming ‘crypto bull’ cycle,” he added.
“If ETH closes above $2,100 at the end of May 2026, this would be the third consecutive monthly gain – this has never been seen in a crypto bear market. Thus, a close above $2,100 would validate ‘crypto spring’ has arrived.”
Magazine: Guide to the top and emerging global crypto hubs — Mid-2026


The legislation that could fully insert the U.S. crypto industry into the regulated financial system has emerged in its latest form, with the Senate Banking Committee unveiling the market structure bill’s text just after midnight on Tuesday in advance of this week’s hearing that’s set to push the effort forward.
The latest version wasn’t expected to offer many surprises for the crypto industry that’s already had a chance to dig through it privately, but it includes still-contentious language on stablecoin yield and it maintains legal protections for decentralized finance (DeFi) developers, keeping that corner of the crypto sector happy (so far). Industry insiders waited for the release late into the night, and they’ll still have to study the language to ensure their expectations were met.
“This bill reflects serious, good-faith work across the committee and delivers the certainty, safeguards, and accountability Americans deserve,” committee Chairman Tim Scott said in a statement. “It puts consumers first, combats illicit finance, cracks down on criminals and foreign adversaries and keeps the future of finance here in the United States.”
While an approval in the committee would mark a major, long-stymied step forward, the bill’s arrival at President Donald Trump’s desk is far from assured. Action this week would keep the possibility of passage alive, though a number of other hurdles remain — including the insertion of an ethics provision that isn’t yet present in this draft.
Ethics provision
The conflict-of-interest section that would theoretically limit government officials from profiting from the crypto industry is not under the jurisdiction of the banking panel, so the topic has to get into the legislation later. It’s been a contentious issue, because its genesis was seated in President Donald Trump’s own wide-ranging crypto interests, but White House officials have repeatedly said they wouldn’t tolerate a bill that targets the president. Meanwhile, Democrats won’t allow the bill to move without such a section, Senator Kirsten Gillibrand said last week at Consensus Miami 2026.
On the same stage in Miami, White House crypto adviser Patrick Witt said the current negotiating posture is to establish rules that apply “across the board, from the president all the way down to the brand new intern on Capitol Hill,” but reject anything that singles out a particular office or officeholder.
The committee’s ranking Democrat, Senator Elizabeth Warren, made clear that the ethics point is a priority, releasing a critical comment alongside the panel’s unveiling of the document.
“This bill puts investors, our national security and our entire financial system at risk — and it will turbocharge Donald Trump’s crypto corruption,” she said in a statement. “In just one year in office, the president and his family have raked in at least $1.4 billion in gains from crypto deals alone, and yet this bill stunningly includes zero provisions to prevent that.”
That ethics piece, though, remains on standby until the Senate committee can vote to approve the rest of the bill at its Thursday hearing.
Stablecoin yield
The newly released 309-page text includes the patch of policy ground over which lobbyists spent months fighting — the question regarding what type of yield would be acceptable for stablecoins. The document restricts the payment of interest or yield “solely in connection with the holding of … payment stablecoins” or on a stablecoin balance “in a manner that is economically or functionally equivalent to the payment of interest or yield on an interest-bearing bank deposit.”
Earlier on Monday, Coinbase CEO Brian Armstrong — whose company was at the center of the stablecoin rewards negotiation — held a live event on social media site X in which he said, “Not everyone got everything they wanted, but they got the must-haves.” He said his company is working with at least five of the largest global banks and is committed to banks successfully integrating crypto, he said.
“We want it to be win-win and work with the banks,” Armstrong said.
The outcome may have been settled for committee negotiators, but the bankers who consider stablecoins a threat have mounted a final assault to revamp the outcome. Over the weekend, the industry lobbying groups petitioned their members to make a last push among lawmakers to further limit stablecoin rewards programs in advance of the hearing.
At the same time, research released last week from Galaxy contended that trillions of dollars worth of foreign capital will flow into the U.S. financial system, easily making up for any domestic disruptions to deposits. The report “suggests a majority of stablecoin growth will originate offshore, meaning foreign capital will flow into U.S. banking infrastructure at a rate that materially exceeds any domestic deposit migration.”
DeFi
The legislation still includes a section to match DeFi’s Blockchain Regulatory Certainty Act, which protects software developers that don’t control people’s money from being treated as money transmitters, plus a number of other demands from DeFi defenders.
“We are encouraged by the direction of recent negotiations and note that the most important provisions for developers and infrastructure providers — the BRCA and protections under the Exchange Act — are in this bill,” the DeFi Education Fund said through a spokesperson, adding that the organizations will track amendments this week and will flag those that oppose the sector.
Meanwhile on Monday, Punchbowl News reported an accord among Senate lawmakers to address law-enforcement needs in the Clarity Act, specifically an allowance for prosecutors to pursue crypto misdeeds on the money-laundering front.
The White House’s Witt said last week that the administration is aiming for a July 4 finish for the Clarity Act, though Senator Gillibrand predicted its completion by the first week of August.
Work to do
Before then, Senate negotiators would still have some work to do on the bill after it advances beyond the committee. Assuming the Clarity Act gets a nod from the panel, it would still need to be merged with a similar version approved earlier by the Senate Agriculture Committee.
Then the lawmakers also need to resolve the sticky conflict-of-interest provision before a final version is likely to be available for a vote from the overall Senate, where 60 yes votes will be needed — necessarily including a significant number of Democrats. So far, the progress through the Senate has been dependent on Republican party-line voting, but other crypto efforts have typically reached major bipartisan support when the final votes come around.
Last year, the Guiding and Establishing National Innovation for U.S. Stablecoins of 2025 (GENIUS) Act succeeded on a 68-30 vote in the Senate, easily clearing the minimum.
Read More: Banking groups escalate fight over stablecoin yield ahead of Senate vote
UPDATE (May 12, 2026, 04:31 UTC): Adds comment from Senator Tim Scott, chairman of the Senate Banking Committee.
UPDATE (May 12, 2026, 04:43 UTC): Adds language from the proposed bill text.
UPDATE (May 12, 2026, 05:01 UTC): Adds remarks from Coinbase CEO Brian Armstrong.
UPDATE (May 12, 2026, 05:05 UTC): Adds comment from Senator Elizabeth Warren.
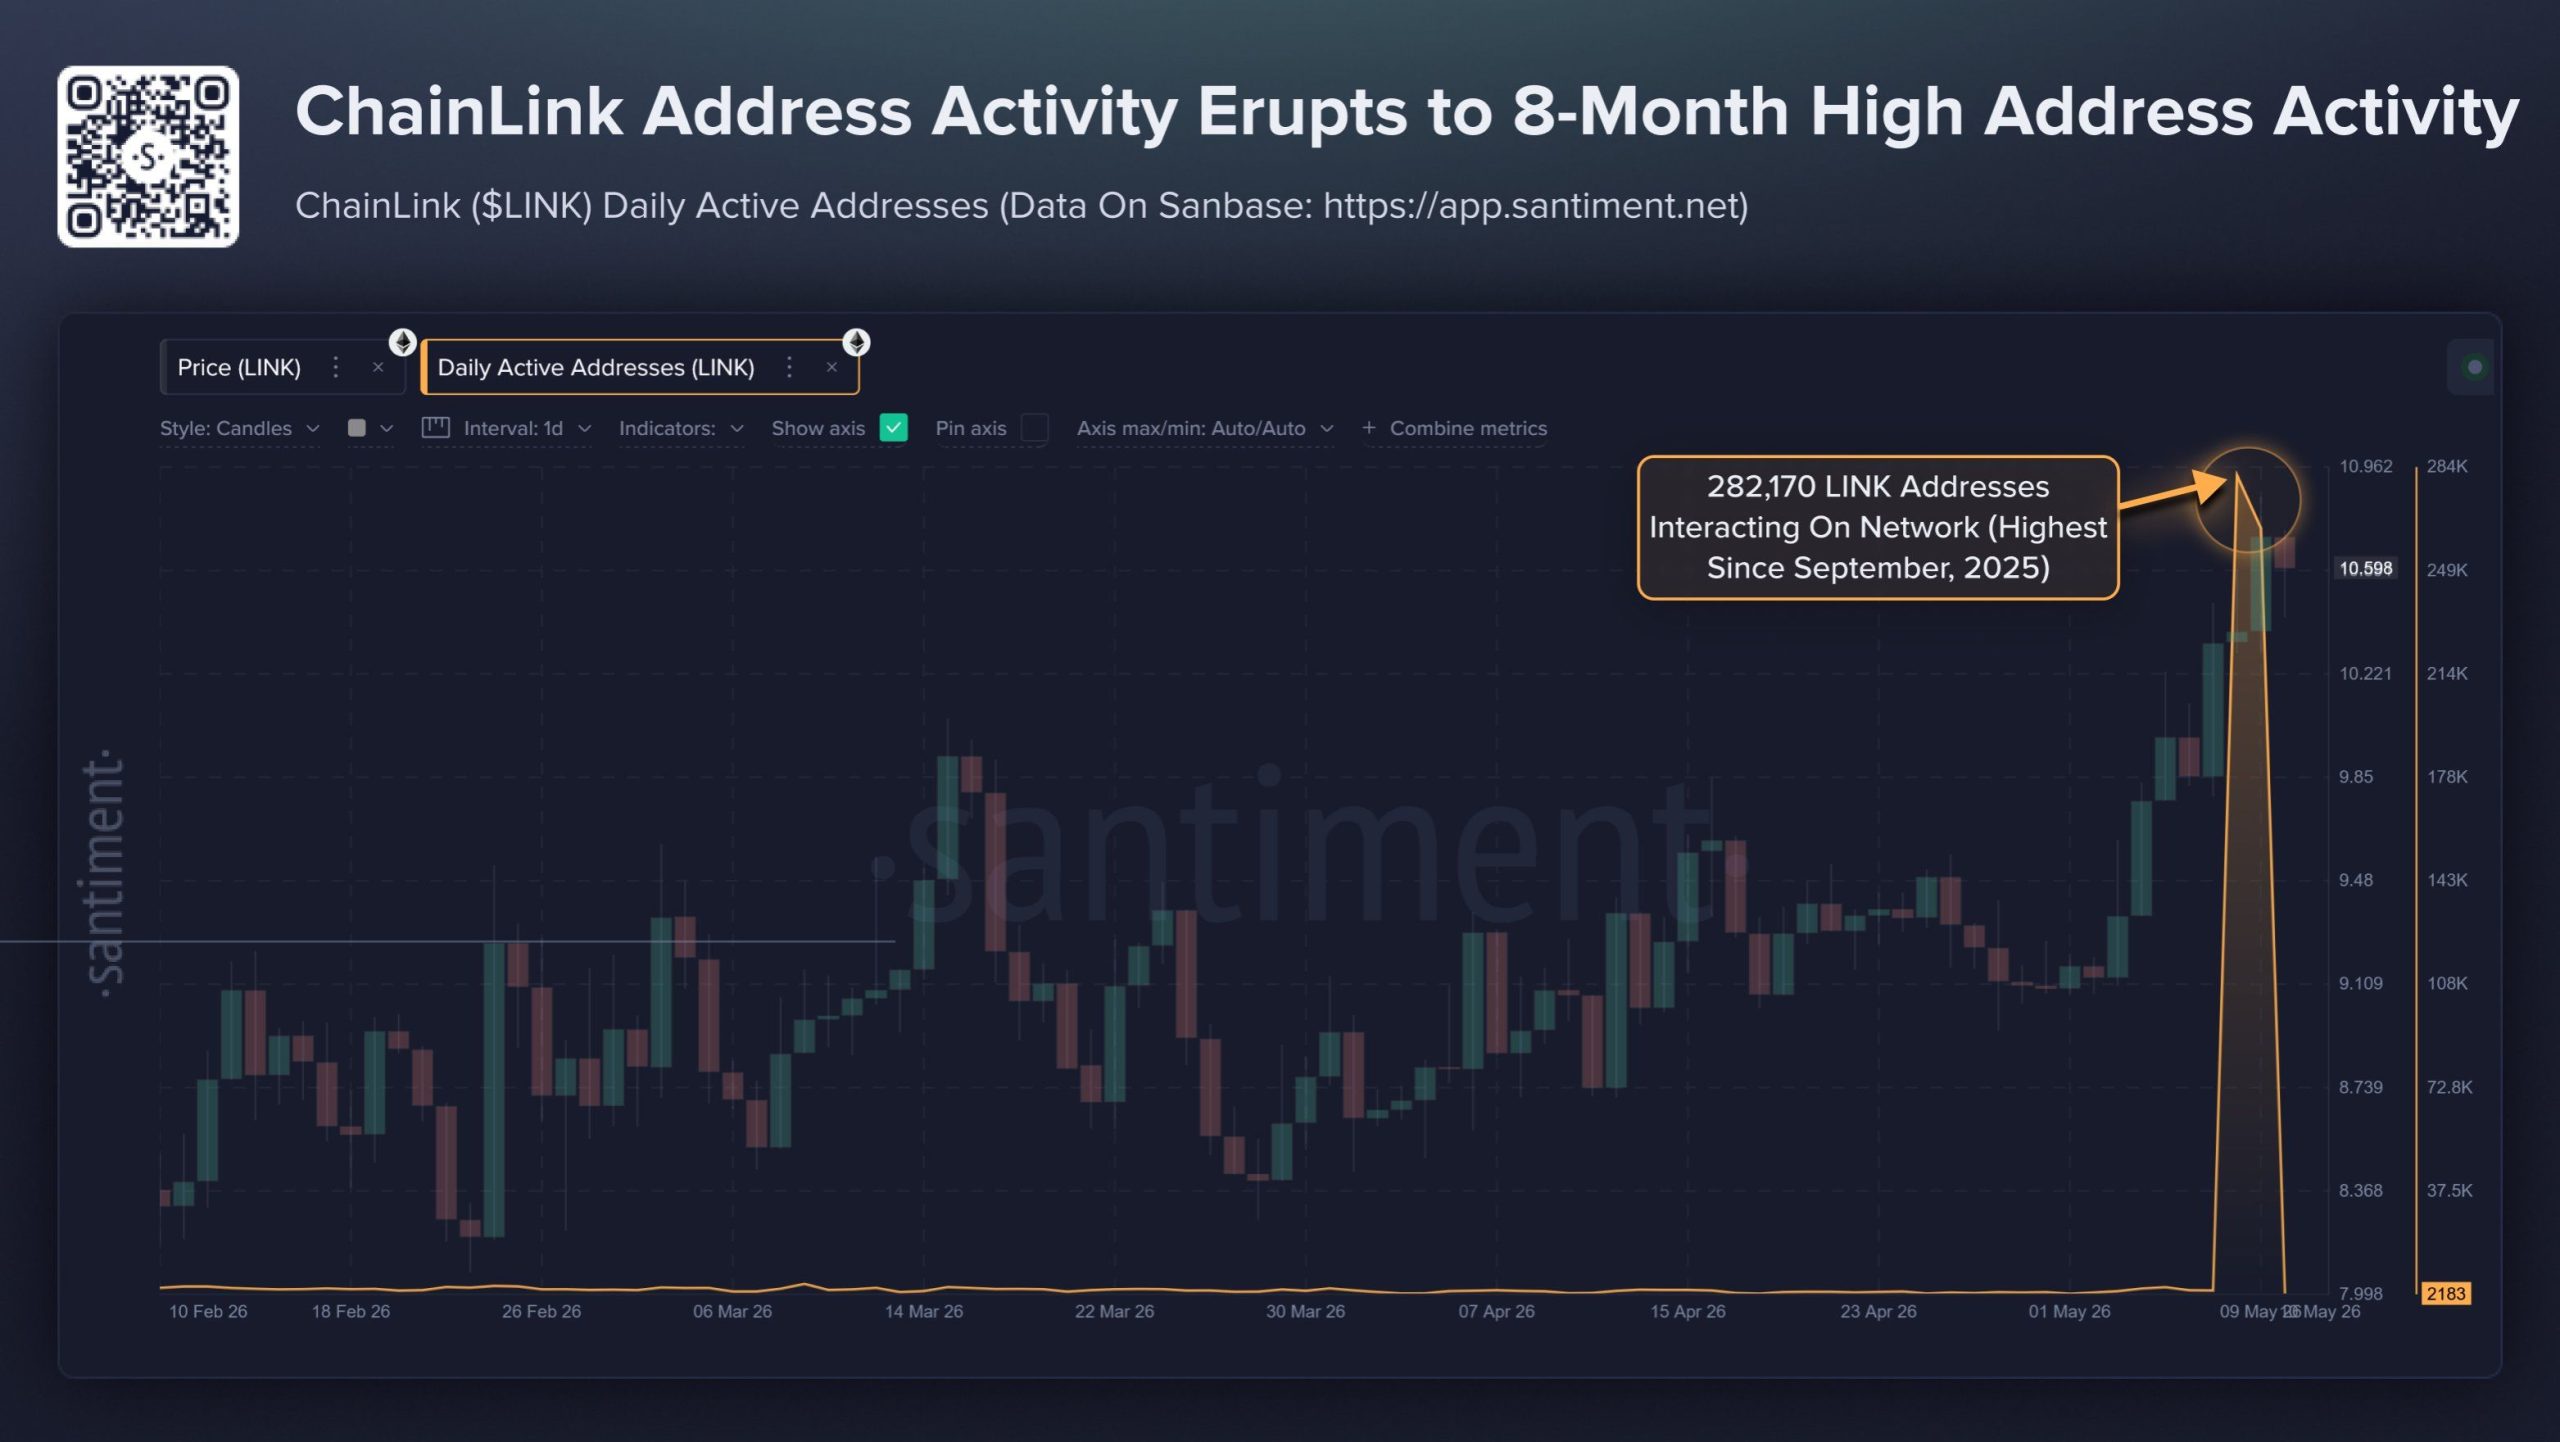
Chainlink (LINK) network activity has jumped to levels last seen eight months ago.
The surge coincided with the migration of decentralized finance (DeFi) protocols from LayerZero to Chainlink’s Cross-Chain Interoperability Protocol (CCIP).
Why is Chainlink Address Activity Surging?
On-chain analytics firm Santiment recorded 282,170 active addresses on May 9. This was followed by 264,090 active LINK addresses the next day. This spike marks the strongest sustained network activity since September 2025.

The activity spike traces back to a $292 million exploit on April 18, 2026. Attackers drained roughly 116,500 rsETH from infrastructure tied to Kelp DAO’s LayerZero-powered bridge.
The incident triggered industry security reviews of cross-chain configurations. Kelp DAO subsequently announced plans to migrate to Chainlink CCIP.
Follow us on X to get the latest news as it happens
In addition, on May 7, Solv Protocol confirmed it would migrate more than $700 million in tokenized Bitcoin to CCIP.
“These moves represented a major shift of institutional-scale DeFi infrastructure away from LayerZero and toward Chainlink’s cross-chain ecosystem, likely contributing to a sharp rise in network activity and smart contract interactions surrounding the protocol,” Santiment wrote.
The firm noted that the surge points to genuine protocol usage rather than purely speculative trading activity.
“Historically, spikes in real network usage have preceded consistent price rises, rather than short-lived pumps,” it said.
The increase in network activity has also coincided with strong whale accumulation. As previously reported by BeInCrypto, wallets holding between 100,000 and 10 million LINK accumulated 32.93 million tokens over the past 30 days.
Additionally, around 13.5 million LINK was withdrawn from centralized exchanges within five weeks, signaling growing investor demand and reduced sell-side pressure.
Subscribe to our YouTube channel to watch leaders and journalists provide expert insights
The post Chainlink Network Activity Surges to 8-Month High as CCIP Wins DeFi Migration appeared first on BeInCrypto.


MARA Holdings shares fell after the Bitcoin miner reported weaker first-quarter results and a wider loss.
Summary
- MARA posted $174.6 million in Q1 revenue, missing estimates as Bitcoin mining margins stayed pressured.
- The $1.3 billion loss came mainly from Bitcoin mark-to-market pressure in Q1 ending March 2026.
- MARA keeps Bitcoin mining as its base while AI data centers shape the next pivot.
Revenue for the quarter ended March 31 dropped 18% year over year to $174.6 million, down from $213.9 million in Q1 2025. Wall Street had expected about $192.7 million.
The stock had closed Monday up 3.48% at $13.39, before falling 3.44% after hours to $12.93. The move erased the day’s gain and put focus back on MARA’s cost base, Bitcoin exposure, and effort to build AI-linked data center revenue.
Bitcoin losses weigh on results
MARA reported a net loss of $1.3 billion, or $3.31 per diluted share, compared with a $533.4 million loss, or $1.55 per share, a year earlier. The company said the quarter included a $1.0 billion loss tied to the fair value of digital assets.
Bitcoin fell 22% from Dec. 31, 2025, to March 31, 2026, which hurt the value of MARA’s holdings. Production also slipped slightly from a year earlier. The company mined 2,247 BTC in Q1 2026, compared with 2,286 BTC in Q1 2025.
Energy costs also stayed high. MARA said purchased energy costs reached $44.7 million, up from $43.5 million a year earlier. Its cost per Bitcoin at owned and operated sites rose to $40,047, mainly due to higher network difficulty and weather events.
MARA keeps mining as its base
MARA said Bitcoin mining remains central to its business, even as it builds a wider digital infrastructure platform. The company said, “Bitcoin mining is not a legacy business we are moving away from. It is the operational foundation on which we are building.”
The miner acquired 2.4 EH of used next-generation ASIC machines during the quarter to improve fleet efficiency. However, MARA said it does not expect to pursue large-scale ASIC purchases, calling its future approach selective and tied to clear returns.
MARA also cut its workforce by 15% during the quarter. The company said the move should bring about $12 million in annualized savings as it reshapes its team for AI and digital infrastructure work.
AI pivot faces a proof test
MARA is pushing further into AI and high-performance computing through power assets and site conversions. Its Starwood partnership is moving from announcement to active development, with about 90% of non-hosted capacity being reviewed for digital infrastructure conversion.
The company is also buying Long Ridge Energy & Power, a site it says could support 600 gross megawatts of AI and critical IT load over time. The asset includes powered land, generation, and grid links around its existing Hannibal mining operation.
Separate coverage shows other miners, including Core Scientific, are also shifting mining power toward AI data centers as the sector seeks steadier revenue streams. For MARA, the near-term focus is now tenant demand, contracted power, and proof that its AI buildout can reduce reliance on Bitcoin cycles.
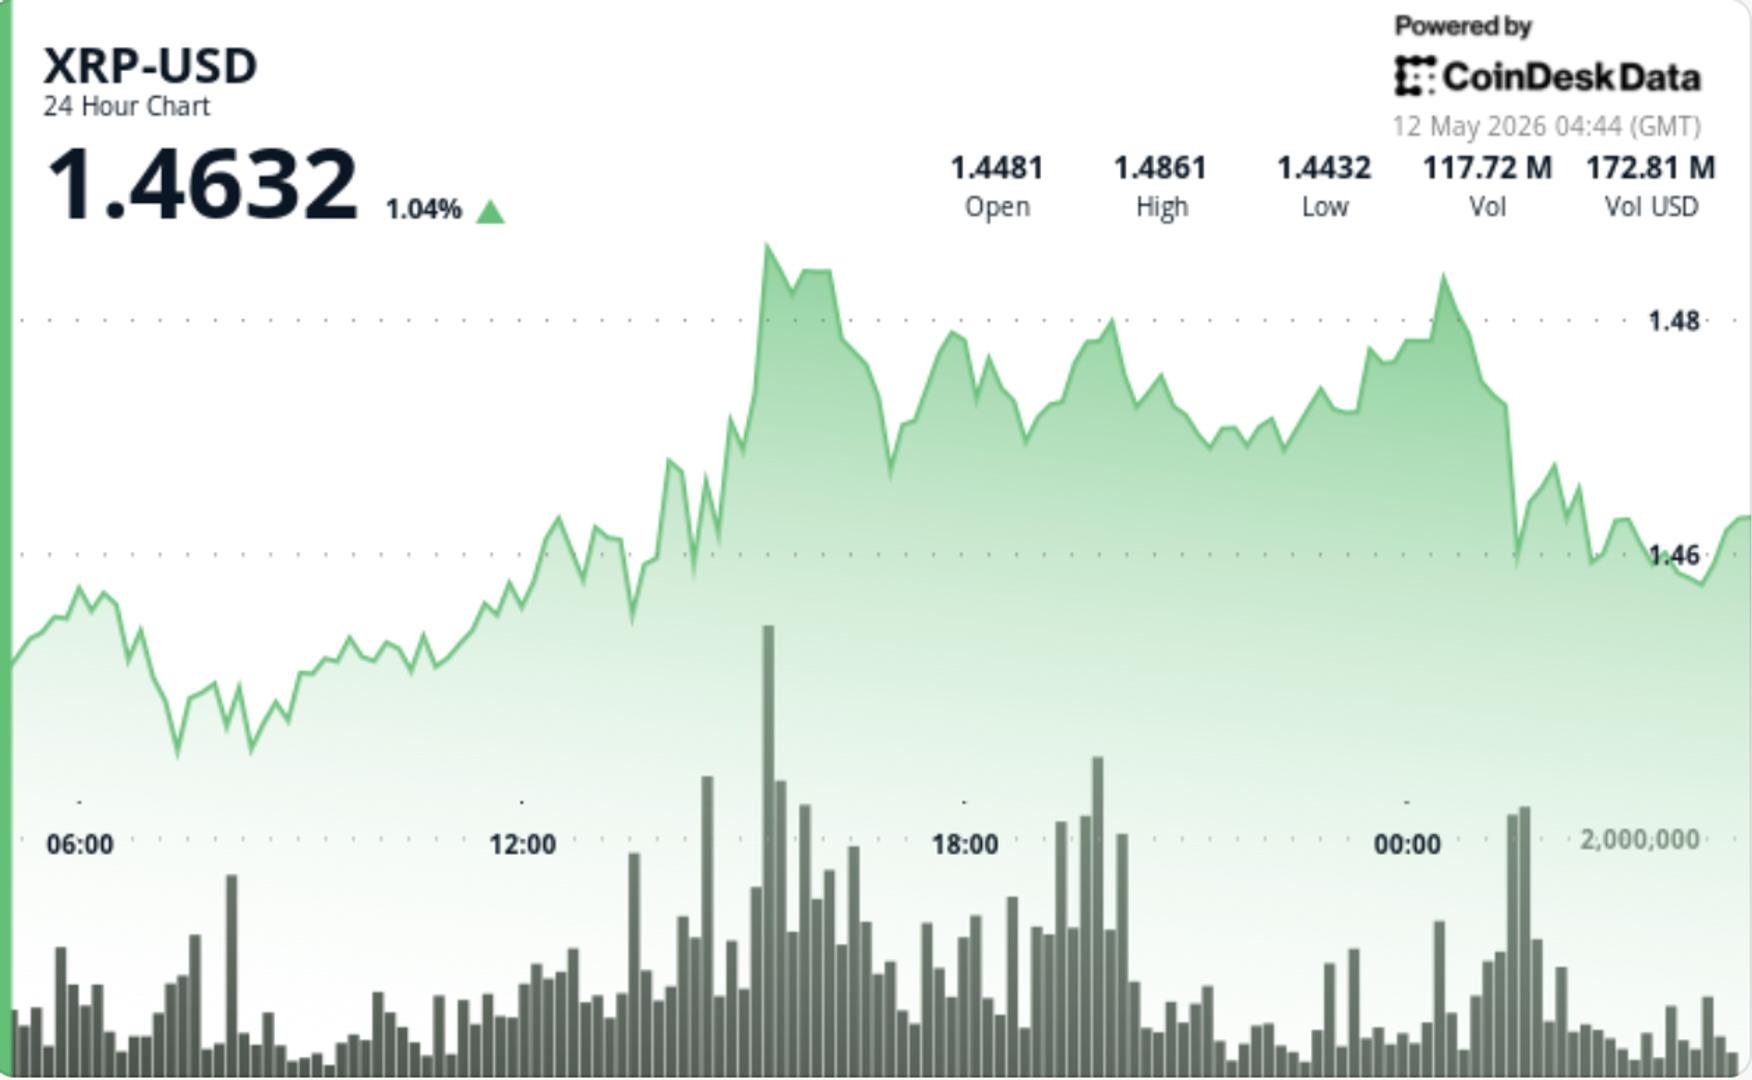

XRP keeps pushing into the same resistance area that has rejected rallies since February, but the way it’s trading is starting to change. Price is no longer getting sold off immediately after touching the range. Instead, XRP is holding near the highs, which usually matters more than the initial breakout itself.
News Background
• Ripple Prime secured a $200 million funding facility from Neuberger Berman to expand margin financing across traditional and digital asset trading markets.
• Ripple said demand for its prime brokerage business has accelerated since the Hidden Road acquisition, with revenue tripling year over year.
• The broader XRP narrative also continues shifting toward institutional infrastructure after Ripple, JPMorgan, Mastercard and Ondo recently completed a tokenized Treasury settlement on XRPL.
Price Action Summary
• XRP climbed from $1.4483 to $1.4565 during the 24-hour session, briefly reaching an intraday high of $1.4877.
• Volume surged during the May 11 15:00 UTC session, when more than 105M XRP traded as price broke above $1.4750.
• The rally later cooled into consolidation near $1.45-$1.46 rather than fully retracing, keeping short-term structure constructive.
Technical Analysis
• XRP is still trading inside a larger multi-month compression structure, but repeated tests near resistance tend to weaken seller control over time.
• The market reclaimed several shorter-term moving averages during the recent move higher, improving momentum conditions beneath the surface.
• Price continues to stall near the same $1.47-$1.50 region that has repeatedly capped upside attempts, making this the most important zone on the chart right now.
• Volume profiles show relatively thin liquidity above current levels, which could accelerate moves quickly if XRP secures a clean break higher.
What traders should watch
• $1.47-$1.50 remains the key resistance area. A sustained move above it shifts focus toward $1.60.
• $1.43-$1.45 is now the near-term support zone bulls need to defend to keep the breakout structure intact.
• XRP is still compressing inside a broader triangle pattern, which raises the odds of a larger directional move once the range finally resolves.
Crypto World
Pi Network Price Crash to $0 or Jump to $1: 3 AIs Speculate What Is More Likely for PI This Year

Pi Network’s PI has seen a few sporadic bursts of momentum in recent months, but its price has remained in a steep downtrend since February last year.
The token’s performance is among the most-talked-about topics in the crypto space, and we asked three of the most popular AI-powered chatbots to weigh in on what seems more likely for the rest of 2026: a collapse to $0 or a major revival to $1.
Unanimous Decision
According to ChatGPT, a crash to $0 is less plausible because assets typically plummet so much only when they lose all liquidity, community interest, and exchange access simultaneously.
“As long as millions of people still hold the token, speculate on it, mine it, discuss it online, and hope for future adoption, there is usually some market demand preventing a total wipeout,” it stated.
The chatbot claimed that a rise to $1 is more realistic but is far from guaranteed and would depend on several strong catalysts, including a Binance listing rumor becoming reality, significant ecosystem progress, a broader altcoin bull run, and renewed retail FOMO.
At the same time, ChatGPT is rather skeptical that all of these elements could align and trigger such a massive pump this year. It argued that the most realistic upper target for PI in 2026 is around $0.80.
Perplexity also estimated that a meltdown to $0 is out of the equation, noting that even the bearish analysts on X don’t foresee such a catastrophe. An ascent to $1 is possible but would require stronger exchange liquidity, real app usage, and a sustained crypto bull market, it added.
The chatbot stated that the most likely path for PI this year is to trade in the $0.12-$0.25 range, unless Protocol 23 and subsequent ecosystem upgrades drive real usage growth.
Lastly, we consulted Google’s Gemini, which largely supported the aforementioned predictions. It dismissed the possibility of a collapse to zero, given that there are millions of Pioneers, and outlined the project’s progress over the years.
“A crash to $0 is mathematically and socially unlikely for Pi Network in 2026. While many “hype” projects vanish PI has transitioned from a simple mobile app into a functional Layer-1 blockchain with several structural “safety nets” that prevent its value from hitting zero.”
Moreover, the chatbot noted that well-known exchanges like Kraken, Bitget, and MEXC have embraced the asset, providing a baseline level of liquidity and strengthening PI’s reputation.
Similar to ChatGPT, Gemini estimated that PI’s “golden ticket” for $1 and beyond is an official listing on Binance. The world’s biggest crypto exchange has been rumored to allow trading services with the asset for almost a year and even asked its users whether it should do so. The majority of the voters supported that step, yet Binance remains silent on the matter.
The Analysts’ Take
PI currently trades at around $0.17, and some analysts say this might be a good buying opportunity. Last month, X user JAVON MARKS envisioned a 1,400% price explosion to $2.80, while several months ago, they called for a triple-digit surge to $1.23.
According to A2Z BOSS, PI has been seeking balance below $0.40 and consolidating beneath $0.20. “Let the value continue to develop and consolidate below $0.20 for the next few weeks,” they added.
Of course, some believe PI could skyrocket to $10 or even $20 in the coming months, but such predictions seem unrealistic (to put it mildly) given the current price levels.
The post Pi Network Price Crash to $0 or Jump to $1: 3 AIs Speculate What Is More Likely for PI This Year appeared first on CryptoPotato.


Crypto majors held their ground on Tuesday even as the macro tape turned sharply against risk assets.
Bitcoin traded just over $81,000 in Asian morning hours Tuesday after briefly touching $82,026 overnight. Solana (SOL) and were the standouts among the majors, up as much as 2% on the day. BNB added 1.7% to $662, XRP held at $1.46, up 0.9% on the day while ether down 0.8%.
Investor Michael Burry, made famous in The Big Short for calling the 2008 housing collapse, warned in a Substack post that the Nasdaq 100 is trading at 43 times earnings, well above the implied level of around 30 times, and likened the current setup to “the scene of the bloody car crash, minutes before it happens.”
Burry flagged the Philadelphia Semiconductor Index’s 70% rally since the end of March as the centerpiece of what he called a parabolic surge in tech valuations, advising readers to take profits and reduce exposure to the AI trade.
“Wall Street may be overstating by more than 50% the earnings at our fastest growing, most highly valued companies,” Burry wrote.
Brent crude zoomed almost 1% to above $105 a barrel after President Donald Trump cast doubt on the ceasefire with Iran in remarks Monday, fueling concern that the closure of the Strait of Hormuz will be prolonged. The Treasury 10-year yield rose to 4.42% and the dollar strengthened against all its Group-of-10 peers on haven demand.
Equity markets across Asia pulled back from records. The Kospi slid as much as 5.1% intraday after a top South Korean policymaker proposed paying citizens a dividend funded by taxes on AI profits, with the comments fueling sharp swings as investors tried to parse the scope of the proposal.
MSCI’s Asia Pacific index swung between gains and losses. European futures pointed to a 0.6% loss at the open. U.S. futures edged lower after the S&P 500 closed at a record high Monday, capping a six-week winning streak that gained more than 16%, the strongest such run since the global financial crisis.
Bitcoin’s price-action will likely be tested later Tuesday as investors watch the U.S. inflation print, which will show how much of the war-driven price pressures has fed through to consumer prices and could shape the outlook for Federal Reserve interest rate decisions.
A hot number on top of fresh Iran tensions and Burry’s bear call would put real pressure on the AI-trade thesis underpinning the equity rally, while a soft print buys risk assets, including crypto, another week of room.

As lawmakers on the US Senate Banking Committee prepare to markup a major crypto market-structure bill this week, the fate of the Digital Asset Market Clarity Act (CLARITY) centers on whether an ethics provision can win broad bipartisan support. Democrats, who have historically used ethics language as a gatekeeper for passage, appear prepared to hold firm on this point even as negotiators on stablecoin yield and other crypto issues push for a clearer path forward.
The CLARITY Act, which cleared the House of Representatives in July 2025, has faced months of procedural delays as lawmakers sought to iron out language on stablecoins, tokenized equities, and governance standards. In parallel, the Senate Agriculture Committee already advanced its own version of the bill in January, underscoring the challenge of reconciling securities and commodities considerations across committees before any floor vote. If both panels can forge a unified bill, it would then move toward consideration by the full Senate and, potentially, the White House.
Key takeaways
- The Senate Banking Committee is slated to markup CLARITY this week, but any progress hinges on resolving an ethics provisions compromise that Democrats say is non-negotiable.
- Democrats, led by Senator Kirsten Gillibrand, insist that ethics language addressing conflicts of interest must be part of any final bill; Republicans signal willingness to negotiate but demand a bipartisan framework for ethics rules.
- A recent compromise on stablecoin yield between Sen. Thom Tillis and Sen. Angela Alsobrooks could unlock movement, but Democrats have signaled they won’t back the bill without ethics reforms in place.
- Even with committee approval, the bill would still require reconciliation between the House and Senate versions before it could reach the president’s desk, delaying potential enactment.
- Context around the debate includes notable political dynamics in which crypto policy intersects with wider governance concerns and industry lobbying, including signals from industry groups and notable politicians.
Ethics as the hinge of CLARITY
Senator Gillibrand characterized ethics language as the central hurdle for CLARITY’s advancement. In comments to Cointelegraph, she emphasized that a robust ethics framework is essential so officials cannot leverage insider information for personal gain. Her stance aligns with a broader Democratic position that any final bill must include guardrails to prevent conflicts of interest among members of Congress and top executive offices.
“Americans deserve a well-regulated market with strong consumer protections and real ethics reforms so politicians can’t cash in on their insider status for personal gain.”
Support for keeping ethics provisions intact is mirrored by other lawmakers who sit on the banking committee. Senator Tim Scott, who chairs the panel from the Republican side, has flagged concerns about tying crypto policy to unrelated political matters. He has argued that any ethics elements should be addressed through a bipartisan process and outside the jurisdiction of the banking committee itself. Meanwhile, Senator Cynthia Lummis, a leading Republican voice on crypto, has urged swift action on CLARITY, signaling she would back the measure if the ethics issue is resolved to broad satisfaction.
The tension around ethics reflects a wider strategic calculus: even if the Banking Committee marks up CLARITY favorably, the bill’s fate hinges on how ethics concerns are adjudicated on the Senate floor and in reconciliation with the House version. A source familiar with the discussions noted that ethics language “has to be tackled on the floor,” suggesting it could be the decisive factor delaying or enabling a final vote.
Stablecoin yield and the broader negotiation
Earlier in the month, Senators Tillis and Alsobrooks announced a compromise on stablecoin yield terms that some analysts viewed as a potential unlock for the legislation. This development signaled a willingness to move forward on a key technical plank of CLARITY without necessarily sacrificing safeguards for investors and the public. However, Democratic leadership has made clear that any forward motion cannot come at the expense of ethics provisions, framing the negotiation as a two-track process: one focused on financial-technology governance and another on inside-ethical constraints.
Industry observers welcomed the shift but cautioned that a compromise on yield alone would not guarantee passage. Cody Carbone, chief executive of the Digital Chamber—an industry advocacy group—told Cointelegraph that while momentum on the technical elements is encouraging, “ethics has to be tackled on the floor, it’s not within the jurisdiction of the Senate Banking Committee, so I don’t expect it to hold up the markup.”
A two-chamber path and the broader political backdrop
Even if the Banking Committee moves CLARITY forward, the legislation would still need to be reconciled with the House version. The House passed its version in 2025, and the two chambers would have to agree on differences before it could proceed to the president for signature. The process creates a window of uncertainty, with timing contingent on cross-chamber negotiations and the political calendar.
The policy debate has unfolded amid a broader political landscape where the crypto industry intersects with campaign finance and potential conflicts-of-interest concerns. Reports have highlighted the president’s ties to crypto ventures, a factor that some lawmakers say influences public scrutiny. Forbes reported that the president’s personal fortune increased substantially in 2025 due, in part, to crypto ventures, underscoring the perceived political sensitivities around crypto regulation in the current administration.
Industry insiders and political observers alike have noted that the path forward will likely hinge on bipartisan agreement on ethics, as well as whether the stability-and-yield provisions can be framed to satisfy regulators and investors without inviting new ambiguities. Galaxy Digital has identified a slate of Democrats it views as pivotal to advancing the bill, reflecting the effort to assemble a broad coalition across party lines.
As negotiations continue, key senators have signaled openness to a deal while keeping their red lines intact. Senator Gillibrand has been explicit about the need for ethics safeguards, and Senator Lummis has kept pressure on colleagues to vote in favor once those safeguards are in place. The interplay between these positions illustrates how policy design—particularly around ethics—can shape the pace and outcome of crypto-market regulation in the United States.
The political dynamic is further complicated by ongoing market sentiment around CLARITY. Prediction markets have reflected a spectrum of expectations, with some participants pricing in a path to passage this Congress and others remaining skeptical about the feasibility of a timely compromise that satisfies both chambers and the White House.
Industry voices emphasize that regulatory clarity remains a priority for market participants seeking predictable rules and basic protections. The CLARITY bill’s proponents argue that a well-structured framework could reduce regulatory ambiguity and support responsible innovation, while opponents warn of overreach or unintended consequences that could hamper growth in the sector. The balancing act continues as lawmakers weigh the potential benefits of clear rules against the need for robust oversight and ethics safeguards.
What to watch next
The next milestones are clear but contingent: the Banking Committee markup, the emergence of a durable ethics framework, and progress toward House-Senate reconciliation. If a bipartisan framework on ethics emerges, CLARITY could gain momentum in the Senate; if not, the bill may face renewed stalemate and delay. Investors and builders will be watching not only the substantive provisions—such as how stablecoins and tokenized assets are treated—but also how the ethics language is drafted and enforced, since that could determine whether lawmakers can sustainably support the bill.
Looking ahead, market participants should monitor whether the compromise on stablecoin yield withstands scrutiny and whether the House and Senate can align their versions on this point. The involvement of senior figures on both sides of the aisle—together with influential industry groups—will shape the narrative around CLARITY in the months ahead. As the debate unfolds, readers should stay attuned to statements from lawmakers on ethics provisions and any new fundraising or lobbying activity tied to the bill’s passage.
In short, CLARITY’s fate rests on a delicate agreement: governance safeguards that earn broad trust, and technical provisions that reassure markets. The clock is ticking as committees move in parallel, with the crypto industry watching for a signal that the United States is prepared to adopt a comprehensive, well-structured framework for digital assets.

Trump and China’s Xi set for talks spanning Iran, nuclear, trade and AI
MARA Shares Fall on $1.3B Q1 Loss, Revenue Miss
“Today”'s Sheinelle Jones calls first Mother's Day without late husband 'brutal,' but found 'silver lining' in kids
Manchester United reach agreement with Casemiro over contract clause amid transfer speculation

US brings back mandatory military draft registration

Steven Gerrard disagrees with Gary Neville over ‘shock’ Chelsea and Arsenal claim | Football

India Facing Financial Emergency? | Cash Panic & PM Modi’s Big Warning | Amber Zaidi

Ripple XRP I HEREBY DECLARE WE ARE OFFICIALLY OUT OF THE STORM!

ANOTHER Catastrophic Loss For Crypto and America (How to use the Clarity Act to make Money)
-
 Crypto World4 days ago
HarrisX Poll Found 52% of Registered Voters Support the CLARITY Act
-

 Fashion3 days ago
Weekend Open Thread: Marianne Dress
-

 Crypto World5 days ago
Upbit adds B3 Korean won pair as Base token gains Korea access
-
 NewsBeat5 days ago
NCP car park operator enters administration putting 340 UK sites at risk of closure
-

 Fashion12 hours ago
Coffee Break: Travel Steam Iron
-

 Tech2 days ago
Auto Enthusiast Carves Functional Two-Stroke Engine from Solid Metal
-

 Politics7 hours ago
What to expect when you’re expecting a budget
-

 Politics3 days ago
Politics Home Article | Starmer Enters The Danger Zone
-

 Fashion1 day ago
What to Know Before Buying a Curling Wand or Curling Iron
-
 Business3 days ago
Ignore market noise, India’s long-term story intact, say D-Street bulls Ramesh Damani and Sunil Singhania
-

 Crypto World7 days ago
UAE Free Zone Deploys Blockchain IDs to Verify Registered Firms
-

 Tech23 hours ago
GM Agrees To Pay $12.75 Million To Settle California Lawsuit Over Misuse Of Customers’ Driving Data
-

 Crypto World6 days ago
BlackRock CEO Larry Fink Discusses a New Asset Class
-

 Entertainment5 days ago
Sarah Paulson Called Out For Met Gala ‘Hypocrisy’
-

 Crypto World5 days ago
Robinhood says Wall Street is building onchain
-
 Sports6 days ago
NBA playoff winners and losers: Austin Reaves is not loving Lakers vs. Thunder matchup, but Chet Holmgren is
-

 Entertainment4 days ago
General Hospital: Ric & Ava Bombshell – Ric’s Massive Secret Exposed!
-

 Tech6 days ago
Apple and Samsung are dominating smartphone sales so thoroughly that only one other company makes the top 10
-

 Entertainment5 days ago
Bold and Beautiful Early Spoilers May 11-15: Steffy Revolted & Liam Overjoyed!
-

 Fashion5 days ago
The Best Work Pants for Women in 2026
You must be logged in to post a comment Login