
Reason to trust
![]()
Strict editorial policy that focuses on accuracy, relevance, and impartiality
Created by industry experts and meticulously reviewed
The highest standards in reporting and publishing
Strict editorial policy that focuses on accuracy, relevance, and impartiality
Morbi pretium leo et nisl aliquam mollis. Quisque arcu lorem, ultricies quis pellentesque nec, ullamcorper eu odio.
XRP’s multi-month uptrend may be approaching a critical inflection point, according to technical analyst Josh Olszewicz, known online as @CarpeNoctom. In a chart published on X, Olszewicz highlighted a well-defined bearish reversal pattern, warning that a breakdown could trigger significant downside movement. “I’d be shocked if this actually breaks higher,” the analyst wrote, adding in a livestream that the structure “continues to be the only thing I care about on this chart.”
Could This Be The End Of The XRP Bull Cycle?
His central thesis is built on a classic head and shoulders pattern, a formation widely recognized by traders as a precursor to a major trend reversal. The chart, based on the XRP/USD daily timeframe, reveals a symmetrical triple-peak structure that fits the textbook definition of a head and shoulders pattern. The left shoulder formed between early and mid-December 2024, topping out near the $2.90 level.
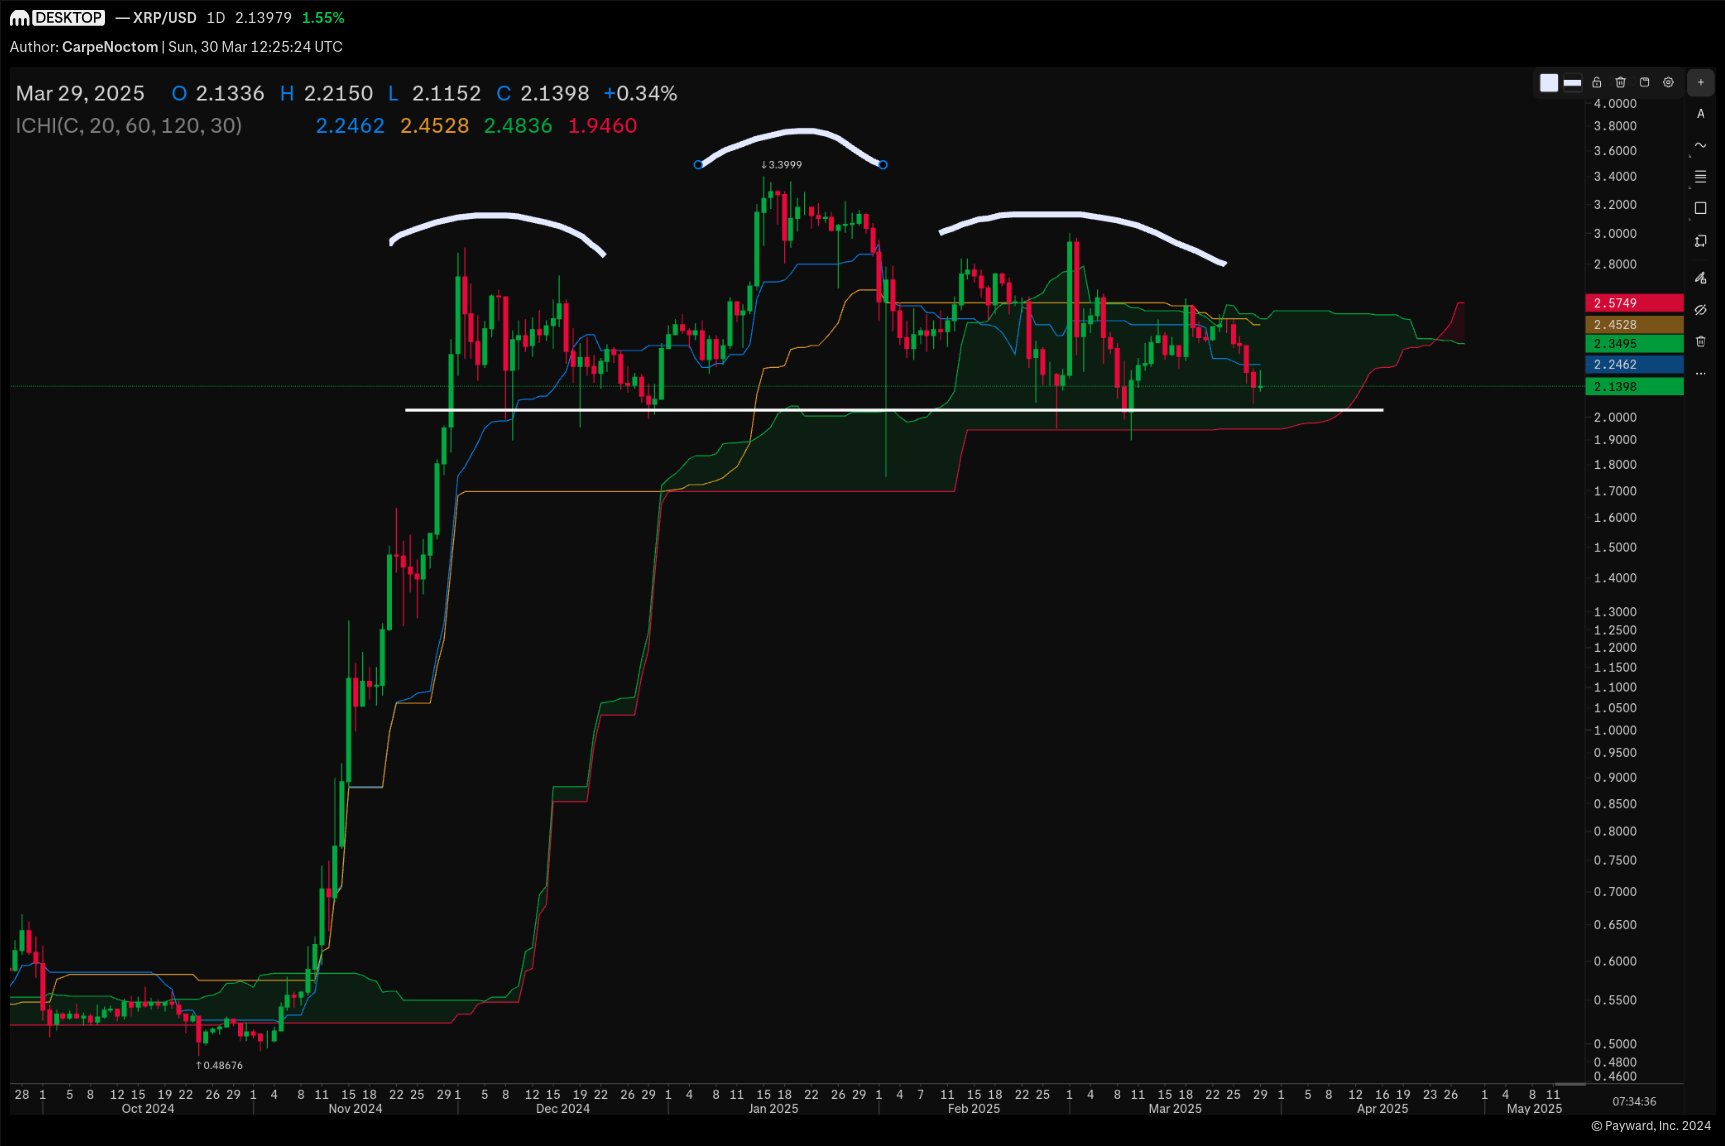
This was followed by a higher high in mid-January 2025, when XRP briefly surged to approximately $3.40, forming the head. Subsequently, the right shoulder developed throughout mid-February and March 2025 with a lower high, around the $3.00 region.
Related Reading
The neckline — a critical horizontal support level that connects the swing lows between the shoulders — is drawn precisely at the $2.00 mark. This level is not only a psychological round number but also structurally significant, having acted as support multiple times since December last year.
Overlaying the pattern is the Ichimoku Cloud indicator. The Ichimoku metrics currently reinforce the bearish outlook. XRP is trading beneath both the Tenkan-sen (conversion line) at $2.2462 and the Kijun-sen (base line) at $2.4528 — both of which are flatlining, indicating a loss of upward momentum. The Senkou Span A (leading span A), currently at $2.4836, and Senkou Span B at $1.9460 form a cloud that is thick, flat, and bearish. Price action is consolidating within the cloud, but the cloud ahead turns red, forecasting resistance and trend weakness in the sessions to come.
Related Reading
Olszewicz stated unequivocally in his livestream that if the pattern confirms with a breakdown, “you’d be expecting $1.13 to $1.40” as a measured move target. This range represents the potential depth of the head and shoulders formation — calculated by subtracting the height from the head ($3.40) to the neckline ($2.10), which gives approximately $1.30 of projected downside. When subtracted from the neckline level, this yields targets between $1.10 and $1.40, depending on volatility and order book depth.
He added, “There is not an impossibility that this just rolls over the entirety of the move. Now that would be end-of-cycle stuff. That would be a bearish legacy, bearish everything — right? But that is in the cards here. You can’t say it’s not until we’re back above $2.85.”
With that, Olszewicz clearly defined $2.85 as the invalidation level for this bearish thesis. Notably, this level marks the last significant lower high before price began to roll over — and it coincides with the top of the right shoulder. A close above that point would invalidate the head and shoulders formation and likely suggest a continuation of the bullish cycle. Until then, however, the risk remains tilted to the downside.
At press time, XRP traded at $2.07.
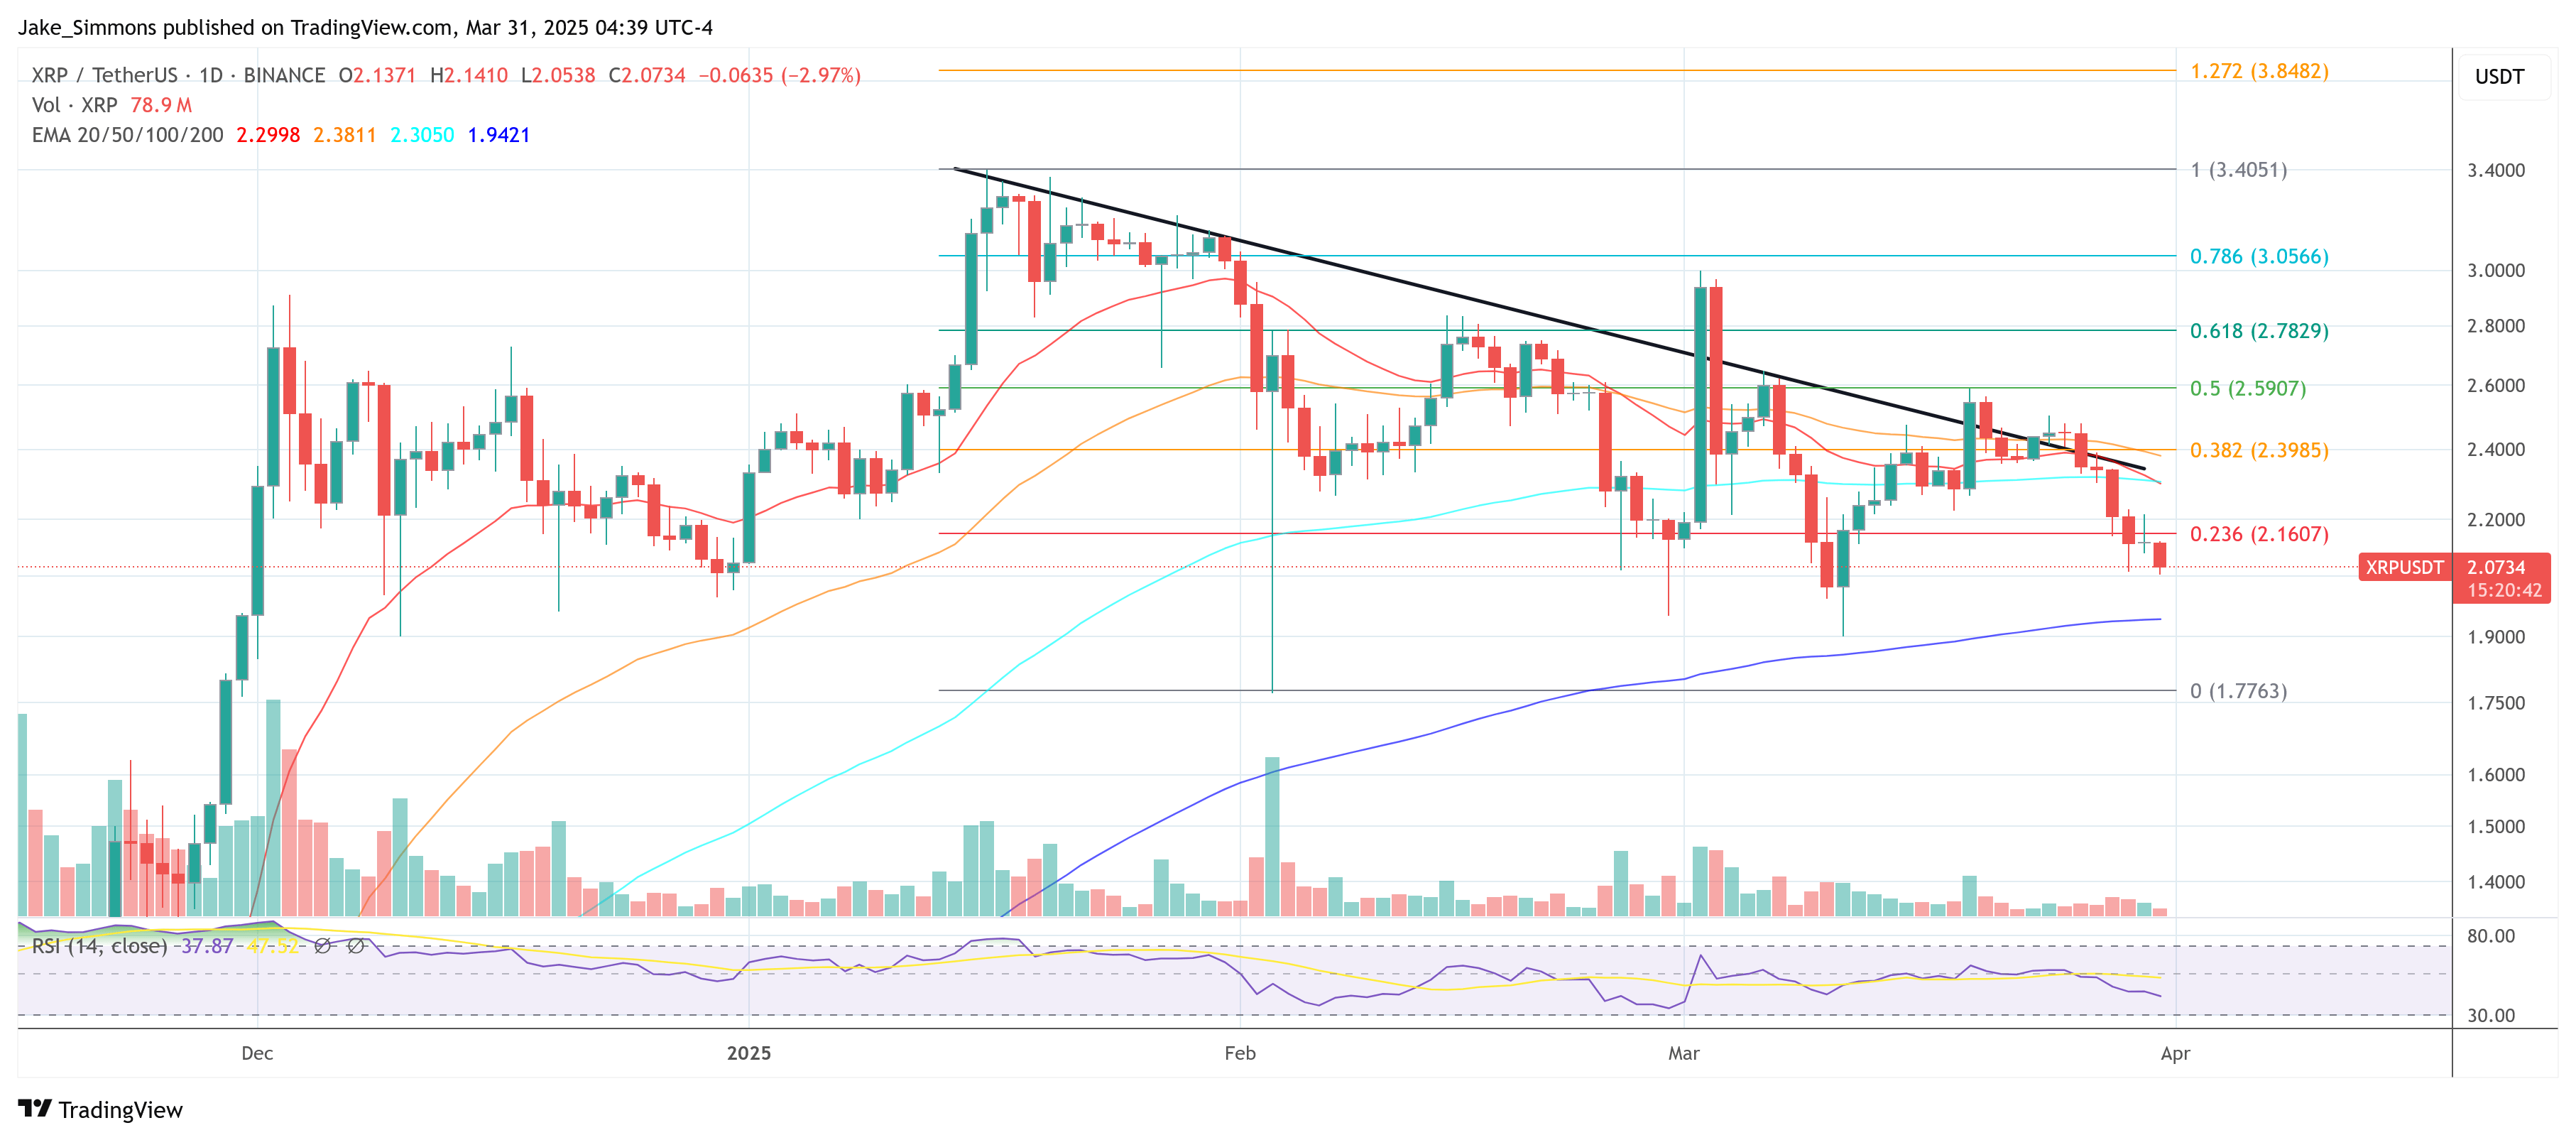
Featured image created with DALL.E, chart from TradingView.com
