

Crypto World
XRP Funding Rates on Binance Turn Deeply Negative, Buy Signal?

Analysts say past periods of deeply negative funding rates on Binance have often been followed by corrective rallies.
XRP funding rates on Binance turned negative this week, hitting levels that have historically preceded short-term price rebounds.
The setup suggests crowded short positioning may have created conditions for a corrective rally, though analysts caution this does not guarantee a lasting trend reversal without a broader market catalyst.
Derivatives Data Flashes Contrarian Signal
Data from Binance shows XRP funding rates entered a phase of extreme negativity, while the asset ranged between $1.35 and $1.50, according to CryptoQuant analyst Darkfost. This comes after the Ripple token experienced a 60% correction from its July 2025 all-time high of $3.65, with most derivatives traders positioning on the short side despite the sustained drop.
Historical data suggests that short-term rebounds or corrective rallies in XRP often follow periods of extreme negative funding rates on Binance. The analyst emphasized that such configurations act as contrarian indicators, suggesting bearish positioning may have become overcrowded relative to actual price action.
“When market consensus becomes excessively aligned in one direction, history shows that markets tend to surprise the majority,” Darkfost wrote.
Even though the configuration does not ensure long-term trend reversals, the on-chain observer pointed out that it was a favorable indicator for investors trying to find appealing entry points or looking to progressively increase their exposure to XRP.
Exchange Outflows Suggest Supply Tightening
On the technical side, analyst EGRAG CRYPTO yesterday identified $1.55 as the first critical trigger level for XRP, with a weekly close above this point weakening the current downward trajectory.
A more decisive breakout above $2.20 would invalidate the bearish descending channel structure that has defined the asset’s price action for months and open the path toward $2.70 to $3.60. At present, XRP is trading around $1.44, up about 3% in 24 hours but down nearly 10% over the past month and more than 60% below its all-time high.
You may also like:
Adding to the dynamics, exchange outflow data shows a significant increase in XRP withdrawals during February, with total outflows reaching approximately 7.03 billion XRP, the highest level since November 2025.
Binance led the withdrawal volume with outflows of 3.38 billion XRP, indicating a shift in assets from trading environments to private wallets or long-term storage. When withdrawals increase in this manner, it often indicates that a portion of the available supply is being removed from the spot market, potentially reducing liquidity on trading platforms.
With that in mind, traders will likely be focused on whether the combination of negative funding rates and large exchange withdrawals will translate into buying pressure. As Darkfost put it,
“In such uncertain conditions, it becomes essential to carefully select positions, relying on market signals that are beginning to emerge.”
Binance Free $600 (CryptoPotato Exclusive): Use this link to register a new account and receive $600 exclusive welcome offer on Binance (full details).
LIMITED OFFER for CryptoPotato readers at Bybit: Use this link to register and open a $500 FREE position on any coin!

Smart investors adjust their strategy during bear markets and 50% drawdowns like the one seen in Bitcoin (BTC) over the last five months. The strategy, known as dollar-cost averaging (DCA), involves investing the same amount at regular intervals regardless of market conditions.
Historical market cycle data and forward-looking BTC price simulations provide a clearer view of how these steady investment patterns develop across different entry periods and time horizons.
A five-year Bitcoin DCA stack shows strong net gains
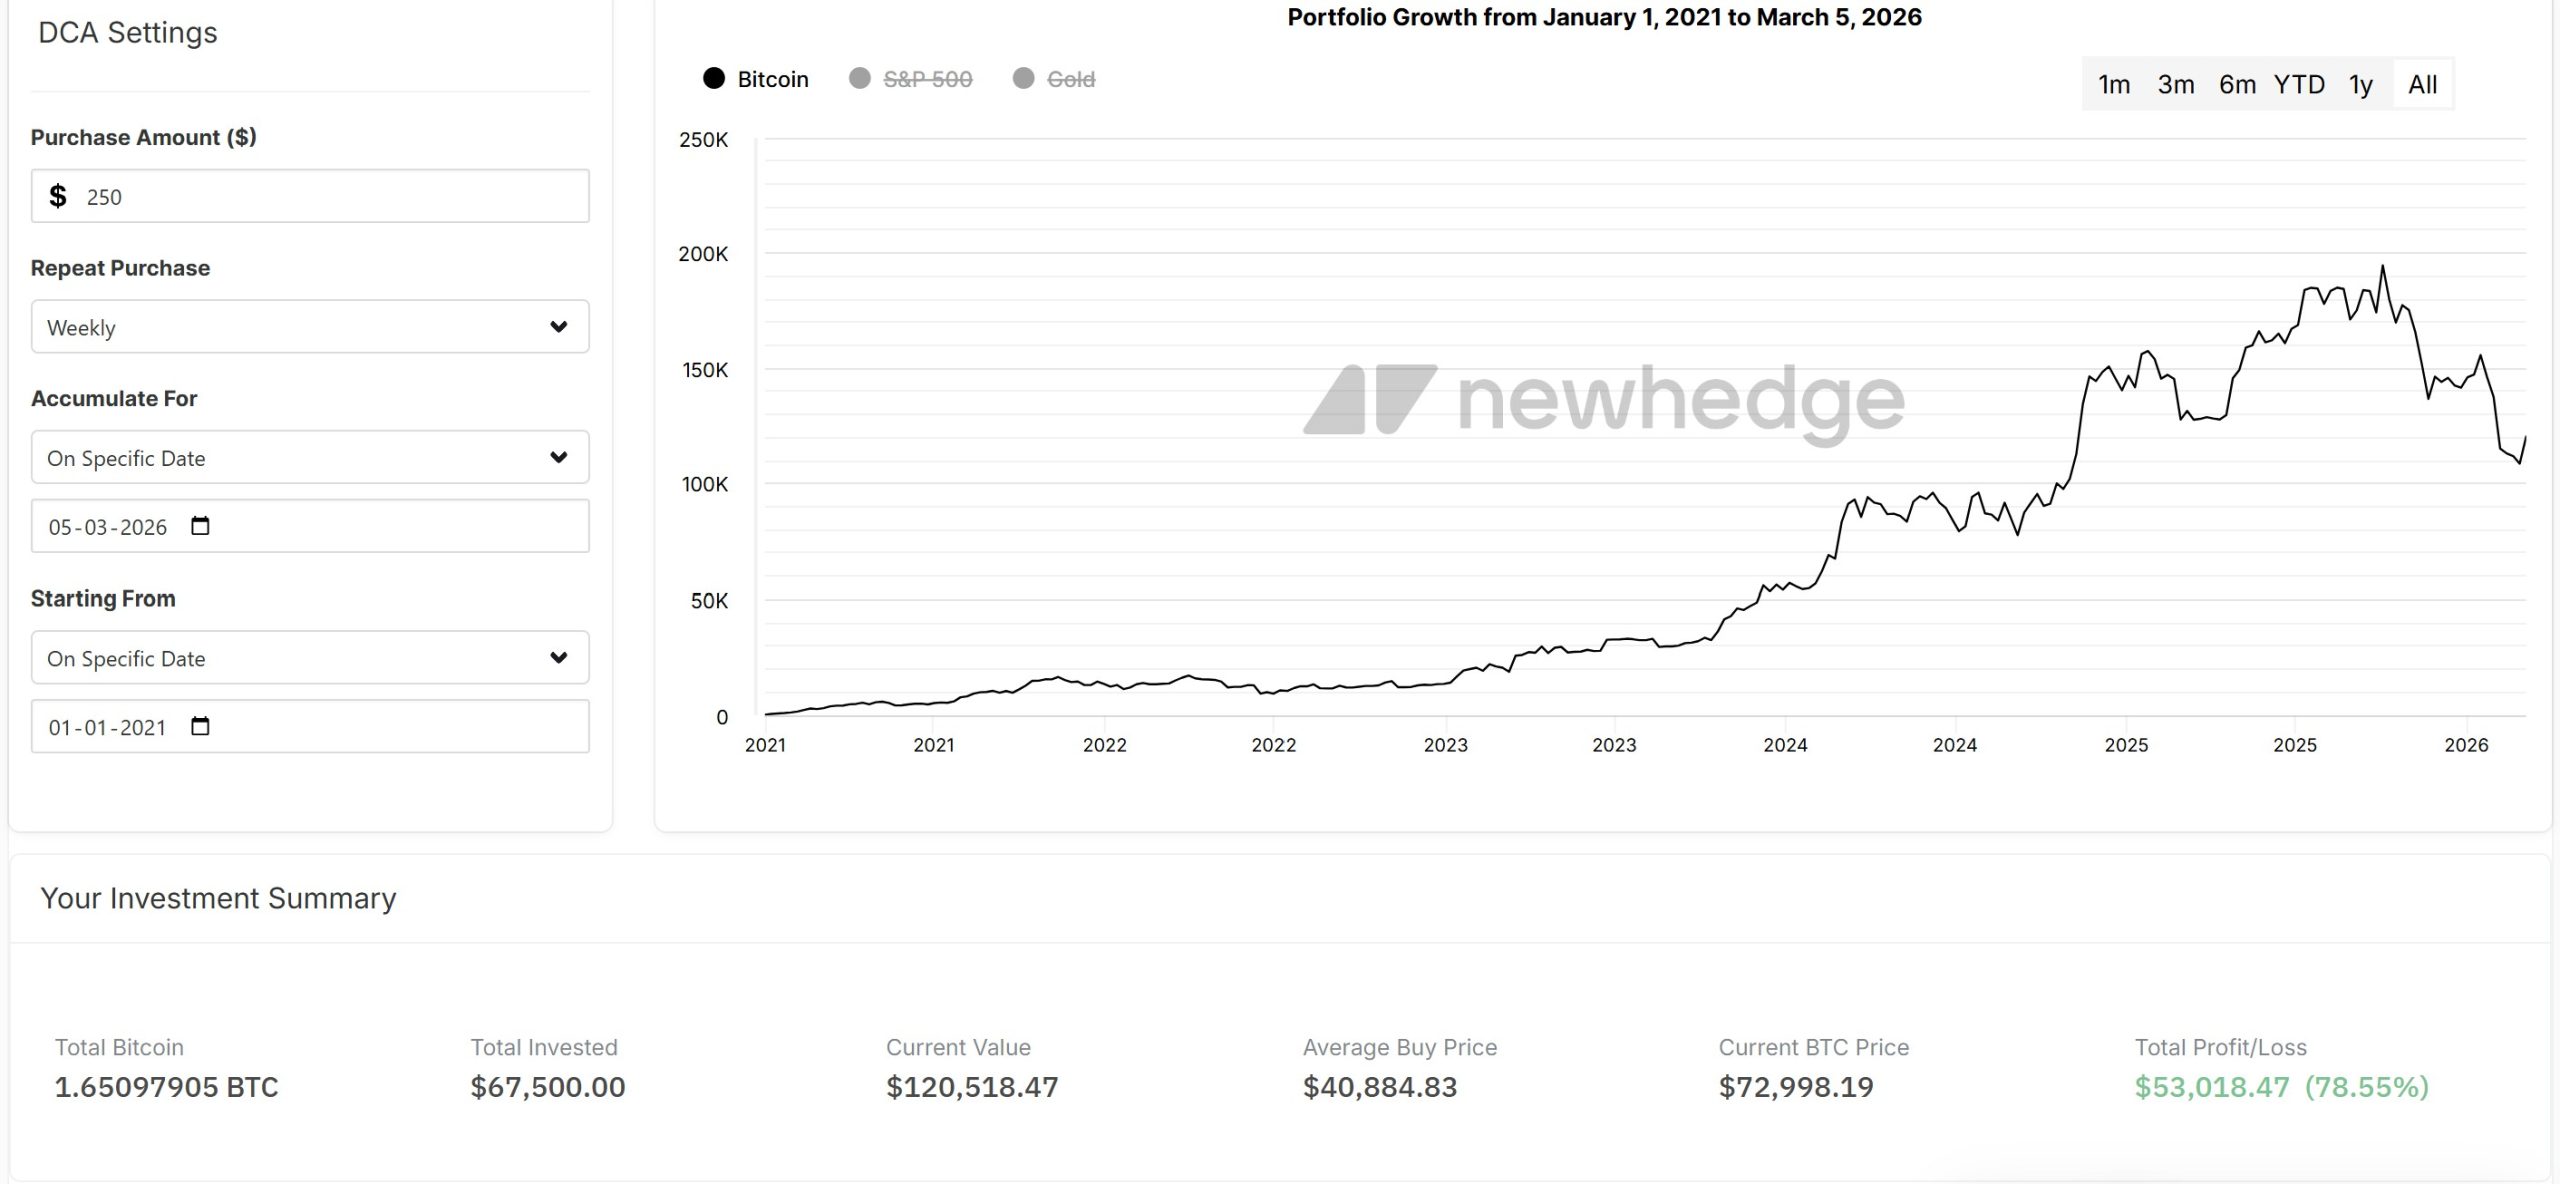
A $250 weekly Bitcoin purchase starting in January 2021 resulted in $67,500 invested over a five-year period. Based on DCA simulation data, the strategy accumulated 1.65097905 BTC at an average purchase price of $40,884.
At the current Bitcoin price near $71,000, that 1.65097905 BTC is valued at roughly $120,518, representing a $53,018 gain (76%) on the invested capital. When Bitcoin traded for $100,000, the holdings were worth about $165,098, while at the cycle peak near $126,000 in October 2025, the same amount reached $208,023.

A shorter accumulation window illustrates how entry timing changes the early outcome while the strategy continues building exposure. A $250 weekly DCA beginning January 2024 results in $28,500 invested, accumulating 0.36863166 BTC with an average purchase price of $77,312.
At the current price of $71000, the amount is valued at about $26,909, a –6% unrealized loss. At $100,000, the holdings had risen to $36,863, while a $126,000 cycle high valued the Bitcoin at $46,448.
In a February X post, Swan Bitcoin analyst Adam Livingston compared a similar DCA approach against equities over the past five years. A $100 weekly allocation produced $42,508 in Bitcoin versus $37,470 in S&P 500 (SPX), representing 62.9% and 43.6% returns, respectively.
Livingston noted that purchasing Bitcoin consistently during drawdowns has historically produced stronger cumulative returns despite the price volatility.

Related: Bitcoin’s bullish momentum accelerates but topping $78K remains a challenge
Long-term models emphasize the time horizon
Forward-looking simulations examine how the DCA strategy could work from 2026 onward. A $250 weekly DCA beginning January 2026 allocates about $54,250 by March 2030.
The price assumptions come from Bitcoin’s long-term power-law growth curve, which tracks Bitcoin’s historical price relative to time on a logarithmic scale. The model produces a rising support band and median trend that have broadly aligned with previous market cycles.

Using this framework, analysts estimate that by 2028, the long-term trend support may move above $100,000, forming the base assumption for future DCA modeling. Simulations from Bitcoin Well place the median price near $430,278 by March 2030.
To capture the wider range around that path, the model also considers deviation bands of the power-law channel, producing a lower projection near $274,000 and an upper expansion scenario near $900,000.
Under those assumptions, the weekly strategy accumulates about 0.30 BTC over four years.
-
At $274,000, the holdings are worth about $82,200.
-
At the $430,278 median estimate, the investment value reaches $129,000.
-
At a $900,000 BTC price, the investment is worth nearly $270,000.

A November 2025 study by Bitcoin researcher Sminston With tested how the entry timing affects the long-term outcomes using similar projections. Even buying 20% above $94,000 (the price of BTC at that time) and exiting 20% below the projected 2035 median still produced nearly 300% gains on the remaining holdings after a decade.
The total savings reached 7.7 times the initial capital in the simulation.
The study concluded that entry timing adjusts the range of outcomes, while long holding periods drive the majority of the results.
Related: A sucker’s rally? Why Bitcoin analysts say BTC price must hold $70K
This article does not contain investment advice or recommendations. Every investment and trading move involves risk, and readers should conduct their own research when making a decision. While we strive to provide accurate and timely information, Cointelegraph does not guarantee the accuracy, completeness, or reliability of any information in this article. This article may contain forward-looking statements that are subject to risks and uncertainties. Cointelegraph will not be liable for any loss or damage arising from your reliance on this information.
Hyperliquid price is approaching a key resistance level, and shrinking volatility suggests a possible breakout toward $35.
Summary
- HYPE trades near $31 after slipping 5.7% in 24 hours but remains up 80% over the past year.
- Bollinger Bands are tightening, signaling a volatility squeeze that often precedes a major move.
- A breakout above $34 could push price toward $35, while losing $29 may expose the $26 support zone.
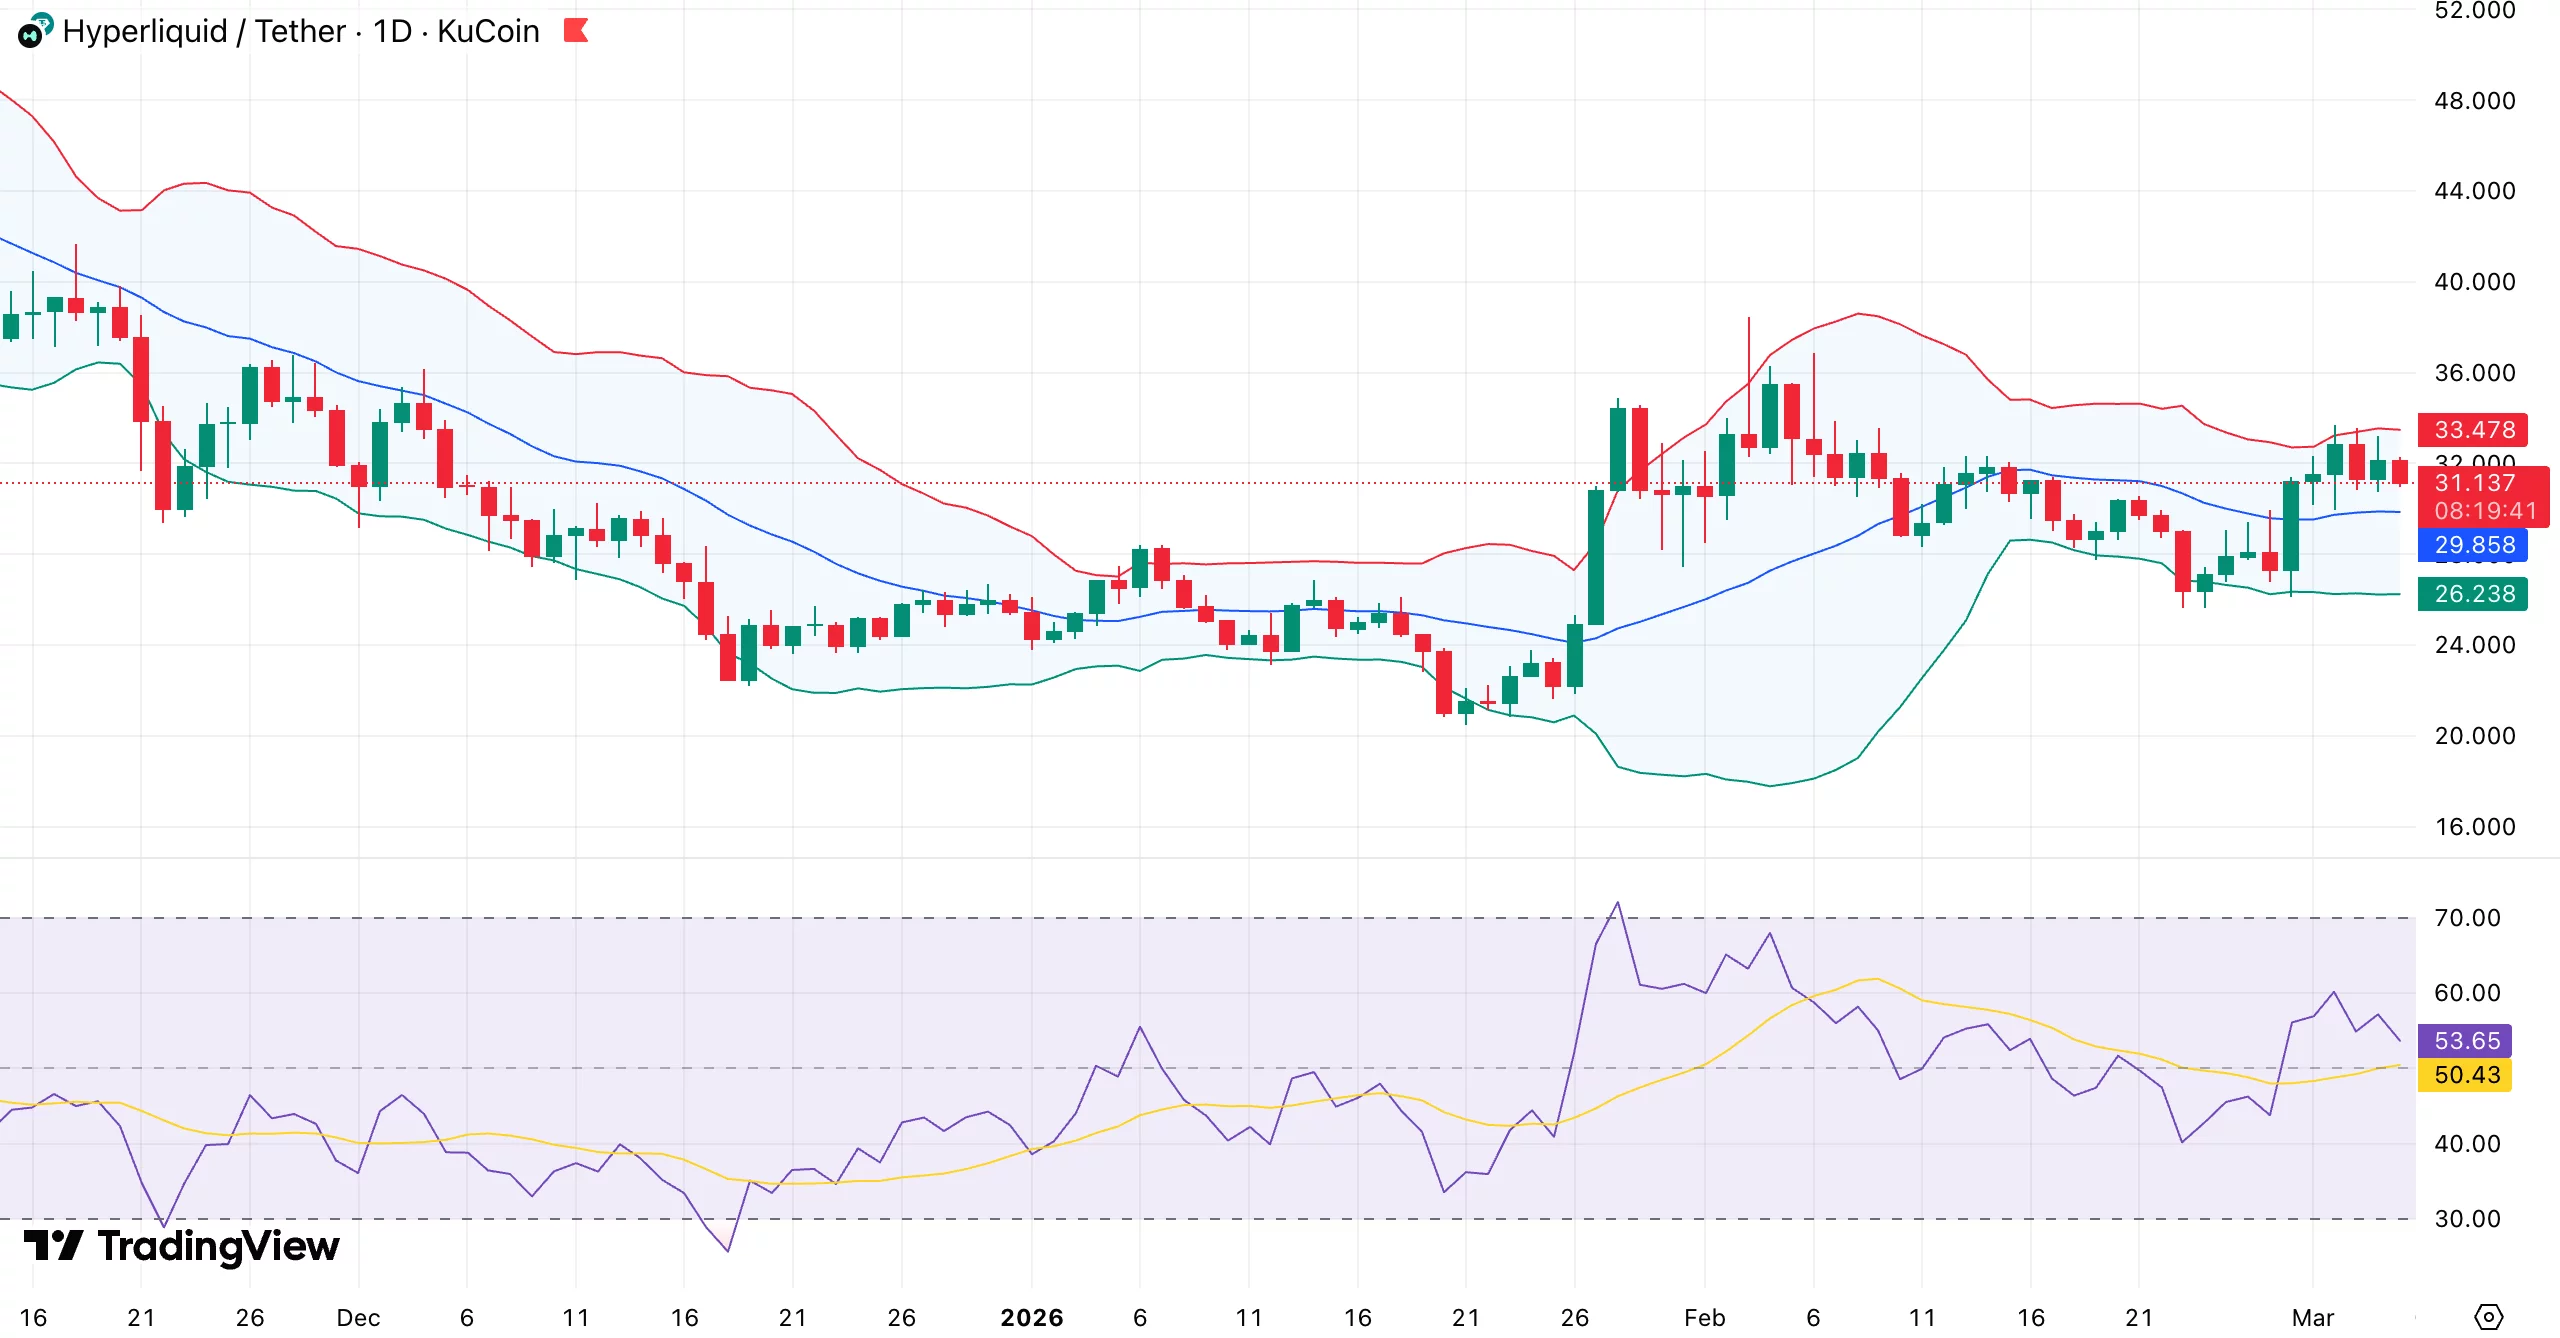
At press time, Hyperliquid (HYPE) was trading at $31.24, down 5.7% in the past 24 hours. Over the last week, it moved between $26.22 and $33.33, ending roughly 7% higher. However, the token has decreased by roughly 10% per month.
HYPE continues to be one of the better-performing altcoins despite the recent decline. Over the past year, the token has increased by about 80%, despite difficulties in the larger cryptocurrency market.
Derivatives activity has cooled slightly. CoinGlass data shows that trading volume dropped 18% to about $1.25 billion, while open interest fell 7.5% to $1.21 billion, showing some traders closing their positions.
HYPE token fundamentals
HYPE’s price is influenced by several structural factors. The core of Hyperliquid’s ecosystem is perpetual futures trading, and the Assistance Fund for token buybacks receives about 97% of platform fees.
Increases in trading are directly correlated with increases in buybacks. For example, when trading volumes averaged $29 billion daily, $5.82 million in buybacks were generated, demonstrating a direct correlation between trading demand and token support.
Market sentiment has also been influenced by protocol upgrades. Permissionless perpetual markets were introduced by HIP-3, which produced a total volume of about $83 billion.
HIP-4 proposal aims to launch outcome trading products, combining prediction markets, options, and binary-style contracts. These additions could expand platform activity if more retail or institutional traders participate.
Hyperliquid price technical analysis
HYPE appears to be entering a compressed volatility phase. Bollinger Bands have tightened on the daily chart, which is frequently an indication of an impending big move.
The upper band, which has caused pullbacks in recent sessions, is being tested by the price.

The structure of the market has improved. HYPE has formed a string of higher lows around $26 and $29 since late January, indicating that buyers are intervening earlier on dips. This outlook is also supported by momentum indicators.
There is potential for more gains as the relative strength index is in the mid-50s and trending upward. Meanwhile, the mid-Bollinger Band has been offering dynamic support around $29.
A move toward $35 could ensue if HYPE breaks above $33–$34, with a possible extension to $38 if buying pressure increases. Deeper losses could retest the $26 base, and rejection at resistance could push the token back toward $29 on the downside.
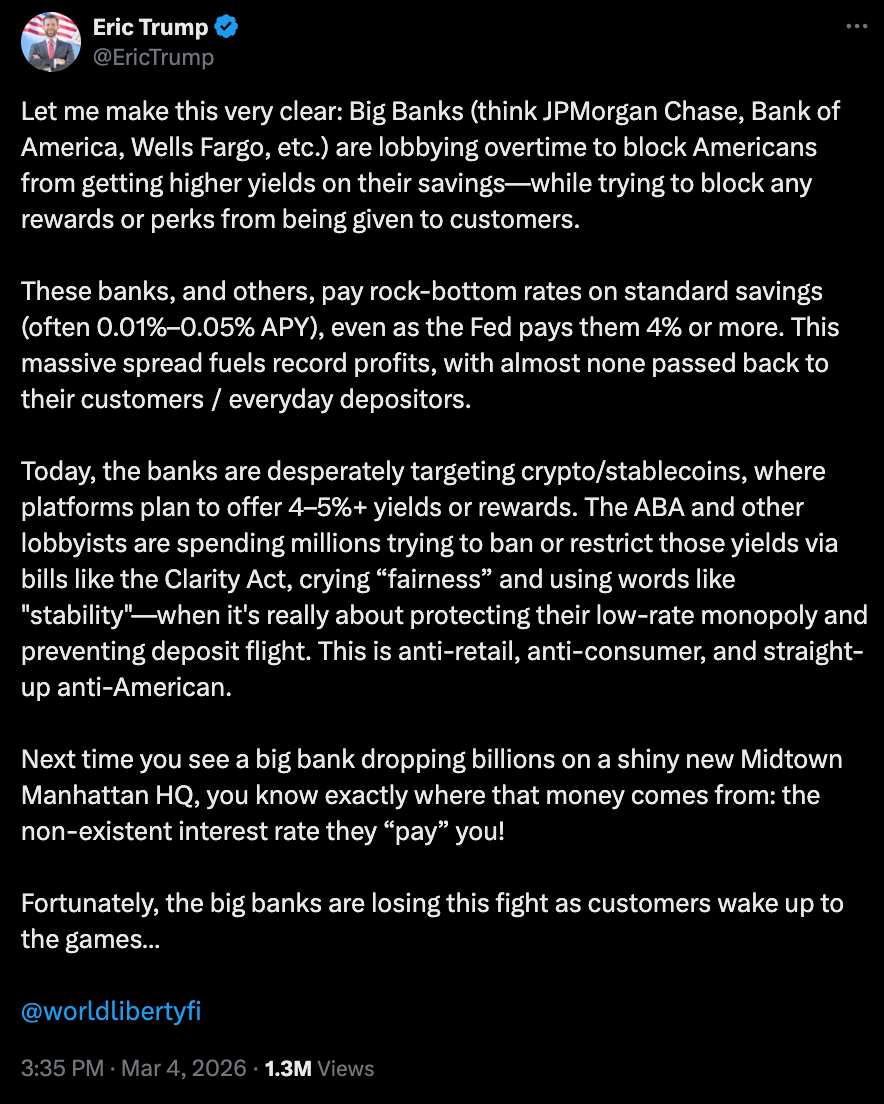
The post from Eric Trump, tagging his crypto company, came hours after his father claimed banks were holding a market structure bill “hostage.”
Eric Trump, son of US President Donald Trump and one of the co-founders of the family-backed crypto business World Liberty Financial, has jumped on the anti-bank messaging that many in the industry are espousing amid disagreements over how to handle stablecoin rewards.
In a Wednesday X post, Eric Trump echoed his father, claiming that banks were “desperately targeting” cryptocurrencies and stablecoins as discussions lag on the market structure bill in the US Senate. The post came hours after the president posted a similar message claiming that banks were holding the legislation “hostage.”

The issue of stablecoin yield has been dividing many US lawmakers, banking industry representatives, and crypto companies, stymieing the market structure legislation. Eric Trump and many in the crypto industry oppose a ban on stablecoin yield, arguing it would “block any rewards or perks from being given to customers,” while some banking organizations have argued such rewards could undermine credit and lead to deposit flight risk.
Related: Trump met Coinbase CEO before slamming banks over crypto bill: Report
A company representative, in response to questions about Eric Trump’s post, said that the company was “not a political organization” and he “has been clear about why he helped create World Liberty Financial.”
Senate banking panel has yet to reschedule market structure bill markup
Eric Trump’s message was one of the latest public statements from a leading industry figure after three meetings between White House officials and banking and crypto representatives on how to address stablecoin yield in the market structure bill. The legislation, called the CLARITY Act when it passed the House of Representatives in July, has been delayed by a 43-day government shutdown and debates among lawmakers on ethics, tokenized equities and stablecoins.
Although the Senate Agriculture Committee advanced its version of the bill in January, the banking panel postponed a markup and had yet to reschedule it as of Thursday. Both versions will likely need to pass the two committees and be consolidated before the full Senate can potentially vote on the bill.
Magazine: Bitcoin may face hard fork over any attempt to freeze Satoshi’s coins


Aave Labs is going all in on security ahead of its V4 launch.
The team has spent about $1.5 million on an extensive audit program, making it one of the most intensive security reviews in DeFi so far.
The review process lasted roughly 345 days and involved several security firms, as well as a large public audit contest.
The era of “move fast and break things” is fading. In today’s market, resilience and security are becoming the real competitive edge.
- Audit Scale: The $1.5 million program covered 345 days of cumulative review across four major firms and 900+ independent researchers.
- V4 Architecture: Aave has shifted to a “security-first” model where formal verification runs parallel to code writing, not after.
- TVL Implication: The zero-critical-finding result from the public contest signals institutional-grade readiness for V4 liquidity scaling.
Aave Labs $1.5M Audit Program: What the Investment Signals About V4 Risk
The V4 audit went far beyond a normal protocol upgrade.
Backed by funding from the Aave DAO, the team brought in major security firms like ChainSecurity, Trail of Bits, Blackthorn, and Certora. Instead of one audit pass, the code was tested from multiple angles.
Altogether, the protocol underwent nearly a full year of testing by internal teams, external auditors, and independent researchers. One of the biggest phases was a six-week public security contest on Sherlock between December 2025 and January 2026.
More than 900 researchers joined the contest and submitted over 950 findings. Despite that massive review, no critical or high-severity vulnerabilities were found.
That clean result strengthens confidence in Aave’s hub-and-spoke architecture, which was designed to reduce the protocol’s overall attack surface.
Aave V4’s Layered Security Model: How It Works and Why It’s Different
Aave Labs is moving away from the old “build first, audit later” approach. With V4, security teams are working alongside developers from day one.
The framework revolves around five core ideas: formal verification to mathematically test the code, layered reviews combining manual audits and automated testing, continuous checks on every code update, ongoing bug bounties, and AI tools scanning for unusual attack paths.
The AI element stands out. Automated systems can catch edge cases that human auditors might miss. Verification firm Certora helped define strict rules, called invariants, that the code must always follow before it even reaches manual review.
Early researchers who examined the code described it as unusually clean for a pre-audit project. The architecture also reduces the attack surface, helping eliminate common DeFi exploit points before launch.
Security is becoming a major competitive advantage in DeFi. Institutional capital will not touch protocols that carry unknown smart contract risk. Spending $1.5 million upfront on security is a small price to pay for the value locked in the protocol, but it sends a strong trust signal.
The next key test will come after launch. If Aave V4 runs its first months without major issues, cautious capital that has stayed away from DeFi after recent hacks could start flowing back in.
The post Aave Labs Outlines Layered Security Plan for V4 After $1.5 Million Audit appeared first on Cryptonews.


Ethereum derivatives markets saw a sharp bout of deleveraging over the past day, with total ETH contract open interest across major centralized exchanges falling 5.62% to 27.119 billion dollars, according to Coinglass data.
Summary
According to data from Coinglass, the total open interest of Ethereum (ETH) contracts across the network has contracted by 5.62% in the past 24 hours, bringing the figure down to 27.119 billion dollars.
The decline signals a decisive round of risk reduction in the derivatives market, with traders closing or being forced out of leveraged positions as conditions turn more defensive. While granular liquidation figures were not provided, the magnitude of the move suggests a mix of voluntary deleveraging and margin-driven position exits rather than a purely organic rotation.
Binance remains the largest concentration point for ETH derivatives risk, now holding 5.74 billion dollars in open interest, while Gate registers 2.866 billion dollars, Bybit 2.059 billion dollars, and OKX 1.772 billion dollars. This clustering of leverage on a handful of venues means that order book dislocations or sudden funding shifts on these exchanges can quickly bleed into spot pricing. For basis and spread traders, the reset in open interest may open up cleaner arbitrage conditions after a period of elevated speculative positioning.
Historically, single‑day pullbacks of this scale in open interest have often acted as either mid‑trend “cleanup” events or the first leg of a broader de‑risking cycle, depending on subsequent spot demand and funding dynamics. If funding normalizes and fresh spot buying emerges, the current move could be framed as a healthy clearing of excess leverage built up during prior rallies. However, if open interest continues to grind lower while spot remains under pressure, it would indicate that systematic and speculative capital are still in distribution mode.
At press time, Ethereum is trading around 2,067 dollars, down approximately 3.65% over the past 24 hours, broadly echoing the scale of the derivatives drawdown. In the near term, traders are watching the 2,000‑dollar psychological level as key support; holding that zone while open interest stabilizes would support a consolidation narrative, whereas a decisive break lower alongside further OI contraction could signal an extension of the current downside phase.

TLDR:
- Web3 Foundation has closed its General Grants Program, Decentralized Voices, and several other key initiatives.
- W3F is now focused on two pillars: global Web3 evangelism and responsible long-term asset management.
- Polkadot’s next development phase is being led by Parity Technologies and its broader builder community.
- On-chain treasury and governance tools remain active, ensuring decentralized funding continues without W3F oversight.
Web3 Foundation has announced a major strategic realignment, stepping back from its hands-on operational role.
The organization is returning to its founding purpose: championing decentralized web technologies on a global scale.
For years, W3F actively helped bootstrap networks like Polkadot and Kusama into functioning, community-driven ecosystems.
As those networks have now reached a level of maturity, the Foundation is refocusing its priorities. It will concentrate on global advocacy and disciplined long-term asset management.
Concluded Programs Mark a Shift in the Foundation’s Operational Direction
Web3 Foundation has already closed several key programs as part of this transition. These include the General Grants Program, Support, Decentralized Voices, and Decentralized Nodes.
Each of these programs played a distinct role during the ecosystem’s early growth stages. Their conclusion marks a clear shift in how W3F operates.
Over the past year, W3F undertook a thorough review of its programs and spending. Several resource-heavy bounties were closed, and spending was carefully audited throughout this period.
Clearer documentation and operational guidelines were established based on lessons learned along the way.
Moreover, several additional initiatives are being evaluated for transition to external teams. These include the JAM Prize, Polkadot Governance Support, the Polkadot Wiki, and developer documentation.
The Knowledge Base and Kusama Vision are also among the programs being considered for handover.
Despite these changes, decentralized funding mechanisms remain fully active within the ecosystem. Communities still have direct access to on-chain governance and treasury tools for funding initiatives. These pathways continue to support innovation without requiring centralized oversight from the Foundation.
Two Core Priorities Will Define the Foundation’s Long-Term Strategy
Web3 Foundation is now centering its work around two clear pillars going forward. The first involves evangelizing and advancing the decentralized web on a global scale. The second focuses on safeguarding the Foundation’s assets in alignment with its broader Web3 mission.
At the same time, Polkadot is entering a phase focused on building products with real-world utility. Parity Technologies and a wider community of builders are now driving this development stage. The Foundation’s reduced operational role is designed to complement, rather than direct, this effort.
This transition also reflects how blockchain ecosystems naturally evolve over time. As networks become self-sustaining, support structures around them must adapt accordingly.
W3F is repositioning itself as a long-term steward rather than a day-to-day operational body. This approach allows the Foundation to focus on higher-level advocacy work.
Furthermore, this realignment places greater emphasis on disciplined asset allocation going forward. Resources will be directed toward efforts with the greatest global impact.
Through advocacy and financial stewardship, the Foundation aims to strengthen the Web3 ecosystem for years to come.

Crypto World
WhiteBIT Coin ($WBT) Officially Listed on Kraken Exchange, Highlighting Its Growing Recognition

[PRESS RELEASE – Vilnius, Lithuania, March 5th, 2026]
WhiteBIT, the largest European cryptocurrency exchange by traffic, announces that its native WhiteBIT Coin (WBT) is now trading on Kraken, one of the world’s long-standing crypto platforms. WBT trading is available on WBT/EUR and WBT/USD pairs, giving more traders worldwide access to the coin and reflecting the asset’s growing recognition in the market.
The listing marks a significant milestone for WhiteBIT, following rapid growth in 2025, during which WBT surged 160%, reaching an all-time-high of $64.11 and solidifying its position as the 11th-largest cryptocurrency by market capitalization at $10.7 billion, according to CoinGecko.
“Listing WBT on Kraken represents a logical next step in the expansion of the WhiteBIT ecosystem,” said Volodymyr Nosov, Founder and President of W Group, which WhiteBIT is a part of. “It reflects the momentum we’ve built through ecosystem growth, strategic partnerships, and increasing institutional visibility. It’s another important endorsement of WBT’s value and its role in the future of digital finance.”
This momentum has been powered by the expansion of the W Group ecosystem, which WhiteBIT is a part of, including:
- High-profile partnerships, such as the collaboration with Juventus, making WhiteBIT the club’s Official Sleeve and Cryptocurrency Exchange Partner.
- Global market expansion, with new operations in South America and the United States.
- Strategic cooperation in the Middle East, including partnership with Saudi Arabia to develop blockchain infrastructure and CBDC framework.
- Institutional recognition, including WBT’s inclusion in the S&P Crypto Indices, reflecting the token’s growing liquidity and market relevance.
Launched in 2022, WhiteBIT Coin (WBT) is the native utility token of the WhiteBIT platform. It offers significant advantages within the WhiteBIT exchange ecosystem, including reduced trading fees (up to 100% discount), increased referral bonuses (up to 50%), and free daily withdrawals. Users also gain from free AML checks, staking rewards up to 22.1%, and exclusive access to new projects via the WhiteBIT Launchpad.
The addition of WBT to Kraken not only expands access for traders worldwide but also reinforces WhiteBIT’s commitment to developing a globally recognized exchange-native coin that delivers utility, liquidity, and long-term value.
About WhiteBIT
WhiteBIT is the largest European cryptocurrency exchange by traffic, offering over 900 trading pairs, 350+ assets, and supporting 8 fiat currencies. Founded in 2018, the platform is a part of W Group which serves more than 35 million customers globally. WhiteBIT collaborates with Visa, FACEIT, FC Juventus and the Ukrainian national football team. The company is dedicated to driving the widespread adoption of blockchain technology worldwide.
Binance Free $600 (CryptoPotato Exclusive): Use this link to register a new account and receive $600 exclusive welcome offer on Binance (full details).
LIMITED OFFER for CryptoPotato readers at Bybit: Use this link to register and open a $500 FREE position on any coin!

The Securities and Exchange Commission has ended its long-running fraud and securities violation lawsuit against Justin Sun in a $10 million settlement.
The US Securities and Exchange Commission has ended its lawsuit against crypto entrepreneur Justin Sun with a $10 million settlement, ending a two-year legal battle over alleged fraud and securities laws violations.
The SEC said in a letter to a Manhattan federal court on Thursday that Rainberry, one of Sun’s companies, would pay a $10 million fine, and claims against Sun and his companies, the Tron Foundation and BitTorrent Foundation would be dropped.
Related: Rep Waters demands SEC oversight hearing about its approach to crypto
The lawsuit, first filed in March 2023, accused Sun and his companies of selling unregistered securities via the Tronix (TRX) and BitTorrent (BTT) tokens and allegedly wash trading TRX.
Magazine: SEC’s U-turn on crypto leaves key questions unanswered
This is a developing story, and further information will be added as it becomes available.

The U.S. Securities and Exchange Commission has closed a high-profile civil action against crypto entrepreneur Justin Sun, announcing a resolution that ends a two-year dispute over allegations of fraud and securities violations. In a letter filed with a Manhattan federal court, Rainberry, one of Sun’s companies, will pay a $10 million penalty, and the SEC said that the claims against Sun along with the Tron Foundation and BitTorrent Foundation would be dropped. The suit, filed in March 2023, alleged that Sun and his affiliated entities offered securities or investment-like instruments tied to the Tron and BitTorrent ecosystems and engaged in trading activity accused of wash trading. The settlement wraps up the government’s action, while Sun’s other ventures continue to operate in a regulated, growing environment.
Key takeaways
- The SEC has settled with Rainberry for $10 million, ending litigation against Justin Sun and dropping charges against the Tron Foundation and BitTorrent Foundation.
- The case, filed in March 2023, centered on allegations of unregistered securities and wash trading involving the Tronix and BitTorrent tokens.
- The resolution signals continued regulatory risk and scrutiny for token-based projects, even as some cases are resolved without a broader ruling on asset classification.
- The settlement follows a wave of enforcement activity in the crypto sector and occurs amid ongoing questions about how token offerings fit securities laws.
- Regulators’ attention to token ecosystems remains high, with lawmakers and watchdogs calling for oversight and clearer rules around crypto projects.
Tickers mentioned: $TRX, $BTT
Sentiment: Neutral
Price impact: Neutral. The settlement does not indicate an immediate price reaction for related assets as no public market move is documented in the filing.
Market context: The settlement arrives as crypto enforcement remains active and markets weigh regulatory signals on token sales, security classifications, and disclosure requirements amid rising institutional interest and ETF considerations.
Why it matters
The resolution matters for the broader crypto ecosystem because it provides a concrete example of how regulators view token-related activities tied to established blockchain ecosystems. While the Rainberry settlement carries a monetary penalty and results in the dismissal of claims against Justin Sun and the Tron Foundation and BitTorrent Foundation, the SEC maintained that certain token arrangements can fall under securities laws when investment-like features or registration requirements are involved. The decision underscores the continuing debate over the boundary between securities and non-securities in token projects, a topic that has shaped enforcement priorities and policy discussions for years. For builders and investors, the message is clear: thorough disclosures and careful consideration of registration and compliance can influence both risk and opportunity in token-enabled ecosystems. The case also highlights that settlements can end protracted litigation while still leaving room for regulatory interpretation to evolve in future actions.
Beyond the immediate parties, the development feeds into a broader regulatory narrative surrounding token issuance, trading practices, and how authorities scrutinize market manipulation allegations such as wash trading. The outcome does not end regulatory interest in these topics; rather, it demonstrates that settlements can resolve specific cases while regulators continue to refine their approach to crypto-assets and the securities-versus-non-securities question that underpins much of the policy debate in Washington and abroad.
Market participants should monitor how similar cases evolve and whether additional settlements or guidance will emerge that clarify registration requirements for token offerings tied to major ecosystems. The case also serves as a reference point for exchanges, issuers, and developers seeking to understand how enforcement actions align with current legislative discussions about crypto oversight and investor protection.
What to watch next
- A formal court entry detailing the settlement terms and confirming Rainberry’s payment timeline.
- An official SEC statement clarifying the scope of the dropped claims and the regulatory reasoning behind the resolution.
- Reactions from Sun and the Tron/BitTorrent communities, including any statements from the related foundations.
- Regulatory guidance or policy proposals addressing token offerings and securities classification in the near term.
- Subsequent filings or communications in the case that illuminate how the agency interprets token-based securities going forward.
Sources & verification
Settlement ends SEC v. Sun case and sets tone for crypto enforcement
The filing language and subsequent statements indicate a precise and bounded resolution. Rainberry’s $10 million payment closes a chapter that began when the SEC charged Justin Sun and his affiliated entities with moving securities-like instruments without appropriate registration and with market practices that allegedly included wash trading around the Tron ecosystem. The commission’s reference to Tronix (TRX) (CRYPTO: TRX) and BitTorrent (BTT) (CRYPTO: BTT) tokens underscores how regulators continue to scrutinize token offerings that may carry investment contracts or other securities characteristics. The inclusion of these tokens in the allegations highlighted ongoing tensions between innovation in decentralized ecosystems and the securities framework that governs traditional asset offerings, a tension that remains at the core of many enforcement discussions.
The settlement makes Rainberry the sole financial obligation in this case, while the claims against Justin Sun and the affiliated foundations are dismissed. This outcome signals that enforceable penalties can be levied even as broader questions about token-based securities persist. The timing aligns with a period of heightened regulatory attention on crypto assets and ongoing policy debates about how to classify and regulate tokens used to coordinate decentralized networks and fundraising activities. The case, therefore, stands as a practical example of how settlements can resolve specific enforcement actions while leaving open questions about the definitive boundaries of securities laws in the rapidly evolving token economy.
For observers tracking regulatory signals, the decision adds a data point in the broader context of enforcement strategy that seeks to balance investor protection with the continued growth of blockchain-based ecosystems. It also reinforces the notion that settlement terms can provide a clear path forward for involved projects while regulators continue to pursue further clarity on how token issuances should be structured and disclosed. As the market digests this outcome, market participants will look for guidance on disclosures, registration considerations where applicable, and how future actions might delineate the permissible scope of token-related activities within established ecosystems.
Crypto World
Strange New Chinese AI ‘KIMI’ Predicts the Price of XRP, Ethereum and Dogecoin by the End of 2026
When you plug in a special prompt into AI chatbots, KIMI AI reveals some frankly unbelievable 2026 price projections for top cryptocurrencies.
Markets seem unfazed by the US/Iran war news, a sign that much of the geopolitical risk was absorbed earlier in the year, following aggressive sell-offs triggered by comments from former President Trump regarding possible U.S. military actions linked to Greenland and Iran.
While it’s still early days, crypto’s recovery may actually be on a firm footing.
Here’s why KIMI AI believes XRP, Ethereum and Dogecoin will gain the most.
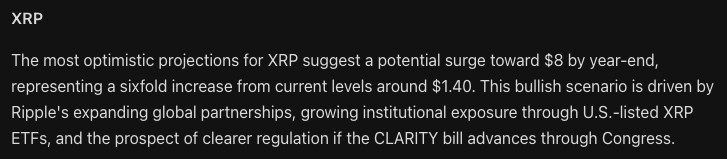
XRP ($XRP): KIMI AI Forecasts a 6x Move Within 10 Months
In a recent update, Ripple reaffirmed XRP ($XRP) remains central to its vision of establishing the XRP Ledger (XRPL) as a global, enterprise-grade payments infrastructure.

Thanks to near-instant transaction finality and minimal fees, XRPL could secure an early foothold in two of crypto’s fastest-growing verticals: stablecoins and tokenized real-world assets.
XRP is currently trading near $1.41, and KIMI predicts a potential rally toward $8 by New Year, representing a sixfold gain from current levels.
XRP’s relative strength index (RSI) is holding close to a neutral 50, while price action has converged with the 30-day moving average, indicating the downturn may be exhausted.
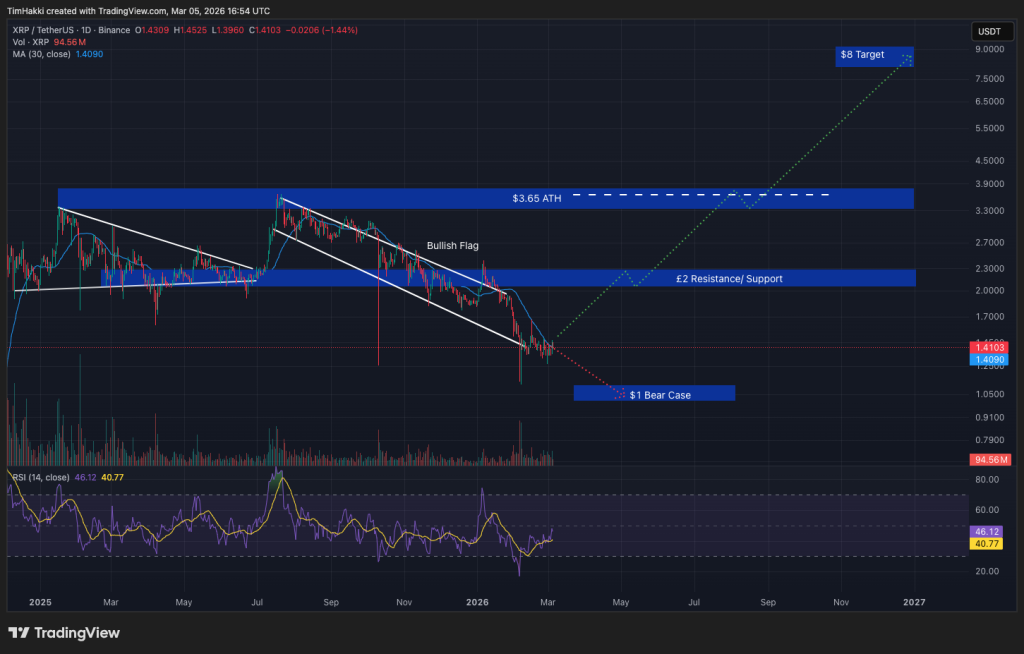
Hitting $8 depends on rising institutional participation following the rollout of U.S.-listed XRP ETFs, Ripple’s expanding international partnerships, and the passage of the CLARITY Act through Congress later this year.
Ethereum (ETH): KIMI AI Sees ETH at $7.500
Ethereum ($ETH) remains the foundation of decentralized finance thanks to an early lead in sophisticated smart contracts.
With a market capitalization of $251 billion and roughly $53 billion locked on chain, Ethereum is the primary settlement layer for blockchain economic activity.
Its strong security record, leadership in stablecoin issuance, and early traction in real-world asset tokenization position Ethereum for increased institutional adoption post-CLARITY.
Regulatory clarity remains a key variable. Institutions require it to deploy larger allocations on Ethereum.
ETH is currently trading below $2,000, with significant resistance expected near $5,000, close to its all-time high of $4,946.05 last August.
KIMI’s scenario suggests that a confirmed breakout above $5,000 could open the door to $7,500 ETH before Christmas.
Dogecoin (DOGE): DOGE to $1? KIMI AI Thinks the Real Target is 3x That!
Originally launched as a joke in 2013, Dogecoin ($DOGE) is now a mature digital asset with a market capitalization around $14 billion, accounting for nearly half of the $32 billion meme coin sector.
DOGE last set an all-time high of $0.7316 during the retail-driven bull market of 2021.
The $1 milestone has long been a psychological target for the Dogecoin community, and KIMI’s outlook suggests that a strong bull cycle could push DOGE close to, or beyond, that level.
From its current price just under $0.10, a move toward $2.80 or higher would represent a 28x return, or 2,700%.
Adoption and utility continue to grow.
Tesla accepts DOGE for select merchandise, while major fintech platforms including PayPal and Revolut now support Dogecoin transactions, reinforcing its real-world utility.
SUBBD (SUBBD): If Altseason is Here, then SUBBD is KING
If the above cryptos follow KIMI’s projected course, then one new token that presale watchers expect will surge alongside them is SUBBD ($SUBBD), an AI-integrated content platform likely to disrupt the $85 billion creator economy.
SUBBD empowers creators with better revenue tools while offering fans more meaningful engagement.
Unlike traditional subscription platforms, which often charge creators up to 20% in fees while limiting community control, SUBBD eliminates intermediaries.
This decentralized approach has already sparked interest, raising $1.5 million during its ongoing presale.
Fans also benefit from an exclusive access ecosystem, including token-gated content, early releases, and member-only discounts, all fostering deeper connections between creators and their supporters.
To stay updated, you can follow SUBBD across X, Telegram, and Instagram, or join the ongoing presale directly through their website.
Visit the Official SUBBD Website Here
The post Strange New Chinese AI ‘KIMI’ Predicts the Price of XRP, Ethereum and Dogecoin by the End of 2026 appeared first on Cryptonews.

US, Venezuela agree to reestablish diplomatic relations
Rupee soars after RBI comes out firing in support

Weekly Bitcoin Buys Produce The Best Returns Across Bull And Bear Markets


-

 Politics3 days ago
Alan Cumming Brands Baftas Ceremony A ‘Triggering S**tshow’
-

 Fashion6 days ago
Weekend Open Thread: Iris Top
-

 Tech5 days ago
Unihertz’s Titan 2 Elite Arrives Just as Physical Keyboards Refuse to Fade Away
-

 NewsBeat5 days ago
Abusive parents will now be treated like sex offenders and placed on a ‘child cruelty register’ | News UK
-
Sports6 days ago
The Vikings Need a Duck
-
 NewsBeat5 days ago
Dubai flights cancelled as Brit told airspace closed ’10 minutes after boarding’
-
 NewsBeat6 days ago
The empty pub on busy Cambridge road that has been boarded up for years
-

 NewsBeat4 days ago
‘Significant’ damage to boarded-up Horden house after fire
-

 Tech18 hours ago
Bitwarden adds support for passkey login on Windows 11
-

 Entertainment4 days ago
Baby Gear Guide: Strollers, Car Seats
-
 Sports6 hours ago
499 runs and 34 sixes later, India beat England to enter T20 World Cup final | Cricket News
-
 Tech7 days ago
NASA Reveals Identity of Astronaut Who Suffered Medical Incident Aboard ISS
-
Politics5 days ago
FIFA hypocrisy after Israel murder over 400 Palestinian footballers
-
 NewsBeat5 days ago
Emirates confirms when flights will resume amid Dubai airport chaos
-

 NewsBeat3 days ago
Is it acceptable to comment on the appearance of strangers in public? Readers discuss
-

 Tech5 days ago
Viral ad shows aged Musk, Altman, and Bezos using jobless humans to power AI
-

 Video4 days ago
How to Build Finance Dashboards With AI in Minutes
-

 Business2 days ago
Guthrie Disappearance Enters Fifth Week as Family Visits Memorial
-
 Crypto World5 days ago
US Judge Lets Binance Unregistered Token Class Action Proceed
-
 NewsBeat4 days ago
Ukraine-Russia war latest: Belgium releases video showing forces boarding Russian shadow fleet oil tanker