
Crypto World
XRP Holds Key Support as Bottom Signals Emerge
XRP’s price action has been in an extended downtrend for eight months, but a convergence of on-chain signals is drawing attention to a potential bottoming narrative. The XRP/BTC pair’s RSI sits deep in the oversold zone, with readings around 24, a level that has historically aligned with macro bottoms and subsequent recoveries. Data tracked by TradingView, and summarized in recent coverage, suggest this could be more than a temporary squeeze for the cross-pair.
Beyond the RSI, on-chain analytics are flashing a similar signal. XRP’s MVRV Z-score, a gauge that compares market value to realized value, is hovering near zero—a cadence historically associated with accumulation phases and capitulation-driven bottoms. Glassnode’s metrics indicate that such coordinates often precede meaningful rallies, echoing a pattern seen in prior cycles in 2021, 2022 and again in 2024 before pronounced upside moves.
To place these signals in a market context, a Cointelegraph chart that overlays XRP/BTC price action against the broader market shows that the last bottom in XRP/BTC around this zone in June 2025 preceded a substantial rally: a 61% rebound in the XRP/BTC ratio and a 92% surge in XRP/USD to a multi-year high of roughly $3.66. The chart’s yellow bars emphasize how these zones have repeatedly acted as macro bottoms for the XRP/BTC pair.
Key takeaways
- RSI for XRP/BTC at about 24 signals an oversold condition that historically marks macro bottoms and the start of new uptrends.
- MVRV Z-score for XRP is near zero, a level that has preceded accumulation phases and subsequent rallies in multiple prior cycles.
- Glassnode heatmaps show a substantial cost-basis distribution around the $1.30 area, with about 1.73 billion XRP bought near that price band.
- The XRP/USD price must hold above a key support zone of $1.25–$1.30; losing this zone could open a path toward a lower demand area, including the $1.15 region and the 200-week moving average.
- Historical patterns suggest that bottoms from these levels have been followed by meaningful rallies, though macro conditions and market sentiment remain critical filters.
On-chain signals point to a potential bottoming process
From a technical standpoint, XRP’s recent price action is painting a familiar picture: a prolonged downtrend cooled by deep oversold momentum. The RSI reading in the XRP/BTC pair has rarely dropped further in recent cycles without a subsequent phase of consolidation before a bounce, and in this cycle, the indicator sits at levels that have historically preceded risk-off capitulation turning into a recovery phase. While RSI alone is not a predictor, when paired with the on-chain landscape, it reinforces a stance that selling pressure might be ebbing.
Complementing the RSI, the MVRV Z-score provides a more long-horizon perspective. The score near zero implies that many investors are near breakeven and may be less inclined to rush toward the exit. That dynamic can reduce downside pressure and enable a more stable base to form, a hallmark of accumulation zones that precede rallies. The last time XRP’s MVRV Z-score revisited these levels, similar to late-2024 and early-2025, the market accrued strength before resuming gains.
Analysts have tied these signals to a broader narrative about XRP’s cycle. An observed pattern from prior cycles shows that whenever these on-chain indicators align with oversold momentum, they often pave the way for a multi-month recovery in price. This is not a forecast but a lens through which traders are evaluating risk and opportunity at current levels.
“If this zone continues to hold, then a short-term bounce towards $1.45 can’t be ruled out.”
That perspective, voiced by a trader on X, reflects a plausible near-term pathway if the current support remains intact and buyers step in at the zone around $1.25–$1.30. The emphasis is on the zone’s integrity: a sustained hold here would be a signal that demand could reassert itself and push XRP toward higher ground, even before evaluating macro catalysts.
Support, resistance, and what could unfold next
From a price-structure standpoint, the immediate floor lies in the $1.25–$1.30 band. This zone has held since early February 2026 and has acted as a crucial pivot point for the bull-bear balance. If demand persists in defending this range, a measured rebound could unfold, potentially aiming toward the $1.45 area and beyond. Traders eyeing a return to higher levels would look for a continued rejection of shorts at these thresholds, coupled with improving on-chain signals and stabilizing price action.
However, a breach below the zone would raise the risk of a more extended downside move. The next line of defense sits near the $1.15 area, where the 200-week simple moving average has hovered. A break below this level could trigger a swift re-pricing, pushing XRP toward the bear-flag target around $0.80, a level that would reframe the risk-reward for bulls in the near term. In practice, this setup makes the $1.30 region a critical fulcrum for bulls and bears alike.
Beyond the immediate levels, market observers note that the long-run trajectory will hinge on a confluence of factors: the capacity of XRP to sustain on-chain health, macro risk appetite, and regulatory developments that could influence crypto liquidity and sentiment. The broader narrative of XRP’s cycle has historically shown that bottoms in this zone have not been isolated events; they have often coincided with stronger macro flows and renewed buying interest from longer-horizon holders.
On the price trajectory, the charted path hints at upside potential if the zone holds. Prior episodes have demonstrated that a bottom in this region can coincide with a shift in momentum and a fresh phase of accumulation, eventually leading to fresh highs once the market reasserts confidence. In this context, observers see the possibility of XRP moving toward the $1.70 level or higher if buyers maintain control and the macro environment remains favorable.
Context, history, and what anchors traders are watching
Historical context matters for investors seeking to gauge risk. The rally pattern that followed the June 2025 XRP/BTC bottom—characterized by a 61% improvement in the XRP/BTC ratio and a 92% surge in XRP/USD to a multi-year high—offers a concrete example of how a bottom can translate into meaningful upside within a relatively short timeframe. While past performance is not a guarantee of future results, the alignment of on-chain signals with price action in that period reinforces a cautious optimism among market participants.
Another anchor is the cost-basis distribution. Glassnode’s heatmap shows that roughly 1.73 billion XRP were accumulated near the $1.30 price level, suggesting a robust base of investors with meaningful exposure in that band. This concentration can provide a ballast to price during volatility but may also attract selling pressure if the price falters, given the number of coins purchased at or near the same level. The dynamics underscore the importance of the $1.25–$1.30 support as both a technical and a psychology-driven threshold.
For readers seeking corroboration, the broader narrative has drawn on a mix of price charts and on-chain metrics, including references to XRP’s performance in other cycles and the behavior of the XRP/USD and XRP/BTC cross-pairs. Notably, Cointelegraph has highlighted past instances where XRP’s bottom against Bitcoin in that zone preceded sharp rallies, illustrating how cross-market relationships can amplify a rally even when the USD price remains at modest levels. These data points provide a framework for assessing risk in the current environment, rather than a single-point forecast.
What to watch next
Investors should keep a close eye on whether XRP can sustain the $1.25–$1.30 support zone in the near term. A stable hold would bolster the case for a bounce and could draw in momentum traders seeking a breakout above the immediate overheads. Conversely, a break below $1.15, with a potential retest of the 200-week moving average, would shift the outlook toward a more cautious stance and raise the odds of revisiting the lower $0.80 region.
In addition to price actions, market participants should monitor the evolving on-chain narrative around MVRV Z-scores and holder cost bases. A continued alignment between on-chain metrics and price strength would be a meaningful signal that the market is re-accumulating effectively. As always, macro conditions—liquidity, risk appetite, and regulatory clarity—will shape the pace and duration of any nascent upturn.
Readers should watch for further developments in XRP’s cross-market dynamics, including how the XRP/BTC pair behaves around the current consolidation range and whether the broader crypto market conditions provide the catalysts needed for a sustained move higher. If the zone holds and macro sentiment improves, a path toward higher levels—potentially toward the $1.70 area or beyond—could emerge as part of a broader re-pricing of risk in the months ahead.


TLDR:
- Strategy holds approximately 761,000 BTC, trailing BlackRock’s IBIT by roughly 40,000 BTC currently.
- MSTR raises capital via equity and debt to buy Bitcoin directly, bypassing ETF demand dependency entirely.
- Strategy added 40,332 BTC in the first two weeks of March 2026, posting a 3.0% BTC yield.
- Bitcoin recorded eight straight days of gains, with past streaks delivering a median 30-day return of 19%.
Michael Saylor’s strategy has narrowed the Bitcoin holdings gap with BlackRock’s iShares Bitcoin Trust to roughly 40,000 BTC through relentless capital raises and direct purchases. With Bitcoin recovering steadily from February lows, the distance between the two could vanish within weeks.
Strategy’s Accumulation Model Sets It Apart
MSTR Bitcoin holdings currently stand at approximately 761,000 BTC. BlackRock’s iShares Bitcoin Trust holds roughly 781,000 BTC, leaving a gap of around 40,000 BTC.
Investor Mark Harvey noted that the difference has tightened considerably in recent weeks. Strategy raises capital through equity and preferred share issuance to fund direct Bitcoin purchases.
This model allows it to accumulate Bitcoin independent of ETF demand cycles. IBIT, by contrast, grows only when investor inflows are strong.
The company completed two multibillion-dollar Bitcoin purchases in March. Last week alone, it acquired 2,337 BTC for approximately $1.57 billion.
Over the first two weeks of March 2026, Strategy added 40,332 BTC and recorded a 3.0% BTC yield. Michael Saylor shared the firm’s year-to-date figures via X, noting sustained momentum behind its treasury approach.
Strategy frames Bitcoin accumulation as its core performance measure, using “BTC Gain” as a proxy for net income. Its long-term holding approach also removes coins from active circulation, gradually tightening available market supply.
Bitcoin’s Recovery Strengthens the Backdrop
Bitcoin bottomed near $63,000 in February amid geopolitical tensions tied to the Iran–Israel War. Prices recovered steadily after macroeconomic conditions stabilised and investor confidence returned.
The asset recently climbed from below $66,000 to $76,000 before easing near $73,800. Bitcoin has now recorded eight consecutive days of price gains.
According to Bitcoin Magazine Pro data, this streak has occurred only 15 times since Bitcoin’s creation. Past instances produced a median 30-day return of roughly 19%, though sharp pullbacks have also followed such runs.
Markets received a further boost over the weekend after signs of easing tensions around the Strait of Hormuz. Bitcoin also outperformed gold and the S&P 500 during this period.
Traders are now watching whether prices can hold above $72,000, a level that could open the path toward $80,000.

TLDR:
- Iran’s Strait of Hormuz Management Plan, passed in late March 2026, mandates Bitcoin toll payments.
- Each fully laden tanker carrying 2 million barrels faces a Bitcoin toll of up to $2 million.
- Bitcoin surged toward $73,000 as shipping firms faced the prospect of stockpiling BTC for tolls.
- Stablecoins were rejected due to freeze functions and GENIUS framework compliance requirements.
Iran Bitcoin oil toll reports are drawing wide attention across crypto and energy markets globally. Iran has reportedly implemented a mandatory Bitcoin-based payment system for oil tankers transiting the Strait of Hormuz to bypass international sanctions.
Iran’s Bitcoin Toll Structure and Payment Mechanics at the Strait of Hormuz
Financial Times report stated that Iran was considering Bitcoin payments for oil tanker tolls using the Strait of Hormuz, which handles roughly 20% of the global oil supply.
The Strait of Hormuz Management Plan, passed in late March 2026, formally codifies Bitcoin as the primary payment method.
Under this system, tankers must submit cargo details, crew lists, and destination ports to Iranian authorities up to 96 hours before arrival. A toll of $1 per barrel of crude oil is then charged, which amounts to $2 million for a fully laden Very Large Crude Carrier carrying 2 million barrels.
Vessels attempting to pass without authorization have been warned via VHF radio of serious consequences.
The original report cited officials saying ships would have only a few seconds to complete a Bitcoin payment, pointing toward the Lightning Network as the likely mechanism. However, Alex Thorn of Galaxy noted the largest known Lightning transaction to date has reached $1 million.
Given toll amounts ranging up to $2 million, Thorn suggested Iranian authorities would more likely provide a QR code or Bitcoin address upon transit approval instead.
Bitcoin’s Structure Makes It Iran’s Preferred Choice Over Stablecoins
Iran’s decision to use Bitcoin rather than stablecoins reflects a clear strategic rationale. BTC advocate Justin Bechler noted that stablecoins like USDT and USDC carry built-in blacklist functions at the smart contract level.
When an address is flagged, issuers can freeze tokens entirely, making them completely illiquid and unusable.
Bechler further noted that the GENIUS stablecoin regulatory framework introduced compliance controls that make dollar-pegged stablecoins impractical for a sanctioned nation.
Bitcoin has no issuer, no compliance officer, and no freeze function, removing any central point of control. The Iranian system also explicitly excludes the US dollar, though some reports suggest limited yuan acceptance for select nations.
Market reaction followed quickly after the reports emerged. Bitcoin prices moved toward $73,000 as shipping companies faced the prospect of holding BTC for transit payments.
Hundreds of tankers have reportedly been waiting in the Persian Gulf, navigating the new requirements, while analysts suggest similar digital toll systems could emerge at other critical waterways globally.
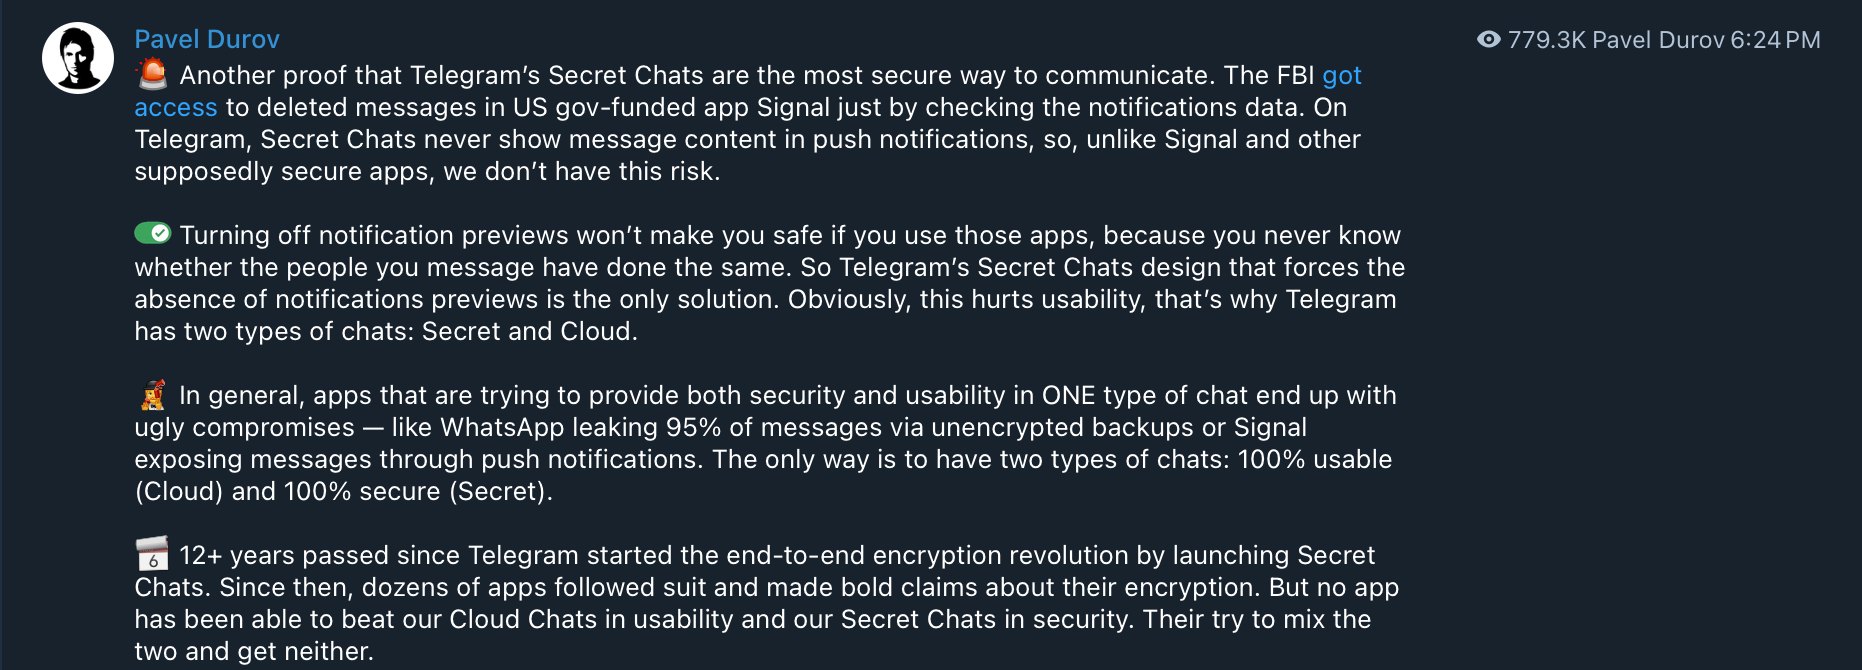
Pavel Durov, the co-founder of the Telegram messaging application, said that push notifications create a persistent, critical vulnerability to user privacy, allowing data retrieval even after messages and messaging applications that allow push notification data storage have been deleted from a device.
Durov cited a recent report, originally published by 404 Media, that the United States Federal Bureau of Investigation (FBI) was able to retrieve deleted messages from a Signal user by accessing device notification logs on an Apple iPhone. Durov said on Friday:
“Turning off notification previews won’t make you safe if you use those applications, because you never know whether the people you message have done the same.”

Cointelegraph reached out to Signal about the FBI’s data retrieval but did not receive a response by the time of publication.
The recent reports highlight how investigators and those with sufficient technical skills can circumvent end-to-end encryption and breach user privacy by accessing metadata and other information generated by applications, prompting a need for decentralized messaging applications that do not collect such data.
Related: Telegram founder Pavel Durov says Iranian government’s ban backfired
Alternative messaging application use surges amid spikes in civil unrest and geopolitical turmoil
Decentralized messaging applications and social media platforms experienced a surge in user interest since 2025, amid geopolitical tensions, nationwide communication blackouts and civil unrest.

Bitchat, a decentralized peer-to-peer messaging application that uses Bluetooth mesh networks to relay information between mobile devices, allows users to circumvent the internet and centralized communication networks entirely.
More than 48,000 users in Nepal downloaded the Bitchat application amid a nationwide social media ban in September 2025.
Individuals are also finding ways to circumvent national firewalls and bans on privacy-preserving applications by using virtual private networks (VPNs) and other tools that mask or obscure IP addresses and geolocation, according to Durov.
Government bans on Telegram have backfired, as users circumvent state-imposed restrictions through VPNs, allowing them to access and download banned platforms, Durov said.
“The government hoped for mass adoption of its surveillance messaging apps, but got mass adoption of VPNs instead,” he continued, adding that over 50 million users in Iran have downloaded the Telegram application, despite a years-long government ban.
Magazine: EU’s privacy-killing Chat Control bill delayed — but fight isn’t over
Bitcoin (BTC) is due a classic “short squeeze” as open interest hits five-week highs, says new analysis.
Key points:
-
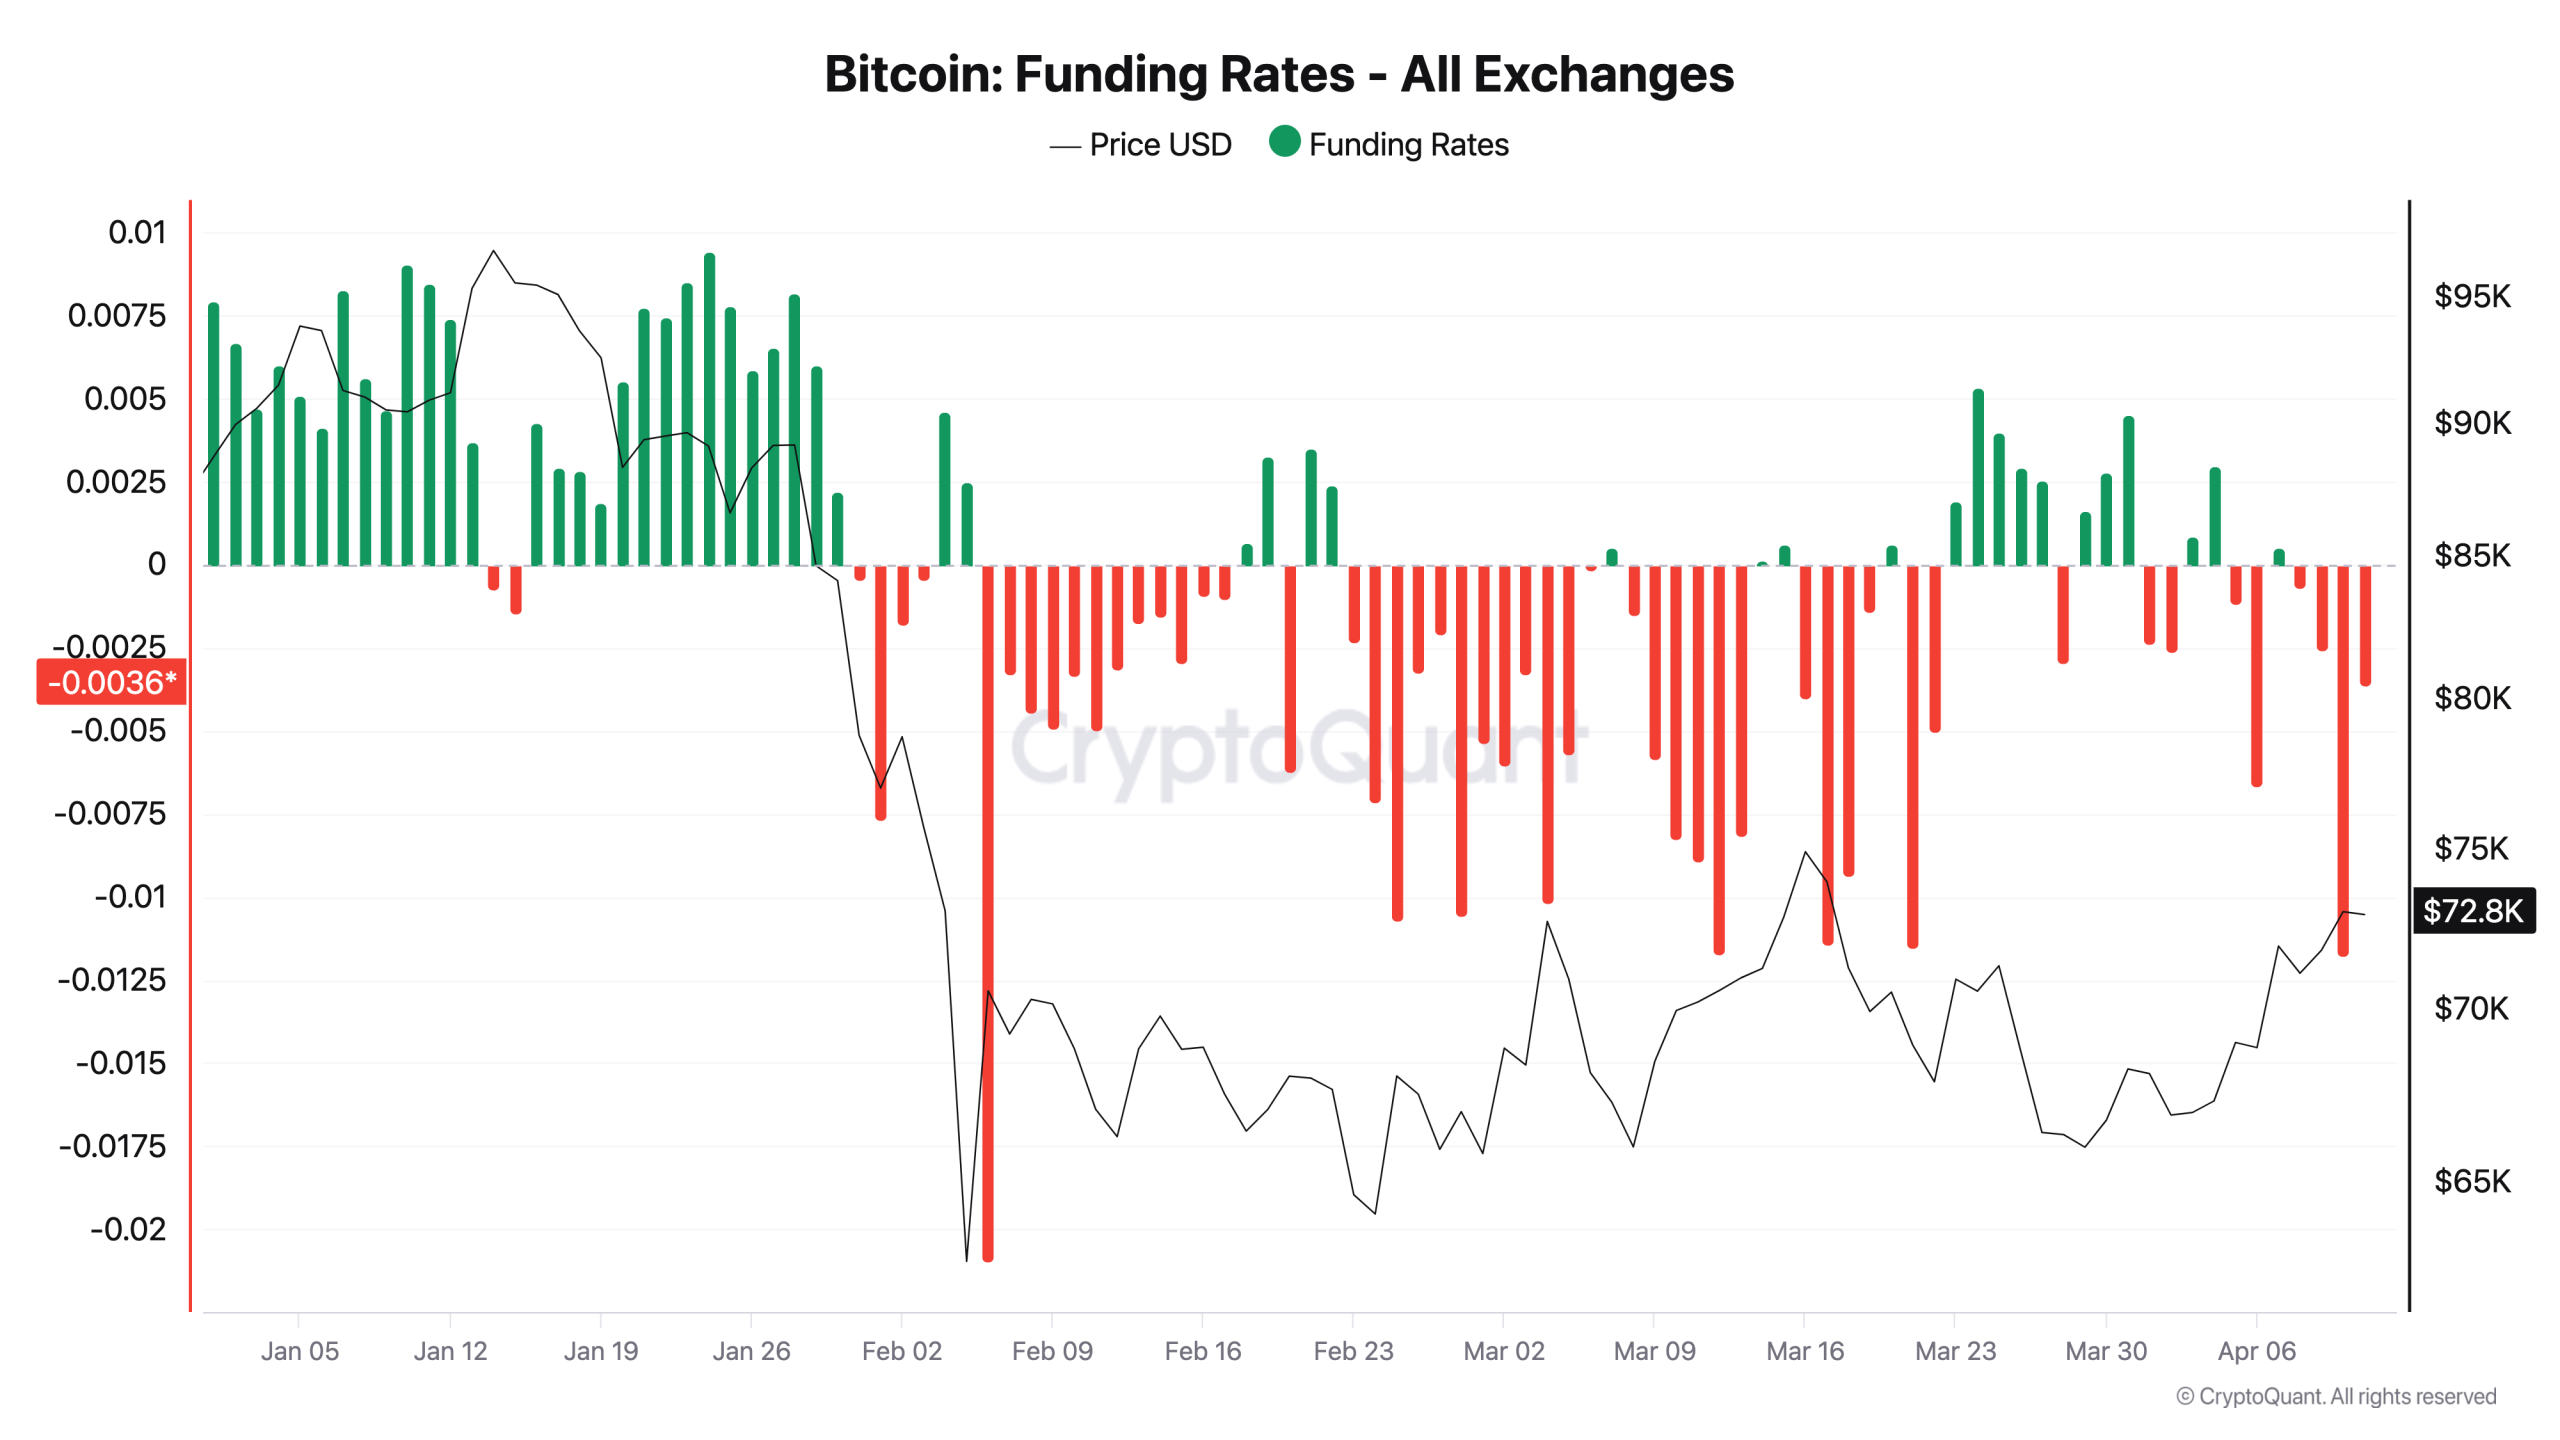
Bitcoin is seeing a combination of rising open interest and negative funding rates.
-
The result could punish short positions, with funding rates at the most negative since early February.
-
Large-scale Bitcoin speculators are net long BTC again.
Bitcoin short squeeze likelihood “increasing”
In one of its “Quicktake” blog posts on Saturday, onchain analytics platform CryptoQuant said that Bitcoin was “crowded” with short positions.
“BTC is flowing out of exchanges while funding rates remain strongly negative, creating an increasingly crowded short positioning environment where the potential for a short squeeze is building,” contributor CoinNiel summarized.
After BTC/USD passed $73,000 on Friday, traders appeared eager to trap those entering the market who were betting on continued price upside. Funding rates stayed negative on exchanges, while open interest grew to $24.2 billion — its highest since early March.
“Since March, negative funding has become more frequent, and throughout April it has remained in negative territory without flipping positive,” the post continued.
“This indicates that short positions dominate the market, with shorts paying longs, and such extreme positioning can act as a trigger for a reversal through forced liquidations.”

CoinNiel said that the combination of rising open interest and negative funding rates “suggests that leveraged short positions have been rapidly accumulating.”
“The slight decrease does not yet indicate a meaningful deleveraging phase,” he acknowledged.

Fellow contributor Gaah agreed, noting that funding rates had hit their deepest negative value since Bitcoin’s dip to multiyear lows at the start of February.
“Caution is needed when establishing positions in current range, since it represents an area of buying demand,” he wrote in a further Quicktake post.
“Bears trapped? Likelihood of a short squeeze is increasing.”
Trader: Bitcoin speculators copying 2023 rebound
Earlier, Cointelegraph reported on short liquidations staying modest despite the BTC price upside.
Related: Bitcoin analysis sees $55K BTC price ‘iron bottom’ by December 2026
Data from CoinGlass showed that over the 24 hours to the time of writing, cross-crypto liquidations totaled less than $100 million.

Sentiment among market participants, meanwhile, has gradually begun to favor fresh upside, with targets including $80,000 and higher.
On Saturday, crypto trader Michaël Van de Poppe eyed increasing belief in a BTC price rebound among large-volume speculators.
“Speculators are net long on Bitcoin. Very similar to previous cases where we’ve seen the same before a big breakout in 2023,” he wrote in a post on X.

This article is produced in accordance with Cointelegraph’s Editorial Policy and is intended for informational purposes only. It does not constitute investment advice or recommendations. All investments and trades carry risk; readers are encouraged to conduct independent research before making any decisions. Cointelegraph makes no guarantees regarding the accuracy or completeness of the information presented, including forward-looking statements, and will not be liable for any loss or damage arising from reliance on this content.
TLDR:
- Nearly 38.9M ETH worth $85B is now staked, removing one in three tokens from open market circulation.
- Lido, Binance, Coinbase, and Kraken collectively control the bulk of all staked Ethereum holdings.
- ETH climbed from $2,050 to $2,260 in seven days, with buyers absorbing dips after the April 7 breakout.
- Reduced liquid supply means demand-driven price moves face less resistance and tend to extend further.
Ethereum staking milestone data shows that 31.29% of the total ETH supply is now locked across major staking platforms. Nearly 38.9 million ETH, valued at approximately $85 billion, has been committed by institutional and retail participants alike.
This marks a notable structural shift in how capital is engaging with the network. Rather than cycling through short-term trades, holders are locking funds for extended periods, collecting yield, and securing the Ethereum blockchain for the long term.
Institutional Capital and Staking Platforms Drive Ethereum’s Supply Contraction
Ethereum staking milestone figures confirm that roughly 38.9 million ETH is currently locked across staking platforms. That accounts for nearly one in every three ETH tokens removed from open market circulation.
At current valuations, this committed capital totals approximately $85 billion. This is not speculative money rotating through short-term positions.
Staking requires extended lock-up periods, delayed exits, and gradual reward accumulation. That structure attracts holders with longer time horizons rather than traders seeking quick returns.
The composition of staked ETH further sharpens this picture. Lido alone holds over 9 million ETH, while Binance, Coinbase, and Kraken account for substantial additional portions.
This reflects coordinated, yield-focused capital flowing through established infrastructure rather than scattered retail activity.
Platforms such as ether.fi are also redeploying staked ETH across emerging yield layers within the ecosystem. ETH is no longer sitting idle — it is working inside structured financial systems built on Ethereum.
This moves the asset from pure speculation toward active, yield-bearing participation. However, concentration among a handful of platforms raises governance considerations that the network will need to monitor closely over time.
ETH Price Action Mirrors the Conviction Reflected in Staking Data
Ethereum’s 7-day chart shows ETH climbing from roughly $2,050 to the $2,240–$2,260 range. A clear breakout occurred around April 7, after which prices held above $2,200 without any sharp retracement.
That resilience after the surge is notable on its own. Higher lows followed the breakout consistently, with dips toward $2,180 absorbed relatively quickly by buyers.
This points to a market where participants hold through short-term volatility rather than sell into strength. Staking yields appear to anchor behavior more than near-term price targets do.
Reduced circulating supply directly shapes these dynamics. When demand enters a market where a third of the supply is locked, upward moves face less resistance and extend further.
The absence of aggressive selling after the April 7 breakout reflects what stakeholder data already shows. Holders are not positioning to exit — they are building income streams while staying committed to the network.
TLDR:
- Private credit funds saw sharp redemption requests in Q1 2026, affecting every major fund segment
- Carlyle and Blue Owl funds reported high withdrawal demand, with strict caps limiting investor payouts
- Major firms imposed withdrawal limits to manage liquidity amid rising investor exit pressure
- Concerns over software borrowers and tighter lending standards drove increased redemption activity
Private credit markets faced rising redemption pressure in the first quarter of 2026, as investors accelerated withdrawals.
Several major funds limited withdrawals, reflecting growing strain across a market valued between $1.8 trillion and $2.0 trillion.
Redemption Pressure Builds Across Private Credit Funds
Recent data shared in a widely circulated market update on social media pointed to sharp increases in redemption requests across leading private credit funds. Carlyle’s $7 billion Tactical Private Credit Fund reported requests totaling 16% of its shares during the first quarter.
That figure placed Carlyle among the most affected funds, though it trailed two Blue Owl vehicles. Blue Owl Technology Income recorded redemption requests at 41%, while Blue Owl Credit Income reached 22%. These figures placed both funds at the top of the industry in terms of withdrawal demand.
Despite the surge, Carlyle fulfilled only a portion of investor requests. The fund capped withdrawals at 5%, which translated to roughly $240 million paid out. Investors had sought to redeem close to $750 million during the same period.
The update noted that such restrictions were not isolated. Other major firms, including Apollo, Ares, Morgan Stanley, and BlackRock, also introduced similar limits on withdrawals. These measures appeared across multiple private credit business development companies and interval funds.
At the same time, the broader industry experienced a uniform trend. Every private credit BDC and interval fund reported elevated redemption requests during the quarter. No fund segment avoided the wave of withdrawal activity.
Market Strains Linked to Borrower Risks and Lending Conditions
The same market update connected the surge in redemptions to growing concerns around borrower stability. In particular, attention centered on software companies that rely heavily on private credit financing. Investors expressed caution as artificial intelligence developments began to reshape the sector.
As a result, fears around potential disruption to software revenue models gained traction. This shift raised questions about the strength of loan portfolios tied to such borrowers. Consequently, investor sentiment turned more cautious across private credit allocations.
At the same time, lending conditions tightened across the market. Funds adopted stricter standards, which limited new credit issuance. This approach reflected efforts to manage risk exposure while addressing rising uncertainty in borrower performance.
The combination of redemption demand and tighter lending created additional pressure. Funds needed to balance liquidity management with maintaining portfolio stability. Withdrawal caps became a common response, allowing managers to control outflows.
Meanwhile, the broader private credit market faced conditions not seen before. The scale of redemption requests, combined with sector-specific concerns, contributed to heightened stress levels. Market participants continued to monitor developments closely as conditions evolved.
These dynamics placed private credit under sustained scrutiny during the opening months of 2026. Investors adjusted positions while fund managers implemented measures to manage liquidity and risk exposure within their portfolios.

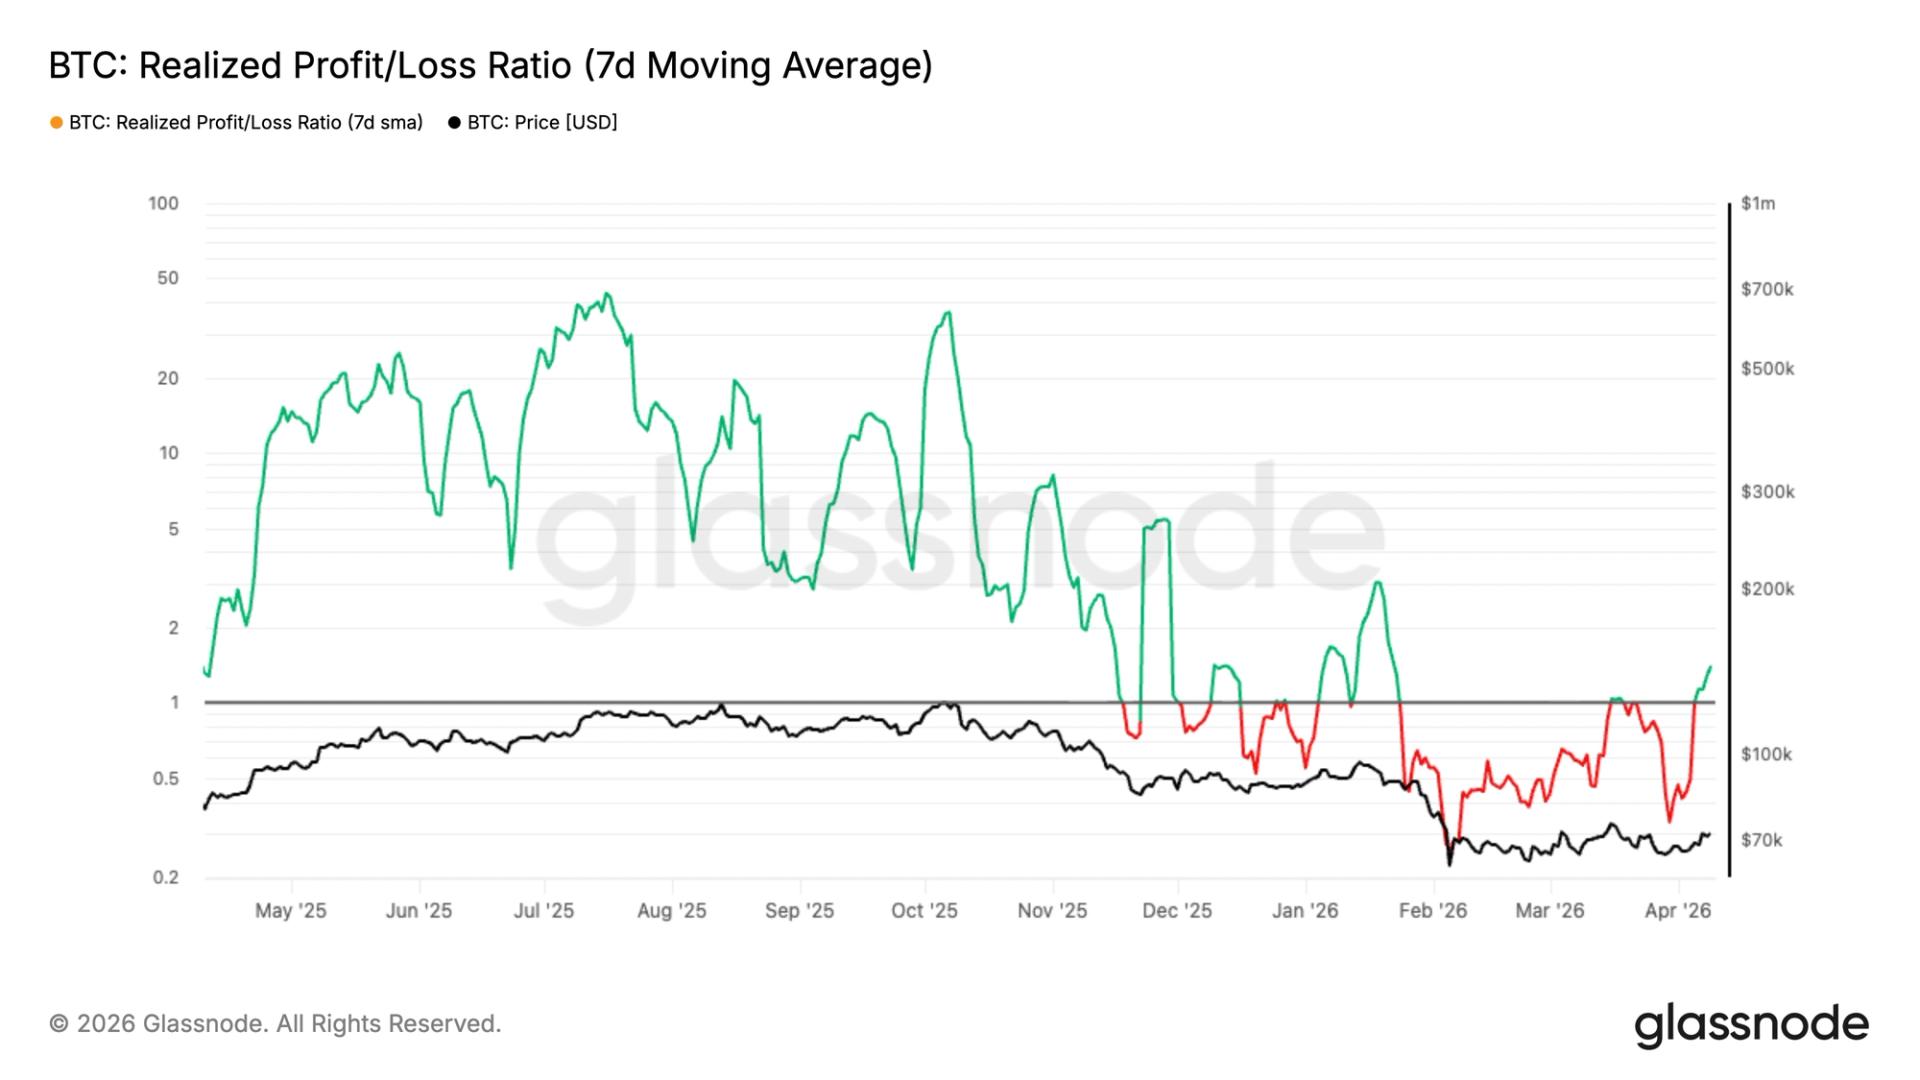
On-chain data points to easing selling pressure, with realized losses falling and spot markets shifting toward net buying.
TLDR:
- Kaspa trades near critical support as price compression signals a potential high volatility breakout soon
- Descending resistance continues to cap price while buyers defend the $0.033 support zone repeatedly
- A move above $0.05 could shift momentum and open upside toward $0.07 and higher resistance levels
- Failure to hold support may trigger a sharp drop toward the next demand zone near $0.025 levels
Kaspa’s daily price structure is approaching a critical moment as the price compresses near long-standing support. Market participants are closely watching whether the asset can reclaim higher levels or extend its broader downtrend after months of sustained selling pressure.
Kaspa Price Structure Signals Tight Compression
A recent tweet from market analyst JACKIS draws attention to Kaspa’s evolving chart structure across multiple phases.
The asset previously experienced a sharp rally, climbing from near $0.005 to above $0.20. That move formed a classic expansion phase, supported by higher highs and strong momentum.
However, price action later transitioned into a choppy range between $0.12 and $0.20. This phase showed repeated rejection near highs, suggesting weakening momentum. As a result, distribution likely took place before the market shifted direction.
Selling pressure then took control, forming a prolonged downtrend with consistent lower highs. The chart now shows a descending resistance trendline stretching from near $0.18 toward current levels around $0.04. At the same time, support has held near the $0.033 to $0.035 zone.
This structure resembles a descending triangle combined with a falling wedge. Such formations often appear during late-stage trends where price compresses tightly. As volatility decreases, the likelihood of a sharp move increases.
The analyst notes that Kaspa is now sitting directly on key structural support. Price has tested this level multiple times without a decisive breakdown. Even so, buyers have yet to produce a strong reversal move.
Breakout Conditions Define Near-Term Direction
The current setup places Kaspa at a decision point where both bullish and bearish scenarios remain possible. A move above the descending trendline near $0.045 to $0.05 would shift short-term momentum. That step could open the path toward reclaiming the $0.06 to $0.07 range.
If that level is recovered, price may continue toward $0.07 to $0.08 as the first resistance zone. Further strength could bring the $0.10 to $0.12 area back into focus. This region previously acted as support before turning into resistance.
On the other hand, failure to hold the $0.033 support level could trigger a sharp decline. The chart shows limited structure below this range, which may lead to faster price movement downward. The next demand zone is projected near $0.025 to $0.028.
The tweet also points to the absence of strong bullish momentum so far. While support has held, there has been no impulsive bounce to confirm accumulation. This keeps downside risk active as price remains compressed near the lower boundary.
At the same time, repeated tests of support suggest buyers are still present. Compression near key levels often leads to sudden expansion. The direction of that move depends on whether resistance breaks or support fails.
JACKIS suggests that a move above March highs could support a broader recovery during the second quarter. However, confirmation remains essential before any trend shift is established.
For now, Kaspa remains locked within a tightening structure. Market participants are watching closely for a breakout signal that defines the next phase.
TLDR:
- Binance nears $1T in spot volume, maintaining a clear lead over competitors like MEXC and Bybit in 2026.
- Perpetual futures volumes reach up to $24T, showing consistent growth across cycles and stronger market participation.
- Futures trading activity stands nearly four times larger than spot, driving liquidity and short-term price movement.
- Competing exchanges like OKX and Bybit show steady growth, though Binance still controls the largest share.
Binance continues to dominate global crypto trading activity in 2026, with cumulative volumes far ahead of competitors.
Data from CryptoQuant shows strong growth across both spot and perpetual futures markets, reinforcing Binance’s position despite rising competition from other major exchanges.
Spot Market Cycles Show Repeating Patterns
A recent tweet from CryptosRus points to Binance nearing $1 trillion in spot trading volume. This figure stands well above MEXC and Bybit, which trail at much lower levels. The data reflects a clear concentration of liquidity within one dominant platform.
The CryptoQuant chart shows spot trading volumes forming repeated cycles over time. Each cycle begins with steady accumulation, followed by a rapid upward surge. After reaching peak levels near $5–6 trillion, volumes reset sharply before starting a new phase.
This pattern suggests that spot trading activity responds strongly to market momentum. During bullish periods, participation rises quickly. However, once activity peaks, volumes drop as trading slows and positions are reduced.
Binance consistently accounts for the largest share across these cycles. Other exchanges such as OKX, Bybit, and Coinbase International, contribute smaller portions. Their presence grows gradually, yet they remain secondary in overall volume distribution.
At the same time, the structure of these cycles indicates that spot markets do not expand in a straight line. Instead, activity builds in waves, shaped by changing market conditions and trader behavior.
Futures Market Expansion Outpaces Spot Growth
While spot trading shows cyclical movement, perpetual futures markets display much larger scale and faster expansion. Binance has reached $4.5 trillion in cumulative perpetual futures volume, exceeding competitors by a wide margin.
The lower chart from CryptoQuant tracks several growth phases in futures trading. Early cycles peak near $8–10 trillion, while later cycles push toward $20–24 trillion. Each phase ends with a reset, similar to the spot market structure.
However, the overall trend shows increasing peak levels over time. This indicates that futures trading continues to expand with each cycle. As a result, derivatives now represent the dominant share of crypto market activity.
Binance remains the leading exchange in this segment as well. Still, OKX and Bybit show steady growth, gradually increasing their share of total futures volume. Coinbase International also appears in the data, though at a smaller scale.
The gap between spot and futures volumes remains wide. Futures trading reaches nearly four times the size of spot activity at peak levels. This difference points to a market where leverage and short-term positioning play a central role.
Moreover, the consistent rise in futures volumes suggests deeper participation from both retail and institutional traders. As trading strategies evolve, derivatives continue to attract more activity across multiple exchanges.
Overall, the data shows a market shaped by cycles, expanding participation, and strong exchange competition. Binance leads both segments by scale, while other platforms steadily build their presence in a growing trading environment.
TLDR:
- WLFI token dropped to new lows following plans to unlock tokens for early holders, raising supply concerns.
- The project is managing about $150M in stablecoin loans, increasing pressure on collateral stability.
- Reports claim billions in WLFI were used as collateral to borrow $75M within a concentrated liquidity setup.
- High pool utilization near 93% may limit withdrawals, raising concerns about liquidity access for users.
World Liberty Financial’s WLFI token has dropped to new lows amid concerns around liquidity use and governance decisions.
The decline follows reports of a planned token unlock for early holders while the project manages about $150 million in stablecoin loans.
WLFI Token Pressure Grows Amid Unlock Plans
A recent update shared on X by Coin Bureau stated that the WLFI token reached fresh lows. The drop came after the project signaled plans to unlock tokens for early holders. At the same time, it continues to defend a large stablecoin borrowing position.
The proposed unlock has raised concerns about added selling pressure. Early holders gaining access to tokens may increase circulating supply. As a result, market participants are closely watching price stability.
At the same time, the project is managing around $150 million in stablecoin loans. This creates a balancing act between maintaining collateral value and handling liquidity needs. If token prices weaken further, the position could face added stress.
The timing of the unlock proposal has drawn attention. Market conditions remain fragile, and liquidity levels appear tight. This combination has kept traders cautious as the situation develops.
Lending Activity and Liquidity Concerns Surface
Additional discussion emerged from a widely shared thread by StarPlatinum. The post described how billions of WLFI tokens were reportedly used as collateral. Around $75 million in stablecoins was borrowed through a lending protocol.
The thread claimed that WLFI accounts for about 55% of the protocol’s liquidity. This concentration raises concerns about how withdrawals may function under pressure. With nearly 93% of the stablecoin pool already utilized, available liquidity appears limited.
The structure described suggests a closed system. Tokens are deposited, borrowed against, and supported within the same ecosystem. As long as token prices hold, positions remain stable. However, any sharp decline could strain the setup.
The thread also noted links between the lending platform and individuals connected to WLFI. This has raised questions about the relationship between borrowers and infrastructure. While no formal violations were confirmed, the overlap has drawn attention.
Further attention focused on reported fund movements. Over $40 million was said to have moved to Coinbase Prime shortly before a major announcement. The timing has led to speculation, though the team has denied wrongdoing.
These developments come as liquidity conditions tighten. Retail users may face delays if withdrawal demand rises. With most funds already deployed, flexibility within the system appears limited.
Market participants continue to monitor both price action and protocol health. The combination of token unlock plans and lending exposure remains a key focus. Any changes in collateral value or liquidity could influence the next phase.
For now, the WLFI token remains under pressure. Traders are assessing risk levels while waiting for further clarity from the project. The coming updates may shape how the market responds in the short term.

Bitcoin: This Is What Matters Today
Britain’s Got Talent viewers say late magician ‘would be proud’ as performer has famous uncle
Is Strategy About to Hold More Bitcoin Than BlackRock’s IBIT Fund?


-

 Business6 days ago
Three Gulf funds agree to back Paramount’s $81 billion takeover of Warner, WSJ reports
-

 Sports7 days ago
India men’s 4x400m and mixed 4x100m relay teams register big progress | Other Sports News
-

 Politics1 day ago
US brings back mandatory military draft registration
-

 Fashion1 day ago
Weekend Open Thread: Veronica Beard
-

 Tech4 days ago
How Long Can You Drive With Expired Registration? What Florida Law Says
-

 Business6 days ago
No Jackpot Winner, Prize to Climb to $231 Million
-

 Fashion5 days ago
Massimo Dutti Offers Inspiration for Your Summer Mood Board
-
 Sports1 day ago
Man United discover Nico Schlotterbeck transfer fee as defender reaches Dortmund agreement
-

 Fashion4 days ago
Let’s Discuss: DEI in 2026
-

 Crypto World3 days ago
Bitcoin recovers as US and Iran Agree a Ceasefire Deal
-

 Crypto World2 days ago
Canary Capital Files SEC Registration for PEPE ETF
-

 Politics2 days ago
Malcolm In The Middle OG Turned Down ‘Buckets Of Money’ To Appear In Reboot
-

 Business22 hours ago
Tesla Model Y Tops China Auto Sales in March 2026 With 39,827 Registrations, Beating Cheaper EVs and Gas Cars
-

 Business7 days ago
Akebia Therapeutics, Inc. (AKBA) Discusses Pipeline Progress and Strategic Focus on Kidney Disease Treatments at R&D Day – Slideshow
-

 Business1 day ago
OpenAI Halts Stargate UK Data Centre Project Over Energy Costs and Copyright Row
-

 Tech5 days ago
Haier is betting big that your next TV purchase will be one of these
-

 Tech5 days ago
Gamer Restores the Original PlayStation Portal From Two Decades Ago
-

 Business3 hours ago
Ireland Fuel Protests Enter Day 5 as Blockades Spark Shortages and Government Prepares Support Package
-

 Tech5 days ago
The Xiaomi 17 Ultra has some impressive add-ons that make snapping photos really fun
-

 Tech5 days ago
Samsung just gave up on its own Messages app
You must be logged in to post a comment Login