
Crypto World
XRP Price Analysis Reveals Why the 30% Bounce Failed
The XRP price rebounded more than 30% after bouncing from its early February low near $1.12. The move revived hopes of a recovery and briefly pushed the token toward the $1.50 zone. On the surface, the rally looked constructive. Momentum indicators improved. A breakout pattern began to form. Traders started discussing a possible trend reversal.
But blockchain data tells a different story. Instead of showing strong accumulation, on-chain metrics suggest that many holders used the rebound to exit losing positions. Selling at a loss remains dominant. Several groups are still reducing exposure. This raises a key question: was the bounce genuine demand, or simply exit liquidity for trapped sellers?
Technical Setup Shows Bounce Potential, But It Needs Confirmation
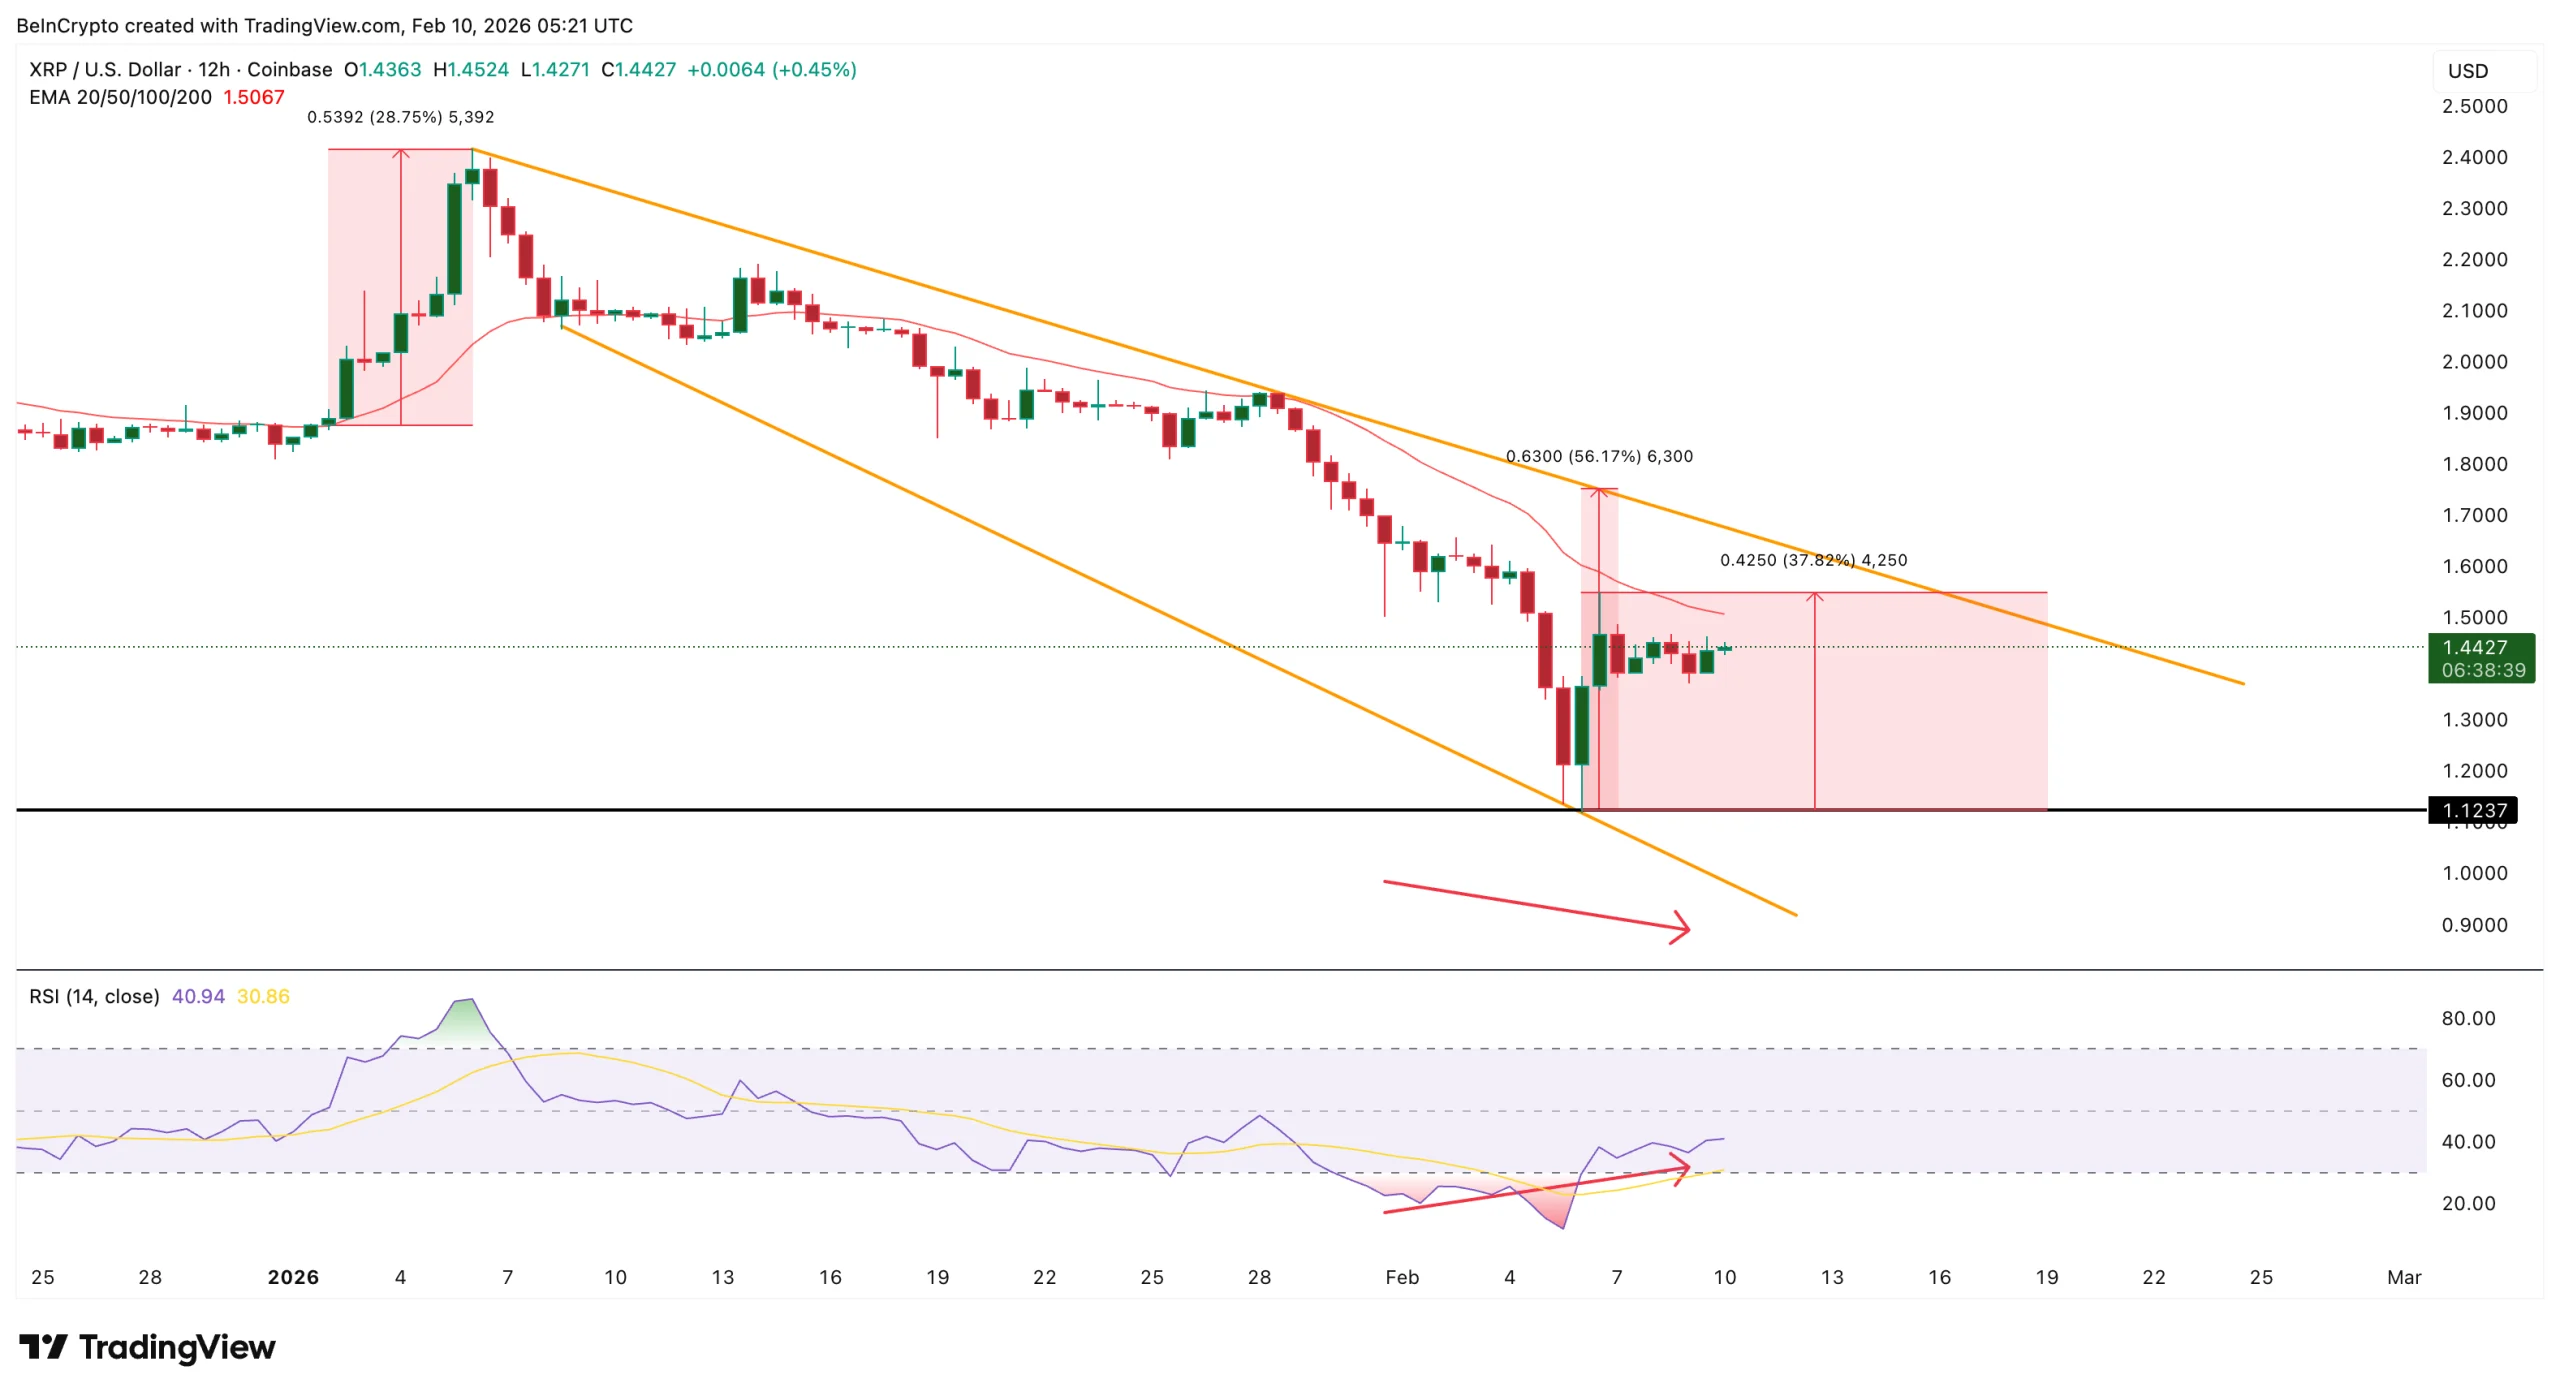
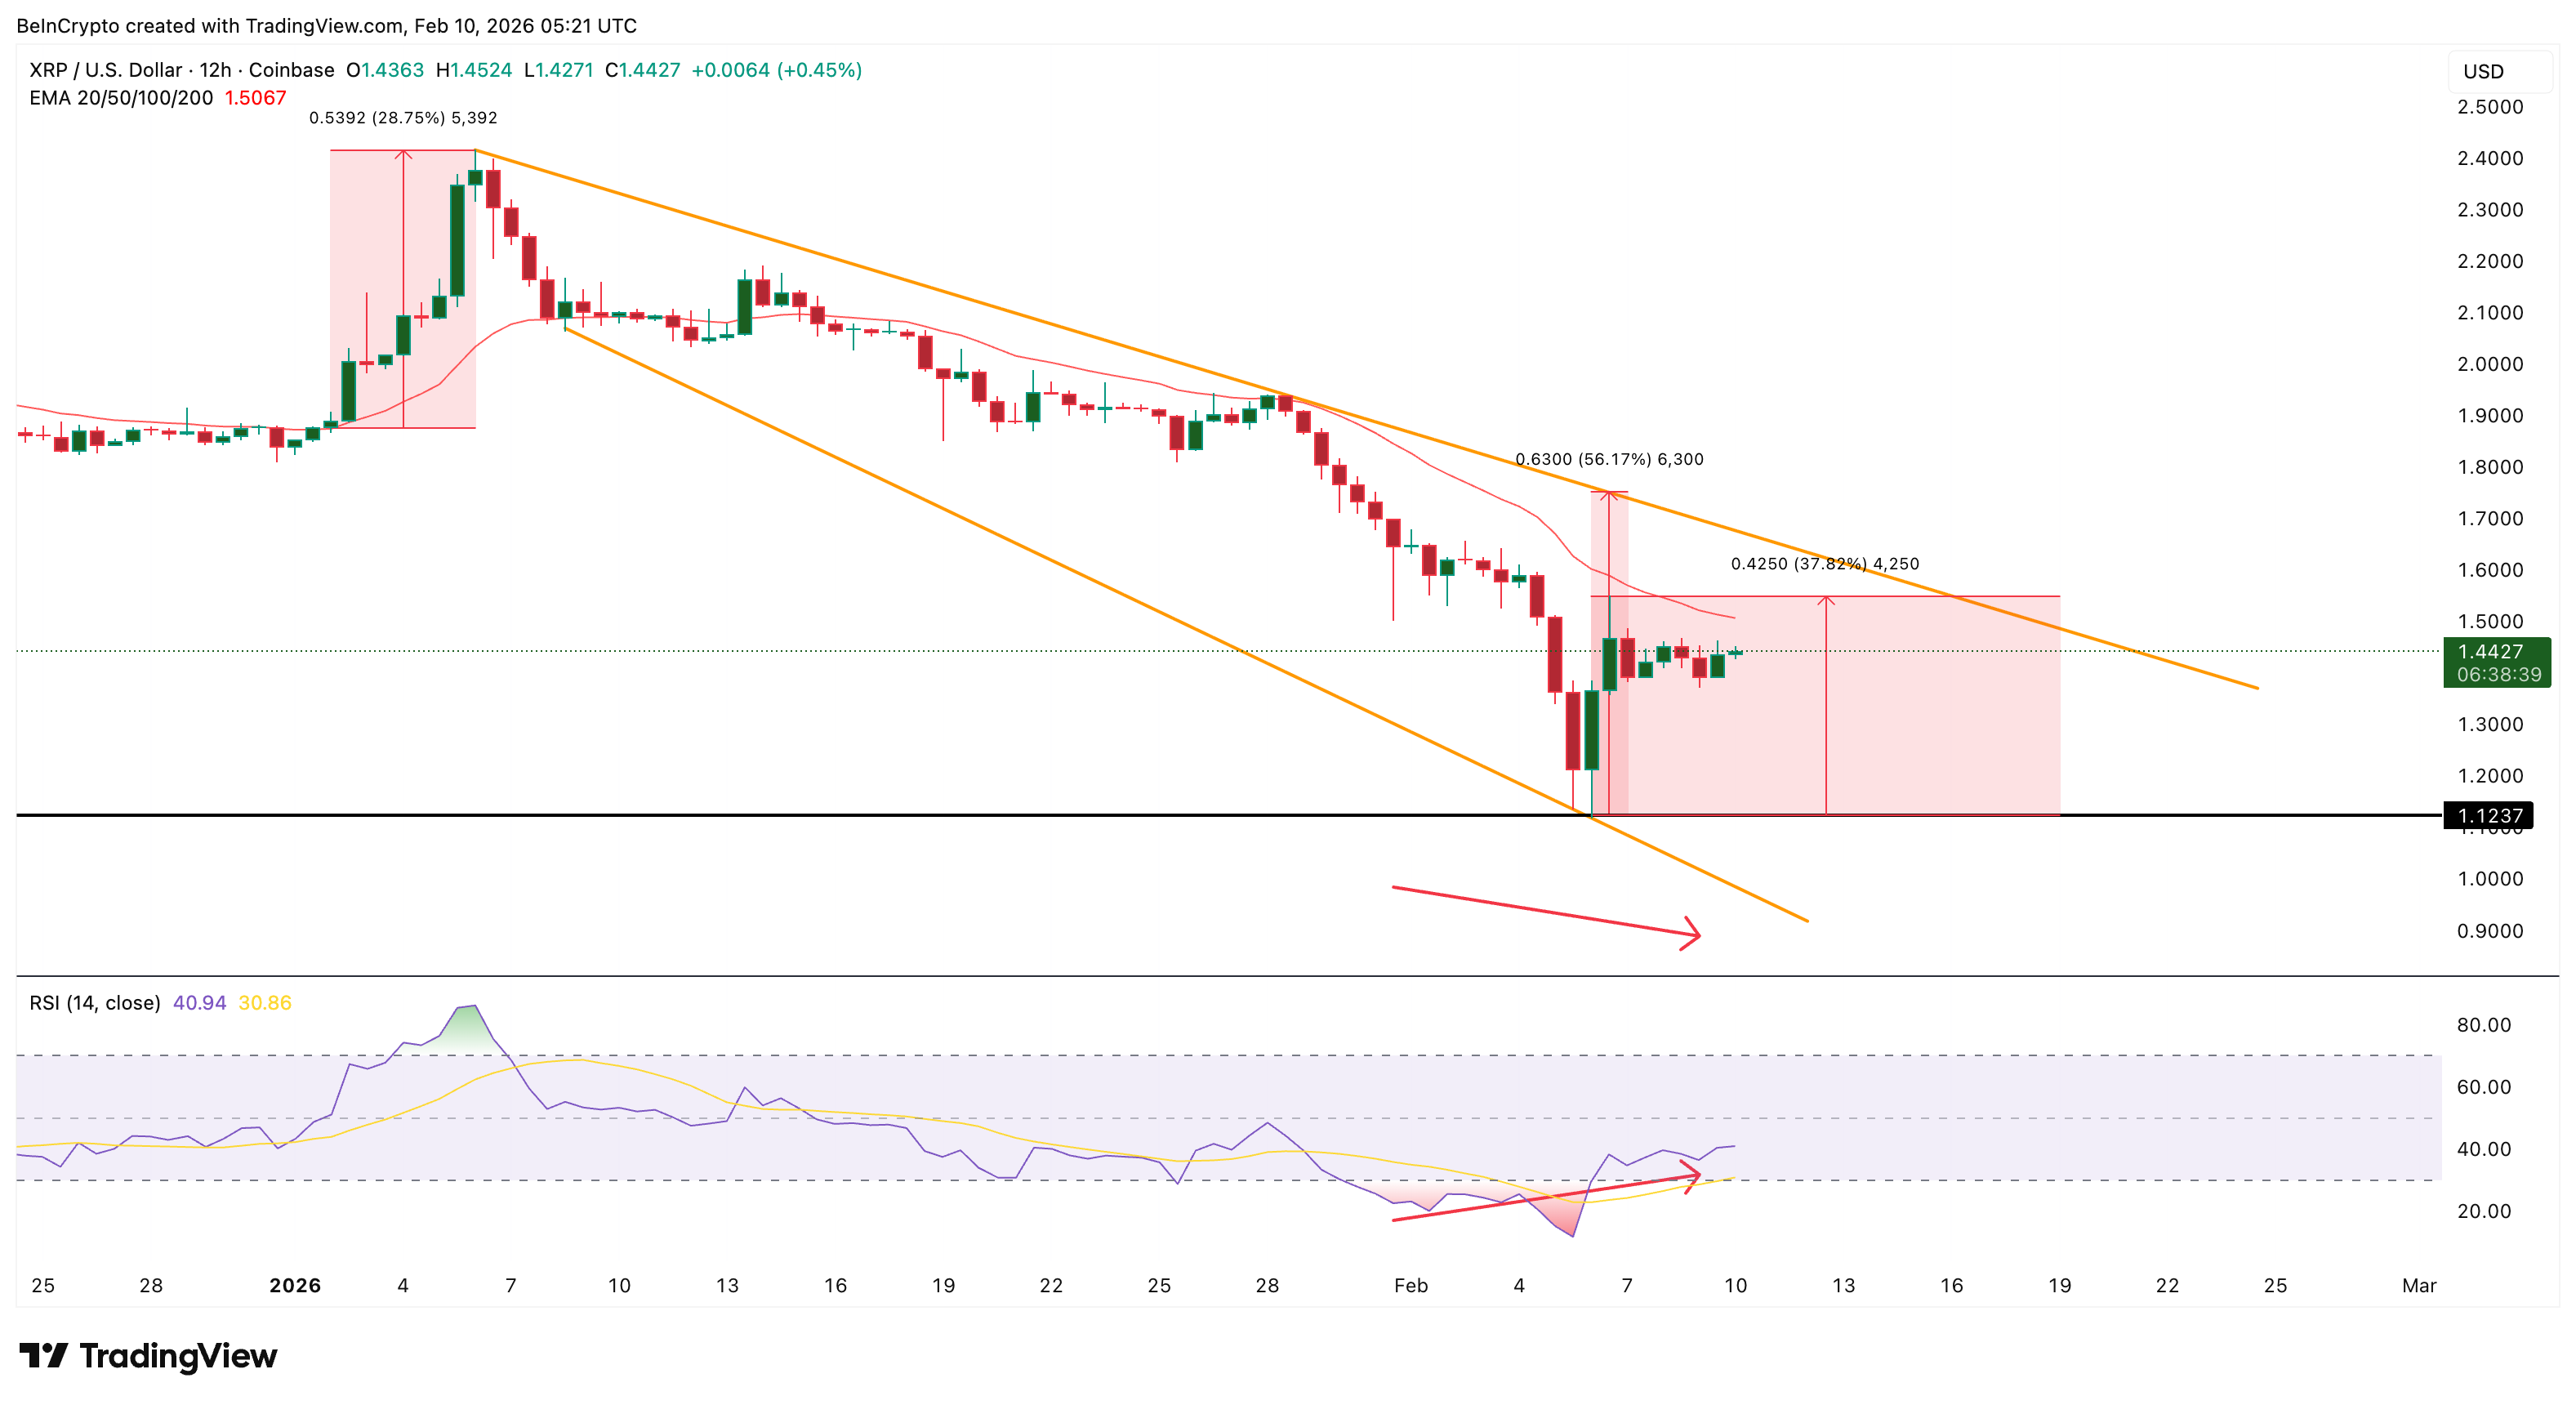
On the 12-hour chart, XRP is trading inside a falling wedge pattern, with a 56% breakout potential above the upper trendline.
Sponsored
Sponsored
For this pattern to activate, XRP needs to first reclaim its short-term moving average, the 20-period exponential moving average (EMA), which gives more weight to recent prices. This level acts as dynamic resistance in downtrends. In early January, a clean break above this EMA triggered a rally of nearly 30%.
Momentum is also showing early improvement.
Between January 31 and February 9, XRP printed a lower low in price. At the same time, the Relative Strength Index (RSI), a momentum indicator that measures buying and selling pressure, formed a higher low. This bullish divergence suggests that sellers are losing strength.
Want more token insights like this? Sign up for Editor Harsh Notariya’s Daily Crypto Newsletter here.
On its own, this setup points to a possible bounce.
But technical patterns only work when holders are willing to stay invested. To understand whether this bounce has real support, we need to look at how investors are behaving on-chain.
SOPR Shows Holders Are Still Selling at Losses Despite the Bounce
One of the clearest warning signals comes from the Spent Output Profit Ratio, or SOPR. SOPR measures whether coins being moved on-chain are sold in profit or at a loss. When it stays above 1, it shows profit-taking. When it remains below 1, it shows loss-selling.
Since late January, XRP’s SOPR has remained below 1 for more than ten consecutive days.
Sponsored
Sponsored
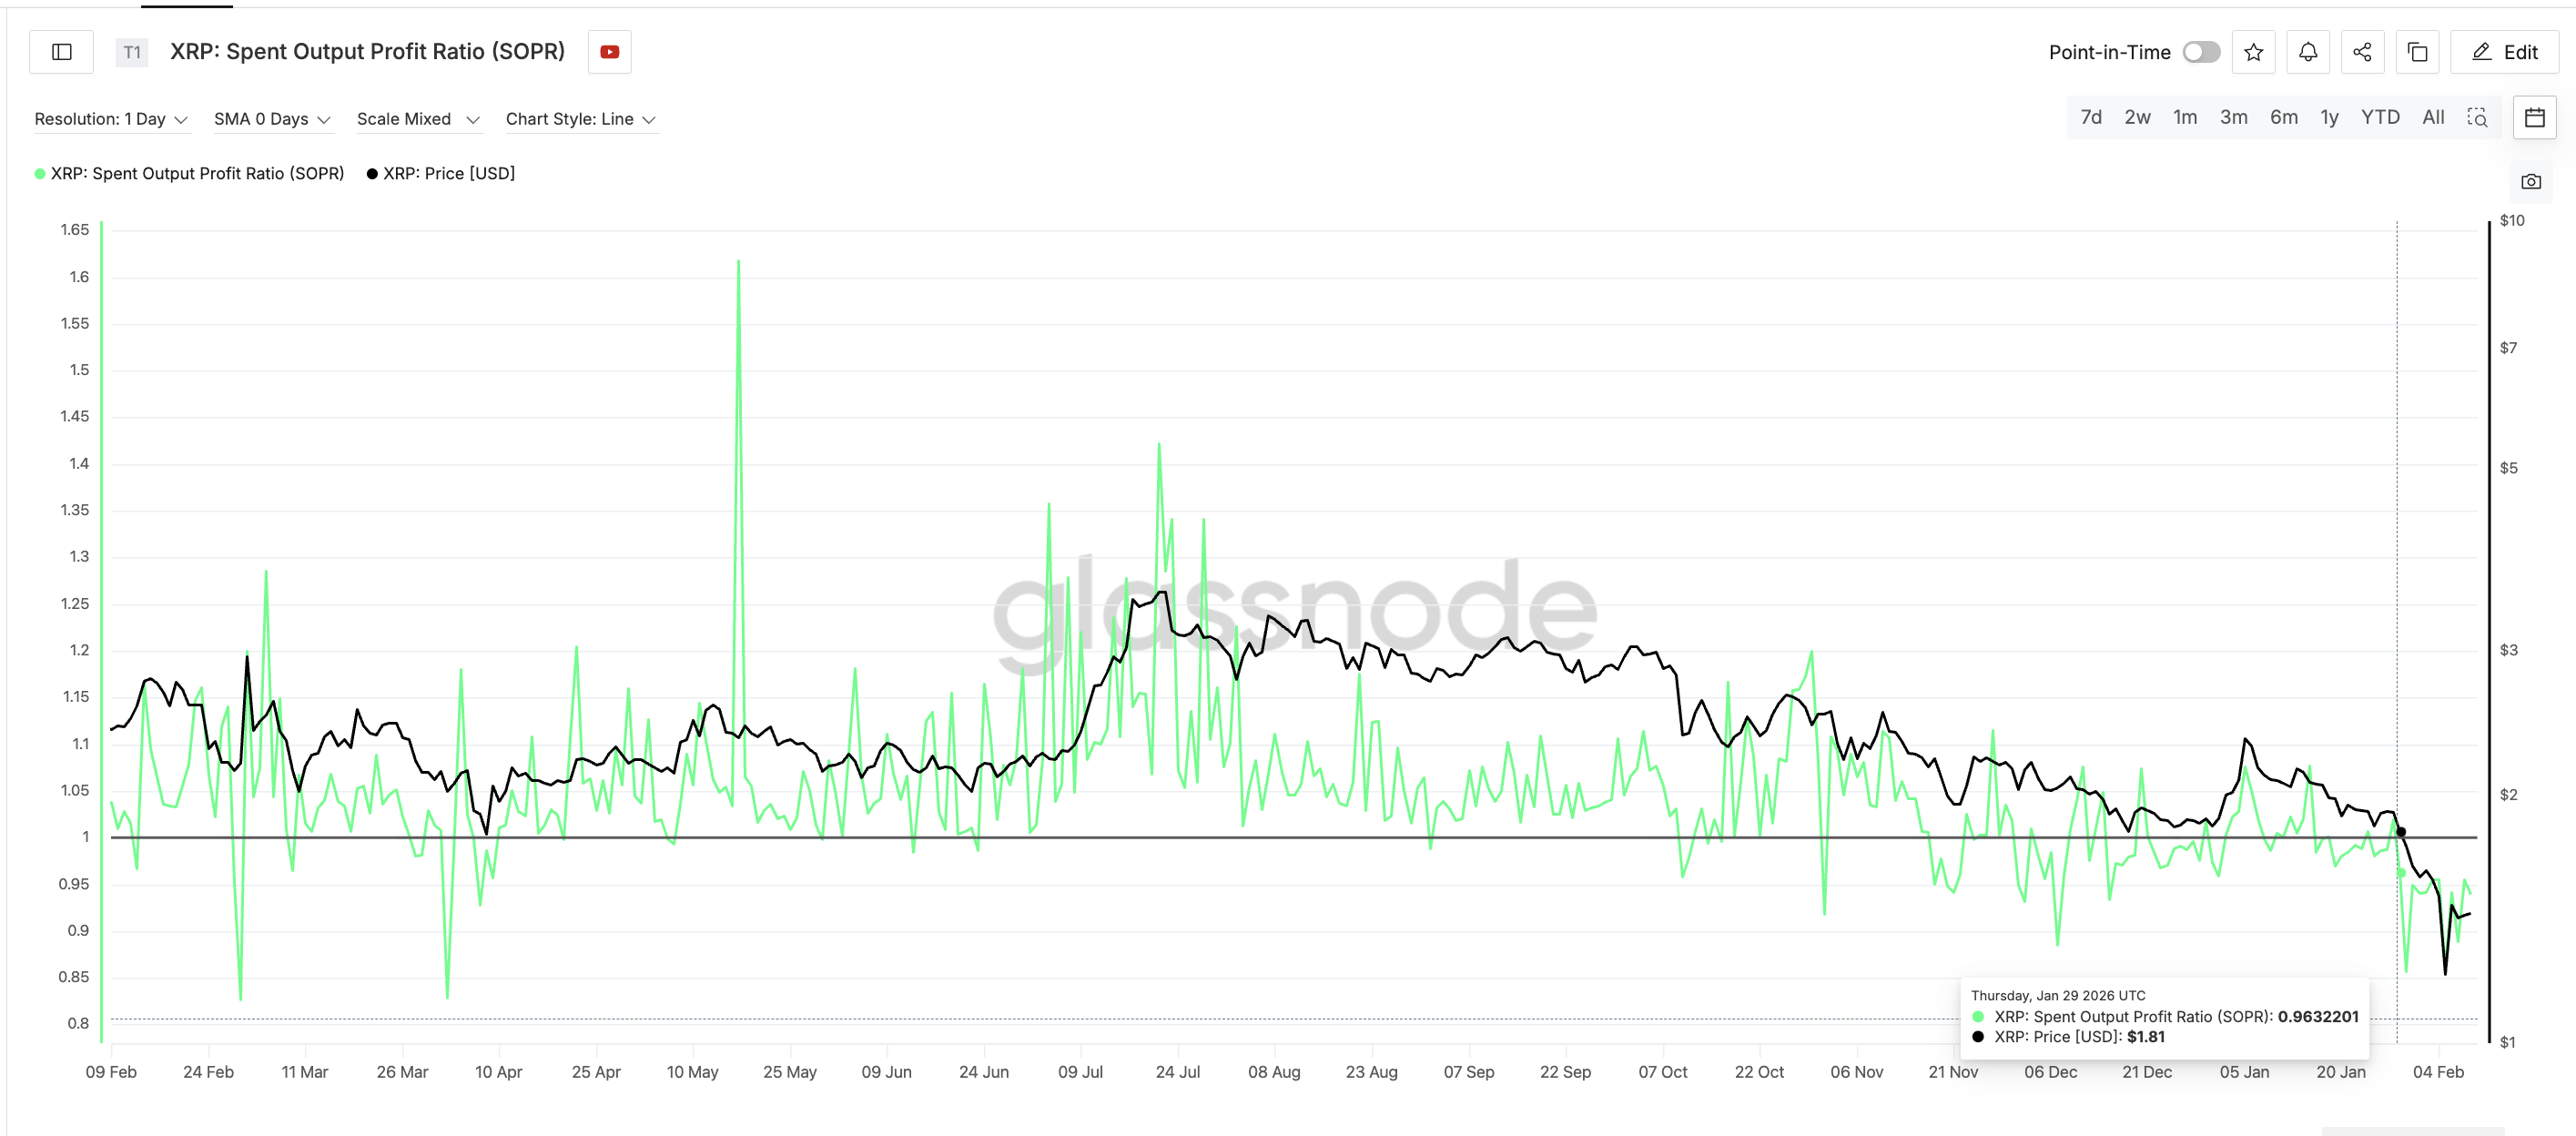
This is unusual. After a 30%+ rebound, short-term traders are normally sitting in profit. That usually pushes SOPR higher. But in XRP’s case, profitability never returned. Loss selling continued even as the price recovered. This means many holders are still exiting underwater positions.
In simple terms, the market is not seeing confident profit-taking. It is seeing stress-driven exits. To understand who is responsible, we need to look at holder cohorts.
Holder Data Confirms the XRP Bounce Is Being Used to Exit, Not Accumulate
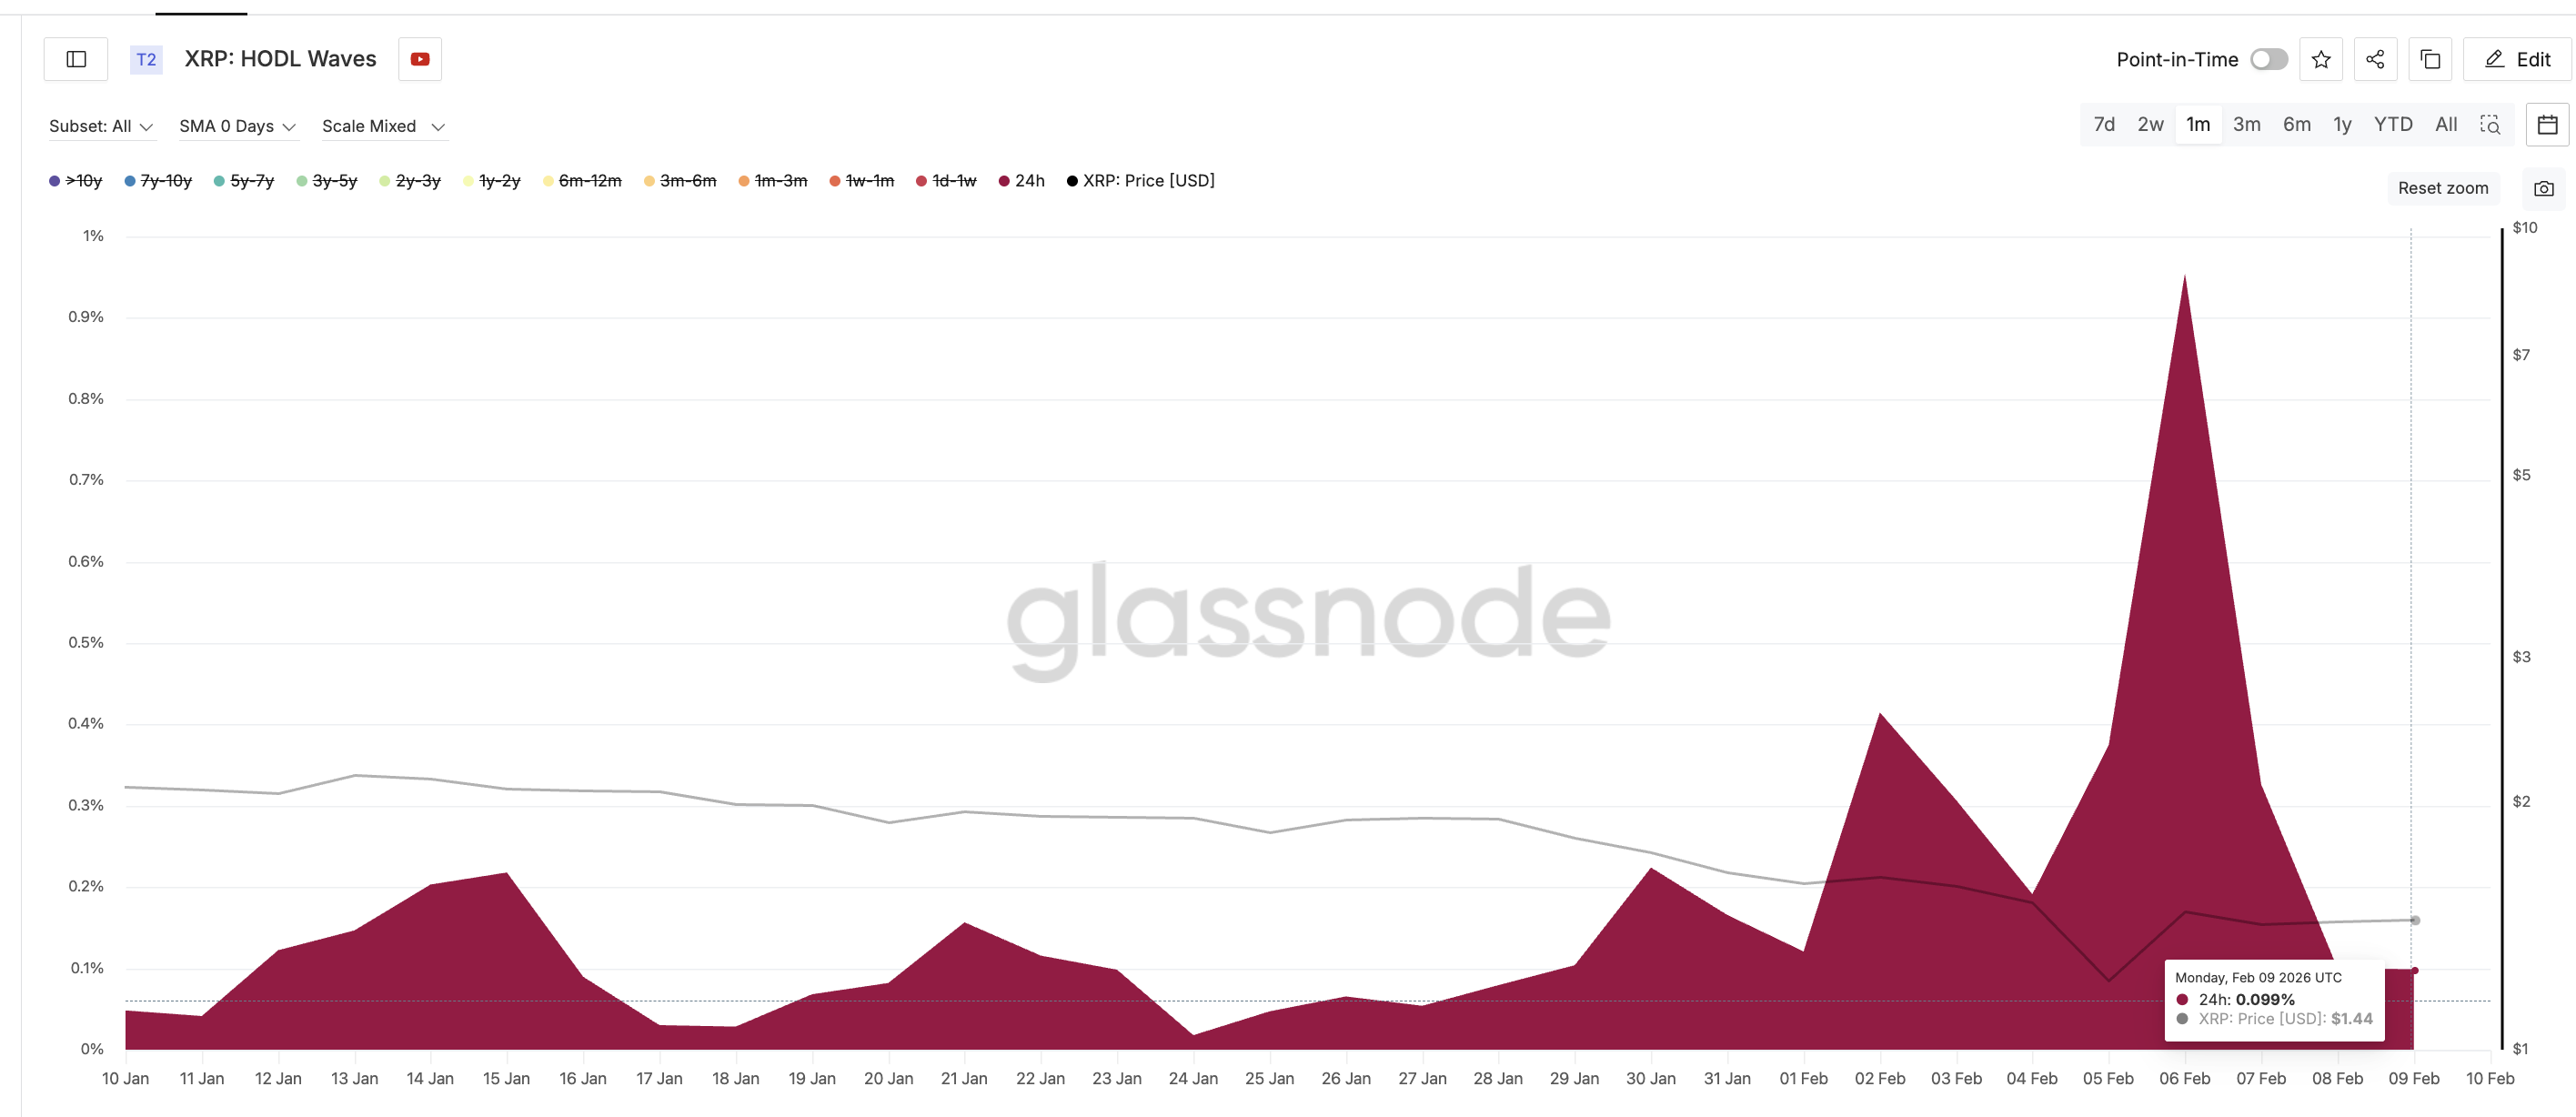
HODL Waves group XRP wallets based on how long they have held their coins. This helps identify which investor groups are buying or selling.
The most striking shift appeared in the 24-hour holder cohort.
On February 6, this group controlled about 1% of XRP’s circulating supply. Within days, that share collapsed to roughly 0.09%. That represents a decline of more than 90%.
Sponsored
Sponsored
These were highly reactive traders who entered during volatility and rushed to exit during the rebound.
Selling was not limited to this group.
The 1-month to 3-month cohort, which accumulated heavily in January when XRP traded near $2.07, has also been reducing exposure. Their share of supply fell from around 14.48% in mid-January to about 9.48% recently. That is a decline of roughly 35%.
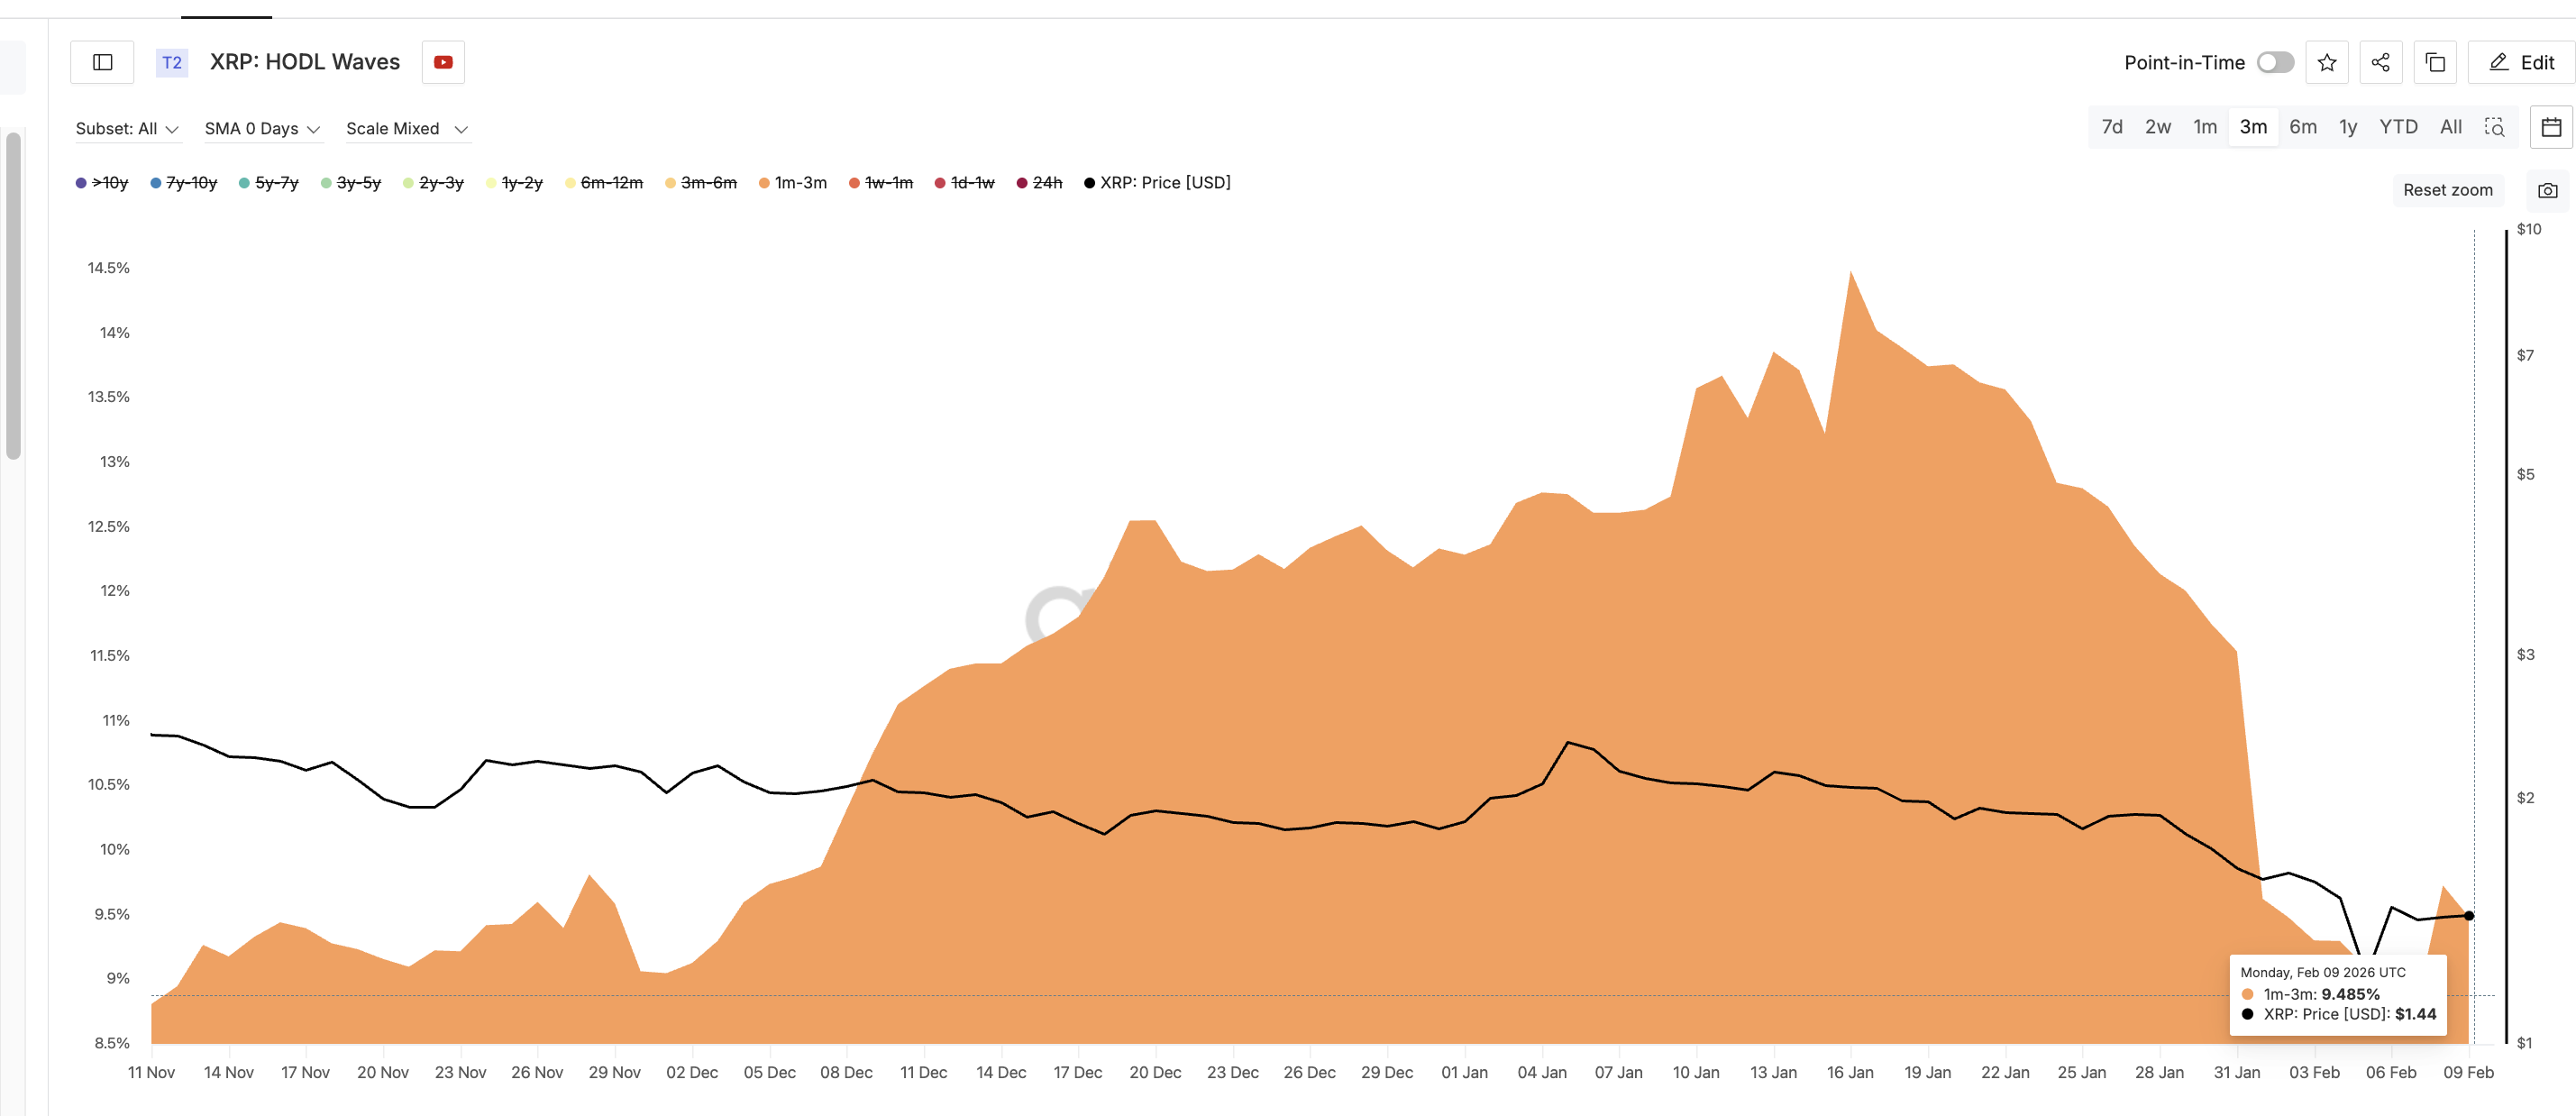
These holders remain underwater. Instead of waiting for a full recovery, they are using rallies to minimize losses. Together, these two cohorts explain why SOPR has remained depressed for a long time now.
Short-term traders are exiting failed trades. Medium-term holders are cutting losing positions.
This behavior is typical of distribution phases, not early bull markets. And it directly impacts price structure.
Sponsored
Sponsored
Cost Basis Data Shows Why $1.44–$1.54 Is a Wall for the XRP Price
Cost basis heat maps show where large groups of investors bought their coins. These zones often become resistance when the price returns to them.
For XRP, the strongest near-term cluster sits between $1.42 and $1.44. More than 660 million XRP were accumulated in this range. This creates a powerful sell zone.
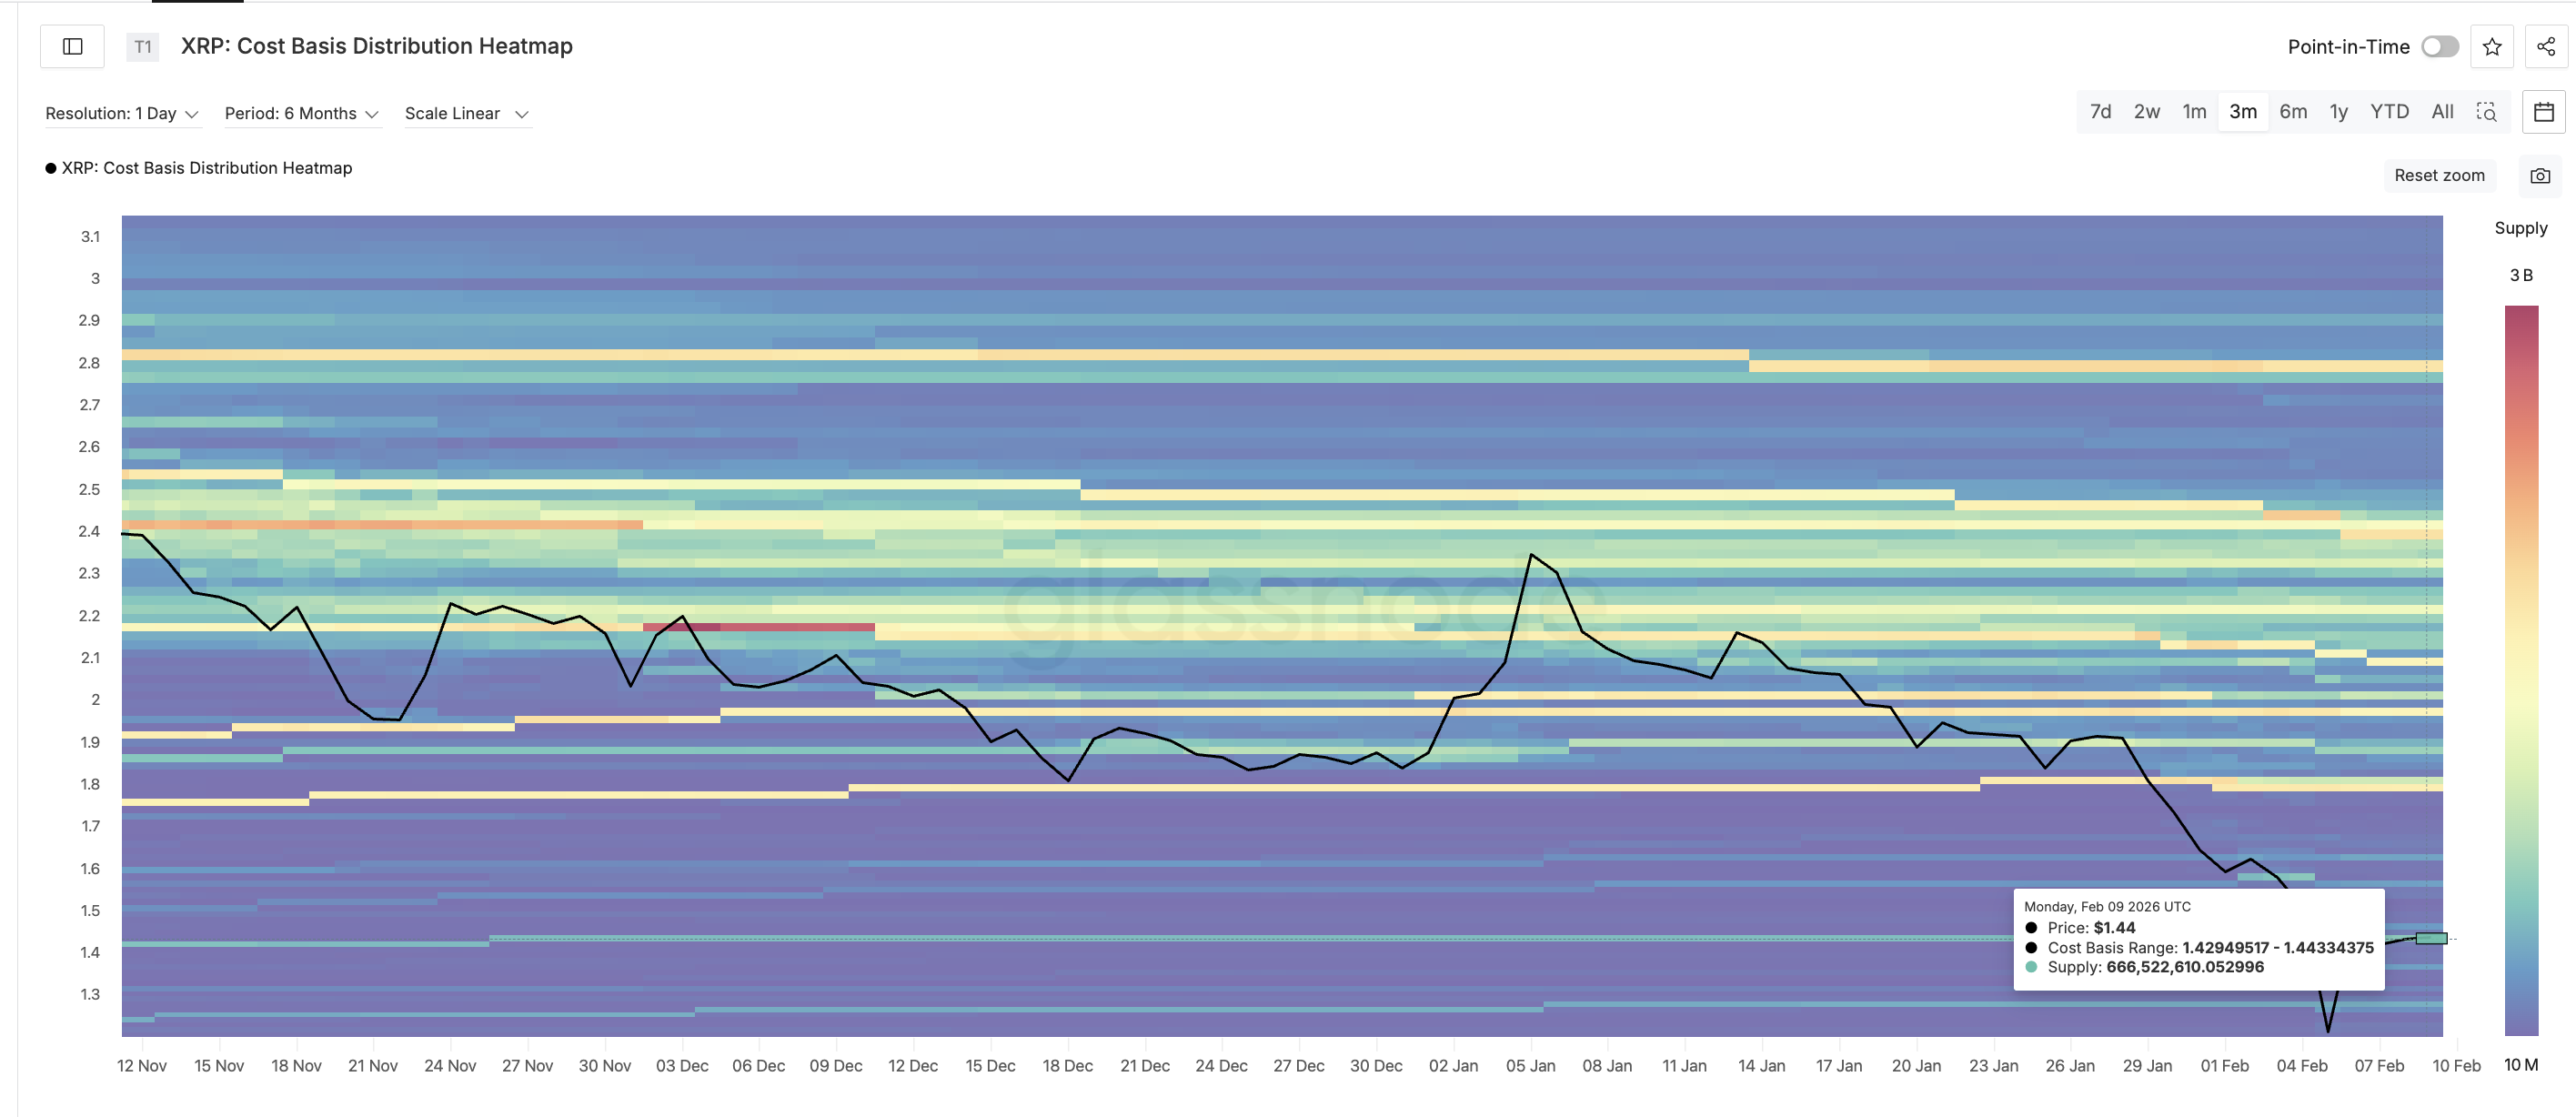
When the price approaches this area, many holders reach break-even. After weeks of losses, they chose to exit.
Above this cluster lies the $1.54 level, which aligns with EMA resistance. Together, these zones form a barrier that XRP has repeatedly failed to clear. Each time the XRP price rallies into this region, selling intensifies. This is consistent with the distribution seen in SOPR and HODL Waves.
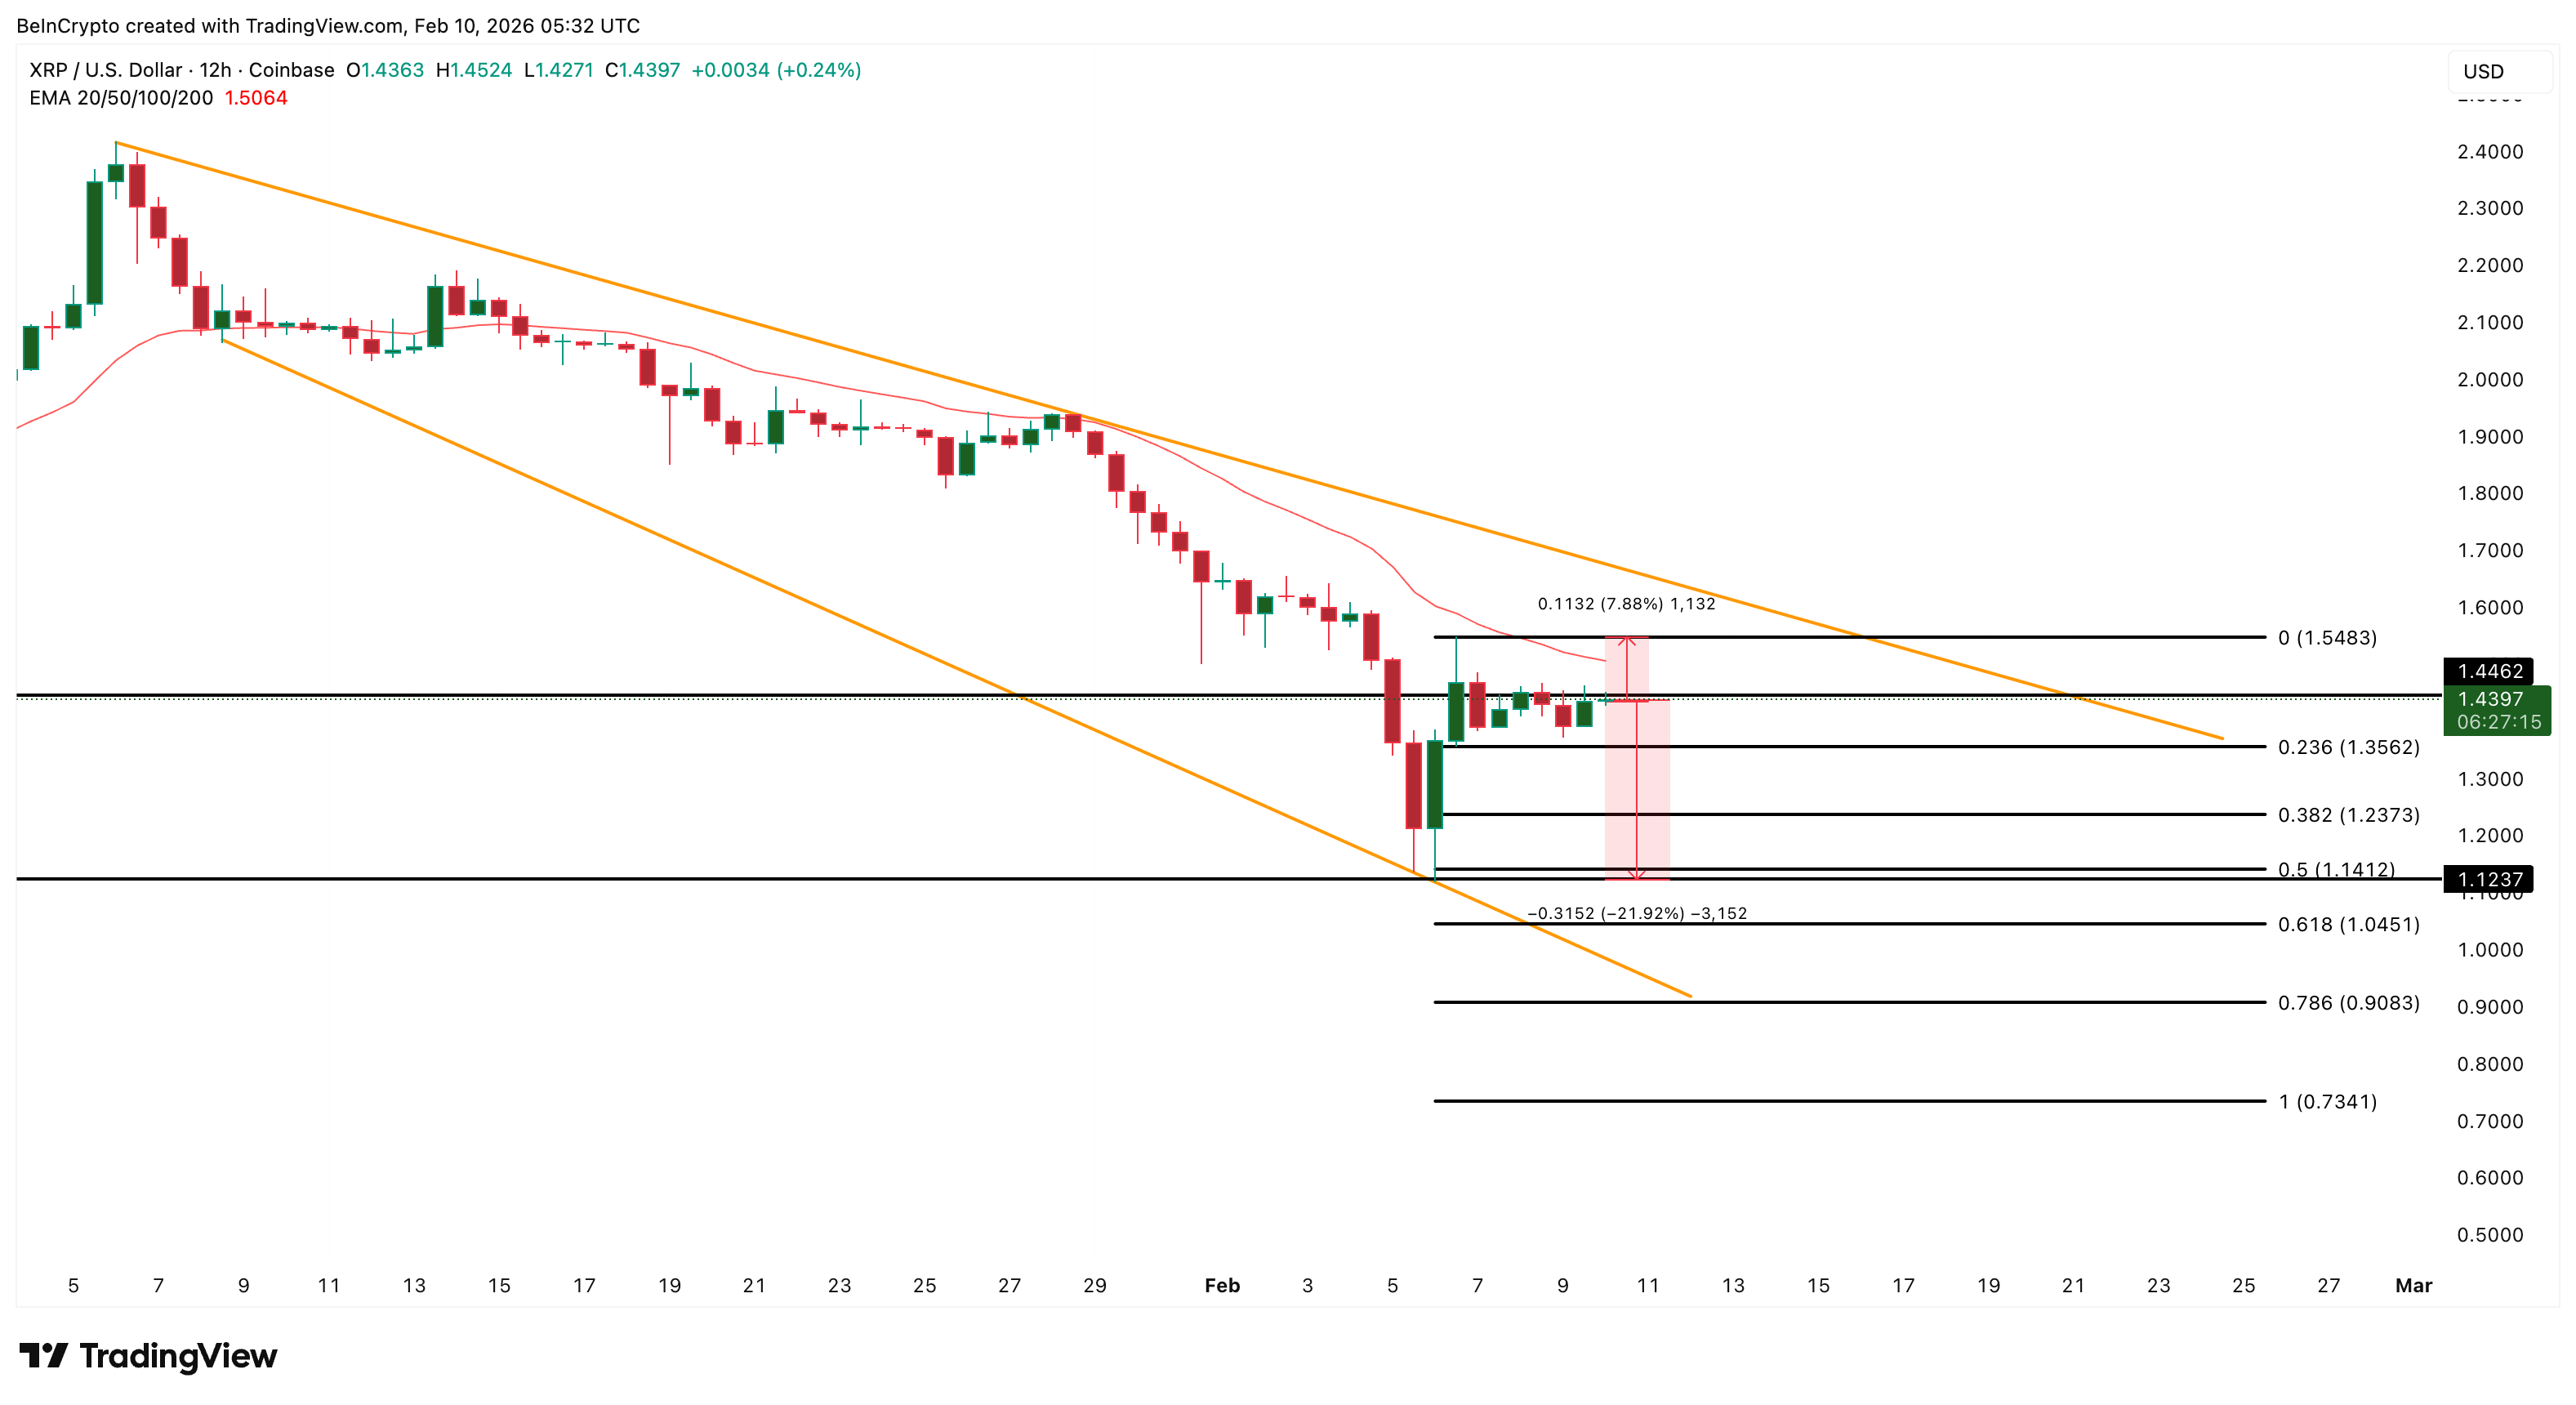
If XRP fails again near $1.44, downside risk increases. A rejection could send the price back toward $1.23 and possibly $1.12, the recent low. That would represent a decline of more than 20% from current levels.
Only a sustained break above $1.54, supported by improving profitability and reduced selling, would change this XRP price structure.


Announced at EthCC in Cannes, the upgrade enables institution-specific borrowing environments, structured credit products, and RWA-backed lending within a unified liquidity system.
Crypto World
Australia passes crypto regulation requiring exchanges to obtain financial services licenses
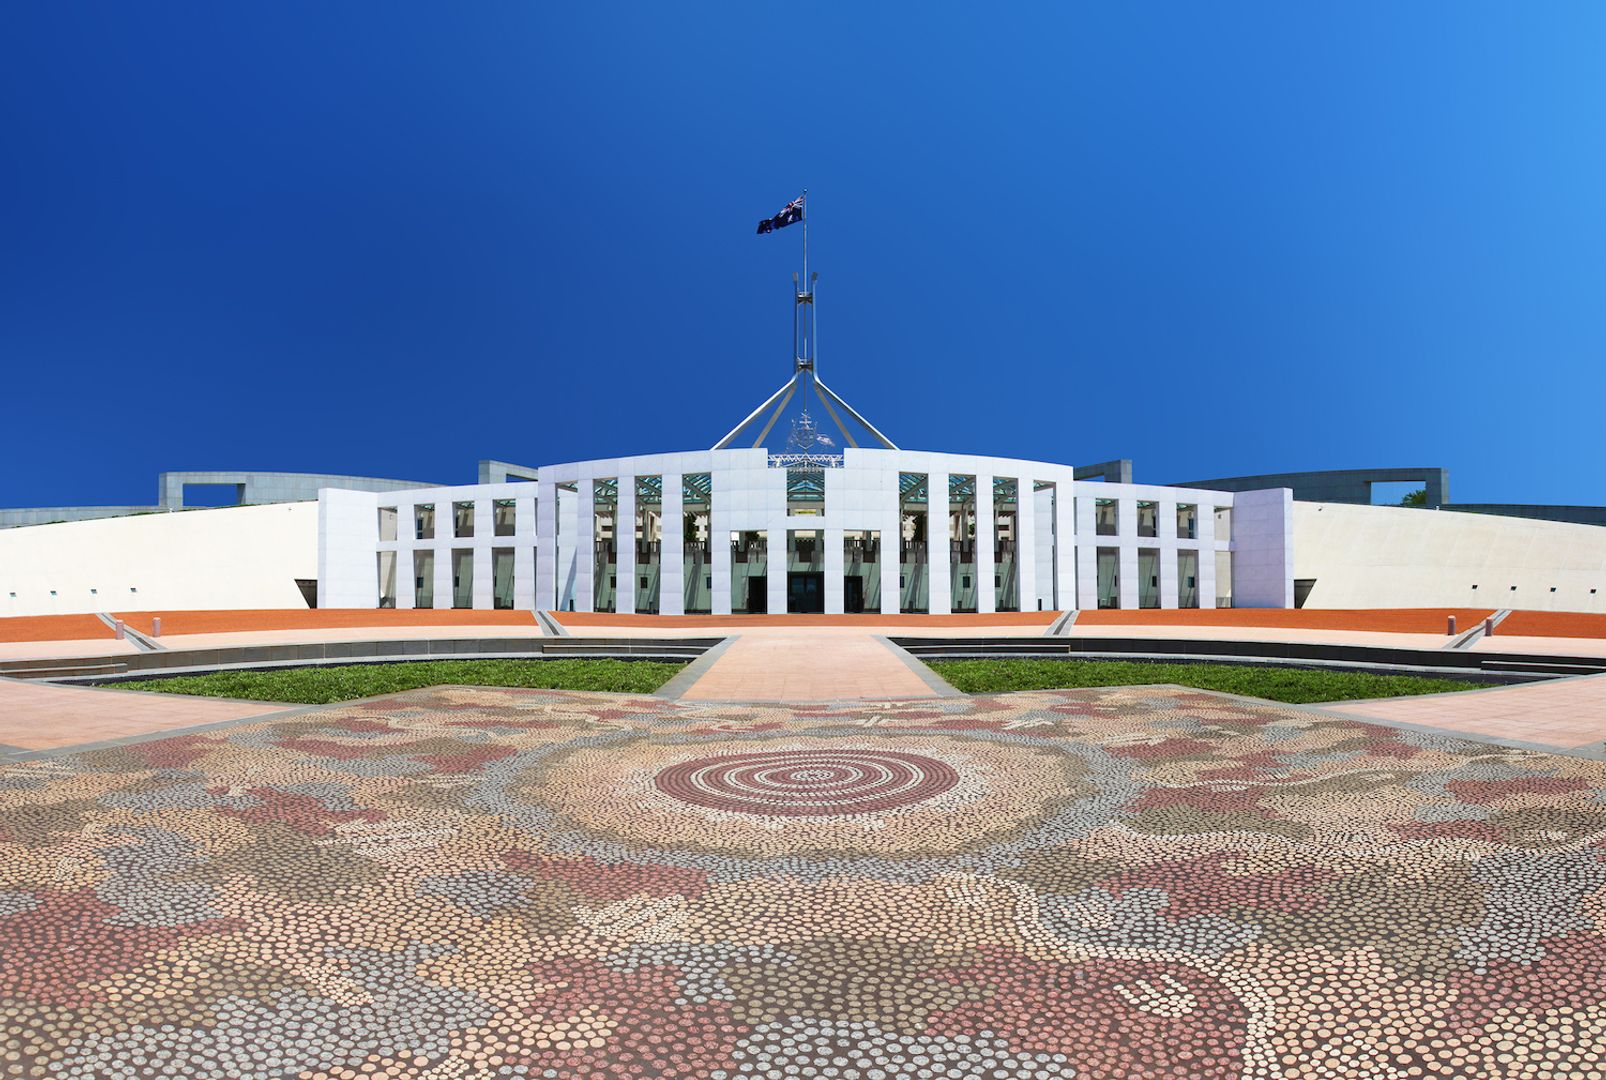

Australia passed legislation on Wednesday, creating its first comprehensive regulatory framework for digital assets that requires crypto exchanges and custody providers to obtain financial services licenses.
The Corporations Amendment (Digital Assets Framework) Bill 2025 cleared both houses on April 1, bringing firms that hold digital assets on behalf of customers into the existing Australian Financial Services Licence regime.
Australia’s bill creates two new regulated categories under the Corporations Act: digital asset platforms, which hold crypto on behalf of users, and tokenized custody platforms, which hold real-world assets and issue a corresponding digital token.
Operators of both must obtain an Australian Financial Services License from ASIC, bringing them under the same core rules as brokers or fund managers, including requirements to safeguard client assets, provide standardized disclosures, avoid misleading conduct, and maintain dispute resolution and compensation systems.
Instead of regulating crypto itself, the law targets the companies in the middle that control customer funds, aiming to reduce risks like commingling, insolvency, and misuse of assets that have caused losses in past crypto failures.
Research from the Digital Finance Cooperative Research Center and industry groups estimates Australia could generate as much as A$24 billion annually from tokenized markets, payments, and digital assets, roughly 1% of GDP. Under the previous regulatory path, the country was on track to capture just A$1 Billion of that by 2030.
A Kraken spokesperson said the law provides a “top-down signal” that Australia is serious about digital assets, adding that clearer rules would give firms confidence to invest and expand locally.
Kate Cooper, CEO of OKX Australia and co-chair of the Digital Economy Council of Australia, called the bill a “pivotal moment,” saying it establishes a foundation for institutional participation and long-term capital allocation.
Almonty’s tungsten mine in Sangdong, South Korea, in March 2026.
Almonty
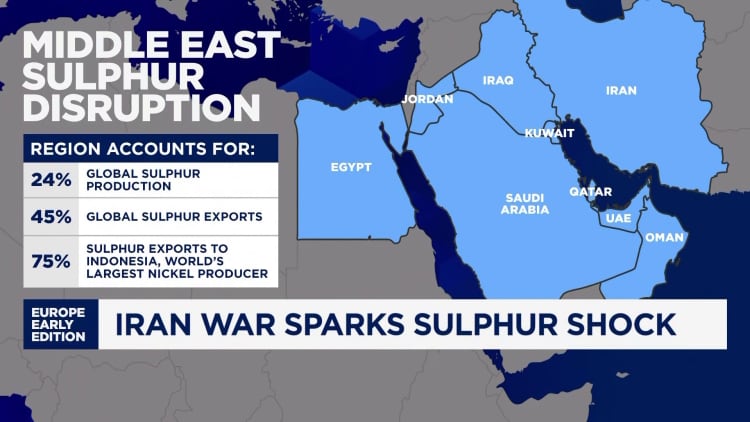
BEIJING — The Iran war is squeezing a global commodities market already pressured by China’s export controls and stockpiling efforts.
Prices of three niche elements — tungsten, sulfur and helium — have climbed sharply in recent weeks.
While none of the commodities are traded as widely as oil, the surge indicates how ripple effects from the Middle East conflict could end up restricting production of the semiconductors that power artificial intelligence advances.
Tungsten, a metal nearly as hard as a diamond, creates the electrical connection in the core of a semiconductor chip. Sulfuric acid, a byproduct of sulfur, cleans chip wafers. Helium enables smooth production of semiconductors since the gas prevents unwanted chemical reactions in the manufacturing process.
Those are just some of the ways in which the three elements have become critical for modern manufacturing, including for defense.
Beijing started to ramp up its control over the critical supplies even before the Iran war started on Feb. 28, partly as tensions with the U.S. escalated over the last few years.
China started restricting tungsten exports just over a year ago, and in December called for tighter limits on sulfuric acid exports. Helium, a gas that’s difficult to store, saw the volume of Chinese imports rise by 15.7% in 2025, after a nearly 65% surge in 2024, according to Wind Information.
The Iran war and the ensuing constraints on the Strait of Hormuz, a critical Middle East shipping route for energy and chemicals, has tipped some oversupply situations into undersupply, while exacerbating existing shortages.

Prices of the three commodities have jumped in some cases by more than oil. The widely used fossil fuel has climbed by more than 50% in March, putting Brent on track for a record month.
“While the Chinese supply chain is being viewed as more resilient than many peers, the risk of disruption in chemicals as raw materials for manufacturers in selected segments is higher than expected based on the feedback,” Goldman Sachs analysts said in a report late last week, citing nearly 40 commodity-related meetings and site visits in China.
Tungsten
Tungsten hit a record high of over $3,000 late last week, marking a surge of well over 50% for the month and more than tripling in price since late December. That’s based on the industry benchmark called “ammonium para tungstate (APT)” in metric ton units, or MTU, from Fastmarket, as quoted by tungsten miner Almonty.
Almonty officially reopened a large tungsten mine in Sangdong, South Korea, earlier this month, and plans to start producing some tungsten this year at a project in the U.S. state of Montana.
The company’s CEO Lewis Black told CNBC that defense sector demand for tungsten has been “extremely strong” since the beginning of last year, but that there’s been no notable change despite the Iran war.
“There’s no material to stockpile. That’s probably the biggest change,” he said.
Sulfur
The price of sulfuric acid in Africa is now at least 30% higher than it was prior to the war, and is still rising, the Goldman Sachs analysts said, citing a local Chinese miner in Africa.
Other assessments point to a milder rise in prices.
China sulfur prices, including cost and freight, climbed by about 13% from early March to $621 per tonne as of March 26, according to S&P Global Platts.
“A 2-3 month effective blockade would likely become a severe supply shock, especially as freight/insurance stay elevated and Middle East-origin cargoes become harder to execute,” Pan Yuya, lead analyst for sulfur and phosphate raw materials at S&P Global Energy, and Isaac Zhao, senior principal analyst, China fertilizers at S&P Global Energy, said in a March 20 note.
The S&P analysts said that around 56% of China’s sulfur imports came from the Middle East in 2025.
“Even prior to the Middle East conflict, sulfur prices were rising sharply as the market tightened. With sulfur prices now at fresh record highs, the ‘super squeeze’ in this rather obscure commodity in supply warrants further examination,” HSBC analysts said in a March 16 report.
Helium
Helium prices have roughly doubled since the Iran war began, according to Fitch Ratings.
As most trading occurs through long-term private contracts between industrial gas suppliers and manufacturers, it is difficult to pinpoint industry-wide prices, said Shelley Jang, Fitch’s director of Asia-Pacific corporate ratings.
Iranian missile attacks this month crippled a key industrial center in Qatar, which produces about one-third of the world’s helium.
That implies helium supply won’t be restored anytime soon, pointed out Christopher Ecclestone, principal and mining strategist at Hallgarten & Company.
In one indication of further market tightness, prices of helium in China’s Henan province have reversed a downturn this year to climb from a Feb. 28 low of 545 yuan ($78.85) a bottle to 600 yuan ($86.81), according to Wind Information.
Subscribe now
Shortages caused by the Iran war are the latest supply chain disruption to rock global markets, which faced similar shocks from Russia’s invasion of Ukraine in 2022 and the Covid-19 pandemic. That’s pushed companies to diversify, and countries such as China to ramp up stockpiling plans.
“Access to supplies of certain physical materials where production and processing is concentrated in China will become more frequent topics of negotiations with Beijing,” Rhodium Group said in a March 24 report.
Limited price transparency also means the shortage could be worse than available numbers suggest.
Tungsten and helium prices have been surging, “but you don’t have anyone on the buy side saying, ‘oh my goodness, we don’t have enough product,’” Ecclestone said. “Defense contractors should have warehouses of tungsten, but they don’t.”
“The world has got lazy. It thinks life is like a supermarket, the product is a pack of cornflakes or a few tons of sulfuric acid,” he said. “The supermarket of commodities has had a few of the aisles chopped down.”


The ex-Blackstone team wants to move beyond crypto-collateralized loans and into ‘real economy credit’ as the tokenized RWA sector continues to grow.
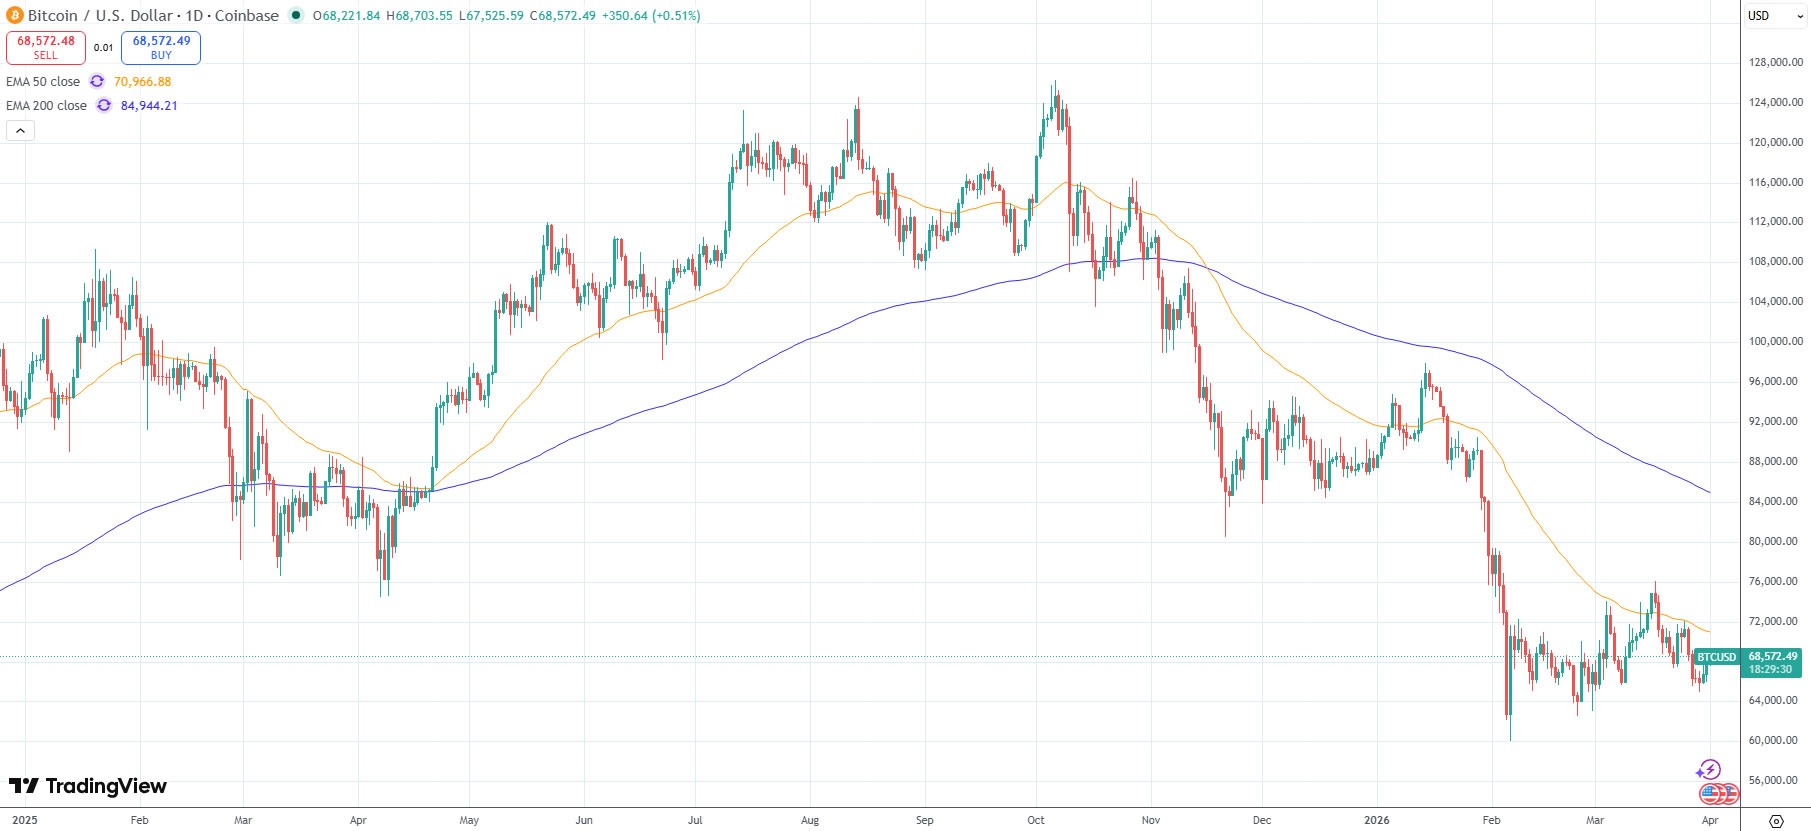
Bitcoin has declined by about 50% this market cycle, far less than in previous cycles, Fidelity Digital Assets said, adding this trend could continue over time.
Bitcoin’s post-all-time-high drawdowns have historically been steep, at about 80% to 90%, but this cycle has been about 50%, Fidelity Digital Assets research analyst Zack Wainwright said Tuesday.
One can see the “diminishing returns” that have developed from cycle to cycle when looking at Bitcoin’s price performance from the perspective of the previous all-time high, he said.
“Each cycle has been less dramatic to the upside than the previous,” he said. “Downside risk has been less dramatic in 2026, the current cycle, as well,” he added.
Bitcoin’s price hit its current cycle low of just over $60,000 on Feb. 6, a decline of 52% from its Oct. 6 all-time high of about $126,000, according to TradingView. It is currently down 46% from its peak six months ago.
The previous cycle saw a much larger decline of 77%, from the 2021 all-time high of $69,000 to a bear market low just below $16,000 in November 2022.
Bitcoin may bottom in late September
Fidelity’s assessment that this Bitcoin cycle is notably shallower than prior cycles “indicates a maturing market with reduced volatility and stronger institutional confidence,” Nick Ruck, director of LVRG Research, told Cointelegraph on Wednesday.
“This shift signals that Bitcoin is changing from a speculative asset toward a more stable store of value, potentially paving the way for greater adoption in the future.”
Related: Bitcoin’s $10K range expected to hold until spot traders show up: Data
Meanwhile, Alphractal founder Joao Wedson observed Tuesday that Bitcoin’s top occurred 534 days after the last halving, a shorter span than in the previous cycle.
This “decaying pattern” across cycles suggests the historical bottom may occur between 912 and 922 days after the halving, which “points to a bottom in late September or early October 2026,” he said.
BTC is below key daily moving averages
Bitcoin remains below the key 50-day and 200-day exponential moving averages, two long-term trend indicators.
It is hovering at the 200-week EMA, around $68,000, which has served as a key level of support during previous market downturns.

Magazine: Nobody knows if quantum secure cryptography will even work
Consumers browse Huawei phones in a shopping mall in Yantai, Shandong Province, China on March 8, 2026.
Cfoto | Future Publishing | Getty Images
Huawei’s push to develop its own artificial intelligence chip has yet to drive the double-digit revenue gains of its peers, as Chinese companies strive to narrow the gap with the U.S. on AI.
Cloud computing revenue from external customers fell by 3.5% in 2025 to 32.16 billion yuan ($4.6 billion), Huawei said. The company is the second-largest cloud provider in mainland China.
While overall cloud revenue including internal customers rose by 4.8% to 72.8 billion yuan, the main ICT infrastructure segment reported revenue growth that slowed to 2.6%, down from 4.9% in 2024.
That’s the segment that would include Huawei’s self-developed Ascend AI chip solutions, meant to rival Nvidia. Huawei’s total ICT revenue for 2025 was 375.01 billion yuan.
The U.S. has restricted Chinese companies’ access to the most advanced Nvidia chips, while Beijing has urged tech self sufficiency at home.

Huawei’s decline in cloud revenue to external customers comes as ByteDance has rapidly grown its AI cloud business in China in the last several months, albeit from a small base.
The TikTok owner is reportedly ramping up access to high-end Nvidia chips in a partnership deal with a planned Malaysia data center. ByteDance and Alibaba also plan to place orders of Huawei’s new AI chip, Reuters reported last week, citing sources. ByteDance declined to comment. The two other Chinese companies did not immediately respond to a CNBC request for comment.
U.S.-developed AI tools are generally considered the most capable in the world, although some Chinese models have shown an edge in video generation. Not all U.S. AI models are officially accessible in mainland China.
Huawei’s modest cloud growth figures come amid rapid industry expansion worldwide and slower economic growth in China.
Globally, spending on cloud infrastructure services rose by 29% in the fourth quarter in a sixth-straight quarter of market expansion of more than 20%, according to Omdia. The firm predicts 27% cloud growth in 2026.
Earlier this month, Alibaba, the largest cloud computing company by market share in mainland China, reported a 36% increase in segment revenue to 43.28 billion yuan in 2025. Tencent said increased cloud service revenues domestically and internationally helped drive a 22% year-on-year increase in business services revenue in 2025.
Local promotions this month in China for AI tool OpenClaw have also encouraged many locals to download the agent and pay for related cloud and AI model services. China’s consumer spending has remained tepid since the pandemic.
Consumer revenue slows
Subscribe now
Huawei smartphones ranked first in China last year by shipments, up by 1.7%, according to Counterpoint. But the Chinese company lost ground to Apple toward the end of 2025 after the iPhone 17’s release.
For 2025 overall, the telecommunication giant reported revenue of 880.9 billion yuan, up 2%, on net profit of 68 billion, up around 8% from a year ago.
The company spent a record 192.3 billion yuan in research and development, or 21.8% of revenue.
“In 2025, Huawei’s overall performance remained steady,” Sabrina Meng, Huawei’s rotating chairwoman, said in a brief statement, which also expressed gratitude to customers, partners and employees.
The intelligent automotive solutions unit saw revenue of 45.02 billion yuan, with growth slowing to 72% year-on-year, down from a whopping 474.4% in 2024, as the autos business captured an initial surge in electric vehicles. Huawei partners with several automobile manufacturers for in-car software and driver-assist technology.
Bitcoin held gains above $68,000 as investors leaned into news that the US and Iran were ideating ways to end the war. Will markets hold their newfound bullishness?
Bitcoin (BTC) briefly jumped to $68,589, and US stock markets rallied as investors reacted to US President Donald Trump’s statements on considering options for ending the US and Israel-Iran war. Separate, unconfirmed comments attributed to Iranian President Masoud Pezeshkian also suggested that Iran may be looking for ways to end the war.
On Tuesday, reporting from The Wall Street Journal said that President Trump told his aides that he could consider ending the war in Iran, with the Straight of Hormuz remaining partially closed, but an official statement has not been given.
Unconfirmed reports also suggest that Iran’s president is looking for a way to exit the conflict with certain assurances being made by the US and Israel. Regardless of the accuracy of the statements from either president, the DOW gained more than 1,125 points, while the S&P 500 and Nasdaq gained 2.91% and 3.83%, respectively.
Despite the strong performance seen across markets, Cointelegraph reported that crypto traders are skeptical of Bitcoin holding its current gains. Analysts suggested that a daily close above the 50-day moving average and $68,879 are key to establishing an early trend change and potentially clearing overhead short liquidity, which could trigger a liquidation-driven rally to $82,000.
Related: Bitcoin hits $68K but BTC futures, macro data show traders remain bearish
A lack of confidence is the current culprit
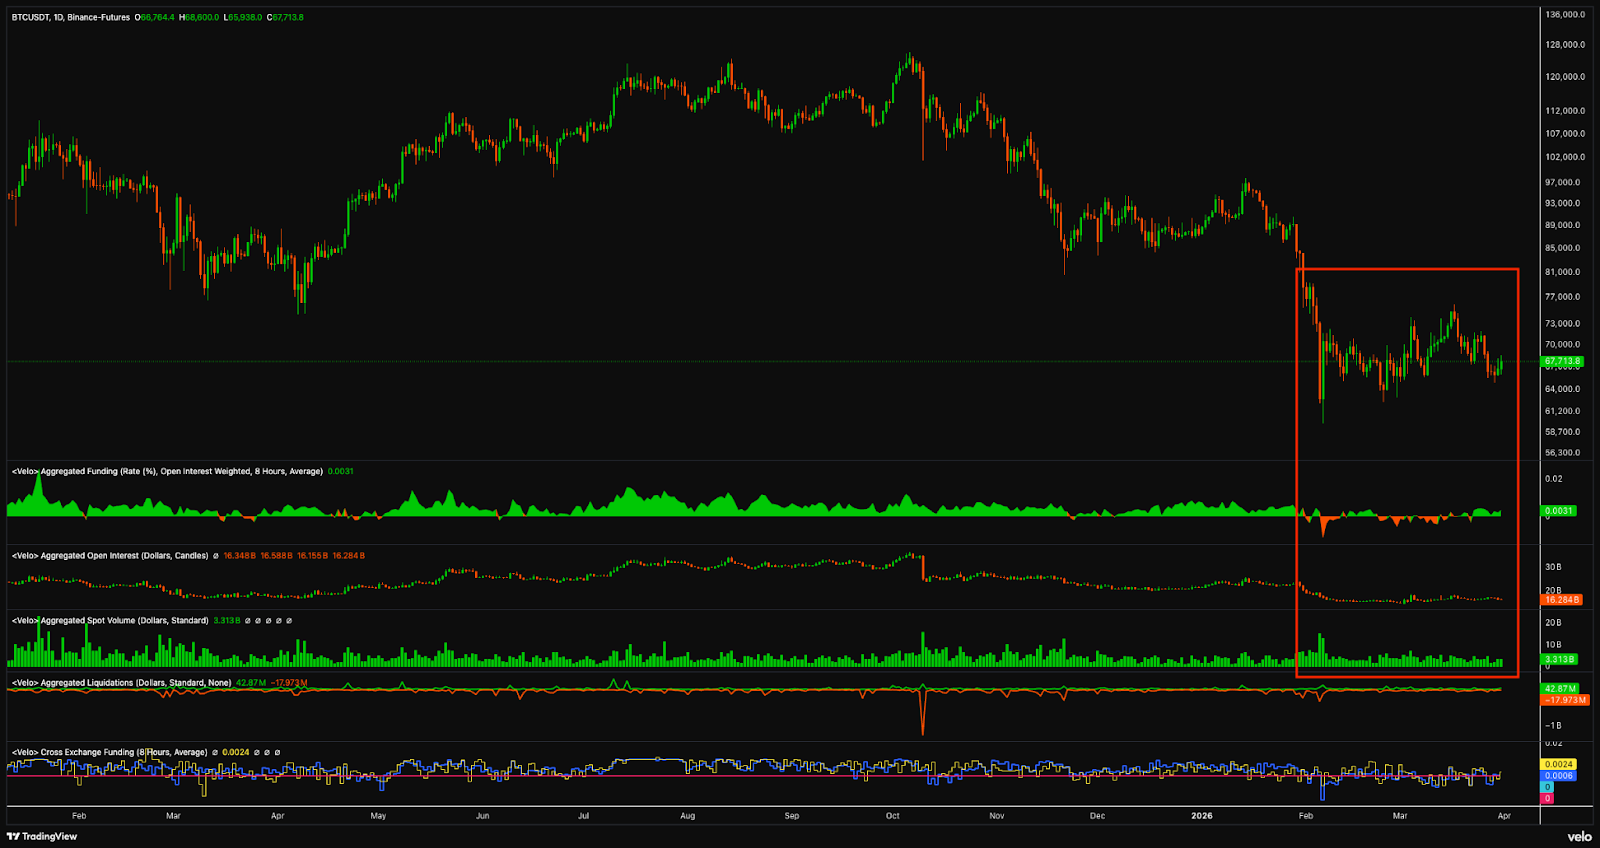
Beyond US macroeconomic conditions and the forecasted longer-term negative impact of the US and Israel-Iran war on energy, goods and services costs, the weakness of spot demand in the Bitcoin market continues to cap most price breakouts.
As shown in the chart below, open interest in the Bitcoin futures market, along with spot demand have remained relatively flat since the Feb. 6 sell-off below $60,000. This suggests that a majority of the price action is driven by news headlines, equities and perpetual futures markets, as the absence of investors making sustained directional bets in each market (futures and spot) leaves BTC price range-bound.

Earlier reporting from Cointelegraph also highlighted short-term traders holding positions below their cost basis ($85,800) and stablecoin inflows to crypto exchanges near a two-year low, further evidence that traders remain extremely cautious and are electing not to take strong directional bets in the market.
This article is produced in accordance with Cointelegraph’s Editorial Policy and is intended for informational purposes only. It does not constitute investment advice or recommendations. All investments and trades carry risk; readers are encouraged to conduct independent research before making any decisions. Cointelegraph makes no guarantees regarding the accuracy or completeness of the information presented, including forward-looking statements, and will not be liable for any loss or damage arising from reliance on this content.
Key takeaways:
-
Solana outperforms Ethereum in high-revenue DApps, providing a fundamental cushion against recent price drops.
-
Rising Ethereum Layer-2 dominance challenges SOL as traders monitor the critical $80 support level for a retest.
Solana’s native token, SOL (SOL), faced an 11% correction following a rejection at $93 on last Wednesday. SOL has lagged the broader cryptocurrency market over the past week, testing the $80 support on multiple occasions. Solana network fees have also declined over the past two months, leading traders to fear a potential retest of the $75 level.

The total value locked (TVL) on Solana stood at $6.3 billion, though the gap remains wide compared to Ethereum’s $54.1 billion. However, Solana amassed 80% more network fees than its main competitor over the last 30 days. This difference is largely due to Ethereum’s incentives for layer-2 rollups, which utilize temporary data blobs to lower costs.

Network fees on Solana dropped to $18.5 million in March, a 42% decrease from January’s $30 million level. Most of this decline stems from lower activity in decentralized exchange (DEX) volumes. Despite maintaining leadership in absolute terms, Solana DEX volumes plummeted to $55.5 billion, their lowest levels since September 2024, according to DefiLlama data.

In comparison, Ethereum DEX volumes totaled $41 billion in March, down 23% from two months prior. More importantly, when aggregating Ethereum layer-2 blockchains like Base, Arbitrum, Polygon, and Optimism, Ethereum’s DEX market share jumped to 42% in March from 33% in January. Solana’s dominance is gradually being challenged, which partially explains SOL’s current bearish momentum.
Solana DApps revenue could solidify SOL’s $80 support level
While DEX volumes on Solana are declining, no other network matches its number of DApps earning $1 million or more in 30 days. This data serves as a strong incentive for developers to join Solana, creating opportunities for user returns through protocols like Pump, Helium Network and ORE Protocol. Since protocol revenues drive investor attention, a healthy ecosystem remains extremely important for SOL’s upside.
Related: Solana lands Mastercard, Western Union on new dev platform

Solana leads the pack with 13 DApps ranking $1 million or more in revenue over the past 30 days. As a comparison, the runner-up Ethereum had 11 DApps, while BNB Chain and Base totaled 4 DApps each with $1 million or higher in monthly revenue. Thus, there is little evidence that the SOL price is bound to retest $75 solely because of lower network fees driven by weak DEX volumes.
DEX activity is a major driver of network fees, but the sustainability of protocols within the Solana ecosystem demonstrates that SOL is far from abandoned by investors.
This article is produced in accordance with Cointelegraph’s Editorial Policy and is intended for informational purposes only. It does not constitute investment advice or recommendations. All investments and trades carry risk; readers are encouraged to conduct independent research before making any decisions. Cointelegraph makes no guarantees regarding the accuracy or completeness of the information presented, including forward-looking statements, and will not be liable for any loss or damage arising from reliance on this content.
Bitfarms (BITF) shares climbed 6.6% on Tuesday despite reporting a widened $284.5 million net loss for 2025, driven by a decline in Bitcoin prices and a high cost of revenue, with the company advancing its pivot to AI and high-performance computing.
The company’s full-year results statement on Tuesday showed a 72% year-on-year increase in revenue to $229 million. This was outweighed by $248 million in cost of revenue, leading to a gross loss.
General and administrative expenses also increased year over year, while the change in fair value of digital assets led to a $50.5 million loss in 2025 compared with a gain of $26 million in 2024. This was partially offset by a $28.2 million realized gain on the sale of digital assets.
The results show the difficulty that some Bitcoin miners have faced in turning a profit. Bitcoin mining profitability margins have slimmed for miners as Bitcoin has fallen 46% from its high in October, while Bitcoin difficulty — a measure of how difficult it is to mine a block — has increased 58.5% since the last halving event in May 2024.
In the earnings call, Bitfarms CEO Ben Gagnon said it made the “bold decision to walk away” from its Bitcoin mining business in November and has built a new business powering HPC and AI data centers:
“No half-measures, no compromises, and in time, no Bitcoin. We built a new company,” he said, adding that Bitfarms expects to rebrand to Keel Infrastructure on Wednesday and has been given shareholder approval to move its legal base from Canada to the US.
The filing shows Bitfarms currently still holds approximately $161 million in unencumbered Bitcoin.
In the statement, Gagnon added: “Everything we built in 2025 — the sites, the team, the balance sheet — was in service of one thesis: that HPC/AI’s exponential growth requires top-tier infrastructure, and we intend to build to meet that demand.”
Related: MARA sells $1.1B in Bitcoin to buy back debt at 9% discount
BITF shares closed Tuesday trading hours up 6.64% to 2.73 Canadian dollars ($1.96), Google Finance data shows.

Bitfarms said its focus with HPC and AI is to power hyperscalers and neoclouds for the next wave of AI applications.
“We are not here to compete with hyperscalers or Neoclouds. We are here to enable them. Our focus is providing the critical and largely invisible foundation that will allow the world’s most advanced AI platforms to deploy on time and scale without interruption.”
It is in the process of advancing a 2.2 gigawatt digital infrastructure development pipeline across North America to deliver on that goal.
Bitfarms is one of several Bitcoin miners that have expanded or pivoted into AI in search of higher-margin opportunities in HPC and AI.
Iris Energy is scaling AI cloud services with Nvidia GPUs, while Cipher Mining has secured a long-term AI hosting deal with AI cloud platform Fluidstack. Riot Platforms and MARA Holdings have also expanded into AI and HPC.
Magazine: Bitcoin may face hard fork over any attempt to freeze Satoshi’s coins
A whitepaper co-authored with the Ethereum Foundation and Stanford researchers slashes qubit estimates by 20x, warns that billions in crypto assets are exposed to multiple attack vectors.

What does the UN Declaration on the slave trade mean for Western legitimacy and the Global South?
Filip Hrgovic ‘guaranteed’ fight with top heavyweight if he beats Dave Allen: “We have a contract”

How to Integrate AI APIs Into Existing Software Applications: A Developer’s Guide


-

 News Videos6 days ago
Parliament publishes latest register of MPs’ financial interests
-
 Tech6 days ago
Intercom’s new post-trained Fin Apex 1.0 beats GPT-5.4 and Claude Sonnet 4.6 at customer service resolutions
-

 NewsBeat4 days ago
The Story hosts event on Durham’s historic registers
-

 Business6 days ago
Instagram, YouTube Found Responsible for Teen’s Mental Health Struggle in Historic Ruling
-

 Sports4 days ago
Sweet Sixteen Game Thread: Tide vs Michigan
-
 NewsBeat7 days ago
Tesco is selling new Cadbury Dairy Milk bar and people can’t wait to try it
-
 Entertainment3 days ago
Lana Del Rey Celebrates Her Husband’s 51st Birthday In New Post
-
Entertainment2 days ago
Fans slam 'heartbreaking' Barbie Dream Fest convention debacle with 'cardboard cutout' experience
-
Crypto World21 hours ago
Dems press CFTC, ethics board on prediction-market insider trades
-

 Sports16 hours ago
Tallest college basketball player ever, standing at 7-foot-9, entering transfer portal
-
 Fashion7 days ago
How to Style Spring Like WeWoreWhat: Easy Outfit Ideas for 2026
-

 Entertainment6 days ago
HBO’s Harry Potter Series Will Definitely Fail For One Big Reason, And It’s Not J.K. Rowling Or Snape
-

 Tech2 days ago
The Pixel 10a doesn’t have a camera bump, and it’s great
-

 Fashion6 days ago
En Vogue in Brown Leather and Tailored Neutrals by Atelier Savoir, Styled by J Bolin
-

 Crypto World1 day ago
U.S. rule change may open trillions in 401(k) funds to crypto
-

 Fashion6 days ago
What Are Your Favorite T-Shirts for the Weekend?
-

 Fashion5 days ago
Weekly News Update, 3.27.26 – Corporette.com
-

 Sports1 day ago
Women’s hockey camp eyes fitness boost, tactics ahead of WC 2026 campaign | Other Sports News
-
 Sports6 days ago
Lewis Hall hopes to miss another summer of village cricket due to World Cup call
-

 Tech3 days ago
Elon Musk’s last co-founder reportedly leaves xAI
You must be logged in to post a comment Login