

Crypto World
XRP price outlook: will the $1.35 support hold or break?
- XRP is holding a tight range near $1.35–$1.36 under pressure.
- Most moving averages and signals still show a dominant downtrend.
- RSI weakness suggests a pause, with $1.35 acting as key support.
XRP is trading at $1.36, sitting almost directly on a key short-term support zone after a steady decline across multiple timeframes.
The price has slipped 7.4% over the past seven days and 6.4% over the past month, extending a broader downtrend that has now reached a 44% drop over the past year.
This puts the current market situation of the Ripple token at the centre of a critical decision point, where bulls and bears are actively testing whether the support at $1.35 can hold.
XRP has entered a tight consolidation phase
XRP has been moving inside a very narrow range between $1.35 and $1.38 over the past 24 hours.

This tight consolidation often reflects hesitation in the market, where neither bulls nor bears have enough momentum to force a clear breakout.
The lower boundary of this range, $1.35, has now become the immediate level to watch.
A clean breakdown below this point would place XRP into a weaker technical structure, with little short-term support visible beneath it.
On the upside, the $1.38 level remains the first resistance barrier, and price has repeatedly failed to sustain moves above it in recent sessions.
But despite this compression, momentum indicators suggest the market is still leaning cautiously.
The 14-day RSI sits at 41.94, which is neutral but tilted toward weakness.
On the weekly chart, RSI drops further to 38.67, which is commonly interpreted as oversold territory.
This divergence between timeframes suggests that while short-term selling pressure is cooling, longer-term momentum remains under stress.
XRP’s technical structure remains under bearish control
A broader look at the trend shows that XRP is still trading below all major exponential moving averages (EMAs) on the daily chart.
These include the 10-day, 20-day, 50-day, 100-day, and 200-day EMAs, which are all positioned above the current price.
This signals a clear bearish structure, where every major trend line is acting as resistance rather than support.
In technical terms, this type of stacking usually reflects a market that has not yet completed a full reversal phase.
In addition, out of 23 tracked technical indicators, 13 are currently pointing to sell signals, while only 3 suggest buying conditions, and 7 remain neutral.
Moving averages alone account for 12 sell signals with zero buy signals, reinforcing the view that the long-term trend has not shifted back in favour of buyers.
At the same time, oscillators like the MACD and the RSI present a slightly different picture. With 3 buy signals against 1 sell signal, short-term momentum indicators show early signs of stabilisation.
However, this has not yet been strong enough to counter the dominant bearish trend formed by the moving averages.
The next directional move will depend heavily on whether buyers can defend the $1.35 support zone or whether selling pressure forces a breakdown into lower price territory.
Short-term estimates point to movement toward $1.39, while broader yearly forecasts place 2026 within a wide range between $0.82 and $2.12.


Blockchain infrastructure firm Alchemy said AI agents with its AgentCard now have access to the Visa (V) network with complete identity and payment capabilities, enabling them to make online purchases on behalf of consumers.
The integration allows AgentCard, a virtual ID and spending card for AI agents, to access Visa Intelligent Commerce to book a vacation, order groceries or renew a subscription, for example, without the consumer ever touching a checkout screen.
Agent-native payment protocols are in early adoption with firms like Stripe, Visa and Mastercard (MA) driving hard into this new area, known as agentic commerce. AgentCard works with agents built on models from any provider, including OpenAI or Anthropic.
“Every major computing shift has produced a new kind of economic actor,” Nikil Viswanathan, co-founder and CEO of Alchemy, said in a statement. “The internet created online businesses. Mobile created the app economy. AI agents are next, and they need to be able to access the global economy, and AgentCard is how that starts.”
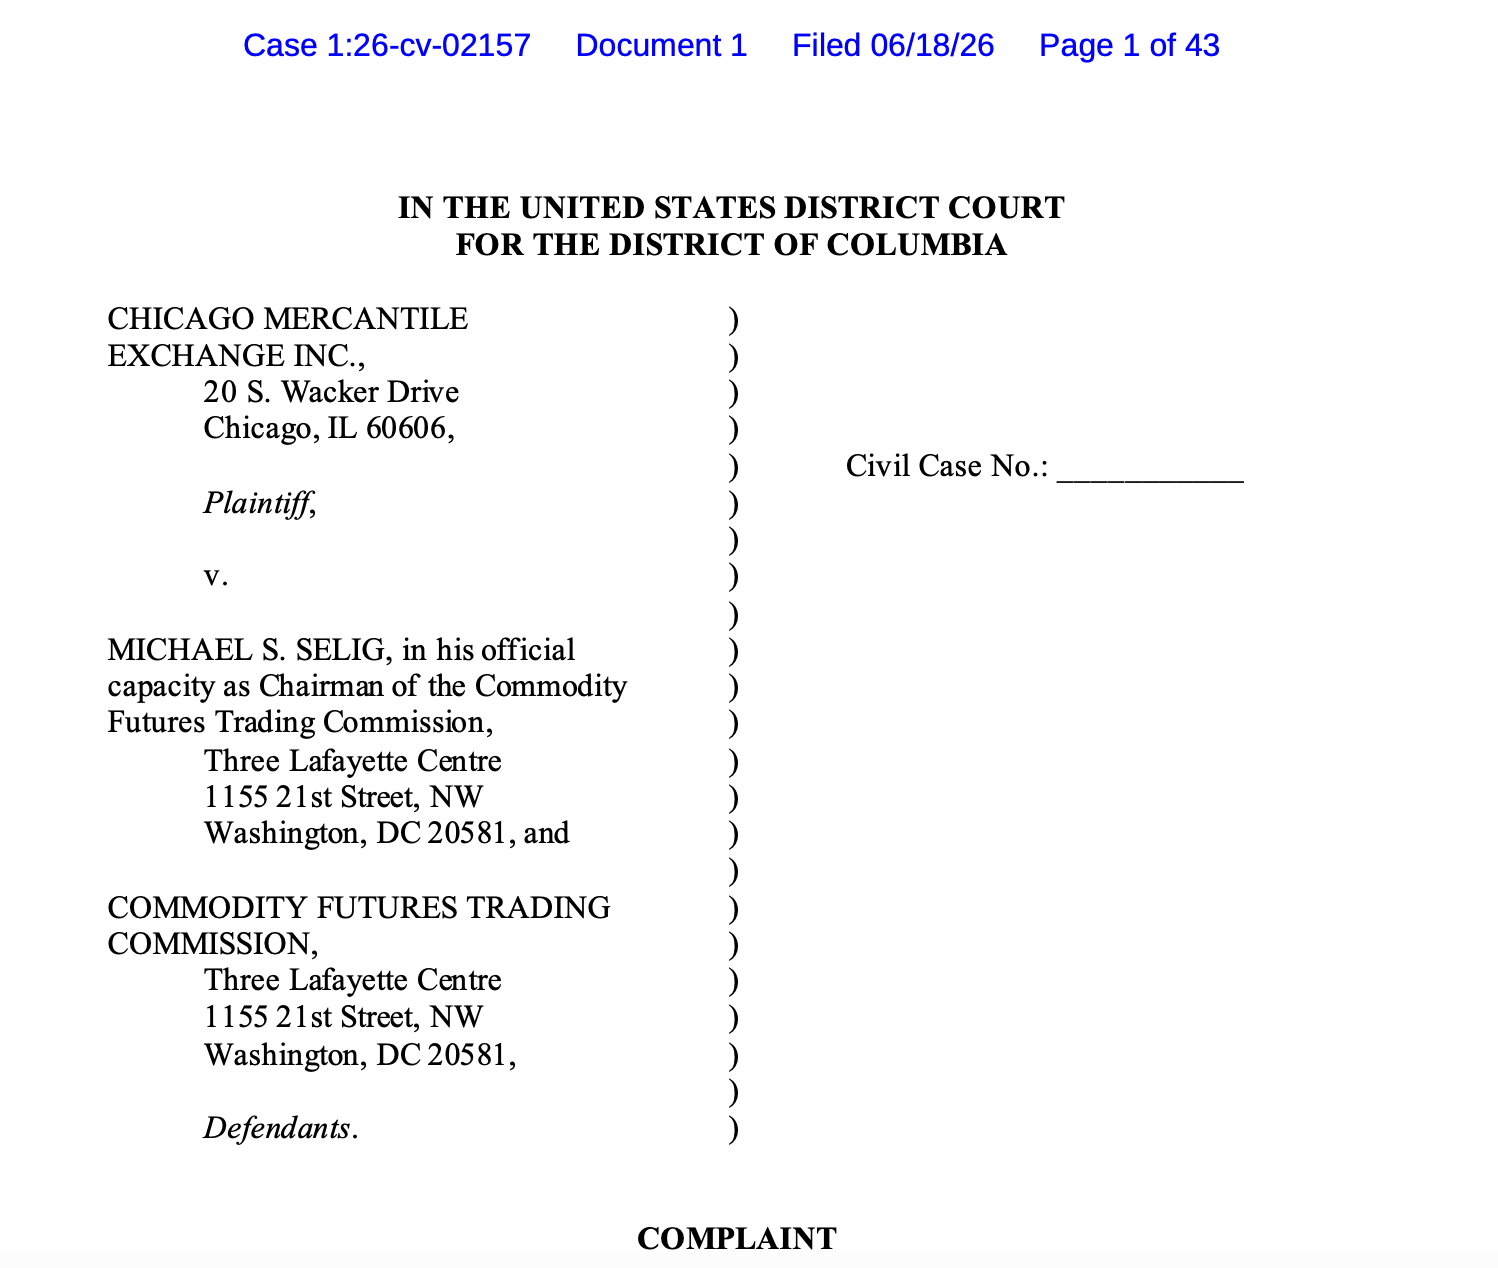
The Chicago Mercantile Exchange (CME) Group said it was taking legal action against the US Commodity Futures Trading Commission (CFTC) over cryptocurrency perpetual futures.
In a Thursday filing in the US District Court for the District of Columbia, CME filed a complaint against the CFTC and its chair Michael Selig over the agency’s regular approvals of perpetual futures tied to crypto. The lawsuit stemmed from a May 29 notice from the CFTC approving perpetual futures contracts tied to the spot price of Bitcoin (BTC) for prediction markets platform Kalshi and issuing a no-action position for similar products on cryptocurrency exchange Coinbase.
According to CME’s filing, the CFTC’s approval of such products went against directives from the US Congress by treating “futures” as “swaps” with expiration dates. The company alleged that the agency was in violation of the Commodity Exchange Act and a court should vacate its actions over perpetual futures, noting that Selig had unilaterally acted without a full panel of five CFTC commissioners.
“With one stroke of his pen, [Selig] overrode Congress’s definition of the term ‘swap’ and circumvented the regulatory regime Congress required for that form of derivative,” said the complaint, adding:
“The CFTC’s failure to evenhandedly, consistently, and correctly apply the CEA risks harming competition and destabilizing derivatives markets.”

Source: PACER
The lawsuit came just one day after CME CEO Terrence Duffy said that the company would be taking legal action against the CFTC. In a Monday CNBC interview, Selig said that perpetual futures contracts “trade very similarly” to others, describing the CFTC’s position as “good for investors” and claiming that the Commodity Exchange Act “does not define the term ‘futures contract.’”
A CFTC spokesperson told Cointelegraph that CME had engaged in “lawfare” against the agency and the administration’s crypto policies, calling the complaint “frivolous.”
Related: ICE, CME press US regulators to ‘rein in’ Hyperliquid energy trading: Report
Kraken also announced the launch of perpetual futures trading for US users through CFTC-regulated platform Bitnomial.
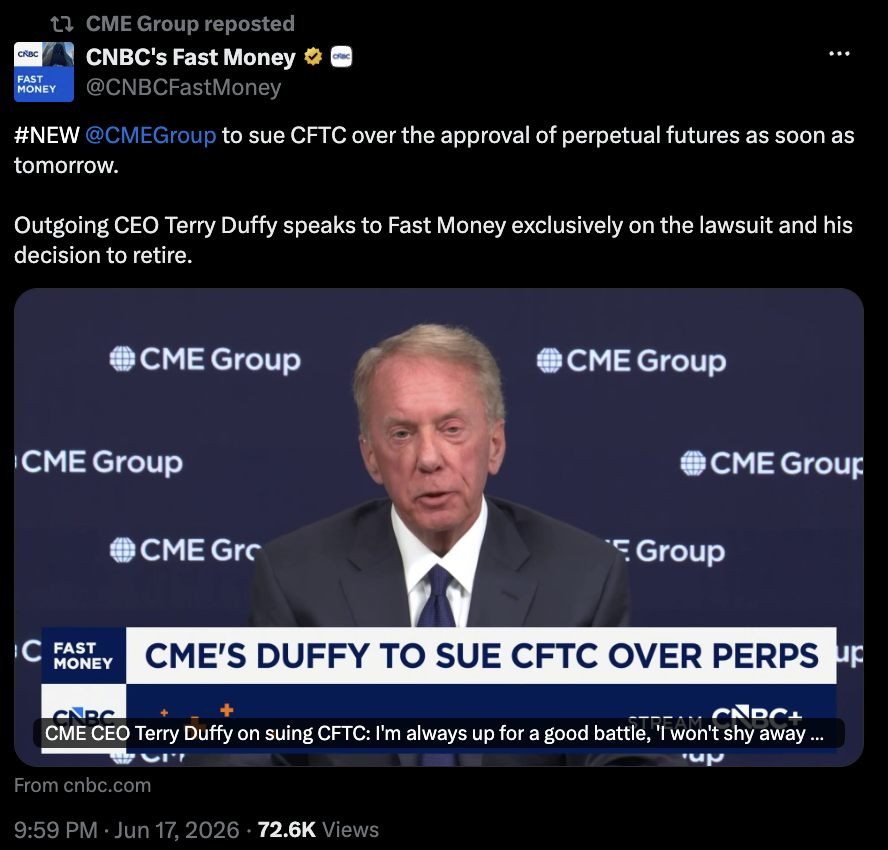
CME CEO Terry Duffy. Source: CNBC Fast Money
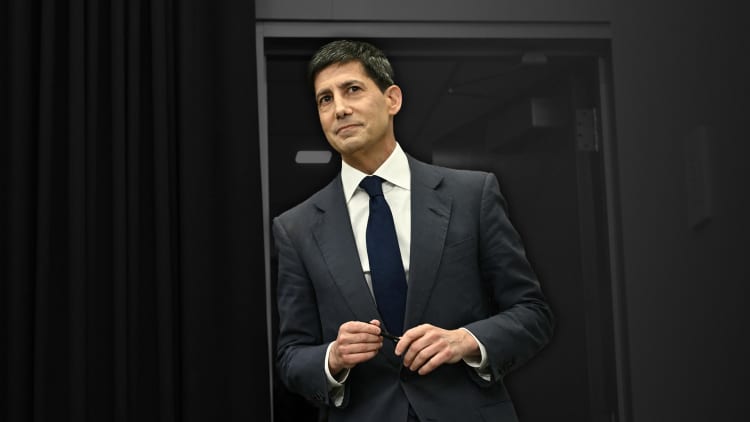
Selig acts alone on prediction markets, perpetual futures, CFTC agenda
Confirmed by the US Senate in December 2025, Selig remains the chair and sole commissioner at the CFTC in a leadership panel intended to consist of a bipartisan group of five people. As of Thursday, US President Donald Trump had not announced any nominations to fill the seats, despite urging from many members of Congress to do so.
Magazine: OpenAI files for IPO, SEC scraps 611 rule and Hungary overhauls crypto: Hodlers Digest June 7-13

Key Highlights
-
QUBT stock advanced following Planck Dynamics’ order of five NeuraWave platforms for 2026 delivery.
-
The NeuraWave agreement provides QCi with tangible commercial momentum in AI computing markets.
-
The partnership with Planck Dynamics opens defense sector opportunities for QCi’s photonic technology.
-
A possible $10M expansion hinges on achieving specific milestones and customer requirements.
-
NeuraWave leverages photonic reservoir computing for edge AI applications requiring minimal latency.
Shares of Quantum Computing Inc. (QUBT) advanced following news that Planck Dynamics had placed an order for the company’s NeuraWave technology. QUBT stock traded at $10.34, representing a 5.78% gain, as investors responded to the commercial validation. The shares briefly touched $10.50 during intraday trading before stabilizing near session highs.
NeuraWave Contract Lifts QUBT Stock
Quantum Computing announced that Planck Dynamics has committed to an initial purchase of five NeuraWave computing systems. Delivery is scheduled for 2026, with technical coordination work commencing immediately. This purchase order establishes QCi’s first commercial foothold in photonic reservoir computing applications.
The arrangement establishes a foundation for potential expansion of NeuraWave deployments moving forward. QCi indicated the overall program value could surpass $10 million based on achievement of specified performance benchmarks. Additional system orders remain contingent upon Planck Dynamics reaching development targets and satisfying contractual requirements.
Planck Dynamics functions as part of NUNC Capital BV’s investment portfolio based in the Netherlands. The firm specializes in defense applications and develops real-time analytical systems for operational environments. This collaboration positions QCi’s photonic technology within a rigorous, performance-driven sector.
Photonic Computing Partnership Focuses on Edge Applications
QCi engineered NeuraWave specifically for temporal artificial intelligence and time-series data analysis tasks. The platform employs photonic reservoir computing architecture to deliver rapid, efficient processing of sophisticated datasets. Consequently, it addresses scenarios where centralized computing infrastructure introduces unacceptable latency.
The collaborative program will validate electro-optic computing capabilities for advanced AI processing needs. It seeks to enable both commercial and governmental applications across diverse operational contexts. The initiative emphasizes rapid response times, minimal energy consumption, and instantaneous analytical output.
This application domain is significant because edge computing architectures process information at or near data generation points. Such systems frequently support sensor arrays, mobile platforms, and geographically distributed infrastructure. Thus, QCi has tailored NeuraWave for scenarios where processing speed and reduced power requirements are mission-critical.
Commercial Validation Strengthens QCi Strategy
Quantum Computing has centered its business approach on quantum optics and integrated photonic technologies. The firm aims to transition advanced computing capabilities from laboratory environments into practical commercial deployments. This partnership delivers tangible evidence of customer demand supporting that strategic direction.
Both organizations will develop a detailed Statement of Work governing the partnership activities. This document will define technical milestones, system integration objectives, and implementation timelines. It will serve as the roadmap for continued collaboration between QCi and Planck Dynamics throughout the project lifecycle.
While the agreement doesn’t ensure the complete $10 million program materialization, it provides QUBT with substantive positive news following a turbulent trading period. The contract also validates growing market recognition of photonic computing solutions for sophisticated AI applications.


Federal Reserve Chairman Kevin Warsh’s tough talk on inflation Wednesday reverberated through financial markets, with traders expecting that the central bank could start jacking up interest rates in just a few months.
Tapped to serve by President Donald Trump, who has repeatedly demanded lower rates, Warsh during a news conference instead focused on the battle against inflation, which has run above the Fed’s official 2% target for five years.
“Persistently high prices are a burden for the American people, but the recent past need not be prologue,” he said. “I am pleased to report that members of the [Federal Open Market Committee] are unambiguous and unanimous. This committee will deliver price stability.”
Markets immediately took notice as the new central bank leader sought to establish his inflation-fighting credentials.
The 2-year Treasury yield, seen as a market reflection of Fed moves, soared as Warsh spoke.
At the same time, futures market traders began placing bets on when the next rate hike would come. The probability for an increase at the July 28-29 meeting quickly climbed to about 1-in-3. Odds for a September hike spiked to 67% around midday Thursday, according to the CME Group’s FedWatch.

2-year yield
Dispelling the Warsh narrative
Moreover, traders priced in largely tighter Fed policy well into the future too.
The odds of a second hike by September 2027 rose above 45%. Even further out, the market-implied fed funds rate for May 2031 stood at 4.78%, indicating as many as five hikes in as many years from the current target range of 3.50%-3.75%.
A popular narrative that Warsh was sent to the Fed to ease monetary policy at all costs was quickly dispelled within the space of a 40-minute parley with reporters. At times serious and other times light-hearted, the session was notable for the inflation focus, with Warsh referring to “price stability” a dozen times.
Market veteran Ed Yardeni said he was “blown away” by Warsh’s remarks.
“We thought he was a dove who favored lowering the federal funds rate (FFR) because he believes that AI is boosting productivity and economic growth while keeping a lid on inflation,” the head of Yardeni Research said in an overnight note. “Instead, he hammered home a strict, orthodox message on inflation with a strong commitment to price stability.”
The pivot to inflation fighter shook investors, with stock market averages diving along with the spike in Treasury yields.
But apprehension about a possibly hawkish Warsh Fed dissipated Thursday as Wall Street digested the FOMC meeting outcome and focused more on positive developments in the Iran war and the prospect for lower energy costs ahead. Stocks rallied and yields were flat to lower.
Some positives on inflation
There seems reason for optimism that the chairman’s position in retrospect could be seen as a good deal of saber-rattling amid what might already be positive prospects for inflation. Even with popular inflation gauges at multi-year highs and well above the Fed’s 2% target, underlying pressures are easing, with core inflation up just 0.2% in the month in May.
Scott Clemons, chief investment strategist at Brown Brothers Harriman, thinks the Fed actually won’t make any moves this year on rates as it watches the shifting inflation dynamics and other factors play out.
“Far be it for me to disagree with the futures market, but I would be surprised if the Fed raises interest rates this year,” Clemons said. “It is an election year. This is already a hyper-politicized environment. There’s already concerns about politicization at the Fed. I’m not sure they want to feed that.”
In the past, Warsh has said it’s generally prudent to look through temporary supply disruptions that hit prices.
Commodity costs, in fact, are up just 6% since the war began in late February and have come off their May peak by some 17%, as measured by the S&P GSCI index. Should inflation ease and commodity prices continue to retreat — the price of gasoline dipped below $4 a gallon Thursday, according to AAA — and the economy wobble, that could get the central bank back into an easing posture.
“For now, for the markets, Warsh’s message was comforting and unsettling,” Steve Blitz, chief U.S. economist at TS Lombard, said in a note. “In declaring that inflation will be dealt with in no uncertain terms was comforting. By saying that markets will decide where to set rates rather than having them set with an eye to where the Fed wants them set was unsettling (to today’s traders, but this should, ultimately, prove comforting).”

These standards, according to the rule proposal, “must include reasonable procedures for: (1) verifying the identity of any person seeking to open an account to the extent reasonable and practicable; (2) maintaining records of the information used to verify a person’s identity, including name, address, and other identifying information; and (3) determining whether the person appears on any lists of known or suspected terrorists or terrorist organizations provided to the financial institution by any government agency.”
The Fed opened a 60-day public comment period alongside the other agencies in the joint effort, including the Office of the Comptroller of the Currency, Federal Deposit Insurance Corp., National Credit Union Administration and the Treasury Department’s financial-crimes arm.
In September, the regulators had issued a more preliminary document seeking comments to direct their GENIUS implementation in this and other areas, and the Treasury received 450 comments. This new stage is known as a “notice of proposed rulemaking,” which comes with another comment period and review before the agencies can eventually issue final joint rules and begin enforcing the regulations.
The Treasury’s Financial Crimes Enforcement Network (FinCEN) has pursued its own related rule to apply the GENIUS Act anti-money laundering provisions on issuers.
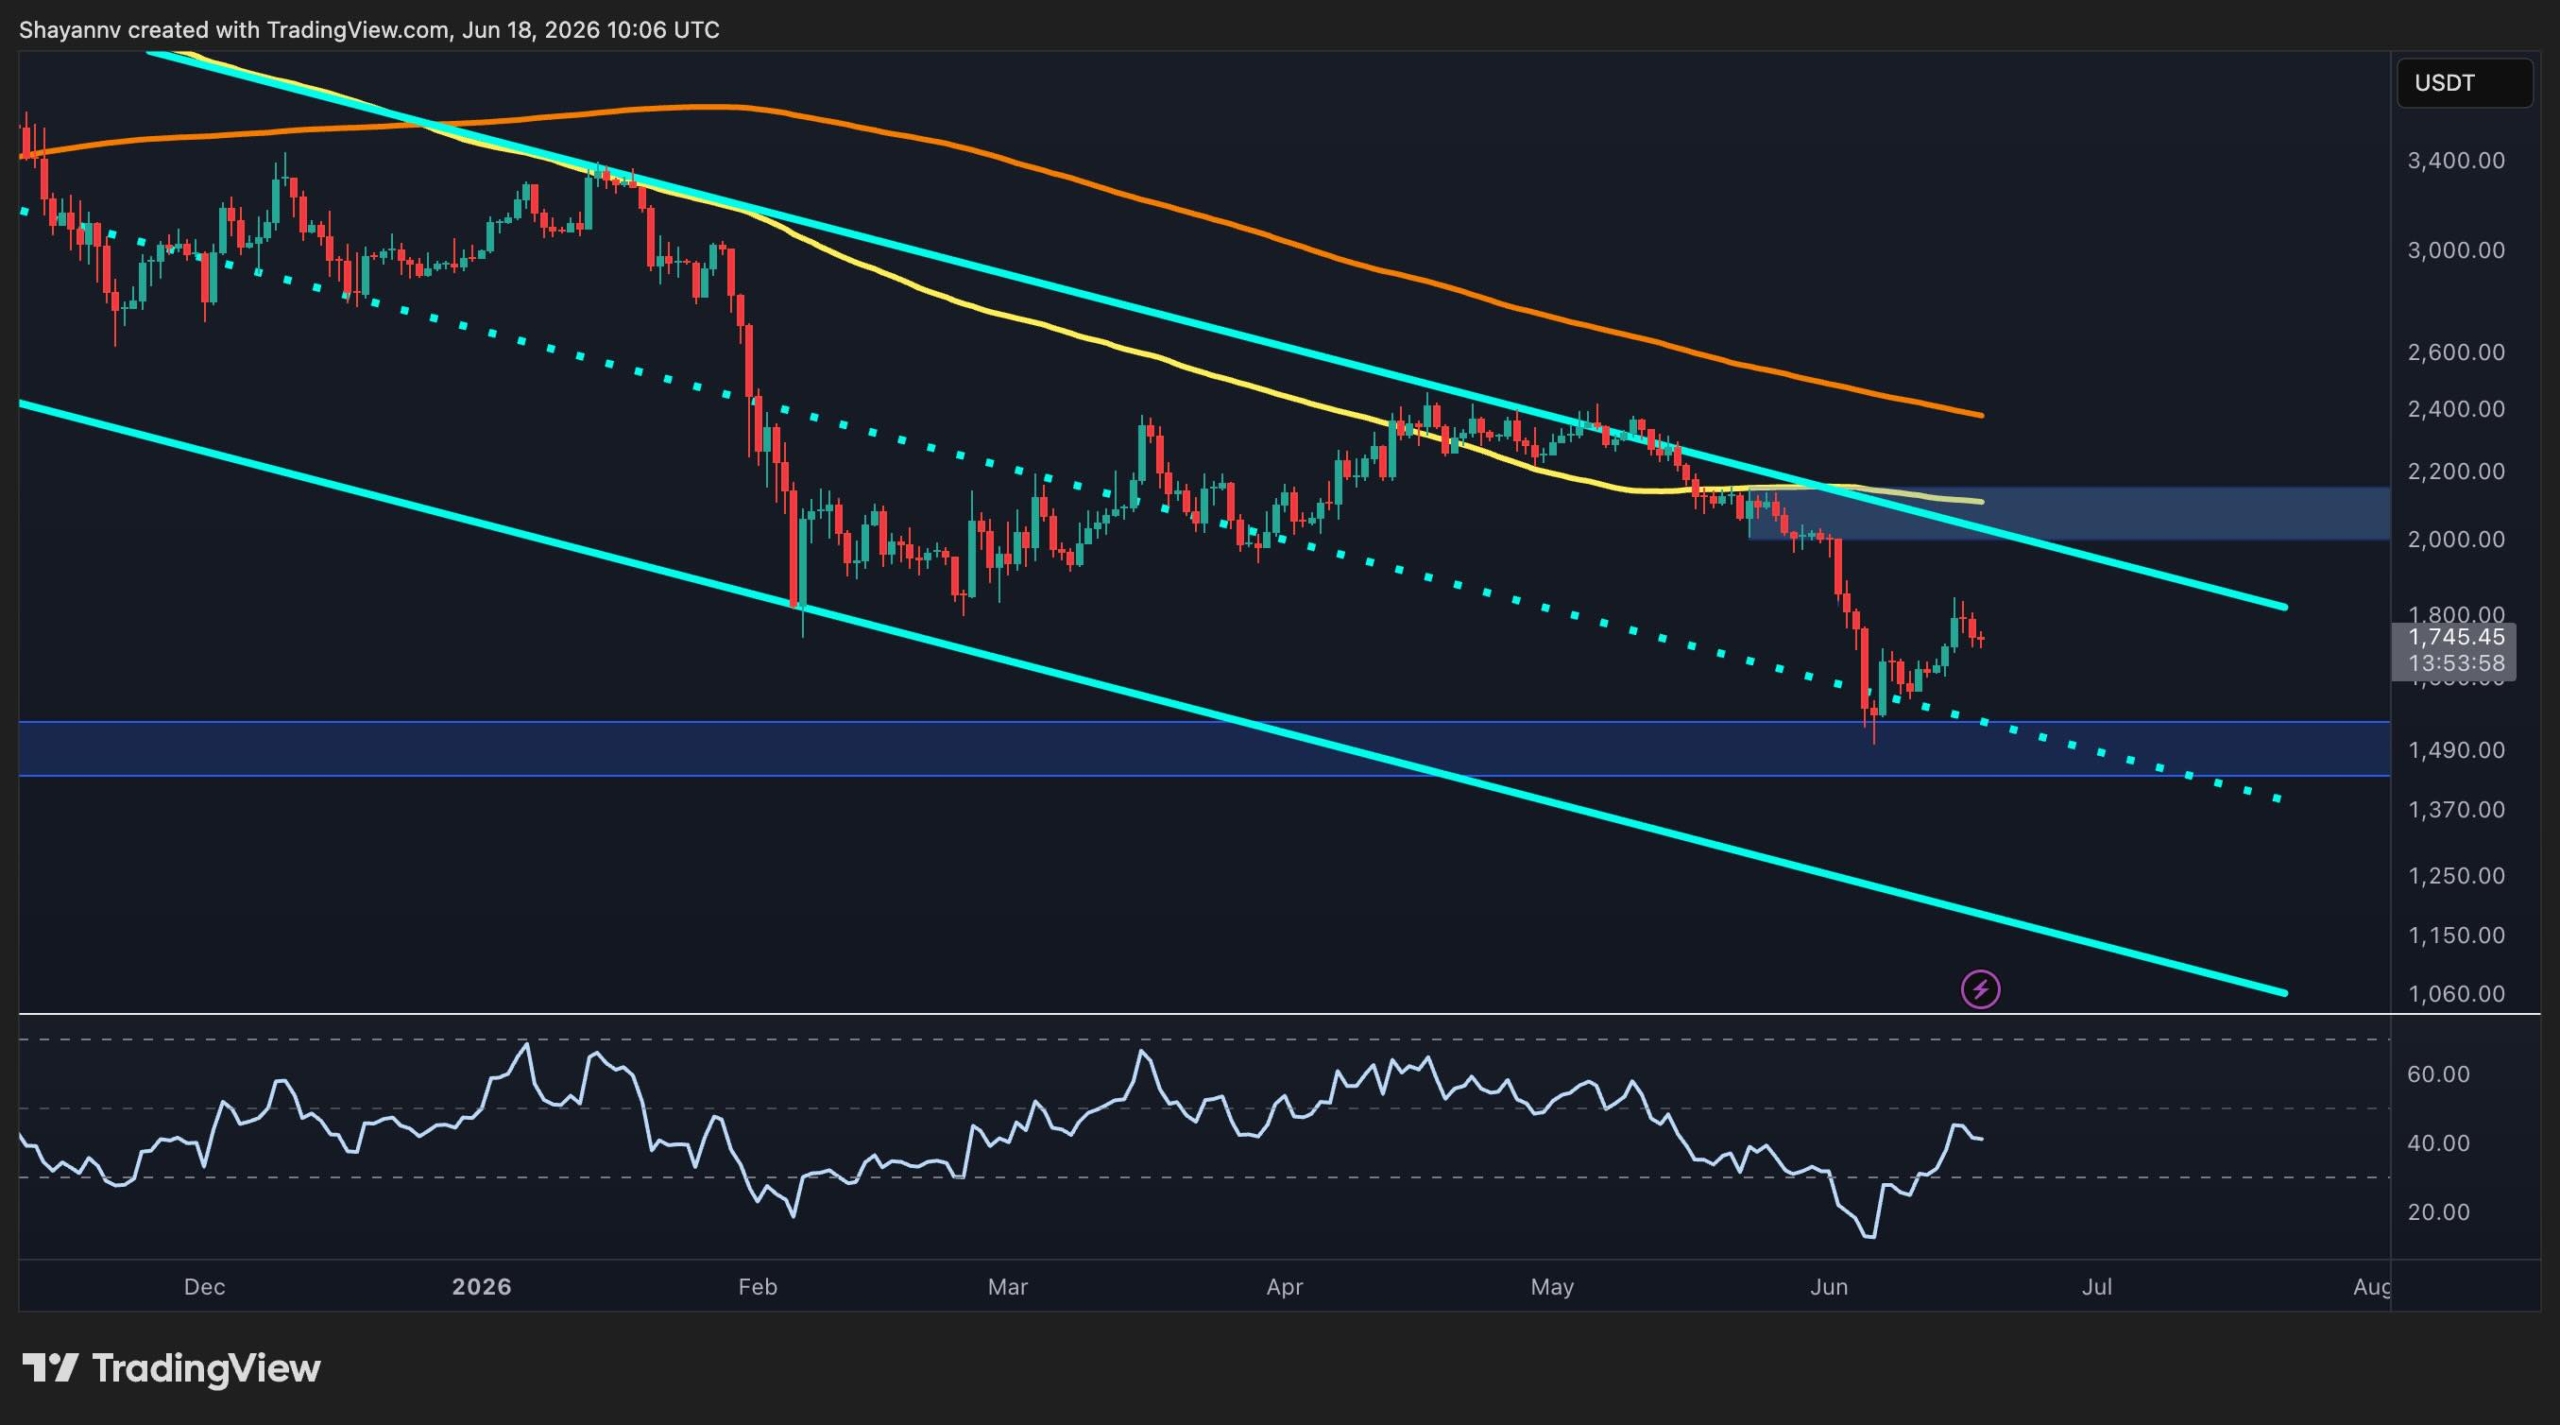
Ethereum has been under pressure across higher and lower timeframes over the past few weeks. While the price has staged a relief bounce from recent lows near $1.5K, the broader structure continues to favor sellers as ETH trades beneath major moving averages and inside a long-term descending channel. At the same time, exchange reserve data continues to trend lower aggressively, suggesting persistent supply withdrawal from centralized exchanges despite the weak price action.
Ethereum Price Analysis: The Daily Chart
On the daily timeframe, ETH remains trapped inside the long-term descending channel that has governed the price action for several months. The recent rebound from the $1.5K support zone allowed buyers to recover part of the latest selloff. However, the bounce has so far failed to alter the broader bearish market structure.
The most important resistance sits between $2K and $2.2K, which is highlighted by the confluence of the 100-day moving average and a major supply zone. A daily close above this region would be the first meaningful signal that downside momentum is shifting and could open the door toward the $2.4K highs, where the 200-day moving average also currently resides. Until that happens, ETH will likely continue to print lower highs and lower lows. The inability to reclaim the $2K-$2.2K resistance zone keeps the broader trend bearish.
On the downside, the $1.5K support region remains the key level to watch. This zone recently attracted strong demand and produced the latest recovery. A breakdown below it would expose the lower boundary of the descending channel and potentially trigger another leg lower toward the $1K region. The RSI has also recovered from oversold conditions but remains below bullish territory, suggesting that the recent rebound appears corrective rather than the beginning of a sustained trend reversal.
ETH/USDT 4-Hour Chart
The 4-hour chart shows a more constructive short-term structure. Following the sharp selloff into the $1.5K demand zone, ETH has formed a series of higher lows, supported by a rising trendline that has guided the recovery over the past two weeks.
The rebound culminated in a strong impulsive move toward the $1.85K decision area, where sellers quickly re-entered the market. Since reaching that level, price has struggled to push higher again and has begun consolidating beneath resistance.
Currently, ETH is trading near $1.75K while holding just above the short-term ascending trendline. This creates a near-term inflection point. As long as the trendline remains intact, buyers may attempt another push toward the $1.85K resistance zone.
A successful breakout above that area would significantly improve short-term sentiment and could accelerate a move toward the higher-timeframe supply zone around $2K.
Conversely, losing the ascending trendline would likely invalidate the recent recovery structure and shift focus back toward the $1.5K support area. A breakdown below that zone would restore full bearish control and increase the probability of continuation toward much lower price levels.

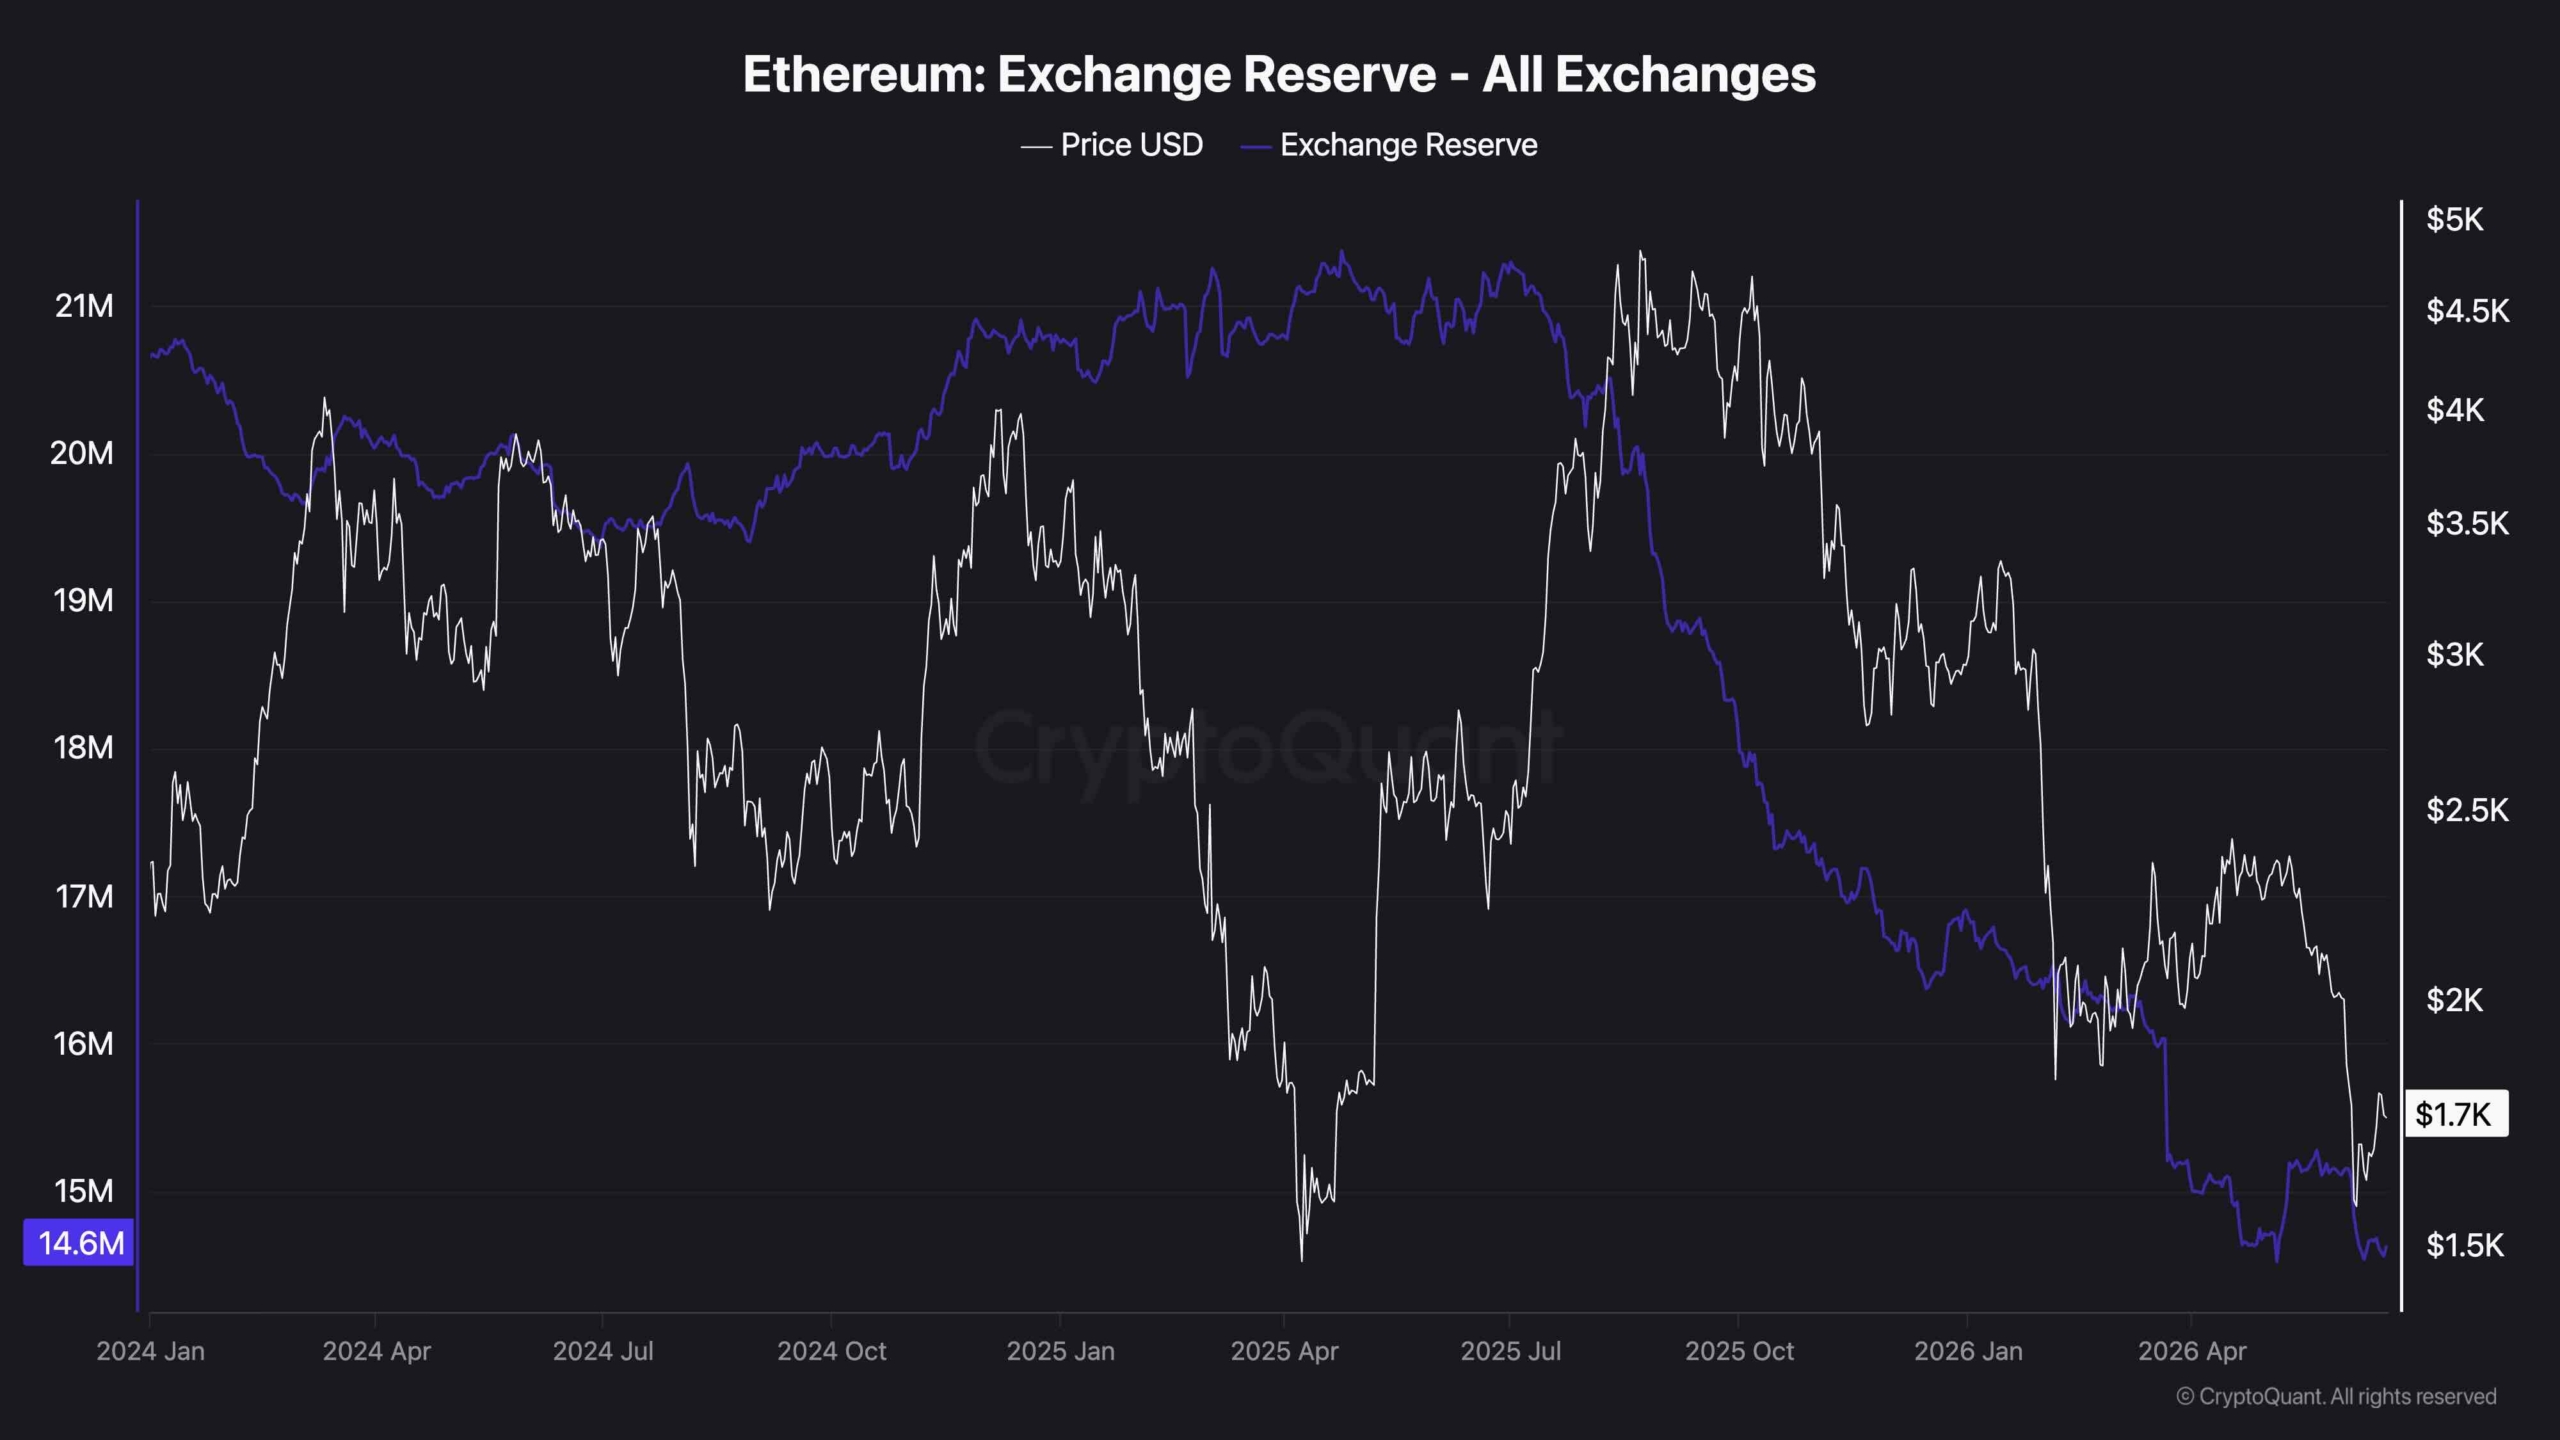
On-Chain Analysis
Ethereum’s exchange reserve continues to decline aggressively, reaching approximately 14.6 million ETH. The metric has been trending downward since mid-2025, even as the price has experienced substantial volatility.
A falling exchange reserve generally indicates that coins are being withdrawn from trading venues, reducing immediately available sell-side liquidity. Historically, sustained reserve declines tend to be viewed as a constructive long-term signal because they reflect accumulation and self-custody behavior among market participants.
However, the current divergence is noteworthy. Despite exchange balances falling to new lows, ETH remains unable to establish a bullish market structure. This suggests that macro sentiment and broader market conditions continue to outweigh the positive supply dynamics in the short term.
Nevertheless, if demand returns while exchange reserves remain near record lows, the reduced available supply could amplify future upside moves. For now, the on-chain backdrop remains structurally supportive, even though the technical picture still requires ETH to reclaim the $2K resistance region before a larger bullish reversal can be confirmed.
The post Ethereum Price Analysis: Sellers Remain in Control as ETH Recovery Hits a Wall appeared first on CryptoPotato.

Lite Strategy has invested $1 million in Litecoin Layer-2 developer ZK Innovations, extending its involvement beyond LTC accumulation and into infrastructure tied to the cryptocurrency’s future development.
Summary
- Lite Strategy invested $1 million in LitVM, a Layer-2 project bringing smart contracts to Litecoin.
- The deal gives Lite Strategy governance rights and potential exposure to future LitVM tokens.
- Santiment data showed Litecoin whale wallets rising despite weak transaction activity and recent price declines.
According to Lite Strategy, the funding gives the Nasdaq-listed company governance participation rights in the project and the opportunity to acquire a portion of LitVM’s future network tokens.
The investment centers on LitVM, a zero-knowledge Layer-2 platform designed to bring smart contracts, decentralized finance applications, tokenized real-world assets, and cross-chain liquidity tools to Litecoin.
The move comes as Lite Strategy continues to build one of the largest Litecoin treasury positions among public companies. According to the company, it currently holds about 850,000 LTC, representing roughly 1.1% of the mined Litecoin supply.
“We believe the best way to create shareholder value is not only to own Litecoin, but to help build the infrastructure that expands Litecoin utilization,” said Lite Strategy’s CEO and CFO, Jay File.
LitVM brings smart contract functionality to Litecoin
Details released by LitVM show that the platform is preparing to launch its mainnet infrastructure using BitcoinOS and Arbitrum Nitro technology.
According to the project, the network introduces zero-knowledge rollup scalability, Ethereum Virtual Machine compatibility, and trustless bridging for native LTC.
Through EVM compatibility, developers would be able to deploy existing Ethereum-based decentralized finance and tokenized asset applications on Litecoin with fewer modifications. Project documentation also states that LTC holders will be able to move native Litecoin onto the Layer-2 through a trustless bridge rather than relying on custodial solutions.
Charlie Lee, Litecoin’s creator and a member of Lite Strategy’s board, said the addition of a programmable layer could enable new use cases while maintaining Litecoin’s security and decentralized design.
For Lite Strategy, the investment links its treasury strategy more directly to ecosystem development. Company statements indicate that expanding Litecoin’s functionality could increase the utility and potential productivity of the LTC held on its balance sheet.
Whale accumulation continues despite weak network activity
Recent market data has drawn attention to Litecoin even as price performance and transaction activity remain subdued.
Last week, crypto.news reported that data from Santiment showed a steady increase in large Litecoin holders over the previous five months. According to Santiment, wallets holding at least 10,000 LTC increased by 42 addresses during that period, representing a 7% rise among the network’s largest holder groups.
At the same time, Santiment data showed transaction volume measured in U.S. dollars remaining near yearly lows. The analytics firm noted that large holders continued adding exposure despite weak network activity.
Discussion surrounding LitVM has also fueled social engagement around Litecoin. According to Santiment, conversations about the project and its zkLTC wrapper helped place Litecoin among the most discussed assets on its social-tracking metrics.
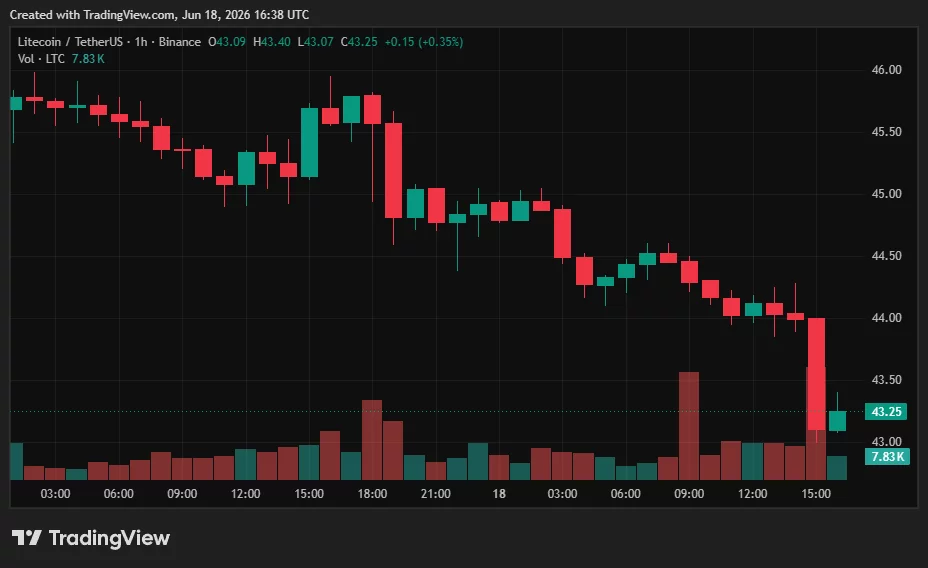
Market conditions have nevertheless weighed on LTC in recent sessions. Following the Federal Reserve’s latest policy meeting, where officials signaled a hawkish stance on future rate decisions, Litecoin moved lower alongside the rest of the crypto market.
Litecoin (LTC) price fell 5.6% over the past 24 hours and touched an intraday low of $43 on June 17, even as whale accumulation and attention around LitVM continued to grow.

Uniswap saw a jump in network activity this week after new institutional price expectations for its UNI token hit the markets and social media.
According to a report by Santiment, whale transactions on the network reached a 7-month high while active whale addresses climbed to a four-month peak.
Whale Transactions Rise
The uptick came as traders reacted to a long-term forecast by the Standard Chartered research team led by Geoff Kendrick that placed UNI at $100 by 2030. The team tied their outlook to an expected jump in tokenized assets that will move on-chain in the next couple of years, with their estimate standing at about $4 trillion by the end of 2028, up from about $340 billion today.
Furthermore, the researchers noted that tokenized assets active on DeFi will multiply at least 37 times in the next four years, with the implication being that the exact same growth could be seen in Uniswap’s liquidity pools.
According to them, Uniswap is well-placed to capture that growth, considering its role as a general-purpose trading infrastructure, its longevity and brand recognition, and its dominance in trading highly correlated asset pairs, given that it’s the biggest DEX in the market right now.
In relation to that, last weekend, Uniswap confirmed that tokenized equities such as Apple, Tesla, and NVIDIA were now accessible through its app and API. Furthermore, earlier in the year, the protocol enabled trading access for BlackRock’s BUIDL tokenized fund through UniswapX, with the resulting attention helping its token climb 40%.
Standard Chartered’s price prediction for UNI was direct: it goes to $6.50 by the end of this year, hits $20 by 2027 and reaches $40 by the end of 2028. After that, Kendrick and co. see the cryptocurrency going up to $65 by 2029 and $100 before the curtains fall on 2030.
The above would represent a 40x increase from the level at which UNI was trading when the note was published, with the bank also projecting that the #45 token could outperform both Bitcoin and Ethereum across that timeframe.
“Uniswap shocked traders with a +24% surge and massive whale activity and volume,” Santiment reported on X.
That was on June 17, and a day later, the on-chain analytics platform came back with more big news: that active addresses had hit a 4-month high, and whale transactions had gone up enough to match their level from seven months ago.
UNI Price Action
Looking at the price charts, UNI was trading near $3.10 at the time of writing, although it touched $3.65 at some point in the last 24 hours, its highest level since mid-May, according to CoinGecko data.
The token has gained almost 24% in the past week and over 16% across 14 days. However, it is still in the red over one month by nearly 12%, and year-on-year it’s down 58%.
The post Uniswap Whale Activity Hits 7-Month Peak Following $100 Prediction appeared first on CryptoPotato.

Key Insights
BlackRock’s BITA brings covered-call income strategies to Bitcoin markets.
BITA targets monthly payouts while preserving much of Bitcoin’s upside.
Bitcoin ETFs are evolving beyond access toward specialized portfolio tools.
BlackRock has launched the iShares Bitcoin Premium Income ETF (BITA), adding a new layer to the growing Bitcoin ETF market. Bitcoin traded near $66,100 during the fund’s launch period, while BITA debuted on Nasdaq with a net asset value above $53. The new product combines Bitcoin exposure with monthly income generation through an options strategy.
The launch marks another step in the expansion of institutional Bitcoin products. Unlike traditional spot Bitcoin ETFs, BITA focuses on generating income alongside market exposure. As a result, the fund targets investors seeking regular distributions instead of pure price appreciation.
BlackRock structured the ETF around direct Bitcoin exposure and holdings in IBIT. The firm then writes covered call options against part of the portfolio. Consequently, the strategy converts Bitcoin volatility into monthly premium income.
BITA Introduces Income Generation To Bitcoin Exposure
BITA seeks to track Bitcoin performance while producing monthly income through an actively managed options program. The fund writes call options on approximately 25% to 35% of portfolio holdings. Therefore, it can generate option premiums that may be distributed to shareholders.
The ETF launched with a sponsor fee of 0.65%. In addition, BlackRock designed the product to retain a significant portion of Bitcoin’s potential upside. The structure aims to balance growth participation with recurring income.
Covered-call strategies already hold a strong presence in equity markets. Asset managers have used similar approaches for years to create income-oriented products. BlackRock now applies that framework to Bitcoin as digital assets become more integrated into traditional finance.
Bitcoin ETF Market Shifts Toward Specialization
The arrival of spot Bitcoin ETFs removed many barriers for traditional market participants. Investors gained access to Bitcoin through standard brokerage accounts without handling wallets or private keys. Consequently, demand began expanding beyond simple price exposure.
Bitcoin ETF issuers now compete across different strategies rather than basic access alone. Products such as IBIT, FBTC, and ARKB focus on direct Bitcoin tracking. BITA, however, introduces an alternative approach centered on income generation.
This development mirrors trends seen in the broader ETF industry. Equity ETFs evolved from broad market funds into specialized categories over time. Similarly, Bitcoin ETFs appear to be entering a stage where product differentiation drives growth.
Institutional Adoption Creates Demand For New Bitcoin Strategies
Large financial institutions continue expanding their digital asset offerings. As Bitcoin gains acceptance within traditional portfolios, firms are developing products that address varying investment objectives. Therefore, income-focused strategies have emerged alongside standard spot exposure.
BITA may appeal to market participants seeking cash flow from Bitcoin-linked investments. At the same time, the structure limits part of the upside during strong market rallies. This tradeoff reflects the core characteristic of covered-call strategies across asset classes.
The fund’s launch highlights a broader shift in crypto investing. Asset managers increasingly adapt traditional financial strategies for digital assets. As a result, Bitcoin is moving closer to becoming a standard component within diversified portfolio construction.
Quick Overview
- Alchemy introduces AgentCard, providing AI agents with Visa payment capabilities.
- The solution connects AI agents to Visa infrastructure, cryptocurrency payments, and spending management.
- Developers gain transaction limits and identity verification tools for autonomous AI commerce.
- AgentCard offers developers unified API access for agent credentials and payment processing.
- Alchemy positions itself in the agentic commerce space with Visa-powered AgentCard technology.
Artificial intelligence agents can now access mainstream e-commerce through Alchemy’s recently unveiled AgentCard. This virtual Visa card solution provides agents with verified identity, transaction capabilities, and spending oversight via a streamlined integration. The release positions Alchemy strategically within the rapidly expanding agentic payments sector.
AgentCard Bridges AI Agents to Visa Payment Infrastructure
Alchemy developed AgentCard by partnering with Visa Intelligent Commerce, Visa’s comprehensive framework for AI-driven payment solutions. The platform provides developers with virtual Visa payment tokens specifically designed for agents executing online purchases. Additionally, it provisions a unique email address, phone number, and cryptocurrency wallet through a single API endpoint.
AgentCard utilizes Visa-issued tokens as its primary payment mechanism, enabling agents to transact across established card networks. Nevertheless, the platform also accommodates cryptocurrency transactions when merchants support digital assets. It further integrates with next-generation agent payment protocols, including x402 and Stripe’s Machine Payments Protocol.
The solution addresses developers creating agents requiring practical spending capabilities. Common applications include API subscription payments, digital service purchases, delivery orders, and automated marketing expenditure management. Alchemy anticipates AgentCard will facilitate prediction market participation and other continuous digital operations.
Alchemy Implements Safeguards for Autonomous Transactions
Alchemy engineered AgentCard with comprehensive spending safeguards that grant users precise control over agent activity. Developers can establish merchant restrictions, transaction thresholds, prepaid funding amounts, and budget constraints before agents execute payments. These protections minimize financial exposure while enabling agents to fulfill designated responsibilities.
AgentCard incorporates live transaction monitoring, allowing developers to observe agent expenditures in real time. Consequently, organizations can audit payments, identify anomalous patterns, and modify restrictions without overhauling the entire infrastructure. The platform maintains payment discipline while facilitating increased automation.
The company indicated AgentCard can adapt payment methods as merchant acceptance evolves. For instance, the system may leverage cryptocurrency or agent-specific protocols when accessible. This flexibility allows developers to incorporate additional payment alternatives without comprehensive agent reconfiguration.
Agentic Commerce Accelerates Throughout Payment Industry
AgentCard emerges as leading payment processors and blockchain companies develop infrastructure for agentic commerce. Visa introduced Intelligent Commerce in 2025 to enable tokenized authentication for automated purchasing and payment processing. Similarly, Mastercard unveiled its Agent Pay for Machines program targeting high-frequency machine-to-machine transactions.
Additional cryptocurrency platforms have entered this domain with wallet and card offerings. Oobit released virtual corporate Visa cards linked to USDT holdings for automated users. MetaMask also debuted Agent Wallet, providing bots with Ethereum-based service access.
Alchemy advances into this marketplace with extensive web3 infrastructure expertise and an established developer community. The company currently supports prominent onchain applications, making AgentCard a natural extension beyond blockchain connectivity. Through this launch, Alchemy unifies agent identity verification, Visa payment processing, cryptocurrency infrastructure, and expenditure management within a single offering.

World Cup 2026: South Africa fight back to earn draw against Czech Republic

Do We Need an 8K Media Player? Kaleidescape Says, “YES!” with New Strato K

anak kecil menemukan uang jatuh


-

 Business4 days ago
No Jackpot Winner as $257 Million Prize Rolls Over to $269 Million Monday Draw
-

 Fashion6 days ago
Weekend Open Thread: Tuckernuck – Corporette.com
-
Crypto World4 days ago
Zimbabwe Requires Crypto Businesses to Register Annually Under New FIU Regulations
-

 Crypto World5 days ago
Bitget enters Argentina’s regulated crypto market through PSAV registration
-

 Tech6 days ago
NanoClaw integrates JFrog registries to secure AI agent downloads
-

 Tech6 days ago
This Week In Security: Microsoft On Microsoft, Register Your Domains, Linux On ARM, And FreeBSD Joins The File Cache Club
-

 NewsBeat7 days ago
El Nino has formed in the Pacific and could set records, forecasters say
-

 NewsBeat6 days ago
FBI searches office of Ohio voter registration group
-
 Tech7 days ago
Anthropic is spending $150M to embed 1,000 AI fellows inside nonprofits. No degree required.
-
 Entertainment7 days ago
‘The Pitt’s Fan-Favorite Doctor Confirms Noah Wyle Gave His Blessing to Return [Exclusive]
-
 Crypto World7 days ago
Ripple and Bitso Bring MXNB Stablecoin to XRP Ledger
-

 Fashion7 days ago
Coffee Break: Scarf Waist Belt
-

 Tech7 days ago
Former AWS CEO Adam Selipsky to lead new $10B AI data center venture
-
 Entertainment4 days ago
Matt Damon’s Viral Sci-Fi Thriller Has Taken Over HBO Max
-

 Business4 days ago
Anthropic staff to meet White House officials next week, Axios reports
-

 Tech4 days ago
As AI companies race to go public, who else is along for the ride?
-

 Business7 days ago
Justin Bieber Prepares for 2026 Tour Return with New Music and Promoter Talks
-
 Crypto World4 days ago
Bitcoin could crash to $48,000, if this historical pattern is triggered
-

 Politics4 days ago
“Israel’s” ban on ICRC visits ruled illegal, but Knesset moves to stop them permanently
-
 Tech7 days ago
Euro-Office 1.0 Arrives To Open-Source Infighting: ‘Compatibility Is Not Sovereignty’
You must be logged in to post a comment Login