

Crypto World
XRP price prediction 2026-2030: beyond the SEC settlement


XRP trades near $1.39-$1.47 in late May 2026, down approximately 26% year-to-date and 34% year-on-year despite multiple institutional catalysts that historically would have driven significant price appreciation.
Summary
- XRP traded near $1.42 in May 2026 despite Ripple’s institutional deals and spot ETF launches.
- Ripple’s payment corridors largely use fiat and RLUSD instead of XRP as a bridge currency.
- The 2030 outlook ranged from $1 to $15, depending on CLARITY Act progress, ETF inflows, and direct XRP usage.
Five-spot (XRP) ETFs are now trading in the US with cumulative inflows of $1.53 billion since the November 2025 launch. Goldman Sachs disclosed a $153.8 million XRP ETF position. The Senate Banking Committee voted to advance the CLARITY Act on May 14, 2026 (15-9 bipartisan).
Ripple received conditional OCC approval for Ripple National Trust Bank in December 2025 and applied for a Federal Reserve master account. RLUSD stablecoin reached approximately $1.3 billion market cap after expanding to Ethereum Layer 2 networks. Ripple closed approximately 10 institutional deals in early 2026, including a tokenized Treasury pilot with J.P. Morgan, Mastercard, and Ondo Finance on XRPL. Standard Chartered targets $8 by year-end if the CLARITY Act passes the full Senate and ETF inflows reach $10 billion. Bitwise’s Juan Leon projects new all-time highs within 12-18 months.
Yet XRP price action has been disconnected from these catalysts. The reason matters: XRP price benefits from XRP usage and holding at scale, not from Ripple’s deal pipeline. Most Ripple institutional flow routes through fiat and RLUSD rather than XRP as a bridge currency. The price disconnect is structural rather than temporary. This piece walks through the actual mechanics, the bull case ($8-$15 by 2030), the base case ($3-$6), and the bear case ($1-$2.50), with the specific variables determining outcome.
Why XRP is at $1.42 right now
The current XRP price reflects a structural disconnect between Ripple’s institutional success and XRP token utility that competitor analyses keep missing.
The starting point: XRP reached approximately $3.65 in July 2025, driven by anticipation of CLARITY Act passage, spot XRP ETF launches, and broader institutional adoption. The subsequent decline to current $1.42 levels (60+% drawdown from peak) happened despite Ripple’s continued institutional success across multiple dimensions.
The Ripple institutional wins through 2026: spot XRP ETFs launched in November 2025, with cumulative inflows reaching $1.53 billion by May 2026. Goldman Sachs disclosed a $153.8 million XRP ETF position. Ripple received conditional OCC approval for Ripple National Trust Bank in December 2025. Application filed for Federal Reserve master account. RLUSD stablecoin reached a $1.3 billion market cap. Tokenized Treasury pilot with J.P. Morgan, Mastercard, and Ondo Finance on XRPL. Ripple secured a $200 million financing facility from Neuberger Specialty Finance for institutional brokerage. Approximately 10 institutional deals closed in early 2026.
The structural problem: most of this institutional activity does not generate sustained XRP demand at price-supporting scale. Ripple’s payment corridors largely route through fiat (USD, EUR) and RLUSD stablecoin rather than through XRP as a bridge currency. The institutional ETF flows ($1.53B cumulative) are meaningful, but a fraction of Bitcoin ETF flows ($120B+) that drove BTC’s institutional adoption. The Federal Reserve master account application, if approved, would let Ripple hold RLUSD reserves at the central bank but doesn’t directly create XRP demand.
The XRP utility gap: the original Ripple thesis depended on XRP serving as the universal bridge currency between fiat pairs in cross-border payments. Banks would need XRP to enable transactions, creating sustained institutional demand for the token. The actual deployment has been substantially different.
Banks have largely used Ripple’s payments network through fiat-to-fiat settlement or through stablecoin-mediated transactions rather than XRP-mediated transactions. The demand for XRP that would justify higher prices has not materialized in the way the original thesis required.
The RLUSD competitive dynamic: Ripple’s own RLUSD stablecoin has captured the institutional settlement role that XRP was supposed to serve. RLUSD provides the same cross-border settlement functionality without the volatility risk of XRP. Banks and institutional users prefer stablecoin settlement for accounting and risk management reasons. The result is that Ripple’s own product is fundamentally competing with XRP for the bridge currency use case.
The ETF dynamics: spot XRP ETFs launched with significant initial inflows, but the demand pattern has been more episodic than sustained. Weekly XRP ETF inflows fell from over $200 million in early 2026 to roughly $2 million by the end of March 2026, showing the lumpy and catalyst-dependent nature of institutional XRP demand. Without sustained ETF accumulation, the institutional capital that supports BTC and ETH prices doesn’t reach XRP at comparable scale.
The CLARITY Act dynamics: the bill passed the Senate Banking Committee 15-9 on May 14, 2026, providing the strongest legislative signal in years that XRP will be formally classified as a non-security. This is the most important near-term catalyst because it would remove the regulatory overhang that has constrained institutional XRP adoption since 2020. However, the bill still needs to pass the full Senate and be reconciled with the House version before becoming law. The path is plausible but not certain.
What the price action signals structurally: XRP responds to direct XRP demand (ETF inflows, on-chain activity, retail accumulation) rather than to Ripple’s enterprise success. The market has correctly recognized that Ripple’s institutional deals don’t necessarily translate to XRP demand. The current $1.42 price reflects this updated understanding. Future price appreciation requires catalysts that create direct XRP demand rather than just Ripple business success.
The bull case: $8-$15 by 2030
The bull case for XRP requires specific catalyst conditions that resolve the structural disconnect between Ripple’s success and XRP’s price.
The CLARITY Act passage: the bill must pass the full Senate (after the May 14 committee passage) and be reconciled with the House version, then signed into law. This would explicitly classify XRP as a non-security commodity, removing the regulatory overhang that has constrained institutional XRP adoption. The legal clarity would enable pension funds, insurance companies, and other compliance-restricted institutions to allocate to XRP for the first time since 2020.
The ETF flow scaling: current cumulative XRP ETF inflows are $1.53 billion. Standard Chartered’s bull case projection requires $10 billion+ in cumulative inflows. The 6-7x scaling would require sustained institutional accumulation at much higher rates than current episodic patterns. Bitcoin ETF accumulation provides the precedent: $120B+ in flows over 18+ months. XRP achieving even 25-30% of Bitcoin’s institutional ETF adoption would represent the required scaling.
The XRP-as-bridge-currency activation: the bull case requires Ripple’s payment corridors to actually route meaningful volume through XRP rather than through fiat or RLUSD. This is the hardest variable because it requires the original Ripple thesis to materialize after years of evidence suggesting it doesn’t. Specific paths: Federal Reserve master account approval enabling new bridge currency dynamics, regulatory changes incentivizing XRP usage for compliance reasons, technical advantages of XRP-mediated transactions becoming compelling versus alternatives, or specific large institutional users committing to XRP-based settlement.
The Federal Reserve master account: Ripple’s pending application for a direct Fed master account would enable RLUSD reserves to be held at the central bank, giving institutional-grade stablecoin infrastructure. Indirectly, this could create dynamics where XRP serves as the bridge between Fed-backed RLUSD and other crypto assets, generating sustained XRP demand. The approval is uncertain and likely depends on broader regulatory framework development.
The RLUSD market expansion: if RLUSD scales from its current $1.3B to a $10B+ market cap as the GENIUS Act stablecoin framework develops, the broader Ripple ecosystem expansion could create XRP demand through ecosystem fees, network effects, and bridge currency requirements for specific use cases. RLUSD success doesn’t automatically translate to XRP success, but creates ecosystem dynamics that could.
The institutional adoption beyond ETFs: institutional accumulation beyond ETF wrappers (direct XRP holdings by corporate treasuries, allocation to XRP by sovereign wealth funds, integration into prime brokerage offerings) would represent the demand the bull case requires. Goldman Sachs’s $153.8M ETF position is a positive signal but represents traditional asset manager allocation rather than corporate treasury or sovereign accumulation.
The XRPL ecosystem development: the XRP Ledger needs to become more than just a payments rail. The bull case assumes XRPL captures meaningful DeFi activity, becomes the settlement layer for tokenized real-world assets (the J.P. Morgan/Mastercard/Ondo pilot shows this potential), and develops the broader ecosystem that creates XRP demand for fees, governance, and network participation.
If all bull case conditions materialize, the price targets are:
2026 year-end: $4-7
2027 year-end: $6-10
2028 year-end: $7-12
2029 year-end: $8-14
2030 year-end: $8-15
The wide range reflects the multiple variables that must align. Standard Chartered’s $8 target for end-2026 represents the upper end of the bull case for that year. Reaching $15 by 2030 requires sustained execution across CLARITY Act passage, ETF scaling, XRPL ecosystem development, and ideally the XRP-as-bridge-currency thesis activating in ways that haven’t materialized over the past decade.
The base case: $3-$6 by 2030
The base case assumes the CLARITY Act eventually passes, but with delays, institutional adoption continues at the current pace, and the structural disconnect between Ripple’s success and XRP’s price partially resolves through gradual ecosystem development.
The CLARITY Act scenario: the bill passes the full Senate in late 2026 or 2027, gets reconciled with the House version, and becomes law in 2027. The delay vs immediate passage means institutional capital allocation takes longer to materialize. The legal clarity arrives, but the price impact is more gradual than the bull case envisions.
The ETF flow scenario: cumulative XRP ETF inflows reach $3-5 billion by the end of 2026, $5-8 billion by 2027, scaling to $8-15 billion by 2030. The growth is meaningful but slower than the bull case’s $10B+ by 2026 timeline. Institutional adoption follows the Bitcoin ETF trajectory at a smaller absolute scale.
The bridge currency scenario: XRP usage as bridge currency in Ripple’s payment corridors grows gradually as specific use cases emerge (CBDC interoperability, certain regulatory frameworks favoring XRP-mediated transactions, technical advantages in specific contexts). The growth is real, but represents 10-20% of Ripple’s total payment volume rather than the dominant share the original thesis envisioned.
The RLUSD continued dominance: RLUSD stays Ripple’s primary stablecoin product with a growing market cap ($3-5B by 2030 in base case). XRP serves a narrower bridge currency role rather than a universal bridge. The two products coexist with different use cases rather than RLUSD completely displacing XRP.
The Federal Reserve master account: approval comes in 2027-2028, but the broader institutional impact is gradual. Other major issuers (Circle, Tether) also receive similar arrangements, reducing Ripple’s competitive differentiation. The master account benefits Ripple business operations more than XRP price directly.
The XRPL ecosystem: develops meaningful but limited DeFi activity. Tokenized RWA settlement grows but represents a specialized use case rather than a dominant infrastructure. XRP demand from ecosystem fees grows, but doesn’t change price dynamics.
The competitive landscape: USDC, USDT, USD1, and other major stablecoins maintain a dominant position in the broader stablecoin market. RLUSD captures specific Ripple-ecosystem use cases without becoming dominant. XRP’s competitive position in bridge currency vs other crypto bridge solutions stays specialized.
Base case targets:
2026 year-end: $2-3
2027 year-end: $2.50-4
2028 year-end: $3-5
2029 year-end: $3-5.50
2030 year-end: $3-6
The base case represents moderate appreciation from current levels plus periodic volatility around catalyst developments. The structural floor is higher than pre-2025 levels because the regulatory clarity and institutional infrastructure have improved meaningfully, but the dramatic appreciation requires bull case conditions that may not materialize.
The bear case: $1-$2.50 by 2030
The bear case requires either specific XRP setbacks or broader market headwinds disrupting the institutional adoption thesis.
The CLARITY Act stall scenario: if the Senate Majority Leader doesn’t schedule full Senate floor vote before key recess windows, or if the floor vote fails to reach 60 votes for cloture, the bill could be shelved until the 2029-2030 congressional session. Standard Chartered’s $2.80 target for 2026 already assumes a delayed rather than failed passage. Complete failure would push targets significantly lower.
The ETF flow collapse: the episodic nature of XRP ETF flows (from $200M+ weekly to $2M weekly within months) could become structural. Without sustained accumulation, the institutional capital that supports prices doesn’t reach XRP at a meaningful scale. ETF flows could plateau or decline if institutional sentiment shifts away from XRP.
The bridge currency thesis failure: Ripple’s payment corridors continue routing through fiat and RLUSD rather than XRP. The structural disconnect between Ripple’s business success and XRP price persists or widens. The market continues to correctly price XRP for what the token actually does (limited bridge usage) rather than what the original thesis promised.
The RLUSD displacement: RLUSD or other stablecoins (USDC, USDT, USD1) capture all the institutional settlement use cases. XRP becomes a legacy asset with declining utility. The token’s primary value comes from speculative demand rather than structural utility.
The regulatory crackdown scenario: under different administration or shifting regulatory priorities, XRP could face renewed scrutiny. The SEC could pursue additional enforcement, the CFTC could impose restrictive frameworks on XRP-based products, or international jurisdictions could restrict XRP access. The regulatory uncertainty that constrained 2020-2024 could return.
The competitive disruption: alternative crypto bridge currencies (Stellar’s XLM, other payment-focused tokens, new entrants) capture institutional payment volume Ripple was supposed to serve. CBDCs replace cross-border crypto payment infrastructure entirely. The fundamental thesis for XRP utility could become obsolete.
The macro deterioration: broader crypto market weakness, recession dynamics, or other macro factors could disproportionately impact XRP as a higher-beta crypto asset. The institutional capital that has been supporting BTC and ETH could withdraw from XRP first as risk-off dynamics develop.
Bear case targets:
2026 year-end: $1.20-2
2027 year-end: $1-1.80
2028 year-end: $1-2
2029 year-end: $1-2.20
2030 year-end: $1-2.50
The bear case represents a significant downside from current levels but assumes XRP retains a meaningful market presence. Complete failure scenarios (price below $0.80) would require severe disruption to crypto markets generally or specific catastrophic events affecting Ripple or XRP specifically.
The five variables that determine outcome
Five specific variables determine which scenario materializes. Readers can monitor these directly rather than relying on price action alone.
Variable 1: CLARITY Act passage progress. The single most important variable. Senate Banking Committee passage (May 14, 2026) was step one. Required next steps: Senate floor vote, House reconciliation, presidential signing. Monitor: Senate calendar and scheduling decisions, key senator positions (Lummis, Gillibrand, Scott), House committee progress on companion legislation, White House signaling on signing intent.
Variable 2: XRP ETF inflow trajectory. Currently $1.53 billion cumulative since the November 2025 launch. Bull case requires scaling to $10B+ by the end of 2026. Base case assumes $3-5B by end-2026. Bear case assumes plateau at current levels. Monitor: weekly ETF flow data, large institutional positions disclosed in 13F filings, ETF product expansion (new issuers, additional product types), and competitive ETF dynamics.
Variable 3: XRP-as-bridge-currency activation. The hardest but most important variable for breaking the structural disconnect. Currently, most Ripple payment corridor volume routes through fiat or RLUSD. Monitor: Ripple’s quarterly transparency reports, ODL volume statistics, specific large institutional commitments to XRP-based settlement, and technical XRP usage metrics on XRPL.
Variable 4: Federal Reserve master account status. Ripple’s pending application would enable RLUSD reserves at the central bank. Approval timing and structure matter. Monitor: Federal Reserve regulatory announcements, OCC additional guidance on Ripple National Trust Bank, comparable arrangements for other stablecoin issuers, and broader Treasury Department policy on digital asset bank charters.
Variable 5: RLUSD market position and growth. Currently $1.3 billion market cap. RLUSD success indirectly affects XRP through ecosystem dynamics but also competes with XRP for bridge currency role.
Monitor: RLUSD market cap growth, exchange listing expansion, regulatory developments affecting stablecoin operations, and integration into major payment networks.
The five variables interact significantly. CLARITY Act passage would accelerate ETF flows. ETF flows would enable institutional accumulation that supports XRP-as-bridge-currency thesis. Federal Reserve master account would strengthen RLUSD, which could either compete with or complement XRP. The interconnections mean readers need to monitor all five variables to understand the full picture.
What this means for XRP holders and traders
For current XRP holders, the practical implication is that the asset’s price has decoupled from Ripple’s institutional success in ways that may persist. Holders should evaluate XRP based on direct XRP demand drivers (ETF flows, on-chain activity, regulatory clarity for direct XRP use) rather than Ripple’s enterprise deals. The five variables framework provides the relevant signals.
For potential XRP buyers, the practical implication is that entry at current $1.42 levels assumes meaningful catalysts (CLARITY Act passage, ETF flow scaling, bridge currency activation) will resolve favorably. The risk-reward calculation depends on the assessment of these catalysts rather than Ripple’s continued business success. The current price reflects what the token actually does, not what it might do if multiple catalysts align.
For traders specifically, the practical implication is XRP’s volatility is increasingly catalyst-driven rather than cycle-driven. CLARITY Act news, ETF flow data, and Ripple regulatory developments create episodic price movements. Between catalysts, XRP tends to range-trade with broader market dynamics. Trading strategies should focus on catalyst-driven moves rather than purely technical analysis.
For institutional investors evaluating XRP allocation, the practical implication is XRP offers a different risk-reward profile than other major cryptocurrencies. The regulatory clarity (likely arriving through the CLARITY Act) is the primary near-term catalyst. The institutional infrastructure (ETFs, Ripple banking, RLUSD ecosystem) is increasingly developed. The structural utility (XRP as bridge currency) remains uncertain. Allocation decisions depend on whether the regulatory and institutional catalysts will offset the utility uncertainty.
For the broader Ripple ecosystem, the practical implication is RLUSD’s success and XRP’s price are structurally complicated relationships. RLUSD could grow significantly without driving XRP appreciation if the stablecoin captures the use cases XRP was meant to serve. Ripple’s business strategy may need to address this dynamic explicitly through XRP-specific value capture mechanisms.
The honest bottom line
Ripple is winning. XRP is not. That’s the whole puzzle. Ten institutional deals closed in early 2026. Five spot ETFs are trading. Goldman holds $154 million in TDOG. Ripple got OCC trust approval and is waiting on a Fed master account. None of it has moved XRP off $1.42 because none of it routes meaningful volume through XRP itself. The bridge currency thesis the original Ripple pitch depended on has been quietly replaced by RLUSD and fiat rails.
The Ripple institutional success is real and continuing: 10+ institutional deals in early 2026, OCC trust approval, Federal Reserve master account application, RLUSD reaching $1.3B market cap, J.P. Morgan/Mastercard/Ondo tokenized treasury pilot, five spot ETFs trading. The business momentum is impressive by any standard.
The XRP price disconnect is also real and structural: XRP near $1.42 despite all of the above. The market has correctly recognized that Ripple’s deals largely route through fiat and RLUSD rather than XRP. The original bridge currency thesis has not materialized in ways that create sustained XRP demand at price-supporting scale.
The CLARITY Act passage is the most important near-term catalyst. The Senate Banking Committee’s 15-9 vote on May 14, 2026, was the strongest legislative signal in years. Full Senate passage, House reconciliation, and presidential signing would represent the most significant regulatory development for XRP since the SEC case began. The pathway is plausible but not certain.
The 2030 price range across scenarios is wide: $1-15, depending on how the structural variables resolve. The base case ($3-6) represents the most probable outcome assuming the CLARITY Act eventually passes with delays, ETF flows scale moderately, and the structural disconnect partially resolves. The bull case ($8-15) requires sustained execution across all variables. The bear case ($1-2.50) assumes adverse developments across multiple variables.
If you hold XRP, stop tracking Ripple press releases. They no longer move the token. ETF flows, on-chain XRP usage, regulatory clarity for XRP specifically, and bridge currency activation are what drive price. Ripple’s enterprise deals don’t translate to XRP demand unless they specifically route through XRP usage.
The CLARITY Act passage is the most important catalyst variable. Passage in 2026 would likely trigger sustained ETF accumulation, institutional capital allocation, and meaningful XRP appreciation. Delay beyond 2026 would extend the current price range. Failure would push targets significantly lower.
The bridge currency activation is the most important structural variable. The fundamental thesis for XRP utility requires demonstrated bridge currency usage at scale. Without this, XRP becomes increasingly dependent on speculative demand rather than utility demand. Watch for specific large institutional commitments to XRP-mediated settlement.
The RLUSD competitive dynamic is the most important downside risk variable. RLUSD success without corresponding XRP success would validate the bear case-specific concerns. RLUSD success plus XRP success would suggest broader ecosystem dynamics are creating XRP demand. The relationship between these two Ripple-affiliated assets will define the next phase of XRP’s evolution.
For 2026 specifically, expect XRP to trade in volatile ranges around $1.50-3.50, depending on CLARITY Act progress and ETF flow trajectory. The $1.30-2.50 range represents the setup if the CLARITY Act stalls. The $3-5 range becomes plausible if the CLARITY Act passes mid-year, plus sustained ETF flows.
For 2027-2030, the structural variables compound. Sustained execution across CLARITY passage, ETF scaling, and bridge currency activation produces the bull case trajectory. Deterioration across these variables produces the bear case. The base case assumes mixed outcomes producing moderate appreciation.
The XRP story is ultimately about whether the asset’s price can reconnect with Ripple’s institutional success. The early evidence is mixed. The regulatory pathway is improving. The institutional infrastructure is developing. The bridge currency activation stays elusive. The next 18-24 months will likely determine whether XRP achieves the institutional positioning the original thesis envisioned or remains a primarily speculative asset with limited utility-driven demand.
The disconnect between Ripple’s success and XRP’s price is the real question. The resolution determines which scenario plays out. The variables are observable. The outcomes are uncertain. The honest analysis requires holding both possibilities (resolution and continued disconnect) as live until specific evidence emerges to confirm one path.
Frequently Asked Questions
Why is XRP price low despite Ripple’s institutional success?
Ripple’s institutional deals largely route payment volume through fiat and RLUSD stablecoin rather than through XRP as bridge currency. The original XRP utility thesis required banks to use XRP for cross-border settlement, creating sustained institutional XRP demand. The actual deployment has used XRP minimally, breaking the connection between Ripple’s enterprise success and XRP’s price.
Can XRP reach $10 by 2030?
$10 is within the bull case range ($8-$15 by 2030). Required conditions: CLARITY Act passing full Senate and being signed into law, XRP ETF inflows scaling from current $1.53B to $10B+, Ripple’s payment corridors actually routing meaningful volume through XRP as bridge currency, Federal Reserve master account approval enabling new institutional dynamics, and sustained broader crypto market strength. The base case for 2030 is $3-$6.
What is the CLARITY Act’s specific impact on XRP?
The CLARITY Act would explicitly classify XRP as a digital commodity (non-security), removing the regulatory overhang that has constrained institutional XRP adoption since 2020. The classification would enable pension funds, insurance companies, and other compliance-restricted institutions to allocate to XRP. Standard Chartered projects $8 XRP by year-end 2026 if CLARITY passes full Senate and ETF inflows reach $10 billion.
How does RLUSD affect XRP’s price prediction?
RLUSD ($1.3B market cap as of May 2026) represents a structural competition with XRP for bridge currency role in Ripple’s payment corridors. RLUSD success can be neutral or negative for XRP if it captures use cases XRP was supposed to serve. RLUSD success can be positive for XRP if it expands Ripple’s ecosystem in ways that drive XRP demand. The relationship is complicated and depends on specific deployment.
Should I buy XRP now given the price disconnect?
This piece does not provide investment advice. The current $1.42 price reflects the market’s assessment of XRP’s actual utility versus Ripple’s broader business success. Buyers must evaluate whether the catalysts that would resolve the disconnect (CLARITY Act passage, ETF flow scaling, bridge currency activation) are likely to materialize. The five variables framework provides objective monitoring signals.
What are the main risks to the XRP bull case?
Six primary risks:
(1) CLARITY Act stalling beyond 2026 or failing entirely.
(2) XRP ETF flows plateauing rather than scaling to bull case levels.
(3) Bridge currency thesis continuing to fail to materialize.
(4) RLUSD or other stablecoins displacing XRP utility.
(5) Regulatory crackdown under shifting administration priorities.
(6) Competitive disruption from alternative payment-focused crypto assets or CBDCs replacing cross-border crypto infrastructure.
How does Goldman Sachs’s XRP ETF position affect the outlook?
Goldman Sachs’s $153.8 million XRP ETF position disclosed in 2026 represents the first major Wall Street institutional commitment to XRP. The position is significant for signaling but represents a tiny fraction of Goldman’s total assets under management. Sustained institutional accumulation would require expansion beyond Goldman to other major wealth managers, pension funds, and sovereign wealth funds.
What’s the difference between Ripple’s business success and XRP price?
Ripple is a private company that operates payment infrastructure, issues RLUSD stablecoin, holds OCC trust charter, and applied for Federal Reserve master account. XRP is a separate digital asset traded on public markets. Ripple uses XRP in some payment corridors but most institutional flow routes through fiat or RLUSD. Ripple’s success as a company does not automatically translate to XRP demand or price appreciation. This distinction is central to understanding XRP’s current price action.
This article is for informational purposes and does not make up financial or investment advice. Cryptocurrency markets are highly volatile and price predictions are inherently speculative. The figures and analysis described reflect data available as of late May 2026. Always do your own research and consult with qualified financial professionals before making investment decisions.


The launch delivers on a memorandum of understanding the two firms signed in August 2025 and builds on a relationship dating to 2016, when Ripple and SBI began working together on cross-border payments and blockchain infrastructure in Asia.
RLUSD will “serve as a bridge for payments, tokenization and collateral management,” connecting Japanese businesses to global dollar liquidity, said Jack McDonald, Ripple’s senior vice president of stablecoins, in a statement.
RLUSD is Ripple’s bet on the regulated end of the stablecoin market, and it is separate from XRP, the closely-linked token the company is best known for. Ripple has long pitched RLUSD as an enterprise token for settlements and tokenization, the practice of issuing real-world assets onchain.
The Japan launch extends that effort into Asia at a moment when stablecoins are drawing formal rules in the U.S., Europe and across the region, turning the dollar-token market into a race for official approval as much as for users.
Whether RLUSD can close the gap on USDT and USDC remains to be seen, however. Approvals like Japan’s give it the credentials to compete for institutional use, but it still has to convert that standing into the volume and liquidity its much larger rivals already command.

The bitcoin market has found a new support level, and Thursday’s U.S. core PCE release may test its mettle.
That level is $59,000, which has emerged as strong support, capping downside moves in recent days.
A support level in trading is a specific price point or range where a downtrend tends to pause or reverse, paving the way for a bounce as concentrated buying interest becomes strong enough to counter selling pressure. However, a single instance does not make a level a strong support. Traders typically look for at least two instances of price holding or bouncing from a specific level before identifying it as new support.
On Wednesday, as the sell-off gathered pace, prices fell to nearly $59,000 before bouncing back to $61,000 overnight. As of this writing, BTC is trading near $60,800, according to CoinDesk data. A similar move occurred earlier this month on June 5, when the sell-off lost steam near $59,000, paving the way for a bounce to $67,000 in the following days.
That explains why $59,000 is now the key support, a new line in the sand that bulls need to defend to avoid a deeper slide.
Ripple has launched its dollar-backed stablecoin Ripple USD (RLUSD) in Japan with SBI Group, following approval from the country’s Financial Services Agency.
Customers can now access RLUSD through SBI VC Trade’s VCTRADE platform. The rollout opens the regulated token to both institutional and retail users in Japan.
Ripple Opens RLUSD to Japanese Users
Japan reshaped its stablecoin rules this month. A new framework took effect on June 1, letting qualifying foreign stablecoins operate as regulated payment tools.
Under the rules, foreign-issued stablecoins are classified as electronic payment instruments under the Payment Services Act. RLUSD is also categorized as a new type of instrument under the Act.
Ripple’s Senior Vice President of Stablecoins, Jack McDonald, said RLUSD will act as a bridge for payments, tokenization, and collateral management. He framed it as a link between Japanese businesses and global liquidity.
“Japan has long been a leader in digital asset adoption, underpinned by both regulatory clarity and financial innovation. This launch marks an important step in expanding access to transparent, regulated USD-backed stablecoins like RLUSD for financial institutions, consumers, and businesses in Japan,” McDonald said.
Follow us on X to get the latest news as it happens
The launch fulfills a memorandum of understanding signed in August 2025. It also builds on a Ripple and SBI partnership that dates back to 2016.
The deal reflects SBI’s broader XRP push nationwide. Ripple’s wider Japan footprint also grew this year, with XRP gaining a spot listing on Rakuten Wallet.
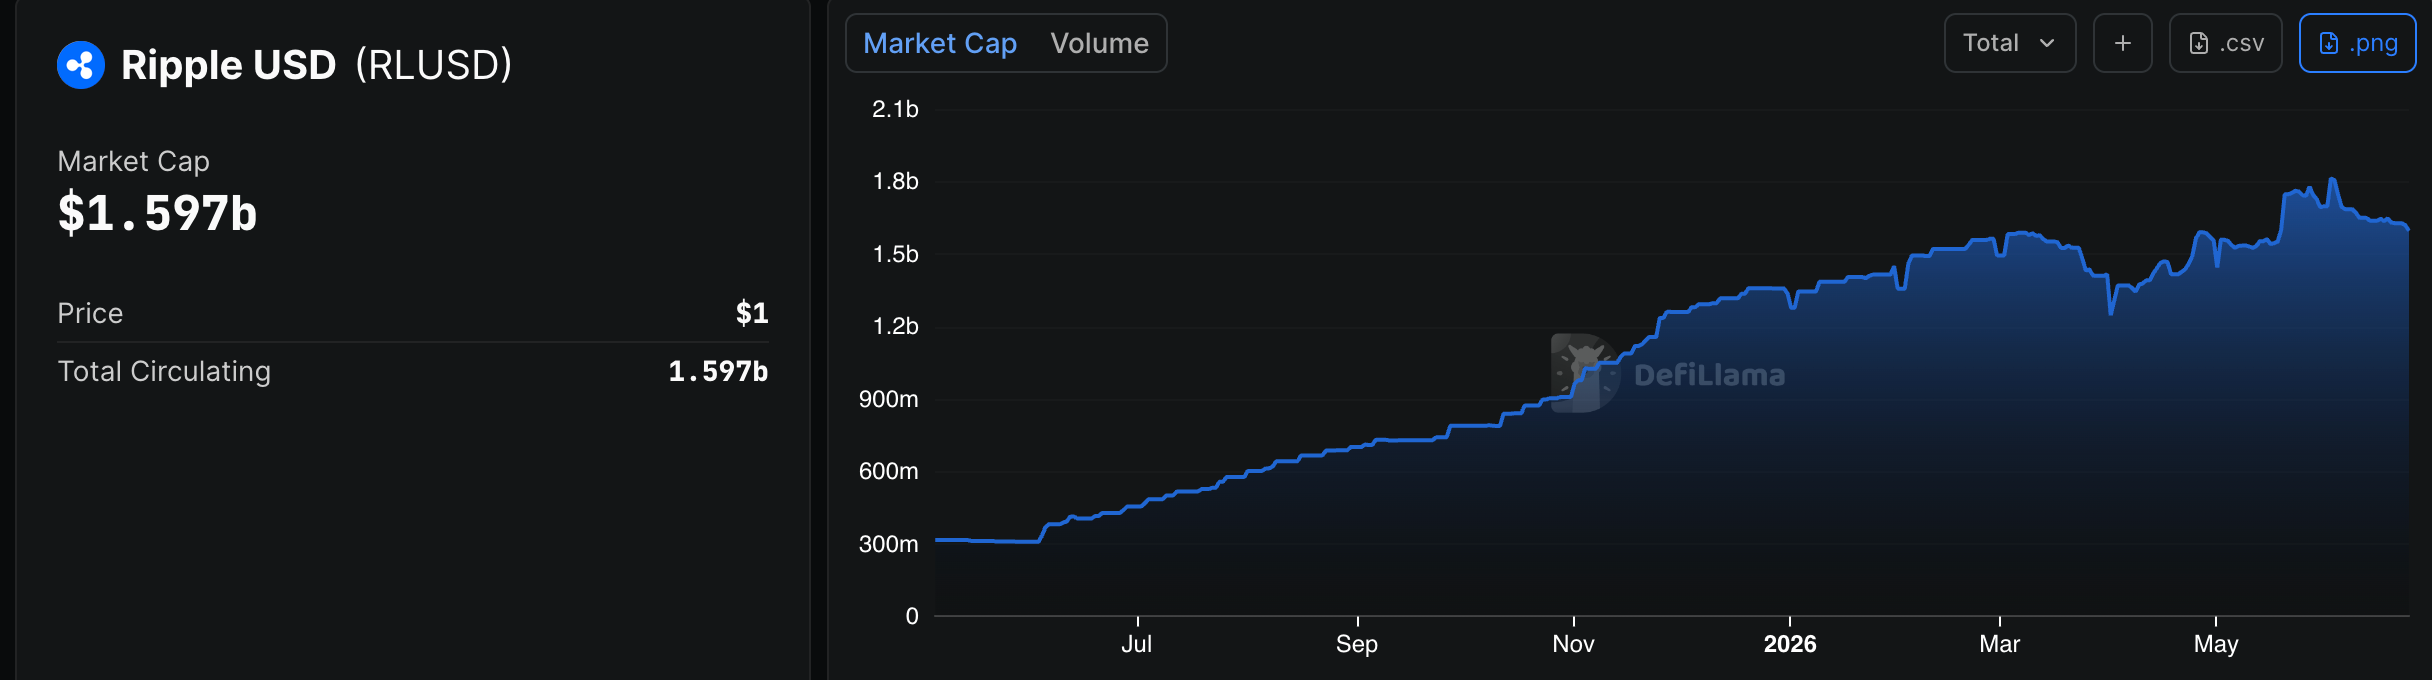
Meanwhile, the stablecoin has cooled since its early-June peak. Its market cap hit an all-time high of $1.8 billion then, but has since slipped to about $1.59 billion, according to DeFiLlama data. Even so, the market cap remains up roughly 271% over the past year.

The Japan entry follows RLUSD’s global expansion into other regulated markets. The coming months may show whether RLUSD can challenge incumbents in Japan’s regulated stablecoin market.
Subscribe to our YouTube channel to watch leaders and journalists provide expert insights
The post Ripple Targets Japanese Payments and Tokenization With New RLUSD Launch appeared first on BeInCrypto.


The pressure on crypto has become its own. The break below $60,000 reflects continued outflows from U.S. spot bitcoin ETFs, the Federal Reserve’s hawkish turn and a U.S. dollar that climbed to a seven-month high, said Alex Kuptsikevich, chief market analyst at FxPro, in an email to CoinDesk.
A stronger dollar makes dollar-priced assets like bitcoin costlier for foreign buyers and tends to pull money out of risk trades.
FxPro also flagged a longer-term warning. Bitcoin is hovering near its 200-week moving average, the average price over the past roughly four years and a closely watched long-term trend line.
The last three times bitcoin sank to that line, the weakness was prolonged rather than brief, lasting around nine months in 2015, six months in 2018 and roughly six quarters after the 2022 collapse. The firm said the pattern points to a crypto winter, an extended stretch of depressed prices, rather than a quick rebound.
For now, Kuptsikevich sees a band around $61,800 to $62,000 as the next test, a cluster of resting orders that could either pull the price up as short sellers are forced to buy back, or cap the bounce as resistance.
If support breaks, he said, $55,000 is a plausible cycle low. He urged traders to treat risk management as the priority rather than chase direction.


Abracadabra has started emergency measures after Magic Internet Money, its dollar-pegged MIM stablecoin, slid sharply below its $1 target.
Summary
- MIM’s 50% slide pushed Abracadabra into emergency rate hikes across active and deprecated Cauldron markets.
- Borrowers now have a cheaper repayment window as Abracadabra tries to shrink outstanding MIM supply.
- Paused Curve bribes and incentives show the protocol is shifting from growth rewards to stabilization.
The DeFi lending protocol said it was “acutely aware” of the depeg and would act to reduce the amount of MIM in circulation.
The team said it would raise interest rates across all Cauldrons, including older markets that users no longer actively use. Cauldrons are Abracadabra’s lending markets, where users post collateral and borrow MIM. Higher rates make open debt more costly, which can push borrowers to repay sooner.
The rate plan covers both live and deprecated markets, so older debt positions remain part of the response. Abracadabra has not set a fixed end date for the emergency changes.
Repayment becomes the main tool
Abracadabra framed the market discount as part of its recovery route. When MIM trades far below $1, borrowers can buy the stablecoin cheaper in the market and use it to repay debt at face value. That repayment burns or removes MIM from debt positions, reducing supply.
The protocol said the current depeg creates a “natural incentive” for borrowers to repay at a discount. It also said direct incentives and Curve bribes would stop until MIM returns to its peg. That marks a shift from rewards for liquidity to a narrower focus on repayment and supply control.
Liquidity pressure hits Curve pools
MIM relies on collateral, borrower activity and liquidity pools to stay near $1. Its main trading venues include Curve pools, where stablecoins need balanced liquidity to support swaps. When liquidity thins or becomes one-sided, selling pressure can move the token further from its target.
Abracadabra had already added $100,000 of MIM, USDT and USDC to a new Curve liquidity pool earlier in June. The team said at the time that the move aimed to restore pool balance after withdrawals linked to DeFi incentive changes. The latest rate action shows that the earlier liquidity step did not fully stop pressure on the peg.
Broader stress and recovery test
Market data showed MIM near $0.50 during the latest depeg update. The break came as crypto markets also weakened. As crypto.news reported, Bitcoin fell below $60,000 for the second time in June and triggered more than $850 million in liquidations.
The MIM crisis also follows a difficult stretch for DeFi security and lending markets. In a previous article, crypto.news discussed an Abracadabra exploit in October 2025, when attackers drained about $1.8 million from Cauldrons after using a logic flaw. That event was separate from the current depeg, but it kept attention on the protocol’s risk controls.
Abracadabra said its priority was to “restore confidence, improve market structure, and return MIM to a healthy peg.” The team also said it was reviewing more recovery plans and would share them once finalized. For now, the plan centers on making debt expensive to hold and cheaper to close.
The next test will come from borrower response and market liquidity. If repayments rise, MIM supply may contract and reduce pressure on the peg. If liquidity stays thin, the stablecoin could remain exposed to sharp moves across Curve and other trading venues.
Markets track debt closures, pool balances and price spreads closely.
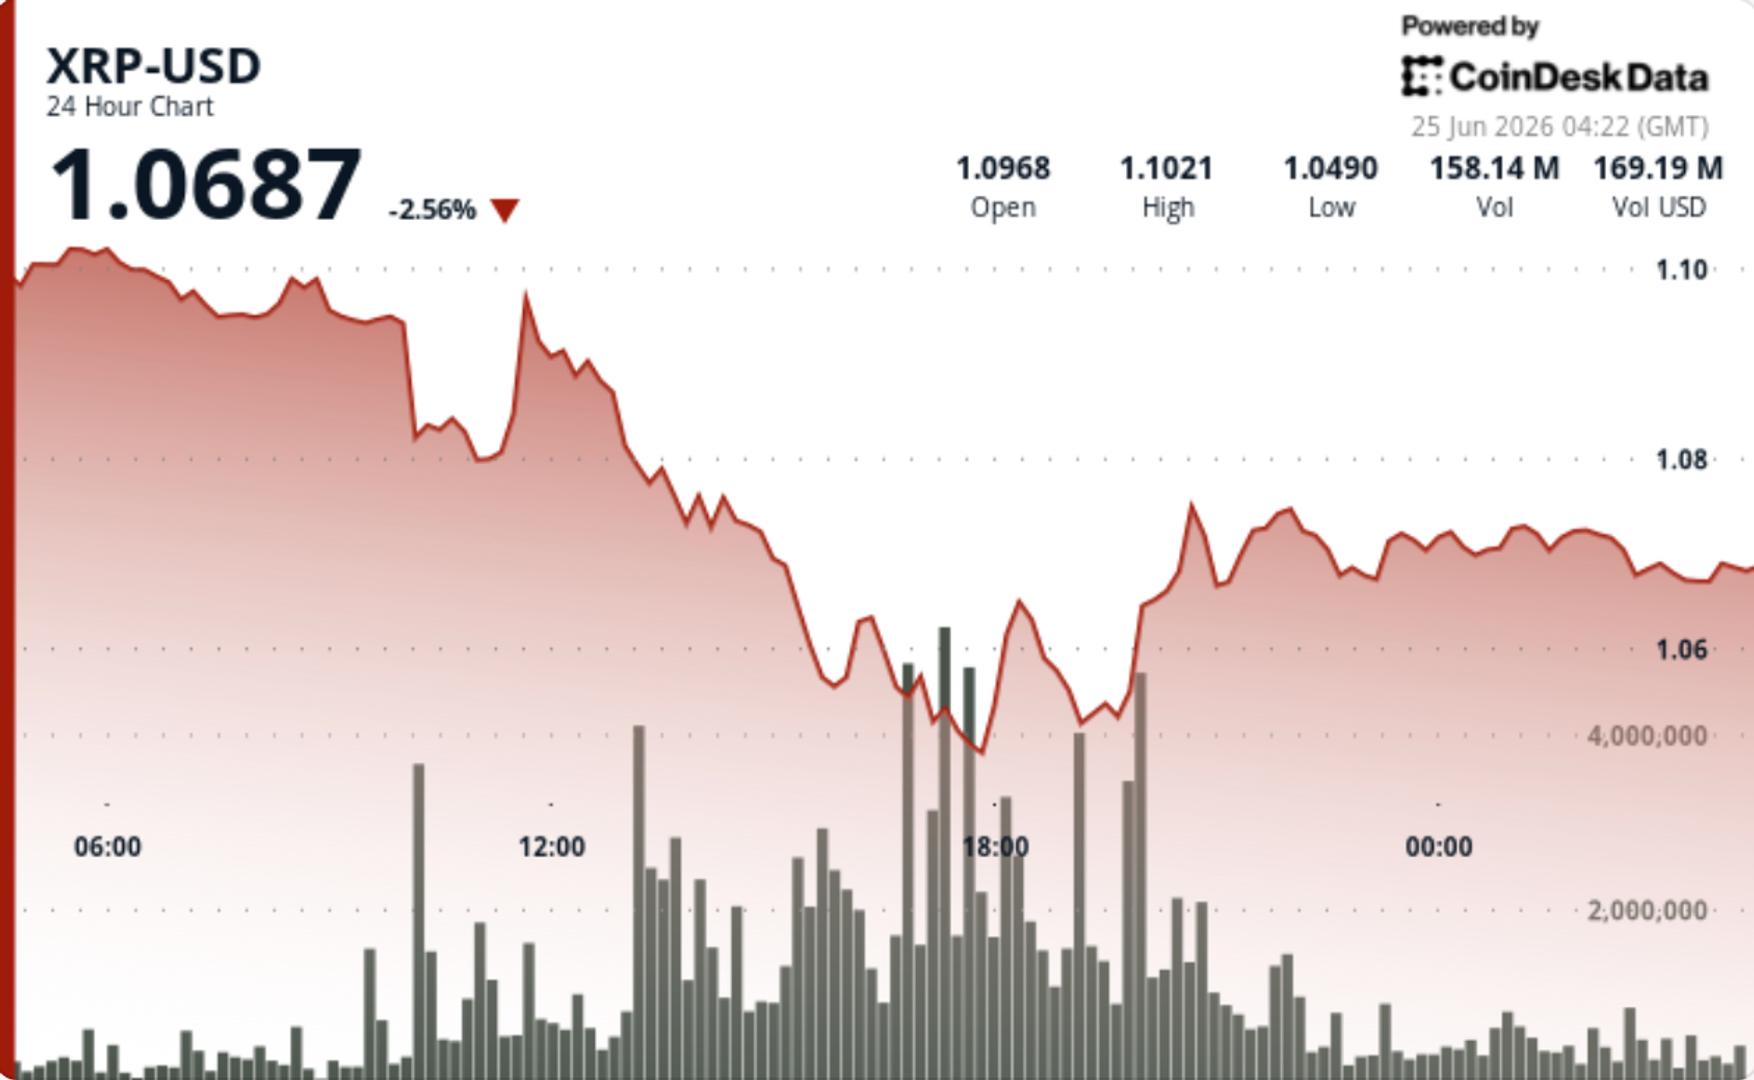

XRP lost $1.0850 during Tuesday’s selloff, then failed to win it back. That leaves the token sitting near the lower end of its June range, with buyers still defending the $1.05-$1.07 area but no longer pushing price far enough to change the tape. Every failed bounce makes $1 look a little closer.
News Background
• XRP traded lower alongside a broader crypto market pullback, with CD5 dropping nearly 3% as bitcoin and major tokens came under pressure.
• Analysts continue to frame the $1.05-$1.10 zone as a key support area for XRP, with a break below it likely shifting attention toward the psychological $1 level.
• Longer-term bulls still point to a multi-year falling wedge structure, but near-term price action remains defined by lower highs and repeated failed recoveries.
Price Action Summary
• XRP fell from $1.1020 to $1.0708 during the 24-hour session, losing 2.8%.
• The main breakdown came at 13:00 UTC, when volume surged to 117.26 million XRP and pushed price through support at $1.0850.
• Selling later drove XRP to an intraday low near $1.0446 before a modest rebound carried price back toward $1.07.
Technical Analysis
• The loss of $1.0850 shifted that level from support into resistance, leaving buyers with another overhead level to reclaim.

Ripple and SBI Group have launched Ripple USD, known as RLUSD, in Japan after approval from the Japan Financial Services Agency.
Summary
- JFSA approval now gives RLUSD a regulated Japan entry point through SBI VC Trade’s platform.
- Ripple’s stablecoin rollout targets payments, tokenization, and collateral management for Japanese users and institutions alike.
- The launch extends RLUSD’s Asia push after recent market access wins in Türkiye and beyond.
The dollar-backed stablecoin is now available through SBI VC Trade, the licensed crypto arm of SBI Group.
The launch gives both retail and institutional users access to RLUSD through the VCTRADE platform. Ripple said the approval places RLUSD under Japan’s Payment Services Act as a new type of electronic payment instrument for foreign-issued stablecoins.
As crypto.news reported, Ripple and SBI first outlined the Japan rollout in August 2025 through a memorandum of understanding. That agreement named SBI VC Trade as the local distribution partner and set an early 2026 target for market entry.
The official launch completes that plan and brings RLUSD into one of Asia’s closely regulated digital asset markets. SBI VC Trade already holds the required local license, giving Ripple a direct route to serve Japanese users under the country’s stablecoin rules.
Ripple targets payments and tokenization
Ripple has positioned RLUSD as a dollar stablecoin for payments, tokenized assets, and collateral use. The company said RLUSD has reached $1.7 billion in market value since its late 2024 launch.
Jack McDonald, Ripple’s senior vice president of stablecoins, said the launch expands access to “transparent, regulated USD-backed stablecoins” in Japan. He also said RLUSD can support payments, tokenization, and collateral management for businesses and users.
SBI VC Trade CEO Tomohiko Kondo called the rollout a “major milestone” in the long partnership between Ripple and SBI Group. He said the companies plan to expand services around RLUSD and develop more use cases for customers.
Global rollout reaches Japan
The Japan launch comes as Ripple continues to push RLUSD across markets and networks. As previously reported, Ripple made RLUSD available to institutions in Türkiye through BiLira, Bitexen, and Bitlo earlier in June.
Previously, crypto.news explored RLUSD’s expansion across more than 40 blockchain networks through Wormhole’s Native Token Transfers framework. That rollout moved RLUSD beyond its initial support on XRP Ledger and Ethereum, adding access through several Ethereum layer-2 networks.
In a previous article, crypto.news discussed Ripple’s role in tokenized finance after a tokenized Treasury settlement test on XRP Ledger. RLUSD served as part of the cash settlement layer in that broader institutional setup.
Japan has built a clear legal path for stablecoins through its Payment Services Act. That framework has attracted global issuers seeking regulated access to the market.
For Ripple, the launch adds another country to RLUSD’s global distribution map. For SBI Group, it adds a dollar stablecoin product to a platform that already serves Japanese crypto users.
The launch also extends a relationship that began in 2016, when Ripple and SBI started working on digital asset and blockchain-based finance in Japan and Asia-Pacific. Their latest step focuses on regulated stablecoin access rather than only cross-border payment rails.
RLUSD’s next test will depend on adoption from Japanese users, institutions, and businesses. The stablecoin enters Japan with regulatory approval, but usage will depend on liquidity, pricing, and demand for dollar-based digital settlement.
Bitcoin slipped to fresh two-week lows at the start of the Wall Street session on Wednesday, falling below $60,000 for the first time since June 10. The move reflects traders’ growing concern that the market is building pressure in the short term, even as many participants still frame the action as part of a broader range.
On the macro side, US stocks showed little immediate reaction to reported progress around US-Iran de-escalation efforts. Even with updated comments from President Donald Trump referencing the Strait of Hormuz route, risk assets remained largely stuck, limiting follow-through for a bullish impulse in crypto.
Key takeaways
- BTC traded below $60,000 for the first time since June 10, marking fresh two-week lows.
- Traders pointed to rising short interest and higher funding rates as reasons downside could extend before any bounce.
- A number of market commentators still expect a relief rally from lower time frames, with upside targets discussed closer to $70,000.
- US stock moves at the open were subdued despite Trump’s additional comments tied to the Strait of Hormuz.
BTC edges through $60,000 as traders watch for a low-timeframe bounce
TradingView data cited in market commentary showed BTC/USD dropping under the $60,000 level for the first time since June 10. For traders focused on intraday structure, the key question became whether this break signals a true trend change—or whether it represents a “range low” test that invites dip-buying.
Several participants suggested that conditions were becoming more conducive to a capitulation-style move. One recurring theme was the combination of rising short interest and increased funding rates, which can amplify sell pressure when leverage is positioned against the market.
Trader Killa argued that this was the time to begin looking for a bounce on lower time frames, using the “LTF” framing in his ongoing X commentary. In a separate post, he shared a chart scenario pointing to a relief move toward the vicinity of $70,000, described as something that should occur following the bounce structure he highlighted.
Another trader, RektProof, expressed a broadly similar view: Bitcoin, in his assessment, remained range-bound, with $60,000 acting as the “floor” that could hold for the remainder of the month. He added that the market could first move up to supply areas and then drop back toward “EQ lows” to set up a later sequence toward “poor highs + 70k,” keeping both the downside and the eventual rebound in play.
Why funding and positioning are getting attention
The focus on funding rates and short interest matters because it speaks to how much leverage is likely sitting on the wrong side of the move. When funding rises alongside increasing short activity, it can signal that traders are paying to maintain short exposure—or that crowded positioning is building a reflexive response if price stabilizes.
In that setup, analysts who expect a quick relief rally typically rely on a behavioral catalyst: once downside extends enough to trigger forced exits or reduce the viability of additional shorts, price can rebound sharply off the lower time frame structure. The reports from traders did not claim certainty, but they did converge on a similar near-term narrative: a downside attempt is plausible, yet a bounce from the range low is still the base case for many.
US market reaction appears muted despite Hormuz transit assurances
While crypto traders watched BTC’s chart levels, macro headlines were also in the background. According to the article’s reporting, US stocks appeared to have largely priced in relief related to US-Iran peace progress, leading to limited upside at the open.
President Trump described additional elements of cooperation on Truth Social, specifically referencing the Strait of Hormuz oil transit corridor. The post stated there would be “no tolls, no insurance costs, & no other charges of any kind being sought or received by Iran on ships traveling” via the route. Even with that detail, immediate price action in equities did not translate into strong risk-on momentum for the session.
At the time of writing in the source, the S&P 500 was up 0.4%, while the Nasdaq Composite had dipped slightly negative. This split—positive broad-market performance with a softer tech-heavy index—helped explain why the macro impulse was not strong enough to clearly lift sentiment across risk assets, including Bitcoin.
Traders also look ahead to upcoming data and earnings volatility
Crypto’s sensitivity to risk sentiment is often reinforced by scheduled economic and corporate catalysts. The earlier coverage referenced in the source highlighted factors that could keep enthusiasm restrained, including forward earnings guidance from Micron Technologies and the upcoming Personal Consumption Expenditures (PCE) index data due out on Wednesday and Thursday, respectively.
That matters because PCE is a key inflation gauge that can influence expectations for monetary policy. If inflation readings surprise, market pricing for rates can shift quickly—often affecting both equities and liquid crypto markets through broader liquidity and risk appetite channels.
For the next trading sessions, the main thing to watch is whether BTC holds the $60,000 area after this break and whether funding/positioning dynamics cool alongside any bounce attempts toward the $70,000 zone. If the market fails to reclaim support quickly, the range-low thesis may lose credibility; if it rebounds sharply, traders’ low-timeframe “relief” expectations could regain traction.
Bitcoin (BTC) is “compressed” at low levels but its classic cycles remain intact, say new research.
Key points:
- Bitcoin is acting similar to prior cycles as it circles a key four-year trend line.
- Analysis says that BTC price action is currently “compressed” as it trades below a $76,400 target.
- A new estimate put the bear market as just over 70% complete.
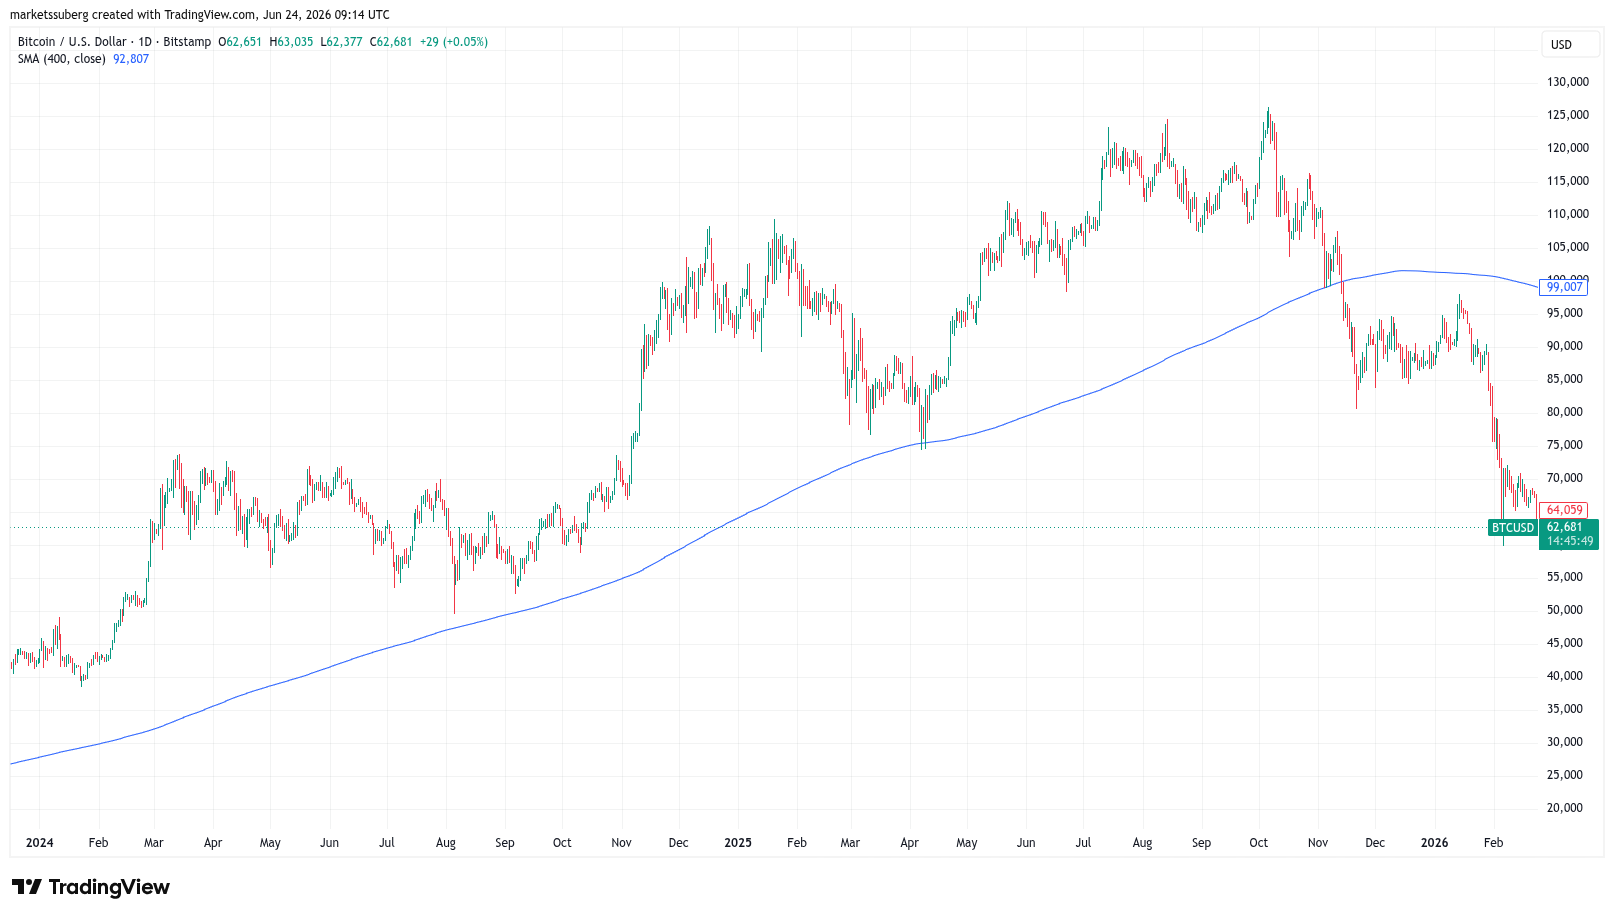
Analysis on $62,000 BTC price: Bitcoin “not broken”
In an X post on Wednesday, analyst David Eng said that BTC price action still “runs on two clocks.”
“400-day clock, $BTC looks cyclical. ~4-year clock, the cycle noise gets filtered out and the adoption structure appears,” he summarized.
Marking time for Eng are the 400-day simple moving average (SMA), as well as its four-year equivalent. The former is notable for its ability to act as support throughout Bitcoin bull markets, seeing no daily candle closes below it this cycle or last.

BTC/USD one-day chart with 400SMA. Source: Cointelegraph/TradingView
On four-year time frames, meanwhile, a cleaner uptrend emerges, with price fluctuating above and below the trend line depending on its position in the cycle.
“The point is that Bitcoin keeps stretching away from this adoption structure and then reverting back toward it,” Eng summarized.
Currently, the four-year trend line suggests a fair price of around $76,400, making BTC/USD undervalued by around 20%. A chart uploaded by Eng also shows Bitcoin’s Power Law price, this now well into uncharted territory at nearly $135,000.
“$BTC is not broken,” he concluded.
“It is compressed below its adoption structure.”
Bitcoin bear market losses could resume in August
As Cointelegraph reported, historical comparisons suggest that Bitcoin’s current bear market will continue for some months yet.
Related: US dollar strength hits highest since May 2025: Five things to know in Bitcoin this week
The latest estimates from trader and analyst Rekt Capital put the current downtrend at around 71% complete.
His analysis continues to focus on the fate of the 50-month exponential moving average (EMA), currently at $63,900.
“At this stage, if June Monthly Closes just like this at $62k then that would confirm the breakdown from the 50-Month EMA. So it July turns into a green month, then that could see price turn the 50 EMA into new resistance,” he told X followers.
“Then August would cancel out July and send Bitcoin into downside continuation.”
BTC/USD one-day chart with 50-month EMA. Source: Cointelegraph/TradingView
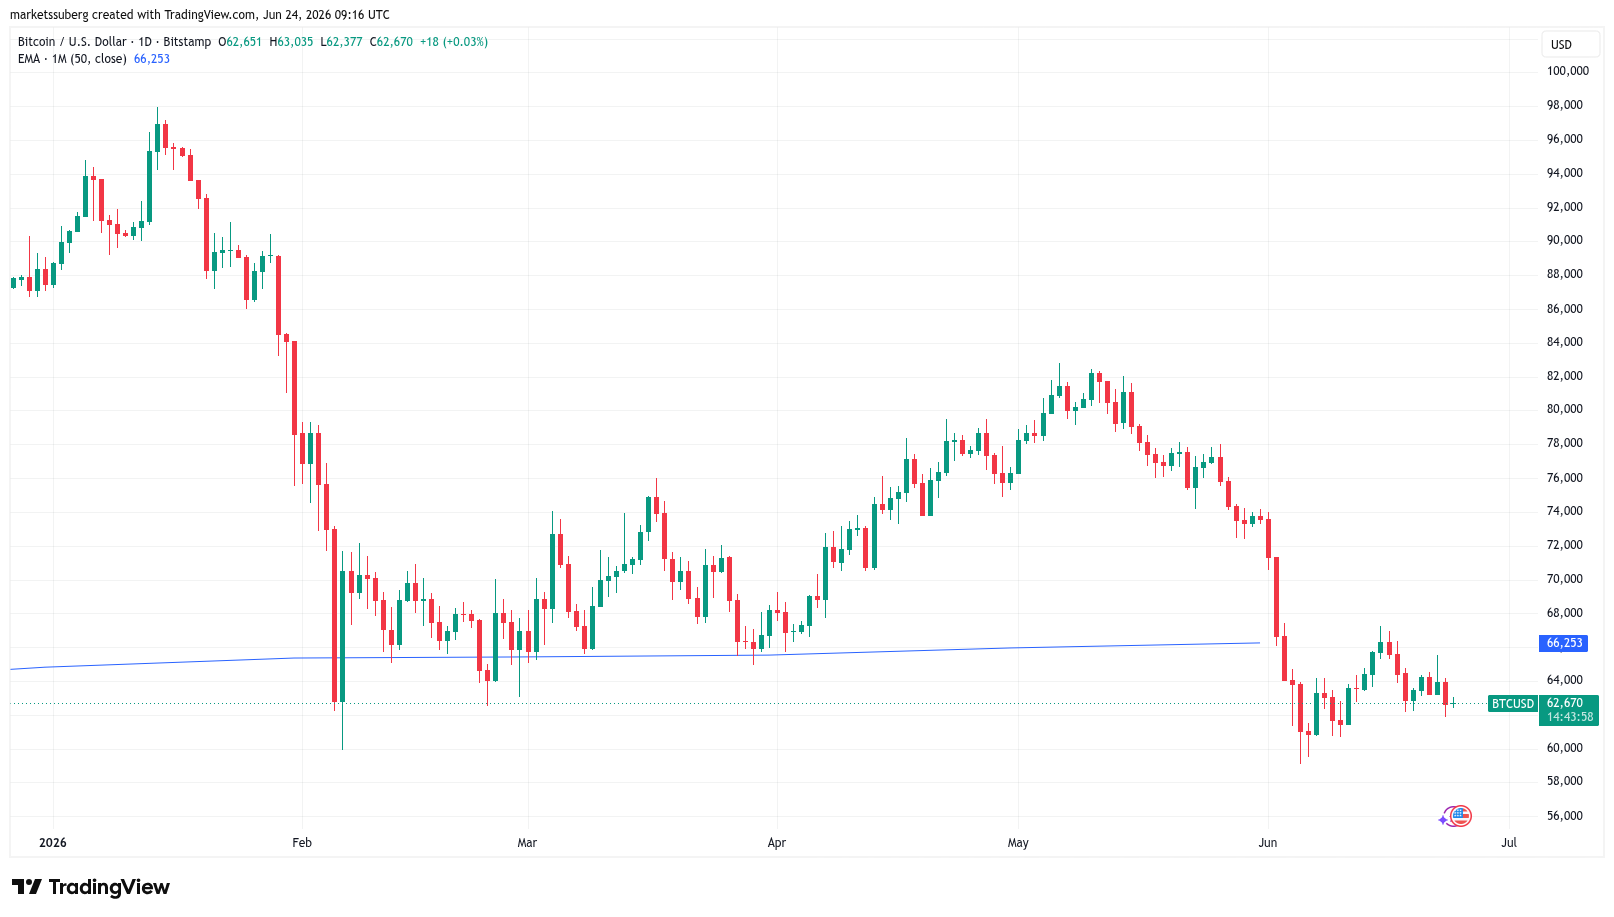
Michael Saylor’s Strategy (MSTR) is testing a technical setup that last appeared before the stock’s 99% collapse during the dot-com bubble burst in the early 2000s.
Key takeaways:
- MSTR is testing a monthly head-and-shoulders setup similar to the one that preceded its dot-com-era collapse.
- Strategy’s shrinking cash reserve and rising dividend obligations are increasing dilution risk for MSTR common shareholders.
MSTR bearish reversal pattern points to 80% downside risk
As of late June, MSTR’s monthly chart was painting a potential head-and-shoulders (H&S) pattern.
An H&S pattern develops when the price forms three peaks, with the middle peak, called the “head,” being steeper than the other two, which are called “shoulders.” The neckline is the support level connecting the major pullbacks between those peaks.
The pattern typically resolves when the price breaks below the neckline and, in a perfect scenario, falls by as much as the maximum distance between the head and the neckline.

MSTR monthly performance chart. Source: TradingView
MSTR has formed a near-perfect H&S pattern since March 2024 and risks a breakdown below the neckline support at $100–$105.
A decisive move below it would confirm the bearish setup. It could open the door to a deeper, multi-year correction toward the measured target of around $20, down approximately 80% from current levels.
The structure looks similar to the head-and-shoulders top MSTR formed during the dot-com bubble era. Back then, the stock broke below a comparable neckline setup before collapsing by more than 99% from its peak in two years.
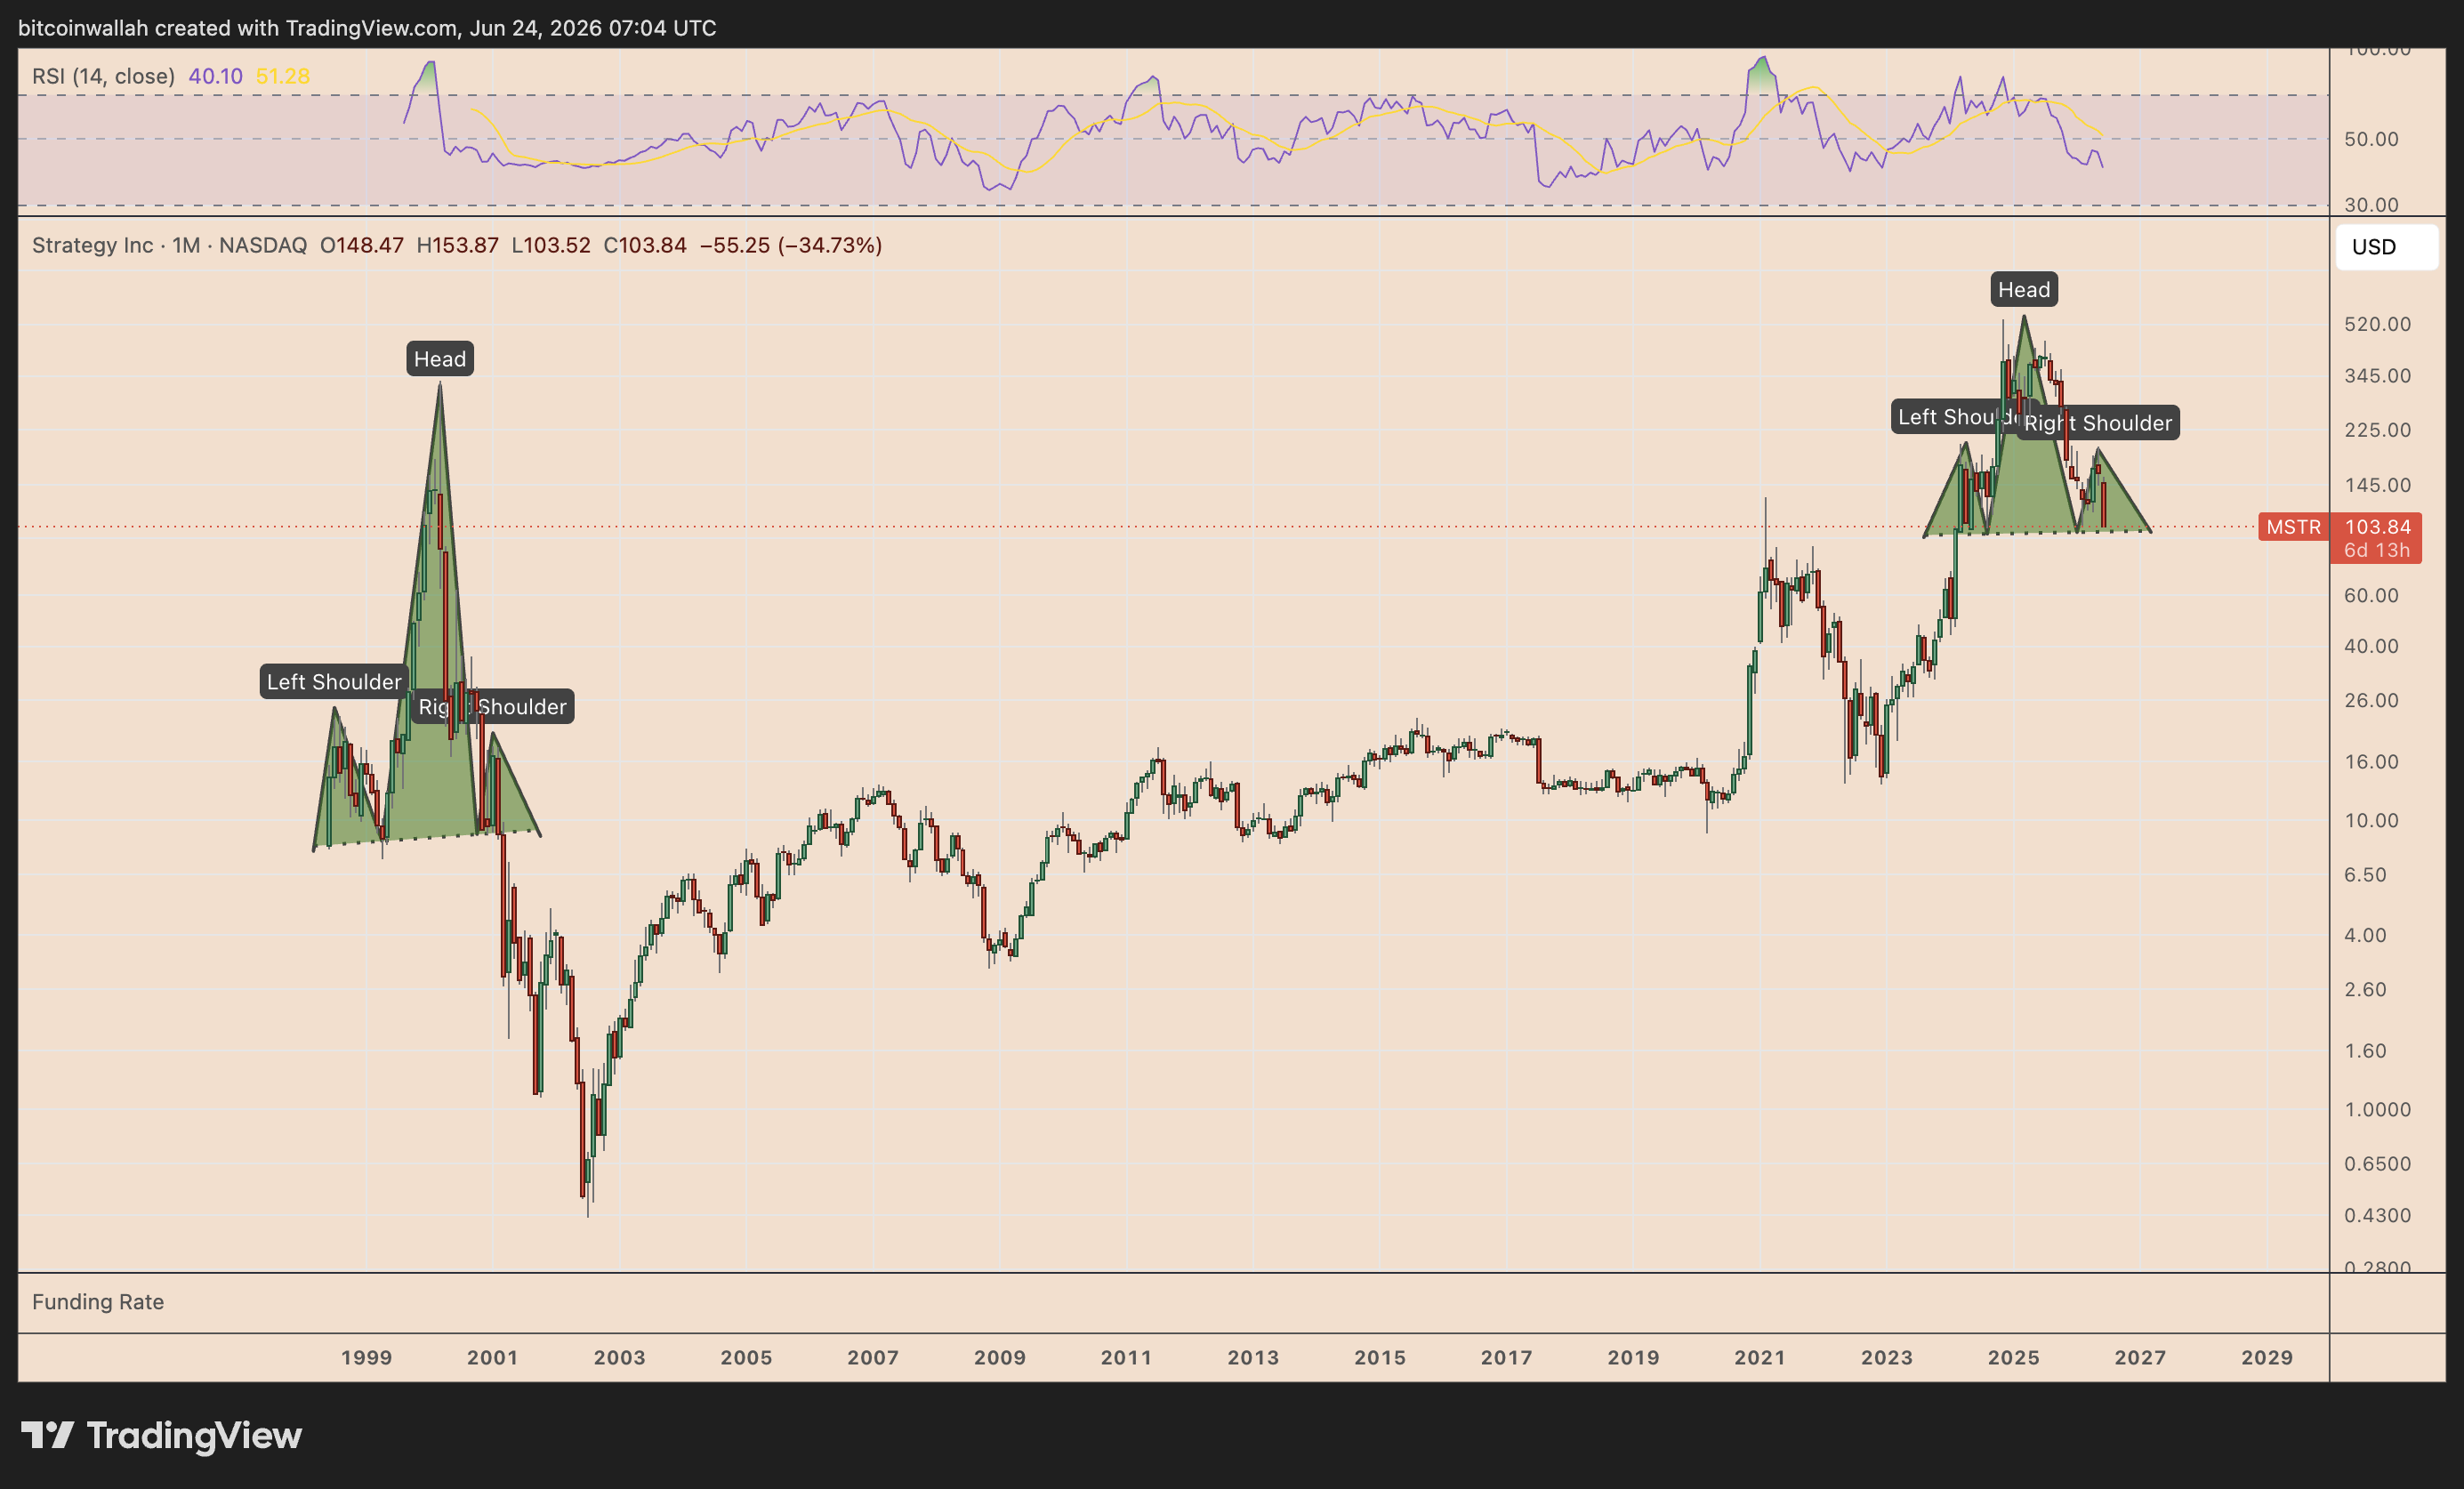
MSTR monthly performance chart. Source: TradingView
Strategy cash squeeze raises dilution risk for MSTR shareholders
Strategy’s common stock, MSTR, is facing fresh dilution risk as the company’s cash reserve shrinks and its preferred-stock dividend burden grows.
As of June, Strategy’s US dollar cash reserve had fallen 38% since the start of 2026, while its yearly dividend obligations had nearly quadrupled to $1.2 billion, according to CryptoQuant analyst Julio Moreno.
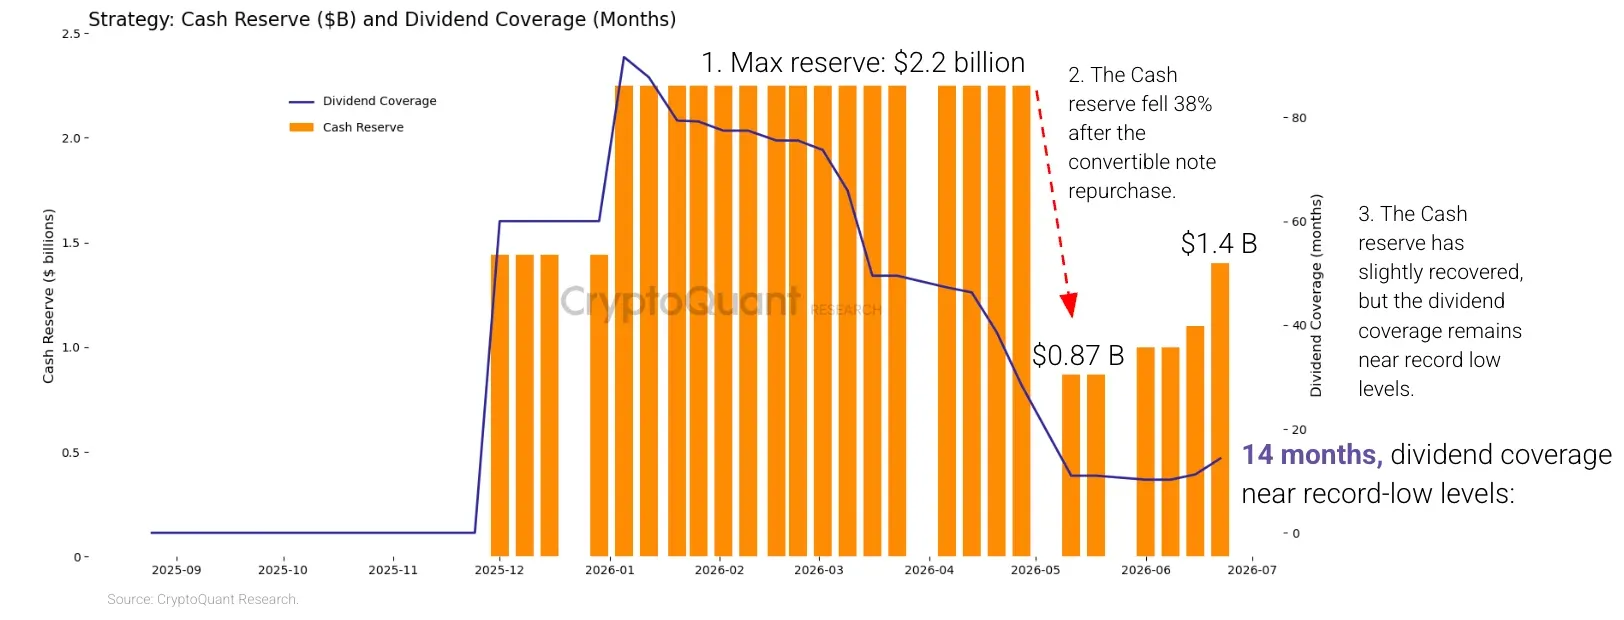
Strategy cash reserve and dividend coverage. Source: CryptoQuant
The company uses cash to pay dividends on its preferred stocks, primarily Stretch (STRC).
But Moreno said Strategy’s preferred-dividend coverage has dropped to about 14 months from more than seven years, meaning it now has enough cash to cover just over one year of STRC dividend payments.
That pressure has shown up in STRC’s market price. STRC fell to a record low of $82.50 last week and has since stayed mostly between $82 and $89, well below its $100 par value.
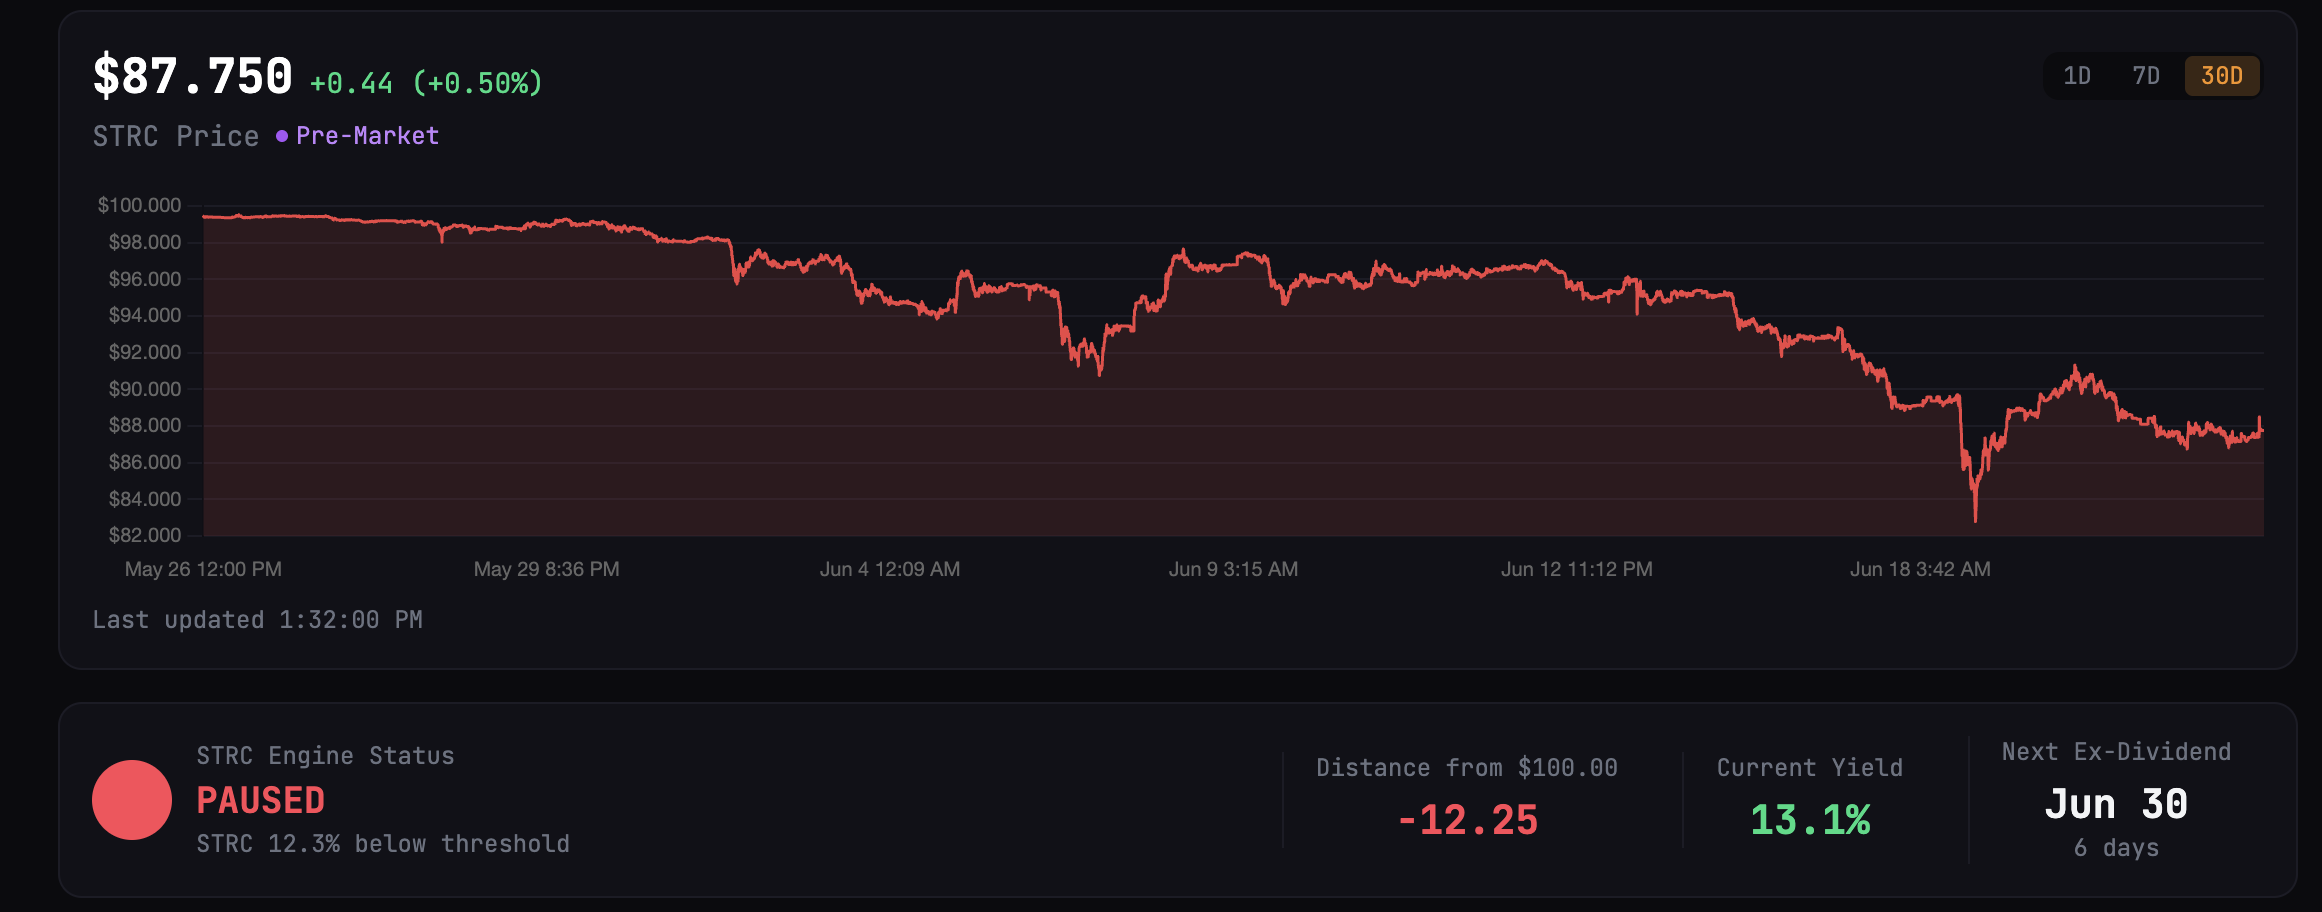
STRC price and yield chart. Source: STRC.LIVE
The decline has pushed STRC’s effective yield above 13%, compared with its stated dividend rate of about 11.5%, showing investors are demanding a higher return to hold it.
“At current dividend obligations of $1.2 billion per year, restoring 24 months of coverage would require a cash reserve of approximately $2.8 billion, roughly twice what Strategy holds today,” Moreno said, adding:
“A higher cash reserve is the most direct signal the market needs to regain confidence in STRC.”
Strategy holds 847,363 BTC, acquired at an average price of about $75,650 per coin, higher than today’s BTC price of around $62,600. Selling Bitcoin during a downturn could lock in losses and weaken its long-running accumulation narrative.
Instead, Strategy has raised STRC’s dividend rate and issued more MSTR common shares to raise cash. For instance, the company sold 2.71 million MSTR common shares for about $335.5 million in June, while using only $34.9 million of the proceeds to buy 520 BTC.
That keeps Strategy’s Bitcoin holdings largely intact, but it increases dilution risk for existing MSTR shareholders.
Related: Bitcoin price is down over 40% since STRC launched: Is Strategy ‘fine’?
If STRC remains below $100, Strategy may need to keep issuing common shares, slow Bitcoin purchases, or rebuild cash reserves. Each option could weigh on MSTR as the stock tests a bearish technical breakdown.

Ripple’s RLUSD stablecoin goes live in Japan after regulatory approval

19 pictures – North East bakes in heatwave on record hot day

Why ‘anti-racist’ training should have no place in our schools


-

 Fashion5 days ago
Weekend Open Thread: Miami – Corporette.com
-

 Entertainment4 days ago
Renter of Home in Anne Heche Crash Denies Settlement With Son
-
 Sports1 day ago
Two goals and an assist by sheer aura: Cristiano Ronaldo just entered the World Cup chat
-

 Tech3 days ago
Microsoft accidentally kills epic Outlook email threads
-

 Business4 days ago
Soccer-U.S. defends Iran World Cup travel restrictions, says discussions ongoing
-
Crypto World1 day ago
Bitcoin (BTC) Dips Below $62K, Ethereum (ETH) Plunges 6% Daily: Market Watch
-

 Politics5 days ago
Andy Burnham and the meaning of Makerfield
-

 Politics6 days ago
BBC Reporter Discusses Cross Party Criticism Of Trumps Iran Deal
-

 Crypto World22 hours ago
Securitize Wraps Roubini's SEC-Registered ETF as Dubai VARA Digital Security
-
Business1 day ago
Entergy settles forward sale agreements, raises $672 million in cash proceeds
-
 Business5 days ago
Wall Street Week Ahead: Investors see Micron earnings as pulse check of AI rally momentum
-

 NewsBeat6 days ago
Keir Starmer Allies Question His Chances For No 10
-

 Tech7 days ago
AWS enters the context layer race with a graph that learns from agents, not manual curation
-
 Crypto World5 days ago
Can Charles Hoskinson Really Rescue Cardano?
-

 Crypto World5 days ago
HIVE shares jump as $220M AI deal speeds Bitcoin mining pivot
-

 Crypto World5 days ago
Jake Chervinsky accuses CME of protecting derivatives monopoly
-
 Tech4 days ago
Signal’s Meredith Whittaker says AI chatbots ‘are not your friends’ and calls Copilot agents a backdoor
-

 Entertainment5 days ago
Jose Alvarado Wants Taylor Swift at More Knicks Games
-

 Tech2 days ago
Nearly 7,000 fake Amazon domains registered ahead of Prime Day 2026, researchers warn
-

 Business6 days ago
Brexit cost 6% of UK economy, Bank of England company data suggests
You must be logged in to post a comment Login