Crypto World
XRP price’s latest bounce lacks follow-through as sellers stay in control

XRP edged higher over the past 24 hours, rising roughly 2% in a modest relief move after last week’s sharp sell-off.
Summary
- XRP price rose about 2% in the past 24 hours, but the move shows little follow-through as momentum and volume indicators continue to favor sellers.
- RSI remains below neutral and on-balance volume is still trending lower, suggesting recent gains are driven by short-term relief rather than sustained buying interest.
- Fibonacci retracement levels point to heavy resistance between $2.05 and $2.30, a zone XRP price would need to reclaim to shift its short-term outlook.
But despite the uptick, the Ripple token’s (XRP) chart indicators suggest the bounce offers little cause for celebration, with sellers still firmly in control of the broader trend.
XRP price holds near $1.45, but broader downtrend remains intact
On the daily chart, XRP remains locked in a clear downtrend, marked by a series of lower highs and lower lows since late January. While price has stabilized near the $1.45 level after briefly dipping toward recent lows, the move appears more like short-term consolidation than the start of a meaningful recovery.
Momentum indicators reinforce that cautious view.
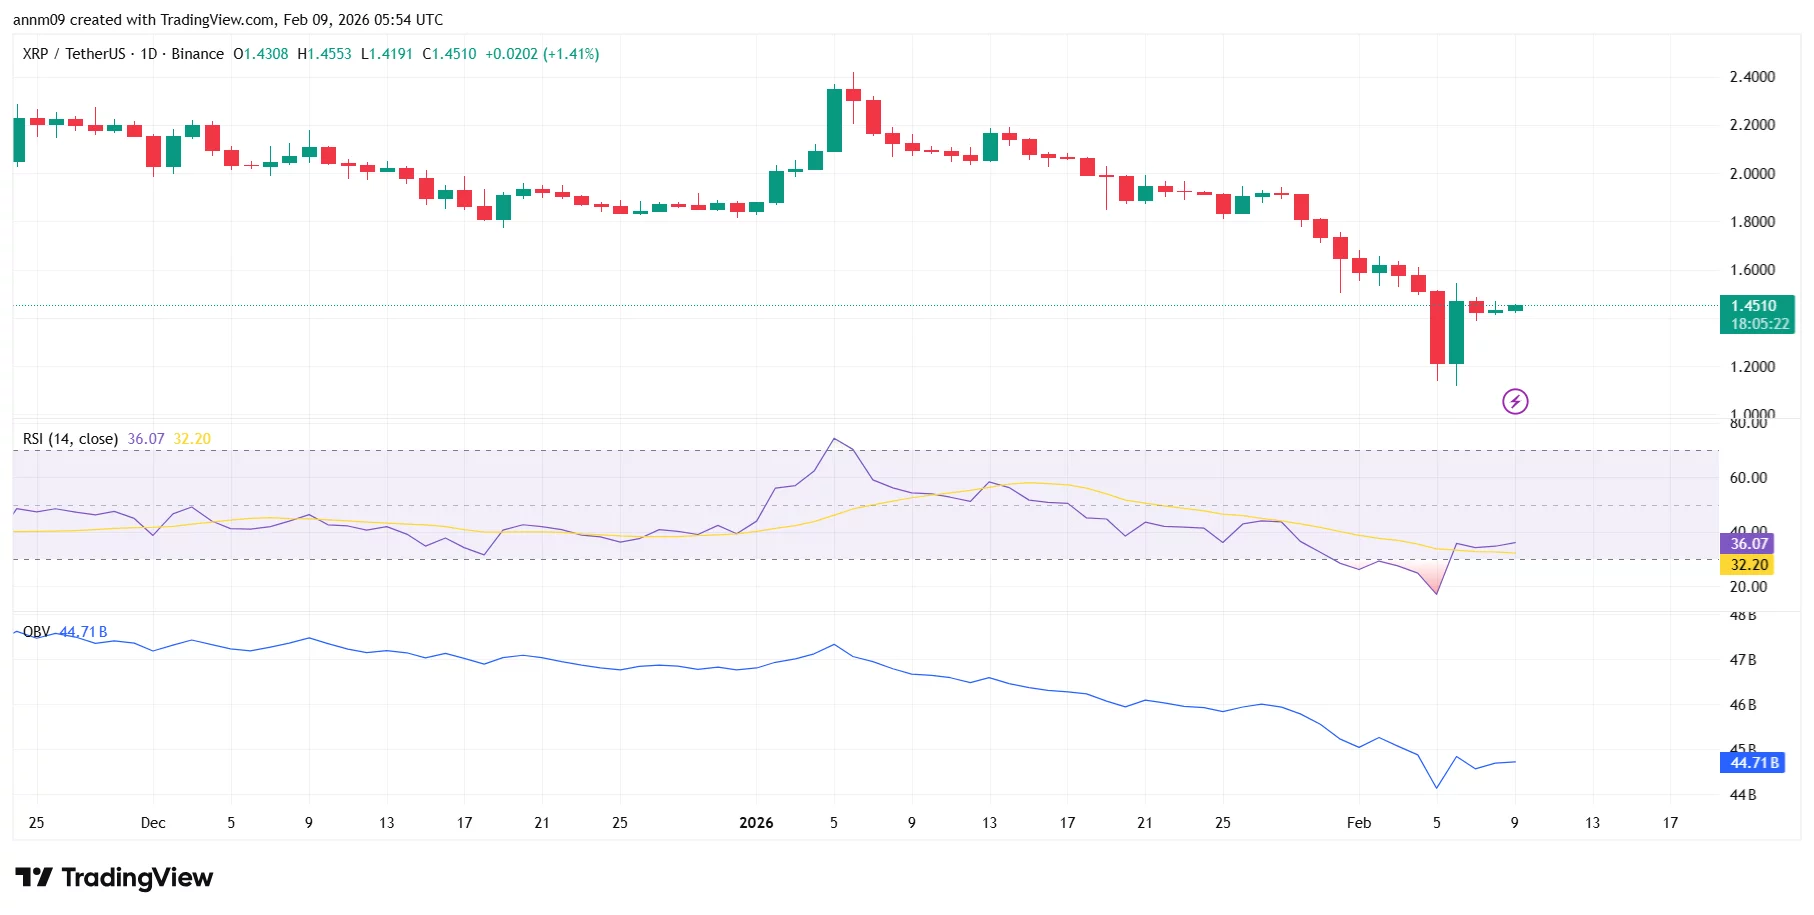

The relative strength index (RSI) is hovering in the mid-30s, well below the neutral 50 mark, indicating bearish momentum remains intact even after the latest bounce. Historically, sustained recoveries tend to coincide with RSI reclaiming neutral territory, something XRP has yet to achieve.
Volume-based indicators also point to continued selling pressure. On-balance volume (OBV) has been trending lower, suggesting that distribution is still outweighing accumulation. This implies that recent green candles may be driven by short covering or temporary relief rather than fresh buying interest.
XRP price faces heavy resistance near $2.05–$2.30 fibonacci zone
From a trend perspective, XRP is trading well below its 20-day simple moving average, currently near $1.68. The downward slope of that moving average underscores the lack of bullish follow-through and signals that rallies are likely to face selling pressure at higher levels.

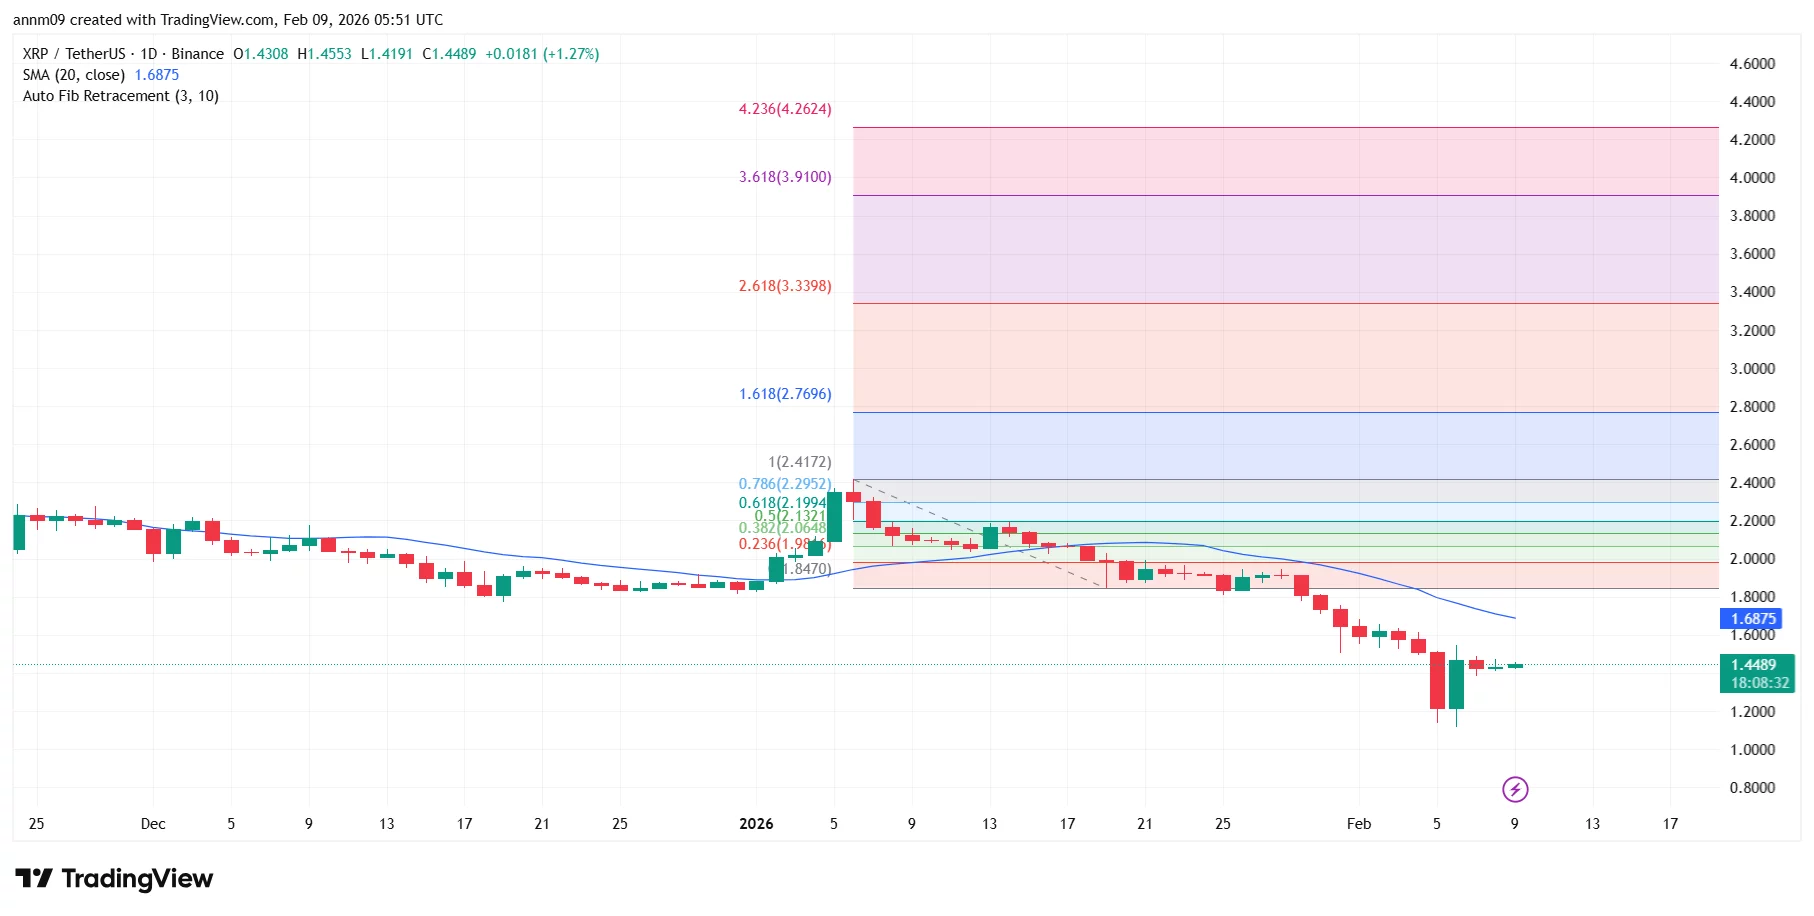
Fibonacci retracement levels drawn from XRP’s recent swing high to its January low further highlight the challenge for buyers. The $2.05–$2.30 zone, which includes the 0.382, 0.5 and 0.618 retracement levels, represents a dense area of overhead resistance. A sustained move above that range would be needed to shift the short-term outlook more constructively.
Until then, analysts say the latest 2% rise should be viewed in context — as a pause within a broader downtrend rather than a decisive change in direction. With momentum and volume indicators still favoring sellers, XRP’s price action suggests caution remains warranted in the near term.
You must be logged in to post a comment Login