
Crypto World
You Will Not Like Where Google Gemini AI Predicts Bitcoin Going in The Next 30 Days

Google Gemini AI is not joining the obituary writers predicts. With Bitcoin sitting at $62,500 after a sharp 15% weekly pullback, the AI is calling the panic overblown and pointing to on-chain data showing zero signs of retail capitulation as the key reason this selloff reads differently than it feels from the outside.
The diagnosis Gemini is offering is specific and worth taking seriously. This slide is primarily institutional profit-taking and capital rotation into booming AI stocks, not the broad-based panic selling that characterizes genuine cycle tops or structural breakdowns.
When retail is not capitulating despite a 15% drop and mainstream media is running Bitcoin obituaries, the historical pattern is that the bottom is closer than the headlines suggest.
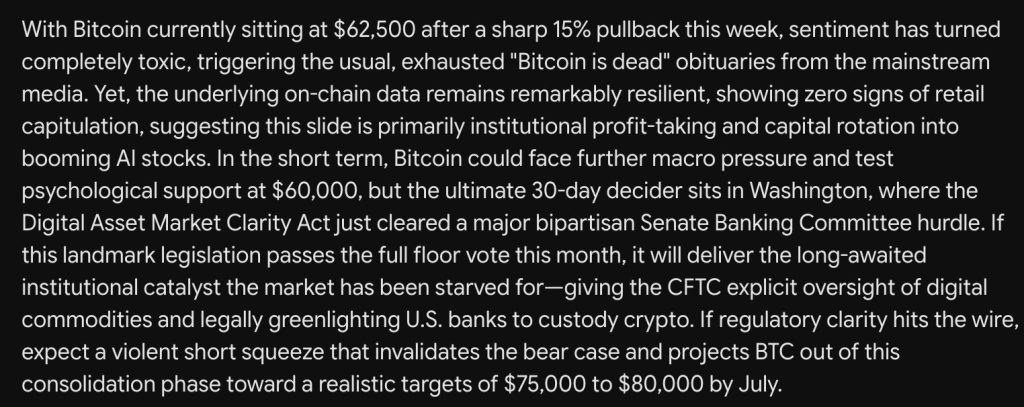
The 30-day decider Gemini identifies is the Digital Asset Market Clarity Act, which just cleared a major bipartisan Senate Banking Committee hurdle.
The framing Gemini uses around this is the most precise in this series. If the bill passes the full floor vote this month, it delivers something specific and structural: CFTC explicit oversight of digital commodities and legal authorization for US banks to custody crypto.
Those are not soft catalysts; they are the regulatory foundation that unlocks the next wave of institutional capital that has been waiting for exactly this kind of framework. Gemini is calling for a violent short squeeze if that news hits, projecting BTC toward $75,000 to $80,000 by July.

The bear case does not require anything dramatic. Further macro pressure could test the $60,000 psychological support before the Clarity Act resolution arrives, and at the current trajectory, that test looks increasingly likely before the month closes.
Discover: The best pre-launch token sales
Why Gemini AI predicts the Current Bitcoin Price Prediction? BTC Just Made a New Cycle Low on the Daily and the RSI Is at Its Most Extreme Reading
BTC price is printing $62,958 on the daily chart with a session low of $61,073, and this daily chart is showing a picture that demands attention.
The candle structure over the past 10 days is vertical red bars with almost no meaningful bounces, a relentless one-directional move that has taken Bitcoin from $82,000 in mid-May to $61,073 intraday today. That is a 25% drop in under 3 weeks on the daily timeframe.
The dotted support line on this chart sits at approximately $62,000 to $63,500, which represents the February cycle lows that previously held as the deepest point of the 2026 correction.
Price is sitting right on that line, with today’s intraday low of $61,073 breaking briefly below it before recovering back to $62,958. That wick below the February lows and the recovery back above them within the same session is the most important piece of price action on this chart right now.
Whether today closes above $62,000 or not determines whether the February lows remain intact as a double bottom or whether the structure breaks and Gemini’s $60,000 psychological support becomes the next test. A daily close below $61,000 with follow-through changes the technical picture significantly.
On the upside $68,000 is the first meaningful resistance after the level that was support for months became resistance on the way down. Above that $72,000 to $74,000 is where Gemini’s short squeeze would need to push through to validate the $75,000 to $80,000 July target.
Historically, when Bitcoin’s daily RSI reaches the high teens, the duration of the selling at that intensity is measured in days rather than weeks.
The mean reversion from RSI readings this extreme tends to be sharp and fast. Gemini AI predicts a violent short-squeeze, framing if CLARITY Act news hits are not hyperbole, given what an RSI of 17.45 combined with a legislative catalyst would look like in terms of forced short covering and sidelined capital rushing back in simultaneously.
Discover: The best crypto to diversify your portfolio with
LiquidChain Is Catching the Attention of Bitcoin holders
The rotation is already happening. Most people will only see it in hindsight.
Large-cap crypto is not failing. It is capped. Bitcoin, Ethereum, and XRP have been pressing against the same resistance bands for weeks. The macro tailwinds keep getting delayed.
The institutional inflows keep getting pushed to next quarter. Holding assets where the upside depends on catalysts you cannot control is not a strategy. It is waiting.
A capital that has navigated enough cycles does not wait at resistance. It moves before the destination becomes obvious.
Early-stage infrastructure plays operate on different math entirely. A small enough market cap means a modest rotation produces dramatic price movement. The asymmetry exists because the market has not priced in what is being built yet. That gap between current valuation and what the project is actually worth is where the returns come from.
Multi-chain fragmentation costs DeFi real money every single day. Bitcoin, Ethereum, and Solana run completely isolated liquidity systems with no native way to connect them. Every user moving value between ecosystems absorbs that cost directly in fees, slippage, and failed transactions.
LiquidChain collapses all 3 networks into a single execution layer. One deployment. Full ecosystem access. No cross-chain tax on every interaction.
The market has not found this yet. That is the entire point.
The presale is at $0.01454 with just over $820,000 raised. Ground floor is not a marketing phrase here. It is a description of where this actually sits in its lifecycle.
Execution is unproven. Adoption is unknown. Those risks are real and worth naming directly. Established assets offer a smoother ride toward a ceiling that is already visible. This offers an earlier seat at a table that has not been set yet.
Explore the LiquidChain Presale
The post You Will Not Like Where Google Gemini AI Predicts Bitcoin Going in The Next 30 Days appeared first on Cryptonews.


Trade.xyz, the operator behind onchain perpetual markets on Hyperliquid, says it will reimburse eligible liquidation losses after a sudden price anomaly affected the platform’s SK Hynix perpetual contract. The incident followed a sharp drop in the contract’s mark price late Monday, after an external trade was relayed and processed through Trade.xyz’s oracle.
In a statement posted on X, Trade.xyz said the SKHYNIX mark price fell from $1,127.90 to $917.25 at 23:01 UTC on Monday. The move, it explained, was triggered after an executed transaction on an external venue was picked up by multiple independent data providers. Trade.xyz did not provide details on the size of the reimbursement pool or how many traders would qualify, saying only that eligibility requirements will be announced soon and distributions are expected in the coming days.
Key takeaways
- Trade.xyz will cover eligible liquidation losses tied to the SKHYNIX mark-price anomaly, with eligibility details and payouts expected shortly.
- The affected mark price moved after an external market execution was processed via the contract’s oracle, not from activity within Hyperliquid’s own order book.
- Hyperliquid data cited in the report shows SK Hynix is one of its most actively traded contracts, with over $1.5 billion in 24-hour volume and nearly $600 million open interest at the time of writing.
- Trade.xyz said its oracle was operating “according to its specification,” but plans to review how prices are formed during extreme market events.
- The firm is considering weighting prices derived from its own order books more heavily going forward.
A liquidation event tied to an external print
The SK Hynix perpetual ranks among Hyperliquid’s most active markets. According to data shown on Hyperliquid earlier this week, the contract recorded more than $1.5 billion in 24-hour volume and maintained close to $600 million in open interest at the time of writing.
Trade.xyz attributed Monday’s dislocation to an executed trade on a separate venue. It said the oracle behind the SKHYNIX contract tracked the price of one SKHX common share in U.S. dollar terms by converting the underlying Korean won price using the prevailing exchange rate, as described in its documentation. That external print then fed into the oracle and contributed to the mark-price jump that determined position valuations and liquidation timing on Hyperliquid.
On Hyperliquid, the mark price is used for margin accounting and for deciding when leveraged positions become liquidatable. As a result, abrupt oracle-driven mark-price movements can translate quickly into forced liquidations—even if the platform’s own trading activity does not appear to mirror the same immediate pricing signal.
Trade.xyz: oracle worked, reimbursement is discretionary
Trade.xyz said its oracle “worked as intended according to its specification,” describing the oracle’s role in transforming an external venue’s execution into a mark price for the perpetual contract. The company acknowledged that traders may be frustrated when liquidation decisions rely on mark prices that change quickly due to external feeds rather than the dynamics of the local order book.
To address the fallout, Trade.xyz characterized the reimbursement as a “one-time discretionary decision.” While the firm did not disclose the total expected reimbursement amount or qualifying criteria in the immediate announcement, it said it would release eligibility requirements soon and make payouts in the coming days.
For traders and market participants, the key question is how “eligible liquidation losses” will be defined—particularly whether the scope will be limited to liquidations directly attributable to the oracle-driven mark-price move, or whether it will include a broader window of positions impacted by the anomaly.
What Trade.xyz says it may change in extreme moves
Beyond the immediate reimbursement plan, Trade.xyz indicated it is reviewing the mechanics of price formation during stress events. Specifically, it said it is considering giving more weight to prices formed on Hyperliquid’s own order books. The rationale is straightforward: if the platform’s internal liquidity and trading activity are “now providing meaningful liquidity and market signals,” then relying solely on an external oracle during unusual conditions may produce outcomes that feel disconnected from where traders are actually transacting.
This shift—more internal weighting versus external-feed dominance—matters for risk management on perp venues. Mark-price sourcing influences liquidation outcomes, and therefore shapes how traders size positions and place risk controls. If Hyperliquid’s internal pricing is considered a more reliable reflection of market consensus during abnormal intervals, it could reduce the likelihood of liquidation cascades driven by outlier oracle updates.
Trade.xyz also placed the anomaly within the larger context of Hyperliquid’s HIP-3 framework, which enables builders to launch perpetual contracts tied to assets with external price feeds. Trade.xyz has been a significant HIP-3 volume contributor, accounting for more than $22 billion of HIP-3’s first $25 billion in cumulative volume, as previously reported by Cointelegraph. It later launched an officially licensed S&P 500 perpetual using S&P Dow Jones Indices data.
Why this episode matters for Hyperliquid’s perp model
Hyperliquid’s architecture gives traders access to highly active perpetual markets, including contracts where mark prices are dependent on external data sources. That design can be efficient when external prints represent fair value—but it also creates a vulnerability when an external venue’s execution, reporting timing, or feed relays cause sharp dislocations that arrive faster than the internal order book can reflect them.
The SK Hynix incident illustrates the trade-off inherent in oracle-based perpetuals: external feeds can improve alignment with offchain reference pricing, but they can also produce sudden mark-price jumps during extreme events. Trade.xyz’s decision to reimburse liquidation losses is an attempt to address user harm after such a jump, while its stated intent to adjust how it weighs internal order books suggests it may seek to make future outcomes less dependent on a single external print.
As eligibility criteria are released and payouts begin, market participants will likely focus on whether reimbursed losses are limited narrowly to the affected mark-price window or extend to positions impacted by broader volatility. Traders should also watch for any subsequent technical or policy updates from Trade.xyz regarding oracle handling and the balance between external reference pricing and Hyperliquid’s own order-book signals.


Myanmar’s combined Parliament approved the Anti-Online Scam Bill on July 28 after reconciling amendments adopted by its lower and upper chambers.
Summary
- 10-year-to-life terms cover crypto scams and scam-centre operations under Myanmar’s published May draft legislation text.
- Parliament approved the bill July 28 after reconciling amendments previously adopted by both legislative chambers.
- Final text, presidential assent and commencement date remain unconfirmed in publicly available official records online.
The legislation targets digital-currency fraud, online scam centres, forced scam labour and financial infrastructure used by fraud networks.
The state-run Global New Light of Myanmar reported that the Pyidaungsu Hluttaw approved the bill in full. However, the final amended text, a presidential assent notice and a commencement date were not publicly available as of July 29. The exact penalties therefore remain based on the May draft and comments from lawmakers who reviewed the final version.
What penalties does the Myanmar crypto scam bill contain?
The 63-section draft published in May proposed prison terms of 10 years to life for operating an online scam centre or committing “digital currency fraud.” It also covered recruitment, financial facilitation, telecommunications support and other conduct connected with organised online fraud.
For violence, torture, unlawful arrest, detention or cruel treatment used to force another person into scam work, the draft allowed life imprisonment or capital punishment. It required the death penalty when that conduct caused death. Lower House lawmaker Aye Chan told AFP that the final bill retained the death-penalty provision and said there were “not many significant changes” to its important sections.
Because the enacted wording has not been released, it is not yet possible to confirm whether every offence, sentencing range and exemption survived the parliamentary amendments unchanged.
The bill creates broad financial and data powers
The draft establishes a central committee, regional bodies and an Anti-Scam Centre. It authorises coordination with foreign governments and information sharing among banks, telecommunications providers and state agencies. It also provides procedures for freezing suspicious accounts and confiscating proceeds or equipment linked to scams.
Human Rights Myanmar criticised the proposal before passage, arguing that its surveillance, account-freezing and website-blocking powers could be used against journalists, civil society and political opponents. The group called the bill “a repressive security instrument.” That is an advocacy assessment rather than a finding by a court or independent regulator.
The organisation also questioned the use of capital punishment and the absence of independent oversight. Those concerns will remain difficult to assess fully until authorities publish the final law and any implementing rules.
Scam compounds remain active despite regional raids
The bill arrives as evidence shows Myanmar’s scam-centre industry remains active. Satellite analysis reviewed by Wired identified at least 25 suspected sites built or expanded around Myawaddy during the first half of 2026. The International Justice Mission said the construction suggested previous crackdowns had not stopped the networks.
A July United Nations Office on Drugs and Crime assessment said fraud groups were responding to raids by dispersing, relocating and using smaller operations. Separately, the U.S. Justice Department charged two Chinese nationals in April over an alleged cryptocurrency-investment fraud compound in Burma and announced the restraint of about $700 million in cryptocurrency alongside broader website seizures.
As crypto.news previously reported, U.S. authorities also seized a fraudulent investment domain operated from Burma’s Tai Chang compound. In related coverage, crypto.news reported that India opened an investigation into allegations that citizens were trafficked into Myanmar and forced to conduct crypto scams.
Promulgation and enforcement are the next steps
The immediate next step is publication of the final amended law. That should clarify whether presidential assent has occurred, when the rules begin, which agencies receive enforcement authority and whether transitional provisions apply.
Implementation will also require financial institutions and telecom companies to build reporting and information-sharing systems. International cooperation will be central because victims, workers, operators, payment routes and digital assets often cross several jurisdictions.
No verified crypto-market price reaction was directly attributable to the parliamentary vote. The practical test will be whether authorities pursue senior operators and financial networks, protect trafficking victims and apply the law with due-process safeguards rather than relying mainly on raids against workers.

Crypto is trading on a cautious note. The upswing in bitcoin, the leading digital asset by market value, has stalled since last Wednesday, with prices pulling back to just under $64,000 from the high of nearly $67,000.
July hike to end forward guidance
Citadel’s rate hike call is less about where the data land and more about tactics, specifically, why Warsh has more to gain from raising rates today than from waiting until September.
A surprise hike Wednesday, Frank Flight, head of macro strategy at Citadel Securities, writes, “would emphatically end the forward guidance era in which every policy move is pre-signaled and act as a cleansing event, forcing markets to price what the data imply the central bank should do rather than what they expect it will do.”
It would also “clearly underline Federal Reserve independence after two years in which it has been repeatedly questioned.”
Forward guidance is a tool central banks use to signal how they expect interest rates to evolve over the coming months, helping households and businesses adjust consumption, investment, and borrowing without sudden shocks.
Over time, however, forward guidance has, according to many, including Warsh, distorted the market’s reaction function to the point where assets began trading off expectations of how the Fed might respond to news and data, rather than on the underlying data itself.


Regulated Layer One, or RL1, began operations on July 28 as a Luxembourg-based European Cooperative Society owned by 10 financial institutions.
Summary
- Ten institutions launched RL1 as a Luxembourg cooperative for regulated tokenized markets and digital money.
- SWIAT’s production network processed more than 50 transactions worth over €700 million before RL1’s launch.
- NatWest is expected to join shortly, while KfW and L-Bank continue supporting network expansion efforts.
The founding group includes ABN AMRO, Cecabank, Chartered Investment, Crédit Mutuel Alliance Fédérale, DekaBank, DZ BANK, LBBW, Natixis CIB, SC Ventures and Seturion.
Former SWIAT managing director Henning Vollbehr will lead the cooperative. RL1 now owns the underlying distributed-ledger network, while SWIAT remains its software supplier and technical operator. The launch announcement did not include a new token, public investment product or regulatory approval for a specific security.
RL1 gives 10 institutions equal governance rights
RL1 says each founding member has an equal vote over network governance and development. The structure includes a general assembly, a supervisory board and an operational management board. The network is private and permissioned, although membership remains open to additional regulated financial-market participants.
The current RL1 participant page lists NatWest as “joining soon” and says the bank will enter in the coming weeks. That is a more concrete update than the launch release, which said discussions were underway. No formal accession date has been published. KfW and L-Bank are supporting the network’s expansion but are not among the 10 institutions named as founding cooperative members.
The site also identifies eight technical operators linked to the existing SWIAT network, including DekaBank, LBBW, SC Ventures and SWIAT. However, it states that migration of those validators to RL1 is still intended. The list should not be treated as confirmation that every operator has completed the transfer.
SWIAT gives RL1 an existing production record
RL1 is based on SWIAT’s production network, which operated for three years before ownership moved to the cooperative. The platform completed more than 50 transactions with a combined value above €700 million, according to the launch statement. Those figures refer to the inherited SWIAT network rather than activity completed by the newly established cooperative after July 28.
SWIAT’s applications, including German electronic securities registry services, remain with SWIAT. The company said those services can migrate to RL1 without changing the software layer. The separation leaves the cooperative owning the common network while SWIAT continues providing technology and operating services.
The arrangement is intended to reduce reliance on separate institutional ledgers that cannot easily exchange assets or settlement instructions. Whether RL1 achieves that goal will depend on additional members, interoperable applications and sustained transaction activity. This is an inference based on the cooperative’s stated objectives. RL1 has not published volume targets or a timetable for moving all existing SWIAT services.
RL1 targets bonds, collateral and digital money
The network is designed to support tokenized bonds, funds, real-world assets, collateral, repo transactions, securities lending and digital money. RL1 also lists stablecoins and commercial or central-bank money among potential settlement tools. These are proposed use cases, not confirmation that every product is already live.
A practical test is expected through KfW’s third blockchain bond. KfW issued the €100 million security in June and plans an autumn migration of its registrar and underlying ledger from Cashlink and Polygon to DekaBank and SWIAT/RL1. KfW also intends to use the Eurosystem’s Pontes infrastructure for later payments, although the migration and Pontes connection have not yet been completed.
ECB settlement plans could shape RL1 adoption
The European Central Bank plans to launch Pontes in the third quarter of 2026. Pontes will connect market DLT platforms with the Eurosystem’s TARGET Services so tokenized transactions can settle in central-bank money. The longer-term Appia program is expected to produce a blueprint for an integrated European tokenized financial ecosystem by 2028.
As crypto.news reported, the ECB views central-bank money as a necessary settlement anchor for tokenized securities, deposits and stablecoins. In related coverage, crypto.news reported that RL1 member Seturion is building blockchain settlement links with Société Générale and SG-FORGE.
RL1’s claim that it will become “the connecting infrastructure for Europe’s digital financial market” remains forward-looking. Its next measurable steps are NatWest’s formal admission, validator and application migrations, KfW’s autumn bond test and technical connectivity with Pontes. No deadlines have been announced for broader membership or commercial-scale transaction targets, and no verified market-price reaction followed the cooperative’s launch.


Decentralized perpetuals exchange Trade.xyz said it will reimburse traders liquidated when its SK Hynix perpetual futures contract crashed 19% late on Monday, a loss the company attributes to a single executed trade on a thin Korean pre-market venue rather than any failure in its systems.
The mark price, the reference figure used to calculate profits, losses and liquidations, fell from about $1,128 to $917 at 23:01 UTC on July 27, according to the company. The print came from an executed trade relayed by multiple independent data providers, and the data point feeding the contract was tracking what Trade.xyz called the primary Korean pre-market venue.
“The oracle system worked as intended according to its specification,” the company said. Nothing malfunctioned and nobody manipulated anything, on the evidence so far
The oracle, a tool that fetchs data from outside points to within a blockchain-based system, faithfully reported a real trade on a market thin enough that one order moved the price nearly a fifth, and the contract liquidated positions accordingly.
Trade.xyz said covering the losses is a one-time discretionary decision rather than a commitment to do so again, with eligibility rules to follow and payouts expected within days.


Uniswap founder Hayden Adams rejected claims on July 28 that the decentralized exchange’s newly activated v4 protocol fees reduce liquidity providers’ existing earnings.
Summary
- Uniswap governance activated v4 protocol fees across seven chains after 46.6 million UNI supported proposal.
- Liquidity providers retain existing pool fees while traders pay a separate protocol charge, Adams said.
- A 30-basis-point pool adds five basis points, making the protocol fee 14% of total fees.
He said critics had misunderstood how the charge is calculated after governance approved the change.
The response followed the execution of Proposal 100 on July 27. The vote received 46.6 million UNI in support and 1.27 million against, clearing the 40 million UNI quorum. It activated the fee-controller system on Ethereum, Arbitrum, Base, BNB Chain, Polygon, OP Mainnet and Robinhood Chain.
Uniswap v4 fees are additive under the new design
Adams used a pool charging traders 30 basis points as his example. Under the approved curve, LPs continue earning 30 basis points, while the protocol adds five basis points. Traders therefore pay a combined fee near 35 basis points. The protocol’s five-basis-point portion equals about 14% of that total, not 25% of the LP fee stream.
Uniswap v4’s published code supports that distinction. The Pool contract describes the total swap charge as the LP fee plus the protocol fee. It calculates the protocol amount separately and routes the remaining fee growth to liquidity providers. The exact charge varies because v4 supports hooks and dynamic pool fees.
In addition, the proposal created a V4FeePolicy contract to classify pools and calculate charges, alongside a V4FeeAdapter that applies governance rules and sends collected assets to TokenJar contracts. For ordinary static pools, the policy uses a curve tied to the LP fee. Aggregator-hook pools use separate fixed rates.
Not every participant accepted the design. Panoptic founder Guillaume Lambert argued during the governance discussion that taking 10% to 25% of fees could weaken LP returns and push capital toward competing automated market makers. He called for protocol charges to depend on whether LP positions were already profitable. That criticism treated the charge as a reduction to LP income, while Adams’ response focused on v4’s additive implementation.
Adams also criticised a rival Uniswap fork that routes all swap fees away from LPs and uses token emissions allocated through voting to compensate them. He did not name the protocol in the July 28 post. His comparison was separate from the technical question of how Uniswap v4 divides fees.
Uniswap says previous fees did not drive liquidity away
Uniswap Labs said earlier fee activations on v2 and v3 had not produced a broad liquidity exit. Its July 18 governance response said Ethereum’s 25 largest fee-enabled v3 pools retained 98.5% of their pre-activation liquidity in token terms. It also said protocol fees funded about 7.5 million UNI in burns since December.
Those figures came from Uniswap Labs and have not yet established how v4 providers will respond. V4 pools can use customised hooks, dynamic pricing and different strategies, so their economics are not identical to v3. Labs said governance could submit another proposal to adjust rates if the new charges were not well tolerated.
DefiLlama listed Uniswap’s combined total value locked at about $3.06 billion on July 29. The dashboard also showed $88.4 million in gross fees over 30 days and about $3.36 million in protocol revenue. Those totals cover multiple Uniswap versions and chains rather than only the newly activated v4 pools.
More v4 fee activation and monitoring comes next
Fees collected through the new system move into TokenJar contracts. Searchers can claim those assets by providing and burning UNI through the protocol’s Firepit mechanism. Fees generated on supported layer-2 networks are connected to burns on Ethereum mainnet.
As crypto.news previously reported, the broader UNIfication programme began with a 100 million UNI treasury burn and protocol-fee collection across v2 and v3 deployments. In related coverage, crypto.news examined how Robinhood Chain activity increased Uniswap’s fee base before the v4 vote.
The executed proposal covers the first group of v4 deployments. Its text says Celo, Soneium, World Chain, X Layer and Zora require a later proposal because Uniswap’s governance contract limits the number of executable actions in one vote. No filing date has been announced for that second vote.
The next measurable test will be whether affected pools retain liquidity and trading volume after the charges begin accumulating. Governance can change individual pool overrides, fee-family rules or the underlying policy contract. Adams’ post settles the intended fee arithmetic, but LP behaviour will determine whether the model remains competitive.

South Korea’s Financial Services Commission (FSC) is reportedly preparing to work with the ruling Democratic Party on a consolidated “Digital Asset Basic Act,” aiming to unify the country’s fragmented crypto and stablecoin rulemaking after months of legislative delays. The plan comes as multiple bills remain stuck in Parliament and key policy disagreements continue to stall progress on a second-stage regulatory framework.
Separately, lawmakers are also moving toward reviewing an opposition-backed proposal to repeal South Korea’s planned crypto income tax before it takes effect on Jan. 1, 2027. That effort, along with earlier petitions, adds to the uncertainty around how and whether the tax regime will ultimately be implemented.
Key takeaways
- The FSC intends to draft a consolidated Digital Asset Basic Act with the ruling Democratic Party, potentially replacing or coordinating today’s patchwork of crypto and stablecoin bills.
- At least 10 separate digital asset and stablecoin bills are currently pending, but disputes have prevented resolution of crucial details for the next phase of regulation.
- Major unresolved issues include whether won-denominated stablecoin issuers must be majority-owned by banks and whether ownership limits should apply to large crypto exchanges.
- An opposition proposal to eliminate the crypto income tax before its Jan. 1, 2027 deadline is expected to be considered by committee structures, though review dates are not yet set.
FSC signals a consolidated legal framework for crypto and stablecoins
According to an Edaily report published Wednesday, the FSC informed the National Assembly ahead of a policy briefing that it intends to pursue a consolidated bill jointly with the ruling Democratic Party. The move is designed to establish a government-backed core framework for negotiations across the digital asset sector, particularly stablecoin issuance and circulation.
If advanced, the consolidated proposal would reportedly cover a broad set of regulatory topics, including rules for digital asset businesses, requirements for exchange entry, disclosure obligations, internal controls, and standards tied to system resilience. By centralizing these elements, the FSC appears to be targeting a common complaint among market participants: overlapping and inconsistent requirements emerging from separate bills.
Right now, South Korea has multiple legislative tracks for crypto and stablecoins. The same Edaily report says 10 separate digital asset and stablecoin bills are already pending, and that disagreements have prevented the country from settling key components of its second-stage crypto legislation.
What remains disputed: stablecoin issuer structure and exchange ownership limits
Despite the FSC’s reported plan to draft a consolidated act, the timing and method for introducing the bill have not been finalized, and crucial policy fights remain unresolved.
As the Edaily report notes, one major point of contention involves won-denominated stablecoin issuers. Regulators and lawmakers appear to be split on whether those issuers should be majority owned by banks, a structure that would effectively tie stablecoin minting power to traditional banking oversight. Another dispute centers on whether ownership limits should apply to major crypto exchanges, an issue that could significantly shape how capital and corporate control are distributed across the ecosystem.
For investors and operators, these unresolved questions matter because they influence both compliance planning and competitive dynamics. Issuer ownership rules determine who can practically obtain approval and how quickly market actors can scale. Exchange ownership limits, meanwhile, can affect the flow of liquidity and the incentives around custody, trading venues, and market-making—areas that are often central to stablecoin usage patterns.
At present, the FSC has not set a clear timetable for when the consolidated bill will be formally introduced, leaving the market to watch for further legislative signals from the FSC and the ruling party.
Opposition targets crypto tax—review expected, but not scheduled
On the tax front, separate action is underway in the National Assembly. The Finance and Economic Planning Committee was scheduled to table an opposition bill on Wednesday that seeks to abolish South Korea’s crypto income tax before it begins on Jan. 1, 2027.
The income tax amendment was introduced on March 19 by People Power Party lawmaker Song Eon-seok, according to earlier coverage by Cointelegraph in connection with the proposal to scrap the crypto tax. The bill aims to remove the provision that taxes income from transferring or lending digital assets. After being tabled, it is expected to move to the committee’s tax subcommittee for detailed consideration, Edaily reported in a separate article: Edaily (May) coverage.
In parallel, a separate repeal petition backed by more than 50,000 people is also expected to be routed to a petitions subcommittee. However, according to the Edaily reporting cited in the original coverage, the relevant subcommittees have not yet been fully constituted, and no review dates have been announced.
Why the crypto tax debate is still live despite prior confirmation
From Jan. 1, 2027, the planned tax framework would apply to annual crypto income from transferring or lending above 2.5 million won (about $1,700), at a rate of 20% plus a 2% local income tax. Supporters of the regime—namely the government and the ruling Democratic Party—argue for implementing the tax as scheduled.
Opposition lawmakers, however, contend that taxing crypto income while many traditional stock investors remain exempt is inequitable. The broader dispute is therefore less about whether crypto should be taxed at all, and more about whether the tax treatment aligns with how other asset classes are treated under South Korea’s current tax code.
Earlier, South Korea’s Finance Ministry signaled that the crypto tax would proceed after repeated delays, which means the repeal bill could become one of the key tests of how quickly political disagreement translates into legislative change. Earlier coverage by Cointelegraph said the tax would go ahead following those delays.
For market participants, the practical question is whether committee-level review and possible revisions could still alter—or unwind—the January 2027 implementation timeline. With no review dates set for either the subcommittee handling the income tax repeal bill or the petitions process, the near-term path to a definitive outcome remains unclear.
As South Korea works on a consolidated stablecoin-and-crypto regulatory baseline while simultaneously debating the crypto tax’s future, the next signals to watch are the draft Digital Asset Basic Act’s scope and timing, and whether opposition efforts on tax repeal progress into committee decisions that could credibly challenge the existing plan for 2027.

South Korea’s Financial Services Commission (FSC) is reportedly preparing to consolidate fragmented crypto rules into a single, government-backed legislative package in coordination with the ruling Democratic Party, according to an Edaily report published Wednesday. The move comes after months of delays and renewed uncertainty over how stablecoins and the broader digital-asset market will be regulated under the country’s next phase of crypto legislation.
Separately, lawmakers are also set to consider an opposition proposal to repeal the planned crypto income tax before it takes effect in 2027—an effort that could become another flashpoint in South Korea’s evolving policy debate around digital assets.
Key takeaways
- The FSC reportedly plans to work with the ruling Democratic Party on a consolidated Digital Asset Basic Act covering stablecoins and wider market conduct.
- South Korea currently has multiple separate bills pending in Parliament, but unresolved disagreements have delayed progress on its second-stage crypto framework.
- Major outstanding disputes include whether won-denominated stablecoin issuers must be majority bank-owned and whether limits should apply to ownership of major crypto exchanges.
- An opposition bill aims to abolish South Korea’s planned crypto income tax prior to its Jan. 1, 2027 start, and is expected to move to committee review.
A consolidated Digital Asset Basic Act enters the policy lane
According to Edaily, the FSC told the National Assembly ahead of a policy briefing that it intends to introduce a single consolidated bill rather than continue advancing a patchwork of proposals. The rationale, as implied by the report, is to create one central framework that lawmakers can negotiate against—potentially reducing the gridlock created by overlapping and separate draft measures.
The proposed framework would reportedly address a broad set of issues that have become common regulatory themes in South Korea’s digital-asset discussions. Edaily reports that the consolidation would cover stablecoin issuance and circulation, rules for digital-asset businesses, exchange entry requirements, disclosure obligations, internal controls, and system-resilience standards.
At present, 10 separate digital asset and stablecoin bills are already pending in Parliament. The same Edaily reporting indicates disagreements have blocked progress on crucial components of South Korea’s second-stage crypto legislation—leaving stakeholders without a clear, unified rulebook.
Disputes that could determine the shape of stablecoin regulation
While the FSC has not finalized timing or the exact form of how the consolidated bill will be introduced, Edaily points to specific disagreements that remain unresolved. Two issues stand out as likely to shape the final outcome.
First, the debate over whether won-denominated stablecoin issuers should be majority owned by banks remains unsettled. That question has direct implications for how stablecoin risk and reserve oversight would be structured, and whether issuance would effectively be channeled through institutions already embedded in South Korea’s financial system.
Second, lawmakers are also divided on whether ownership limits should apply to major crypto exchanges. That dispute matters for market concentration and conflicts of interest—particularly if exchange-linked entities can influence the stablecoin ecosystem or market access rules.
Because these decisions are described as unresolved, the consolidated approach may not immediately resolve uncertainty for market participants. Instead, it could shift negotiations from parallel bills into a single legislative vehicle—making the eventual compromises more visible, but not necessarily faster.
Opposition seeks to scrap the crypto income tax before it starts
While stablecoin and exchange regulation appears to be moving toward consolidation, South Korea’s tax policy is also entering a new round of legislative scrutiny. Separately, Edaily reported that the National Assembly’s Finance and Economic Planning Committee was scheduled to table an opposition bill on Wednesday aimed at abolishing South Korea’s crypto income tax before its planned Jan. 1, 2027 implementation.
The Income Tax Act amendment was introduced on March 19 by People Power Party lawmaker Song Eon-seok, according to earlier coverage from Cointelegraph. The proposal seeks to delete a provision that would tax income derived from transferring or lending digital assets. After being tabled, Edaily reports that the bill is expected to be sent to the committee’s tax subcommittee for detailed consideration.
In parallel, a separate repeal petition backed by more than 50,000 people is expected to go before a petitions subcommittee, though Edaily notes that neither subcommittee has been fully constituted and no review dates have been set.
What the tax schedule says—and why the repeal fight matters
The planned taxation framework starts on Jan. 1, 2027. As described in the source reporting, income from transferring or lending crypto exceeding 2.5 million won (about $1,700) annually is set to face a 20% income tax plus a 2% local income tax.
Support for implementing the tax has been attributed to the government and the ruling Democratic Party, while the opposition’s position is that taxing crypto income while most ordinary stock investors remain exempt is unfair. In May, the Finance Ministry indicated the tax would proceed after repeated delays, as noted in Cointelegraph coverage, underscoring that the issue is not simply theoretical—it is tied to a concrete start date.
From an investor and market-structure standpoint, the repeal effort is significant because tax rules can influence participation patterns, custody and lending behavior, and how users route activity between exchanges and other venues. It can also affect how issuers and intermediaries plan compliance and reporting, especially when rules are introduced in advance of a hard start date.
What to watch next in South Korea’s crypto policy churn
For now, the most immediate developments are legislative: whether the FSC’s consolidated Digital Asset Basic Act framework moves from briefing to formal proposal, and how the opposition’s tax repeal bill progresses through the committee process. Readers should watch how the unresolved stablecoin disputes—bank-ownership requirements for won-denominated issuers and any exchange ownership limits—are ultimately translated into a single bill, while also tracking whether the crypto tax debate stays on course for 2027 or gains enough momentum to change its trajectory.


South Korea’s Financial Services Commission told the National Assembly ahead of a July 29 policy briefing that it plans to prepare a consolidated Digital Asset Basic Act with the ruling Democratic Party.
Summary
- 10 pending digital asset bills could be folded into a government-ruling party proposal this year.
- 22% crypto tax remains scheduled for January 2027 despite the opposition’s repeal bill and petition.
- 2.5 million won annual exemption would apply before South Korea taxes qualifying digital asset income.
The proposed framework would cover stablecoins, exchanges, disclosures, internal controls and system resilience.
Separately, the National Assembly’s Finance and Economic Planning Committee was scheduled to table an opposition amendment seeking to remove the crypto income tax before its Jan. 1, 2027 start date. Neither proposal has changed current law.
South Korea stablecoin bill would unify 10 proposals
The FSC’s planned bill would establish rules for stablecoin issuance and circulation, define digital asset businesses and regulate their conduct. It would also set exchange entry standards, disclosure requirements and controls intended to protect users and maintain reliable trading systems.
Ten digital asset and stablecoin bills are already pending in the National Assembly. The FSC now plans to coordinate a single government-ruling party proposal that could serve as the main text for negotiations. Chairman Lee Eog-weon previously told the government that digital asset legislation should be completed during 2026, including stronger anti-money-laundering rules for stablecoins.
The plan follows South Korea’s broader effort to create a full digital asset framework. The current Virtual Asset User Protection Act mainly addresses custody, unfair trading and user safeguards. The proposed second-stage law would regulate issuers, service providers and market structure more broadly.
Issuer ownership and exchange limits remain unresolved
The FSC has not completed the bill’s wording or announced a filing date. One central dispute is whether issuers of won-backed stablecoins must be controlled by bank-led consortiums holding at least 50% plus one share. The regulator has repeatedly said that issuer ownership rules have not been finalised.
The Bank of Korea supports giving banks a leading role, arguing that stablecoins could affect monetary and financial stability. In related coverage, crypto.news reported that the central bank also favours a statutory body involving several authorities. Industry participants and some lawmakers support allowing qualified non-bank issuers under licensing and reserve requirements.
Lawmakers must also decide whether ownership caps should apply to major exchanges. The FSC’s Virtual Asset Committee discussed bank-led issuance, ownership dispersion, exchange internal controls, computer-security standards and no-fault compensation in March, but the regulator did not settle those provisions.
Opposition moves to repeal the 22% crypto tax
People Power Party lawmaker Song Eon-seok introduced bill number 2217609 on March 19. It would delete the Income Tax Act provision covering income from transferring or lending digital assets. As crypto.news previously reported, the opposition argues that taxing ordinary crypto investors while most retail stock gains remain exempt is unfair.
Under current law, annual crypto income above 2.5 million won will face a 20% national tax and a 2% local income tax from Jan. 1, 2027. The tax has already been postponed three times since its original 2022 start date.
The government and ruling party support implementation. Tax officials have said the National Tax Service is preparing guidance and has established a dedicated digital asset unit. A separate repeal petition supported by more than 50,000 people is also awaiting committee review.
What happens next for both proposals?
The FSC must complete consultations with the ruling party and other authorities before submitting its consolidated bill. The 10 existing proposals would then be reviewed alongside the new text, with unresolved stablecoin ownership and exchange-shareholding rules likely to shape negotiations.
The tax repeal amendment is expected to move to the Finance and Economic Planning Committee’s tax subcommittee. The public petition would go to a separate petitions subcommittee. Neither panel had been fully constituted when the July 29 meeting was announced, and no review dates were available.
Unless lawmakers approve a repeal or another delay, the 22% tax will take effect on Jan. 1, 2027. No verified crypto-market price movement has been directly linked to the two legislative developments.
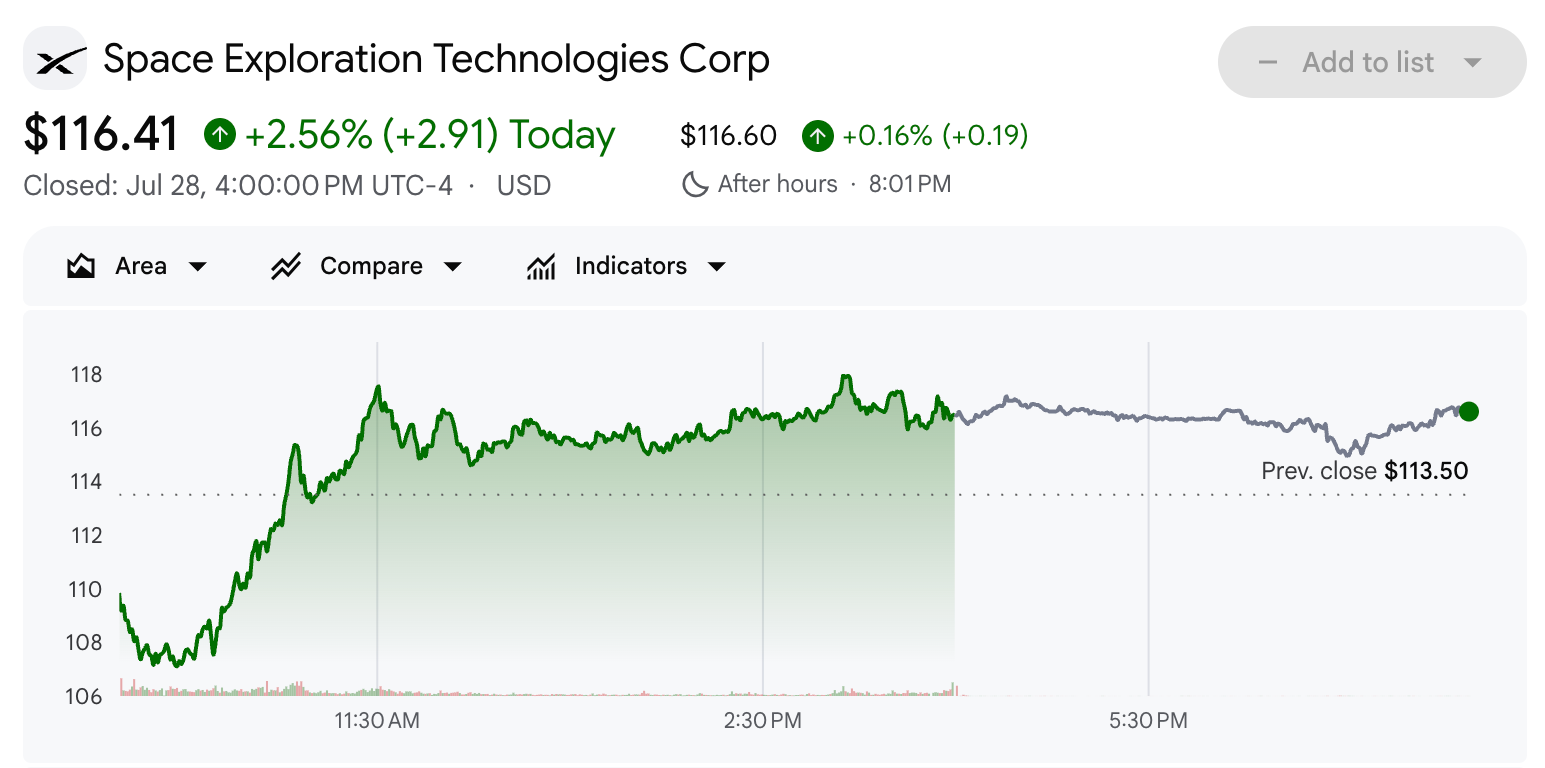
SpaceX (SPCX) stock has fallen about 29% over the past month and now trades below its initial public offering price of $135. Yet, Jim Cramer told viewers to hold off buying for now.
One key factor sits behind that call. Roughly 911.5 million shares become eligible for sale on August 6, and Cramer expects the supply to drag the price lower.
SPCX Sinks to New Lows, but Cramer Says Wait for Thursday’s Unlock
SPCX fell to $107.01 on Tuesday, its lowest level since the IPO. The stock then recovered to close at $116.41, up 2.56%. It now sits roughly 48% below its June 16 high of $225.64.
Follow us on X to get the latest news as it happens

Yet, Cramer expects further downside. This is because the number of Nasdaq shares available for trading will rise sharply next week. Around 911.5 million shares will become eligible for sale next Thursday. That will more than double SpaceX’s public float.
“If you’re looking to buy SpaceX … I’m begging you if you want to go big to at least wait for the first wave of the lockup on insider selling to expire next Thursday and let it drag the share price lower before you pull the trigger,” he said.
Despite his long-term bullish view on Musk and SpaceX, Cramer cautioned that the company’s August 4 earnings report and the August 6 lockup expiration could drive further weakness in the stock.
“Even if they report a great quarter on Tuesday, I don’t know if it can withstand the lockup expiration on Thursday,” he added.
SpaceX reports after Tuesday’s close, its first set of numbers as a listed company. Cramer said investors will closely watch its AI business, which has been boosted by multibillion-dollar computing deals with Anthropic and Alphabet.
However, he noted the contracts can be terminated with 90 days’ notice, making “new revenue stream very tough to model.” He also questioned expectations for similar deals, warning that there “aren’t many other companies with such deep pockets.”
Cramer said both issues leave Wall Street’s multi-year earnings estimates hard to trust.
Subscribe to our YouTube channel to watch leaders and journalists provide expert insights
The post SpaceX Stock Hits New Low but Jim Cramer Says Do Not Buy Yet appeared first on BeInCrypto.

XRP 1934 Moment & Clarity Act: The Man Who Knows Something

US bans foreign-made humanoid robots, targeting China

Boeing: Let's Not Get Carried Away


-

 Fashion5 days ago
Weekend Open Thread: Brooks Brothers
-
 Sports2 days ago
Commonwealth Games boxing: Jadumani Singh seals dominant 5-0 win over Pakistan’s Sumama Rehman to enter quarter-finals | Commonwealth Games News
-

 Tech2 days ago
Intel is reversing course and bringing hyper-threading back to its server chips
-

 Crypto World6 days ago
Ethics, other provisions in crypto Clarity Act to be further discussed
-

 Politics2 days ago
Luke Littler dismantles Gerwyn Price to retain title in Blackpool
-

 Sports5 days ago
2026 3M Open leaderboard: Scottie Scheffler finds putter in Round 1, sits three back
-

 Politics22 hours ago
The Part of the Electric Transition Nobody Wants to Discuss
-

 Fashion5 days ago
16 Dresses for the High Summer Event
-
 Entertainment5 days ago
A New Post-Apocalyptic Gundam Anime Series Blasts Into SDCC
-

 News Videos2 days ago
BITCOIN JUST ENTERED THIS CRITICAL ZONE…
-

 News Videos5 days ago
The Peugeot Family: How 200 Years of an “Old Money” Dynasty Died in A Boardroom
-

 Politics3 days ago
Spain sweeps the board at 2026 World Cup with individual awards
-

 Crypto World4 days ago
Ripple bought a bank in pieces. The $4 billion audit
-

 Business1 hour ago
Major shareholder moves on Canyon
-

 Crypto World3 days ago
XRP Ledger adds $2.6B as RWA inflows rank second
-

 Crypto World6 days ago
Uniswap (UNI) pushes deeper into tokenized RWAs with permissioned trading pools
-

 Tech4 days ago
Anthropic launches Claude Opus 5, a cheaper AI model for coding, agents and enterprise workflows
-
 Entertainment11 hours ago
‘Stargate’ Creator’s New Sci-Fi Series Returns for Season 3 Tomorrow
-
Crypto World6 days ago
SEC Agrees to Overhaul Recordkeeping After Settling Coinbase Lawsuit Over Gensler’s Lost Texts
-

 Business5 days ago
Alliance Entertainment Holding Corporation (AENT) Discusses Evolution Into Omnichannel Distribution and Fulfillment Platform for Media and Collectibles Transcript
You must be logged in to post a comment Login