

Crypto World
Zcash price rejected at $500 resistance, yet charts point to another rebound


Zcash price has pulled back from the $500 resistance zone after a sharp rally driven by renewed optimism around the upcoming Ironwood upgrade, although technical indicators still favor another attempt higher if key support levels continue to hold.
Summary
- Zcash price has retreated from the $500 resistance after profit-taking, but continues to hold above the key $440 support zone.
- Technical indicators and liquidation data suggest a break above $480 could trigger another move toward the $500-$540 region.
- Rising geopolitical tensions, weaker institutional crypto demand, and regulatory pressure remain the biggest risks to the bullish outlook.
According to data from crypto.news, Zcash (ZEC) price climbed to an intraday high of around $505 before retreating to about $466 on July 8 as traders locked in profits after a nearly 28% advance. The rejection came as leveraged longs accumulated near the psychological $500 barrier, allowing market makers to trigger a wave of long liquidations that accelerated the decline. Despite the retracement, the sell-off has so far remained above the critical $440 support that traders have been watching since the latest breakout.
Meanwhile, enthusiasm surrounding Zcash’s Ironwood upgrade continues to underpin investor sentiment. The network is preparing to activate the long-awaited upgrade later this month, introducing a mathematical proof designed to eliminate hidden counterfeiting risks inside its privacy pools. The milestone follows June’s emergency response to the Orchard vulnerability and has strengthened confidence that Zcash’s privacy infrastructure is nearing full restoration.
Technical structure continues to favor another test of $500
The daily chart shows Zcash holding above the 50% Fibonacci retracement level near $442 after rejecting from the 61.8% retracement at $500.48. Price also remains comfortably above the 38.2% Fibonacci support at $383, while the Chaikin Money Flow has climbed back into positive territory at 0.13, suggesting buying pressure continues to outweigh distribution.
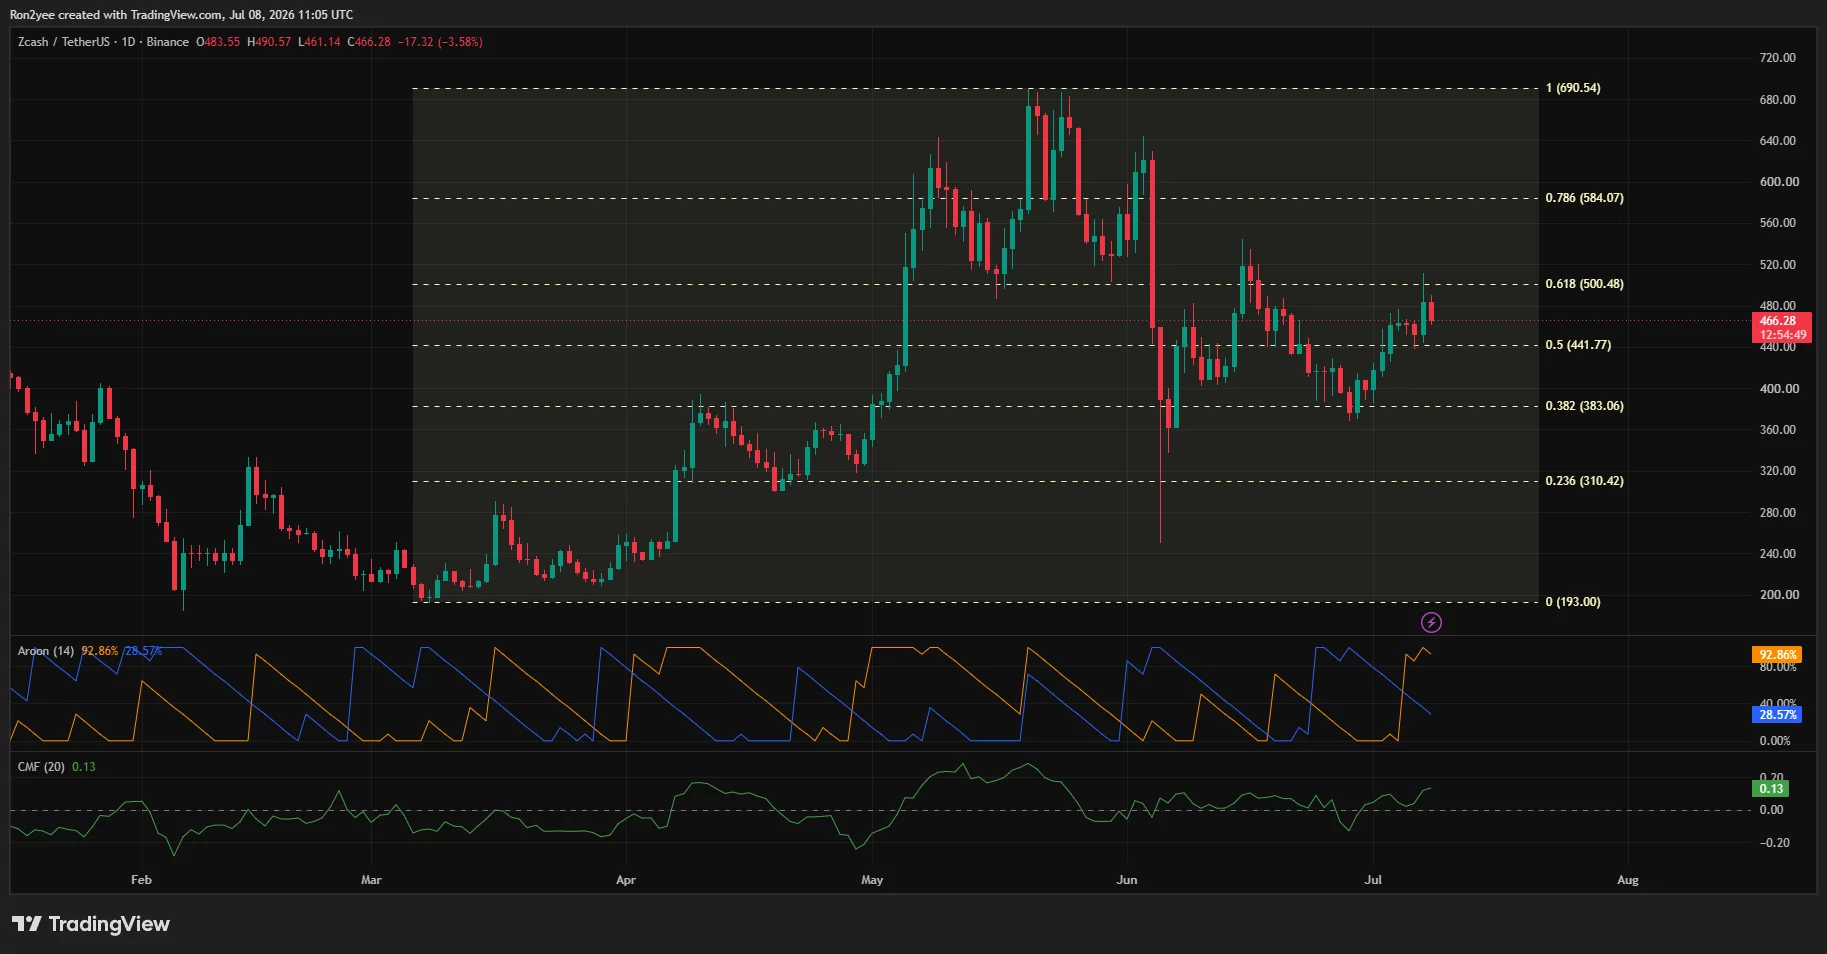
At the same time, the Aroon Up indicator has surged above 92%, confirming buyers still retain control of the prevailing trend despite the latest setback.
According to analyst Ardi, the recent rejection may actually strengthen the bullish setup rather than invalidate it. In a post on X, he argued that the decline simply retested a key breakout zone before another potential advance.
“Another layer of confluence to give me confidence that once we break and hold above the compound resistance, we’re on our way back above $500.”
His chart identifies a compound resistance around $480, where a descending trendline intersects horizontal resistance. A sustained daily close above that region could reopen the path toward $500 before exposing the macro resistance zone around $540.
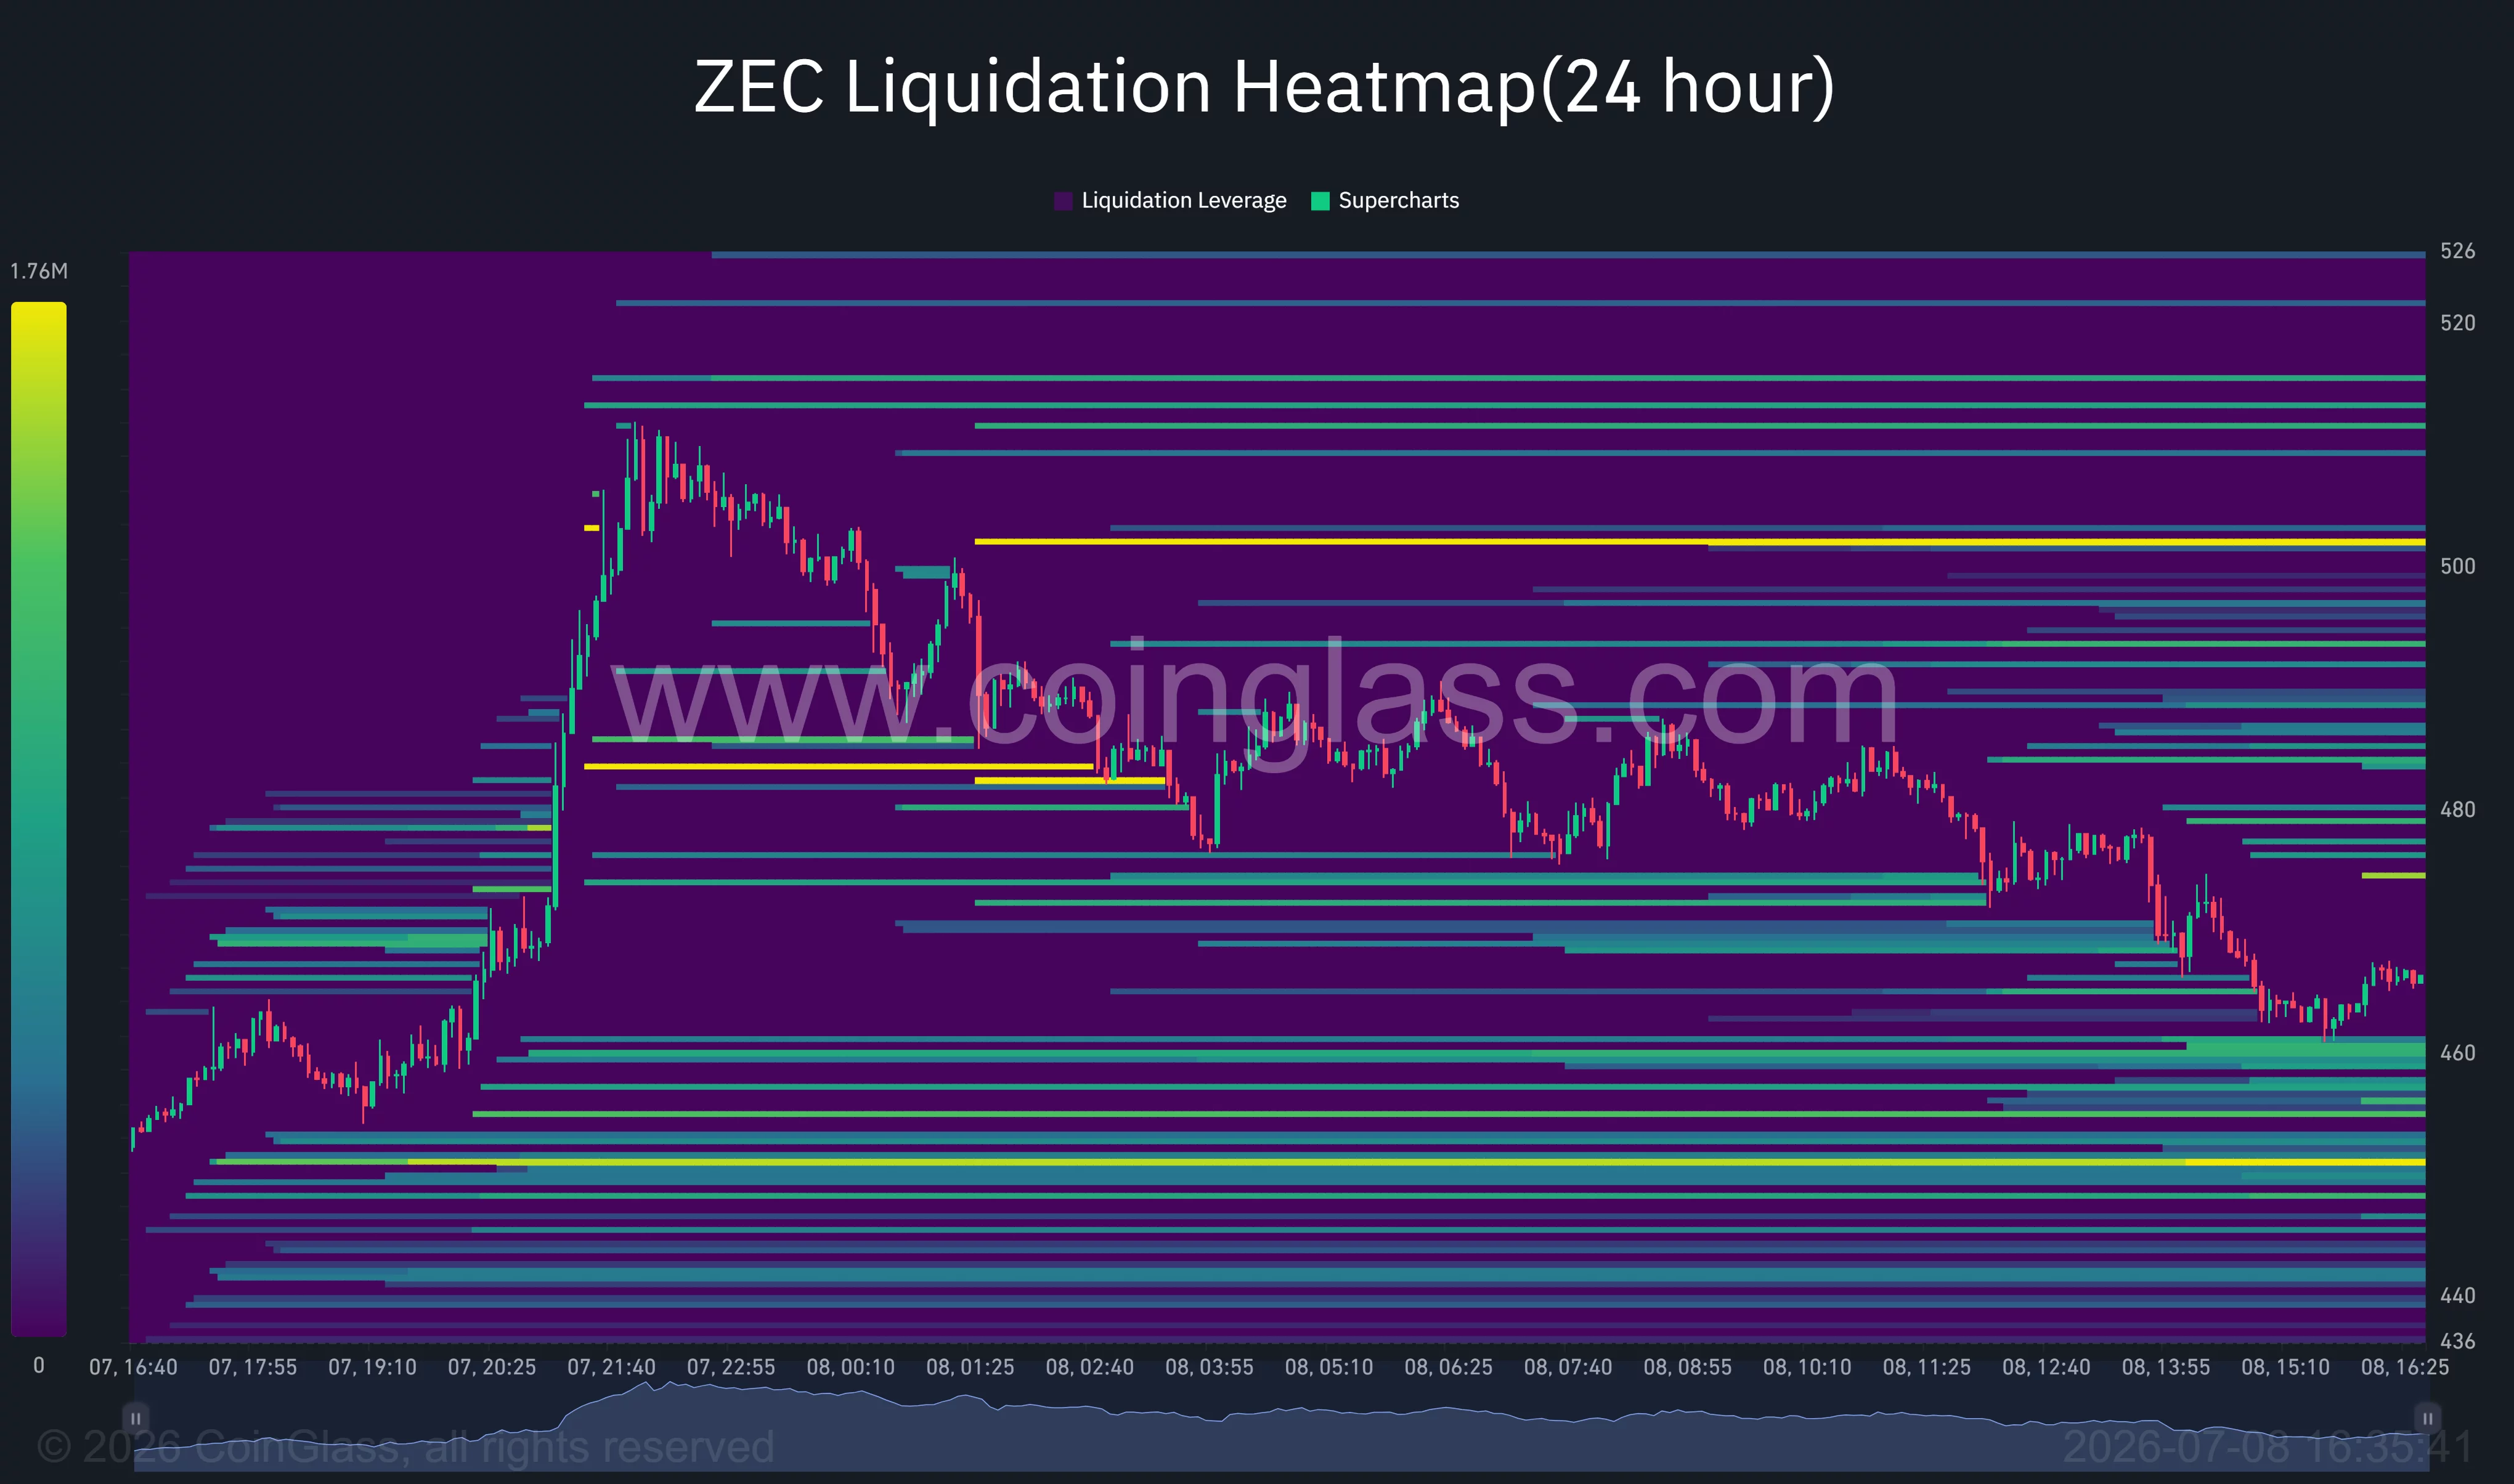
Derivatives positioning presents a similar picture. CoinGlass liquidation data shows dense short liquidation clusters stacked between $480 and $500, with another large concentration sitting just above $520. Those pockets could fuel another squeeze if buyers reclaim the $480 resistance. On the downside, the largest long liquidation liquidity has accumulated near $450, making it an important support area should sellers regain momentum.
Macro risks could delay the next breakout attempt
Outside crypto-specific catalysts, global macro conditions have become less supportive after fresh geopolitical tensions in the Middle East lifted oil prices and pushed U.S. Treasury yields higher. The move triggered another round of selling across technology shares and other risk assets, dragging Bitcoin back toward the $62,000 area and reducing appetite for high-volatility altcoins, including Zcash.
Crypto market liquidity has also weakened. The Coinbase Bitcoin Premium Index recently recorded its longest negative streak on record, highlighting subdued institutional demand from U.S. investors. At the same time, European lawmakers have continued advancing tighter oversight proposals covering decentralized finance, staking services, and privacy-focused protocols, adding another layer of uncertainty for privacy coins.
Those risks leave the technical outlook dependent on a handful of key price levels. Holding above $440 would preserve the current recovery structure and keep another move toward $480 and $500 in play.
A decisive break below that support, however, would invalidate the immediate bullish thesis and expose Zcash to a deeper retracement toward its 200-day exponential moving average near $382, where longer-term buyers may attempt to stabilize the trend.
Disclosure: This article does not represent investment advice. The content and materials featured on this page are for educational purposes only.

Netflix is preparing to release its financial results for the second quarter of 2026. According to the company’s official press release published on 15 June, the earnings report will be released on 16 July, followed by a video interview with management for investors. Back in April, when reporting its first-quarter results, the company warned that content spending would likely peak during the second quarter before moderating in the second half of the year. Investors are now looking to the July earnings release as the first opportunity to assess that forecast, as well as the pace of subscriber and advertising revenue growth.
Technical Analysis
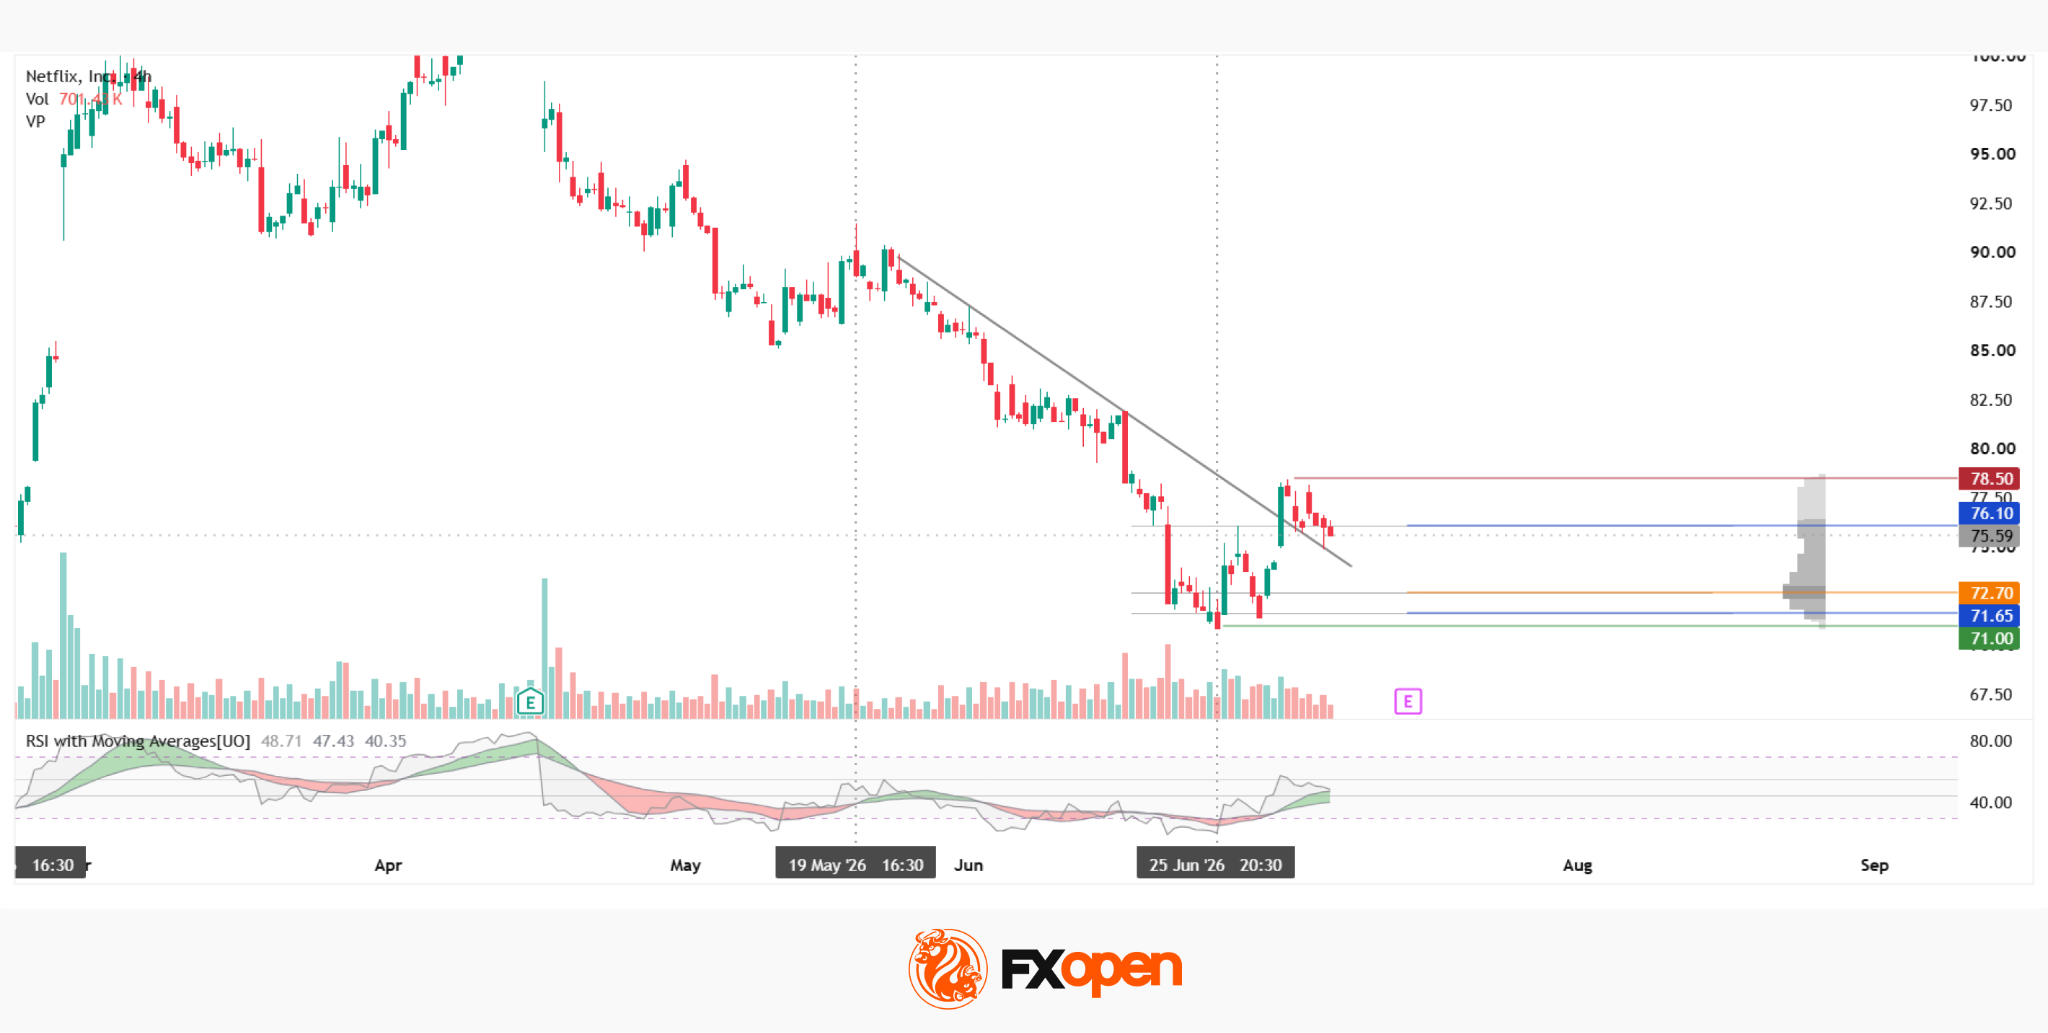
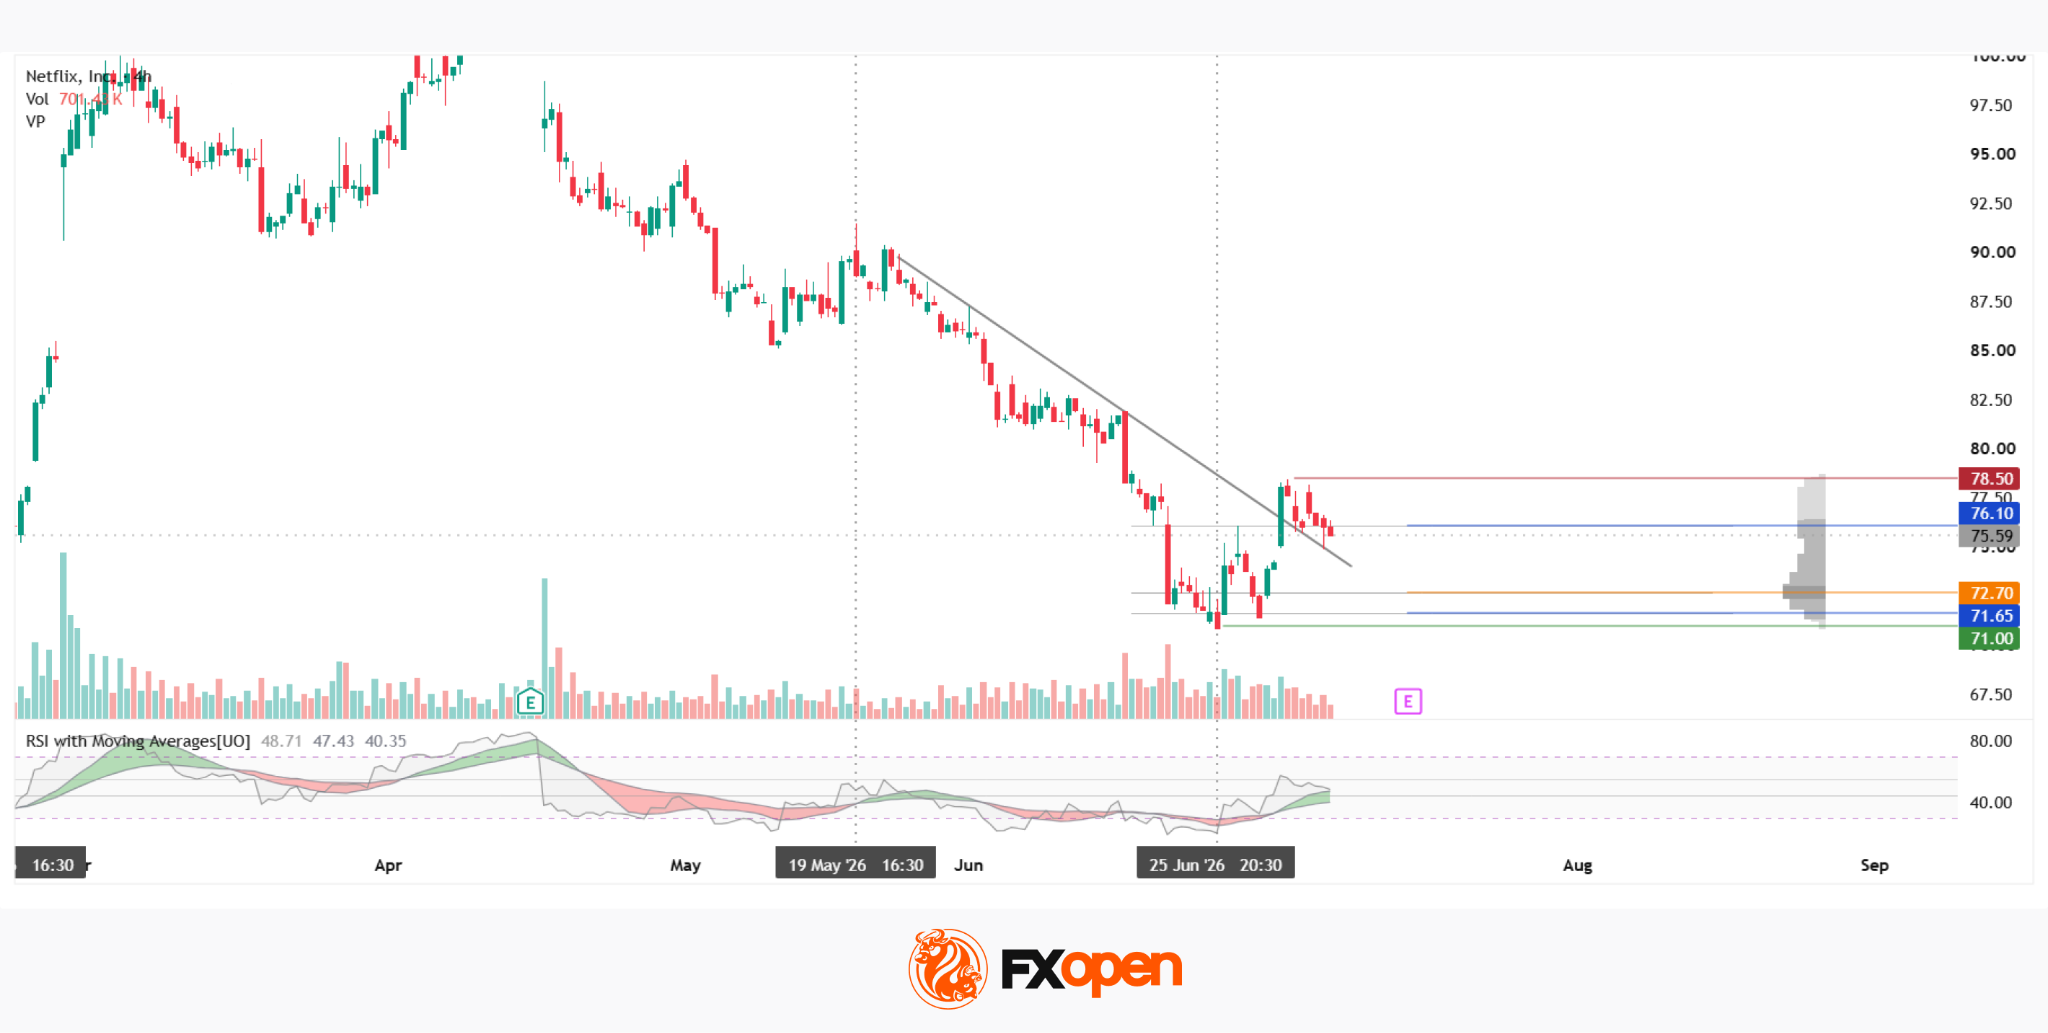
On the four-hour chart, Netflix (NFLX on FXOpen) has been trading within a short-term downtrend since April. The decline accelerated in June, reaching a volume climax on 22 June before the price rebounded from the $71.00 area a few days later. The recovery established a local low, marked on the chart by the green support line.
At the beginning of July, the price attempted to break above the descending trendline, but the bullish breakout candle was completely engulfed by the following bearish candles. As a result of the failed breakout, a local swing high was formed, defining the red resistance level at $78.50, before the price retreated to the upper boundary of the current market profile at $76.10.
The Point of Control (POC) near $72.70 is the nearest significant support level should the pullback continue. Just below it lie the lower boundary of the market profile at $71.65 and the green support zone, which could once again attract buying interest if tested.
The RSI + MAs indicator is currently reading 48, 47 and 40. All three lines remain without a clear directional bias, highlighting the current market indecision.
Key Takeaways
The rebound from the $71.00 area has encountered resistance around $78.50, and without support from fundamental catalysts, it is still too early to conclude that the short-term downtrend has ended. Netflix’s second-quarter earnings release on 16 July could become the key catalyst for the stock’s next significant move.
Buy and sell stocks of the world’s biggest publicly-listed companies with CFDs on FXOpen’s trading platform. Open your FXOpen account now or learn more about trading share CFDs with FXOpen.
This article represents the opinion of the Companies operating under the FXOpen brand only. It is not to be construed as an offer, solicitation, or recommendation with respect to products and services provided by the Companies operating under the FXOpen brand, nor is it to be considered financial advice.
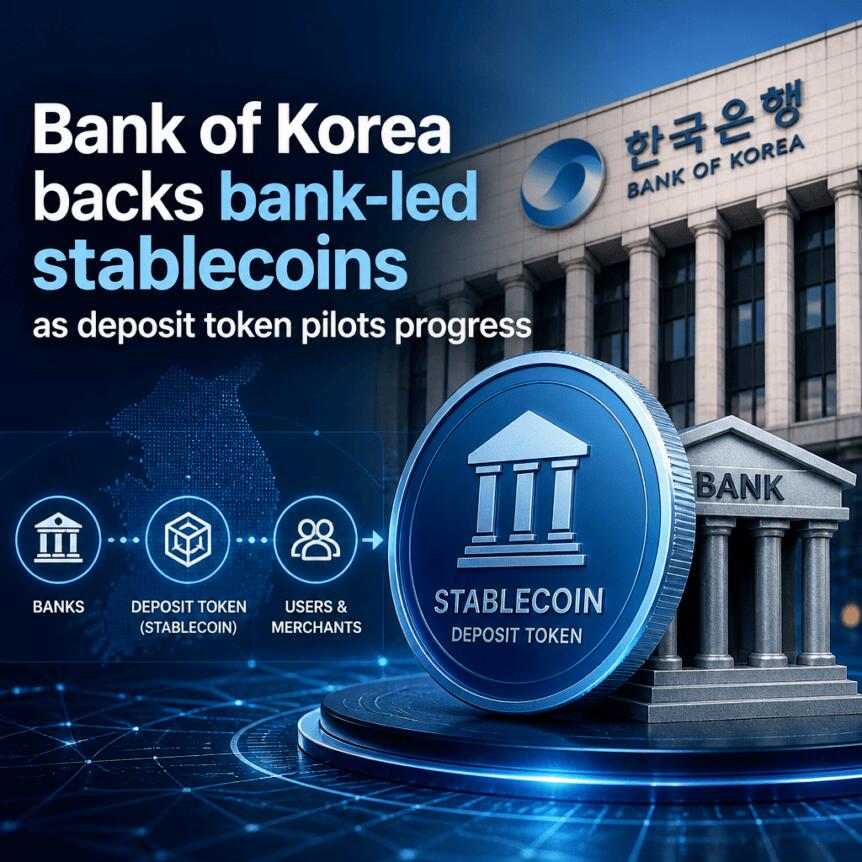
The Bank of Korea (BOK) has reaffirmed that won-denominated stablecoins should be issued through bank-led consortiums, with the central bank urging additional safeguards as lawmakers continue to debate South Korea’s digital asset framework. In materials submitted to the National Assembly’s finance committee on Thursday, the BOK pushed for a structure that keeps issuance centered on banks rather than broader non-bank participation.
Local reporting from Digital Asset and EDaily said the BOK emphasized measures such as priority issuance via bank-led consortiums and the creation of a statutory policy body involving relevant government agencies.
Key takeaways
- The BOK repeated its preference for won stablecoin issuance to be bank-led, using consortium structures as a core safeguard.
- The stance is expected to keep pressure on the Digital Asset Basic Act, where disagreements about who can issue stablecoins have already caused delays.
- BOK also signaled continued work on deposit-token use cases in the second half of the year, including government and everyday payment scenarios.
- South Korea’s stablecoin policy debate remains unsettled, with the bill’s timeline having slipped amid broader political and regional disruption.
Why the bank-led push matters for South Korea’s stablecoin rules
The BOK’s latest comments build on a months-long effort to keep won stablecoin issuance within bank-centered mechanisms. Earlier coverage noted that the central bank has been pressing for a framework in which banks retain dominant ownership or control over stablecoin issuers. That position has already split policymakers and industry groups, and it has contributed to stalling progress on South Korea’s Digital Asset Basic Act.
At the heart of the dispute is a question investors and market participants are watching closely: whether stablecoins will be treated as extensions of regulated banking activity—or as a more open category of financial infrastructure that could involve a wider set of firms. A bank-led consortium approach can tighten oversight, but it may also limit participation and slow down the pace at which new issuers and business models enter the market.
Deposit tokens return to the spotlight
Beyond stablecoins, the BOK also said it plans to keep developing deposit-token use cases in the second half of the year. According to local reporting, those efforts include support for government subsidy payments, vouchers, electric vehicle charging infrastructure, and further real-world transactions aimed at the general public.
Deposit tokens are digital tokens that represent commercial bank deposits. The BOK’s focus on them aligns with a broader direction seen in recent months: using tokenized deposits as a controlled pathway for tokenized payments, while maintaining that core infrastructure rests with regulated banks.
In April, BOK Governor Hyun-Song Shin publicly backed deposit tokens and central bank digital currencies (CBDCs) in his first address, and South Korea’s Ministry of Economy and Finance announced a pilot related to the use of tokenized deposits for government operational spending. By tying next-step development to concrete payment and voucher scenarios, the BOK is effectively linking its stablecoin governance position with a practical, near-term tokenization roadmap that can be tested in the real economy.
The Digital Asset Basic Act: unresolved issuance questions keep delaying progress
The BOK’s reaffirmation comes as lawmakers continue wrestling with how stablecoins, tokenized real-world assets (RWAs), and other digital assets should fit into South Korea’s financial rulebook. Earlier disagreements over stablecoin issuance—especially the question of who should be allowed to issue them—have kept the bill debate active rather than moving toward consolidation.
Cointelegraph has previously reported that the bill has repeatedly stalled over questions about whether stablecoins should be bank-led and, relatedly, about the ownership structure of stablecoin issuers. Local reporting indicates the central bank continues to argue for an approach where banks keep the majority position in stablecoin issuance structures.
Meanwhile, lawmakers have continued considering how to place these assets into existing legal categories. In April, South Korea’s ruling Democratic Party proposed bringing stablecoins and RWAs under existing financial laws, but the central issue of bank-led issuance remained unresolved—suggesting that classification alone may not settle the governance model.
One reason the process has been particularly difficult is that policy decisions on stablecoins now intersect with broader digital asset priorities: tokenized RWAs, deposit-token pilots, and the overall question of how far tokenization should extend across regulated financial services.
Timeline pressure and political headwinds
In January, the government told President Lee Jae-myung it aimed to meet a legislative target by the first quarter of 2026. That timeline has since slipped, and the reasons cited in local reporting include the US-Israeli war with Iran beginning in late February, domestic election cycles, and delays linked to reorganization of the Assembly’s committee structure.
These disruptions matter because they affect how quickly competing approaches—bank-led models favored by the BOK versus broader industry participation—can be reconciled into a single bill text. The longer the stalemate persists, the more uncertainty market participants face regarding licensing, issuer ownership rules, and compliance expectations for any future won stablecoin issuance.
For readers tracking South Korea’s digital asset transition, the BOK’s behavior provides a clear signal: even as negotiations continue, the central bank appears unwilling to move away from bank-led safeguards. At the same time, its continued emphasis on deposit-token pilots suggests the BOK sees tokenized banking deposits as a more immediately actionable and controllable stepping stone.
Going forward, investors and builders should watch whether the National Assembly’s committee deliberations converge on the BOK’s bank-led issuance model—or whether lawmakers carve out room for alternative issuer structures. Equally important will be how the promised second-half work on deposit-token use cases progresses, since real-world pilots can shape what regulators ultimately tolerate in the stablecoin ecosystem.
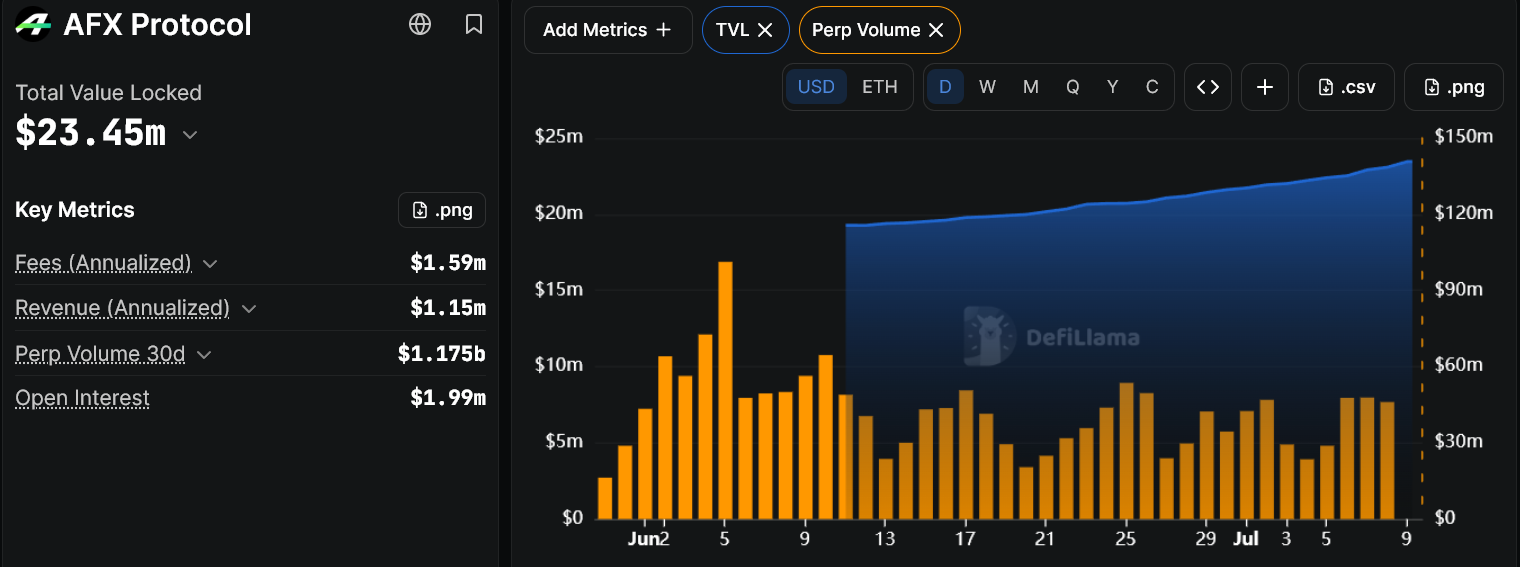
Perpetual futures are right now crypto’s most active trading category. DefiLlama data showed $21.9 billion in perp DEX volume over 24 hours on July 3, 2026, with open interest across derivatives protocols at about $15.5 billion.
But the market is dominated and defined by Hyperliquid. The exchange led the sector with about $250.5 billion in 30-day perp volume, leaving little serious competition at the top.
That gap explains why new trading chains are still entering the market. The demand is clear, but the winner is not yet protected by regulation, brand loyalty, or deep institutional lock-in.
AFX is one of the newer challengers. It is a sovereign Layer 1 built around perpetual futures, with a fully on-chain order book, on-chain matching and settlement, zero-gas execution, 100ms median latency, fair ordering, and MEV-resistant protection.
On paper, the pitch is long. But the actual goal is simple: give traders Hyperliquid-style speed and liquidity, but with more of the trading stack moved fully on-chain.
Platform
Core model
What it has proved
Where AFX differs
Hyperliquid
Custom trading L1
Deep perp liquidity and strong trader adoption
AFX follows a similar trading-chain thesis, but from a much earlier base
dYdX Chain
Cosmos-based appchain
Perp DEXs can leave shared execution environments
AFX pushes more of the order flow and matching process on-chain
GMX
Pooled liquidity and oracle pricing
Traders will use pool-backed leverage without a central order book
AFX is built around exchange-style order book trading
Drift
Solana-native hybrid model
Fast execution can support active perp trading
AFX uses a sovereign L1 rather than Solana infrastructure
Lighter
ZK-verified derivatives
Verification can become part of exchange design
All fees are redistributed to users
Aevo
Rollup-based derivatives
Derivatives can run through a dedicated rollup
AFX takes the more vertically controlled L1 route

The comparison is not whether AFX has more features than these platforms. The real question is whether its design solves the problems that matter during live trading: fast order placement, reliable cancels, deep maker liquidity, stable liquidations, and predictable execution when markets move sharply.
AFX Vs. Hyperliquid and dYdX
AFX sits closest to Hyperliquid and dYdX, but the comparison is practical rather than one-to-one.
Hyperliquid is the liquidity benchmark. It has already proved that a custom trading L1 can attract serious perp volume, open interest, and trader mindshare.
AFX follows a similar high-performance trading-chain thesis, with 100ms median latency, zero-gas execution, on-chain orderbook trading, and deterministic ordering. Its challenge is proof: deeper liquidity, more market makers, and a longer record during volatile markets.
dYdX is the architecture benchmark. Its Cosmos-based chain uses in-memory orderbooks to keep trading fast while blocks sync the final state.
AFX pushes more of the trading process on-chain, including order placement, matching, and settlement. That gives traders more visible execution data, but it also raises the performance test.
Perp traders punish slow cancels, delayed matching, and weak liquidation systems quickly.
AFX Versus Lighter, Drift, and Aevo
Lighter, Drift, and Aevo really show how varied the perp DEX field has become:
- Lighter emphasizes ZK verification for matching and liquidations;
- Drift uses Solana-native execution with a hybrid system combining an AMM and a central limit orderbook;
- Aevo uses an EVM-based optimistic rollup for derivatives trading.
AFX differs through vertical control. It uses a trading-specific L1 and aims to coordinate consensus, orderbook execution, settlement, margin, liquidation, APIs, and trader UX inside one dedicated system.
This is also where the AI-agent angle becomes important. AFX offers agent wallets that can place, cancel, and modify orders, update leverage and margin mode, and receive private WebSocket data.
Moreover, users can limit agent permissions for withdrawals, transfers, agent authorization, revocation, and vault operations.
Risk Design During Market Stress
Perp DEX quality becomes visible during volatile markets. Mark-price design, liquidation mechanics, and backstop liquidity determine whether traders face orderly execution or unstable loss socialization. A strong venue needs risk controls able to hold up when price moves become fast, liquidity thins, and leverage unwinds at once.
AFX highlights several risk controls: manipulation-resistant mark pricing based on native orderbook data and external exchange feeds, staged liquidations, backstop liquidity through its vault, and capped open interest per market.
Security also deserves a word. Zellic’s public audit repository lists an AFX Bridge audit from May 2026 on EVM, which supports mention of a third-party audit for the bridge scope.
A Note on Incentives and Trader Alignment
Perp DEXs often compete through points, rebates, fee tiers, maker rewards, vault yield, and revenue sharing. These tools can seed order flow, attract market makers, and reward active traders, although long-term value depends on sticky liquidity after rewards cool.
AFX’s VIP Program is a great example, where high-volume traders can receive lower fees and a share of platform fee revenue, with 30% to 50% of protocol revenue allocated across eligible tiers.
Importantly, AFX’s revenue sharing may help attract professional traders, but its durability will depend on execution quality, spreads, open interest, trader retention and more.
AFX Tokenomics and Community Distribution
AFX’s tokenomics also support its active-trader positioning. The model is built around community distribution first, with 73% of the 1 billion token supply allocated across genesis distribution, protocol incentives, core community, and ecosystem development.
The largest single bucket is protocol incentives at 30%, which means the token model is designed to reward ongoing trading activity, liquidity participation, and node staking rather than only early access.
Genesis distribution accounts for 27% of supply and is fully unlocked at TGE, creating meaningful early float from day one instead of concentrating liquidity around delayed unlocks.

AFX also has no VC allocation and no private rounds, which gives the token model a user-participation angle rather than a private-investor allocation structure. Core contributors receive 19% of supply, but this allocation has no TGE unlock, a one-year cliff, and 36-month linear vesting. This ties contributor incentives to longer-term protocol development rather than immediate liquidity.
The treasury allocation is set at 8% and is intended for compliance, infrastructure, and risk reserve needs under governance and foundation discretion. Points also connect current user activity with future token distribution, with a fixed 10 million-point pool across three seasons and conversion expected at TGE.
Who AFX Is Really Built For
AFX makes the most sense for traders who care about execution control rather than simple leveraged exposure.
- Active perp traders who want order book trading, fast order placement, and more control over entries, exits, and cancellations.
- Market makers and high-volume traders who need low fees, API access, predictable sequencing, and enough technical transparency to monitor execution quality.
- On-chain-native traders who prefer public settlement, visible order flow, and a trading stack that keeps more of the exchange process on-chain.
- Automated strategy builders who want agent wallets, private WebSocket data, and permission controls for bots or AI-assisted trading systems.
- Traders looking beyond crypto pairs who want perpetual exposure to stocks, indices, metals, and commodities inside a crypto-native venue.
AFX is less suitable for casual users, passive DeFi investors, or traders who only want a simple leverage product with minimal setup. It is also not the obvious first choice for users who prioritise the deepest existing liquidity, the longest operating history, or the broadest stress-tested track record.
For those traders, Hyperliquid, dYdX, or GMX may still feel safer until AFX proves its liquidity, uptime, and liquidation design across more volatile market cycles.
The open issue is proof. AFX has early volume, a defined technical thesis, and a set of features aimed at active traders, but the strongest perp venues are judged over time. Liquidity depth, uptime during volatility, liquidation behavior, independent audits, and trader retention will matter more than launch metrics.
The post AFX Enters the Perp DEX Race Hyperliquid Already Leads, How is It Different? appeared first on BeInCrypto.
Crypto World
Bitcoin (BTC) price climbs to $63,000 as markets shrug off Iran airstrikes: Crypto Markets Today
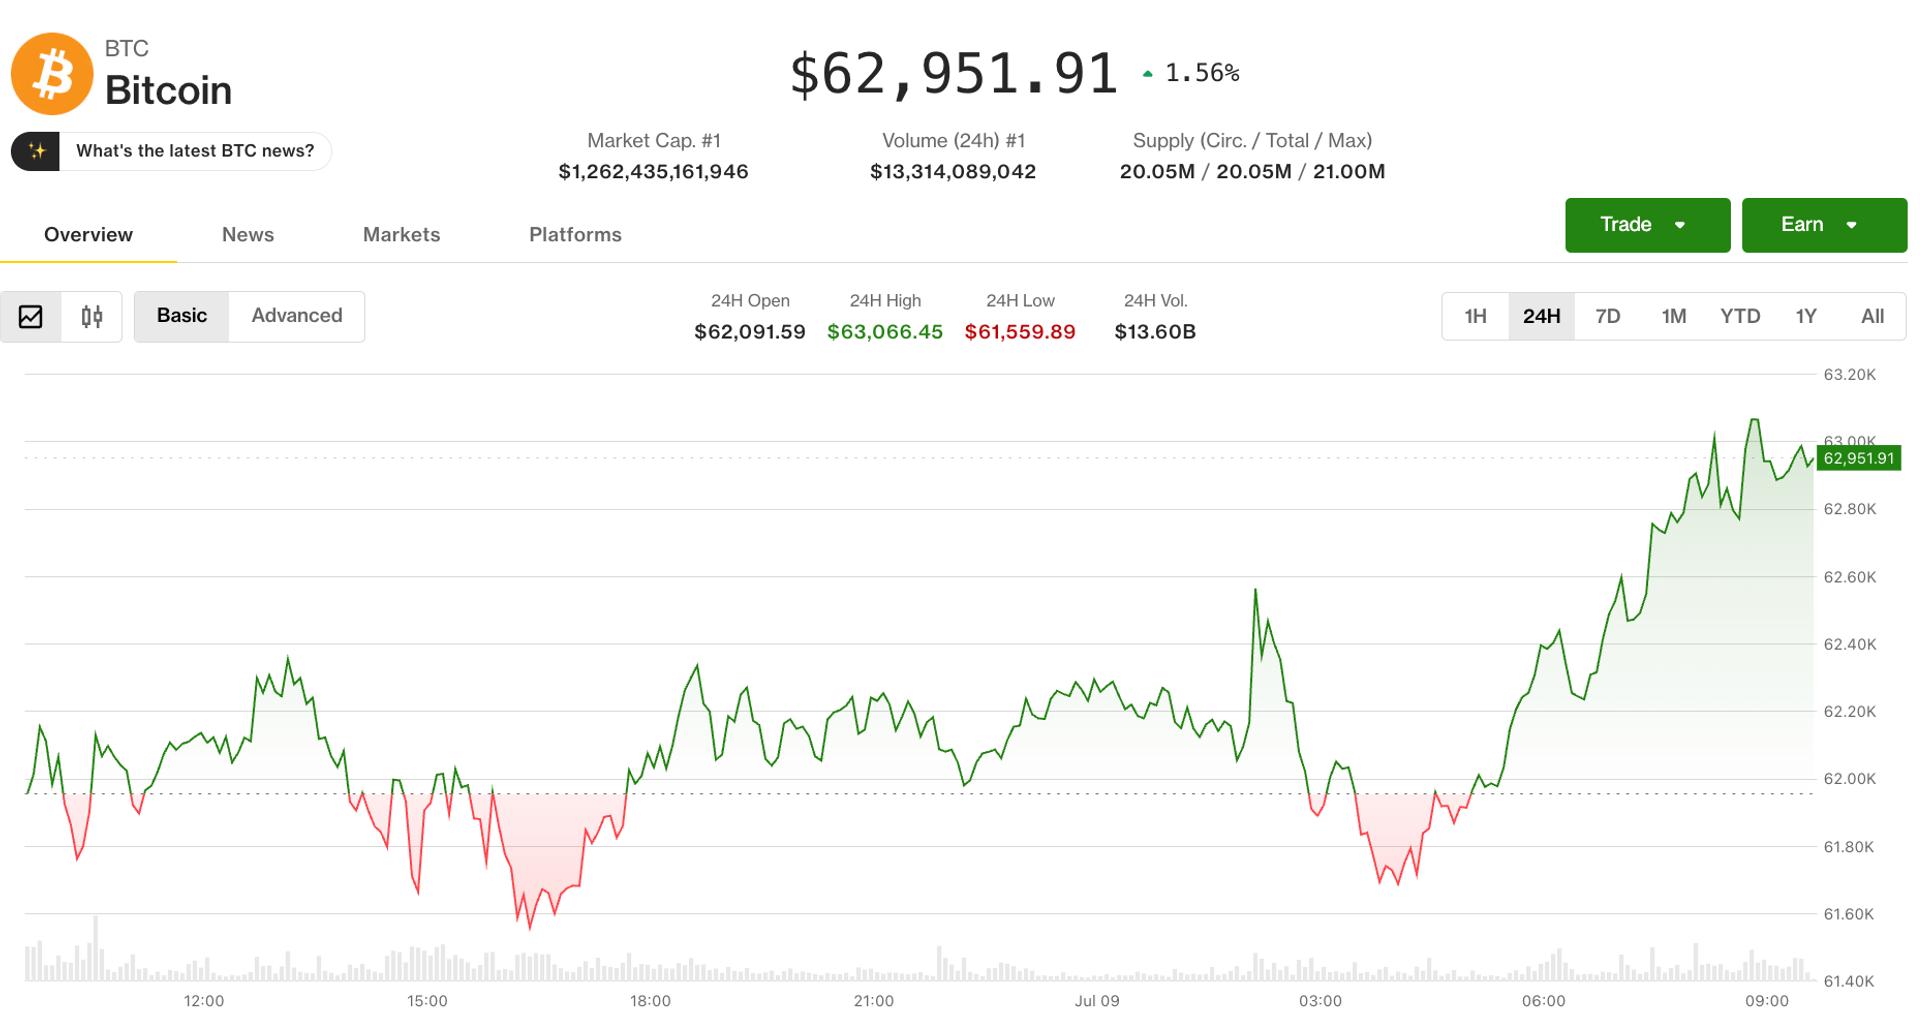
The crypto market bounced back from a mid-week lull on Thursday, with bitcoin rising by 1.2% since midnight UTC to $63,000 while ether (ETH) advanced 0.75% to $1,755.
The move tracked U.S. stock market gains, as Nasdaq 100 index futures added 2.6% over the past 24 hours despite the escalation of tensions between the U.S. and Iran.
U.S. Central Command said it hit 90 military targets in the latest round of airstrikes, which took place 24 hours after President Donald Trump said the ceasefire was over.
Markets initially sold off at the time, but crypto remained resilient, rallying from oversold territory to extend a relatively hot streak since the turn of the month.
Bitcoin is now 9% higher than June’s monthly close and a selection of altcoins has continued to outperform with lighter (LIT) and ether.fi (ETHFI) surging by around 35% over the same period.
Derivatives positioning
- The crypto futures market is taking a breather, with 24-hour volume dropping almost 20% at $191 billion and open interest (OI) steady near $106 billion.
- Bitcoin’s overnight recovery to nearly $63,000 is accompanied by a decline in open interest in major dollar and USDT-denominated futures to 266K BTC from 272K BTC. These diverging trends shows investor reluctance to take leveraged bets in such a volatile macroeconomic environment. The same is true for ether, XRP and solana.
- OI in Canton Network’s CC token futures increased for a third straight day, with the tally rising to 271 million tokens, the most since May 31. The token continues to slide and, as noted yesterday, the concurrent increase in futures OI points to an influx of short positions or bearish bets.
- Activity in perpetual futures tracking the S&P 500 index is again picking up, with OI increasing to the highest since SpaceX debuted on Nasdaq nearly a month ago.
- BTC and ETH’s 30-day implied volatility indexes are back under pressure, snapping a two-day winning streak in a sign of renewed supply of options and expectations for market calm.
- On Deribit, BTC and ETH puts remain pricier than calls across all time frames, reflecting downside concerns. The sentiment on Wall Street is the polar opposite: The average skew in S&P 500 stock options shows a record bias for calls, or bullish bets.
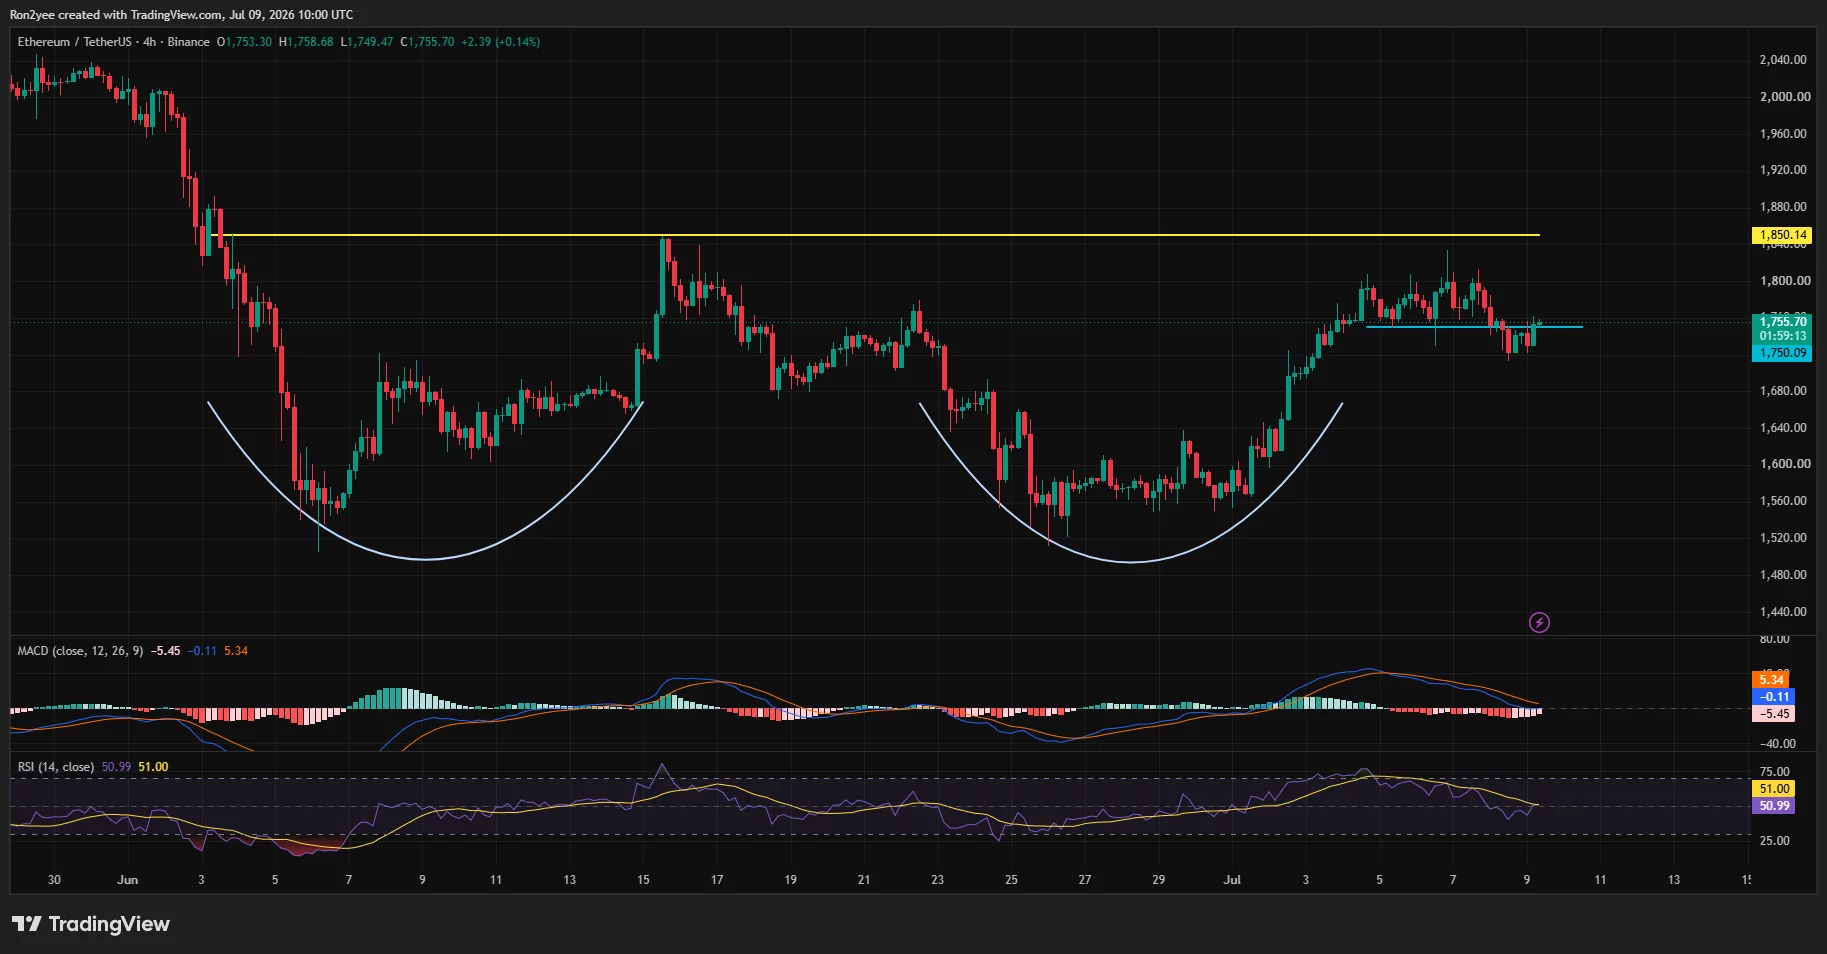
Ethereum price has remained pinned near $1,750 after renewed Middle East tensions triggered a risk-off mood across financial markets and sellers once again defended the $1,800 resistance zone.
Summary
- Ethereum price remains stuck near $1,750 as Middle East tensions keep risk appetite subdued across crypto markets.
- Repeated rejection at $1,800 and heavy liquidation clusters continue to block a sustained ETH breakout.
- A break below $1,750 could expose $1,700, while reclaiming $1,800 may trigger a short squeeze toward $2,000.
According to data from crypto.news, Ethereum (ETH) price traded around $1,756 on Wednesday after failing to sustain multiple attempts above $1,800 during the past week. The latest rejection followed U.S. airstrikes on Iranian military targets after Iran reportedly fired on civilian shipping near the Strait of Hormuz, sending investors toward traditional safe-haven assets and limiting demand for cryptocurrencies.
The conflict also disrupted diplomatic efforts that had already paused during Iran’s official mourning period for Supreme Leader Ali Khamenei.
At the same time, regulatory uncertainty in the U.S. has discouraged fresh institutional positioning. The Securities and Exchange Commission updated its 2026 rulemaking agenda on July 7 and July 8 with three cryptocurrency proposals covering safe harbors, broker-dealer capital requirements, and alternative trading systems.
While the framework offers more regulatory clarity than enforcement-led oversight, major investors continue to await the fate of the CLARITY Act before deploying additional capital into digital assets.
Ethereum remains trapped between strong support and heavy resistance
Ethereum’s price structure continues to compress inside a well-defined range. The 4-hour chart shows repeated failures near the $1,850 resistance area, while buyers have repeatedly defended support around $1,750. The latest rejection formed after ETH completed another rounded recovery pattern but stalled below horizontal resistance, extending a trading range that has dominated price action for several sessions.
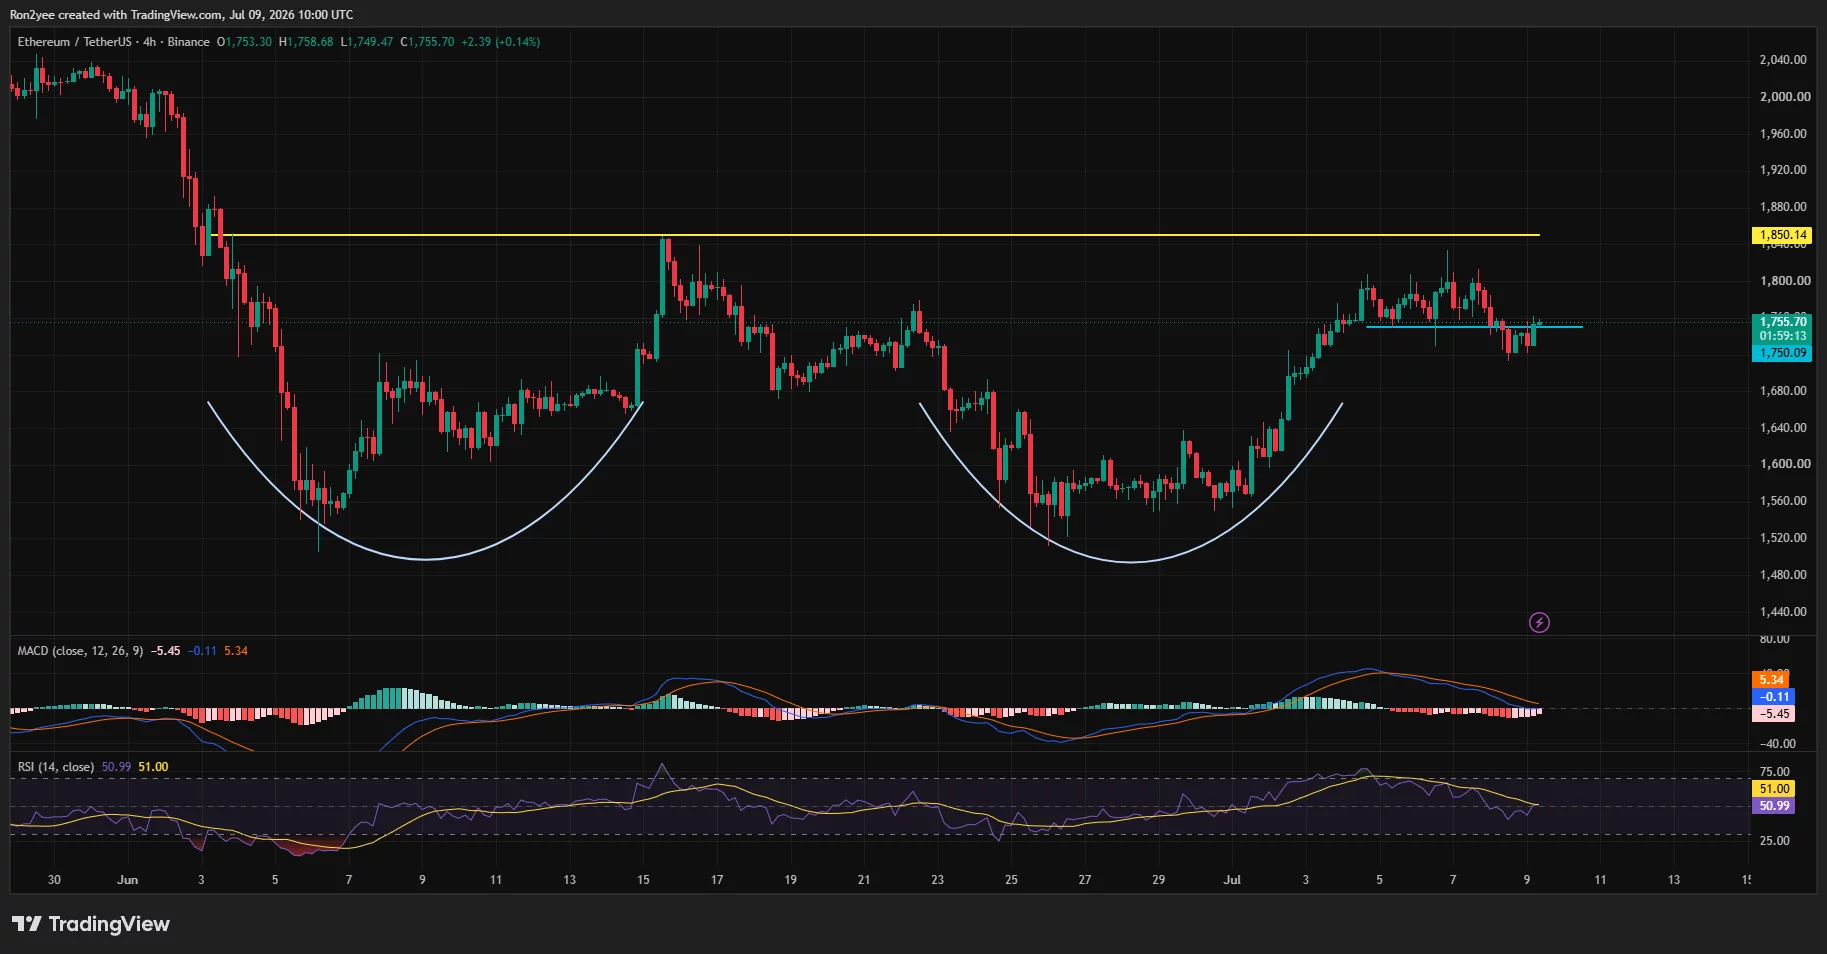
According to crypto analyst Daan Crypto Trades, “ETH Rejected at $1800 for the fourth time this last week. This resistance has held every single attempt so far… Below, this $1750 region remains key.” His chart identifies $1,750 as the lower boundary of the current range, with a decisive move beyond either level likely to determine Ethereum’s next directional trend.
Daily technical indicators present a mixed picture. Ethereum has reclaimed a descending trendline that capped prices since May and continues to trade above the 78.6% Fibonacci retracement level near $1,703.
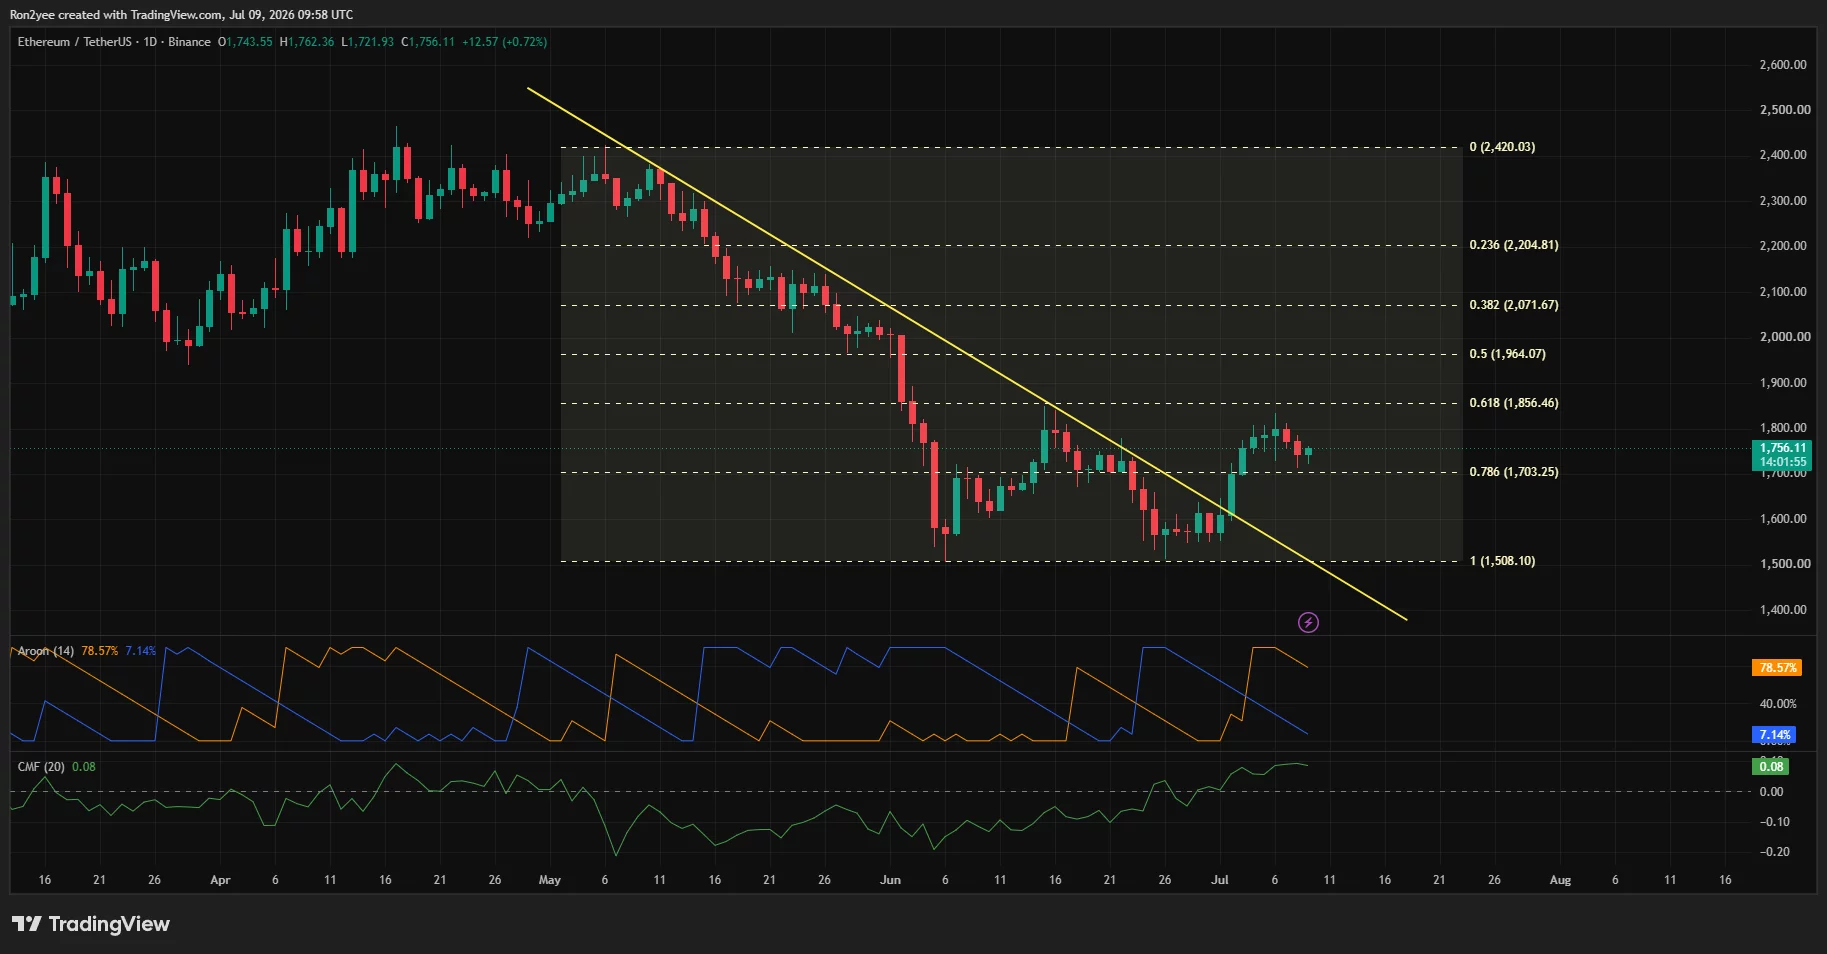
Chaikin Money Flow remains positive at 0.08, suggesting capital continues to enter the market, while the Aroon Up reading remains dominant. Momentum, however, has slowed as the 4-hour MACD histogram turned negative and the RSI eased toward the neutral 50 level after briefly approaching overbought territory earlier this month.
Derivatives positioning also argues for continued volatility rather than an immediate breakout. CoinGlass liquidation data shows one of the largest short liquidation clusters sitting between roughly $1,770 and $1,780, with even larger concentrations extending toward the $1,800-$1,850 region. A sustained move through those levels could trigger cascading liquidations and accelerate upside momentum.
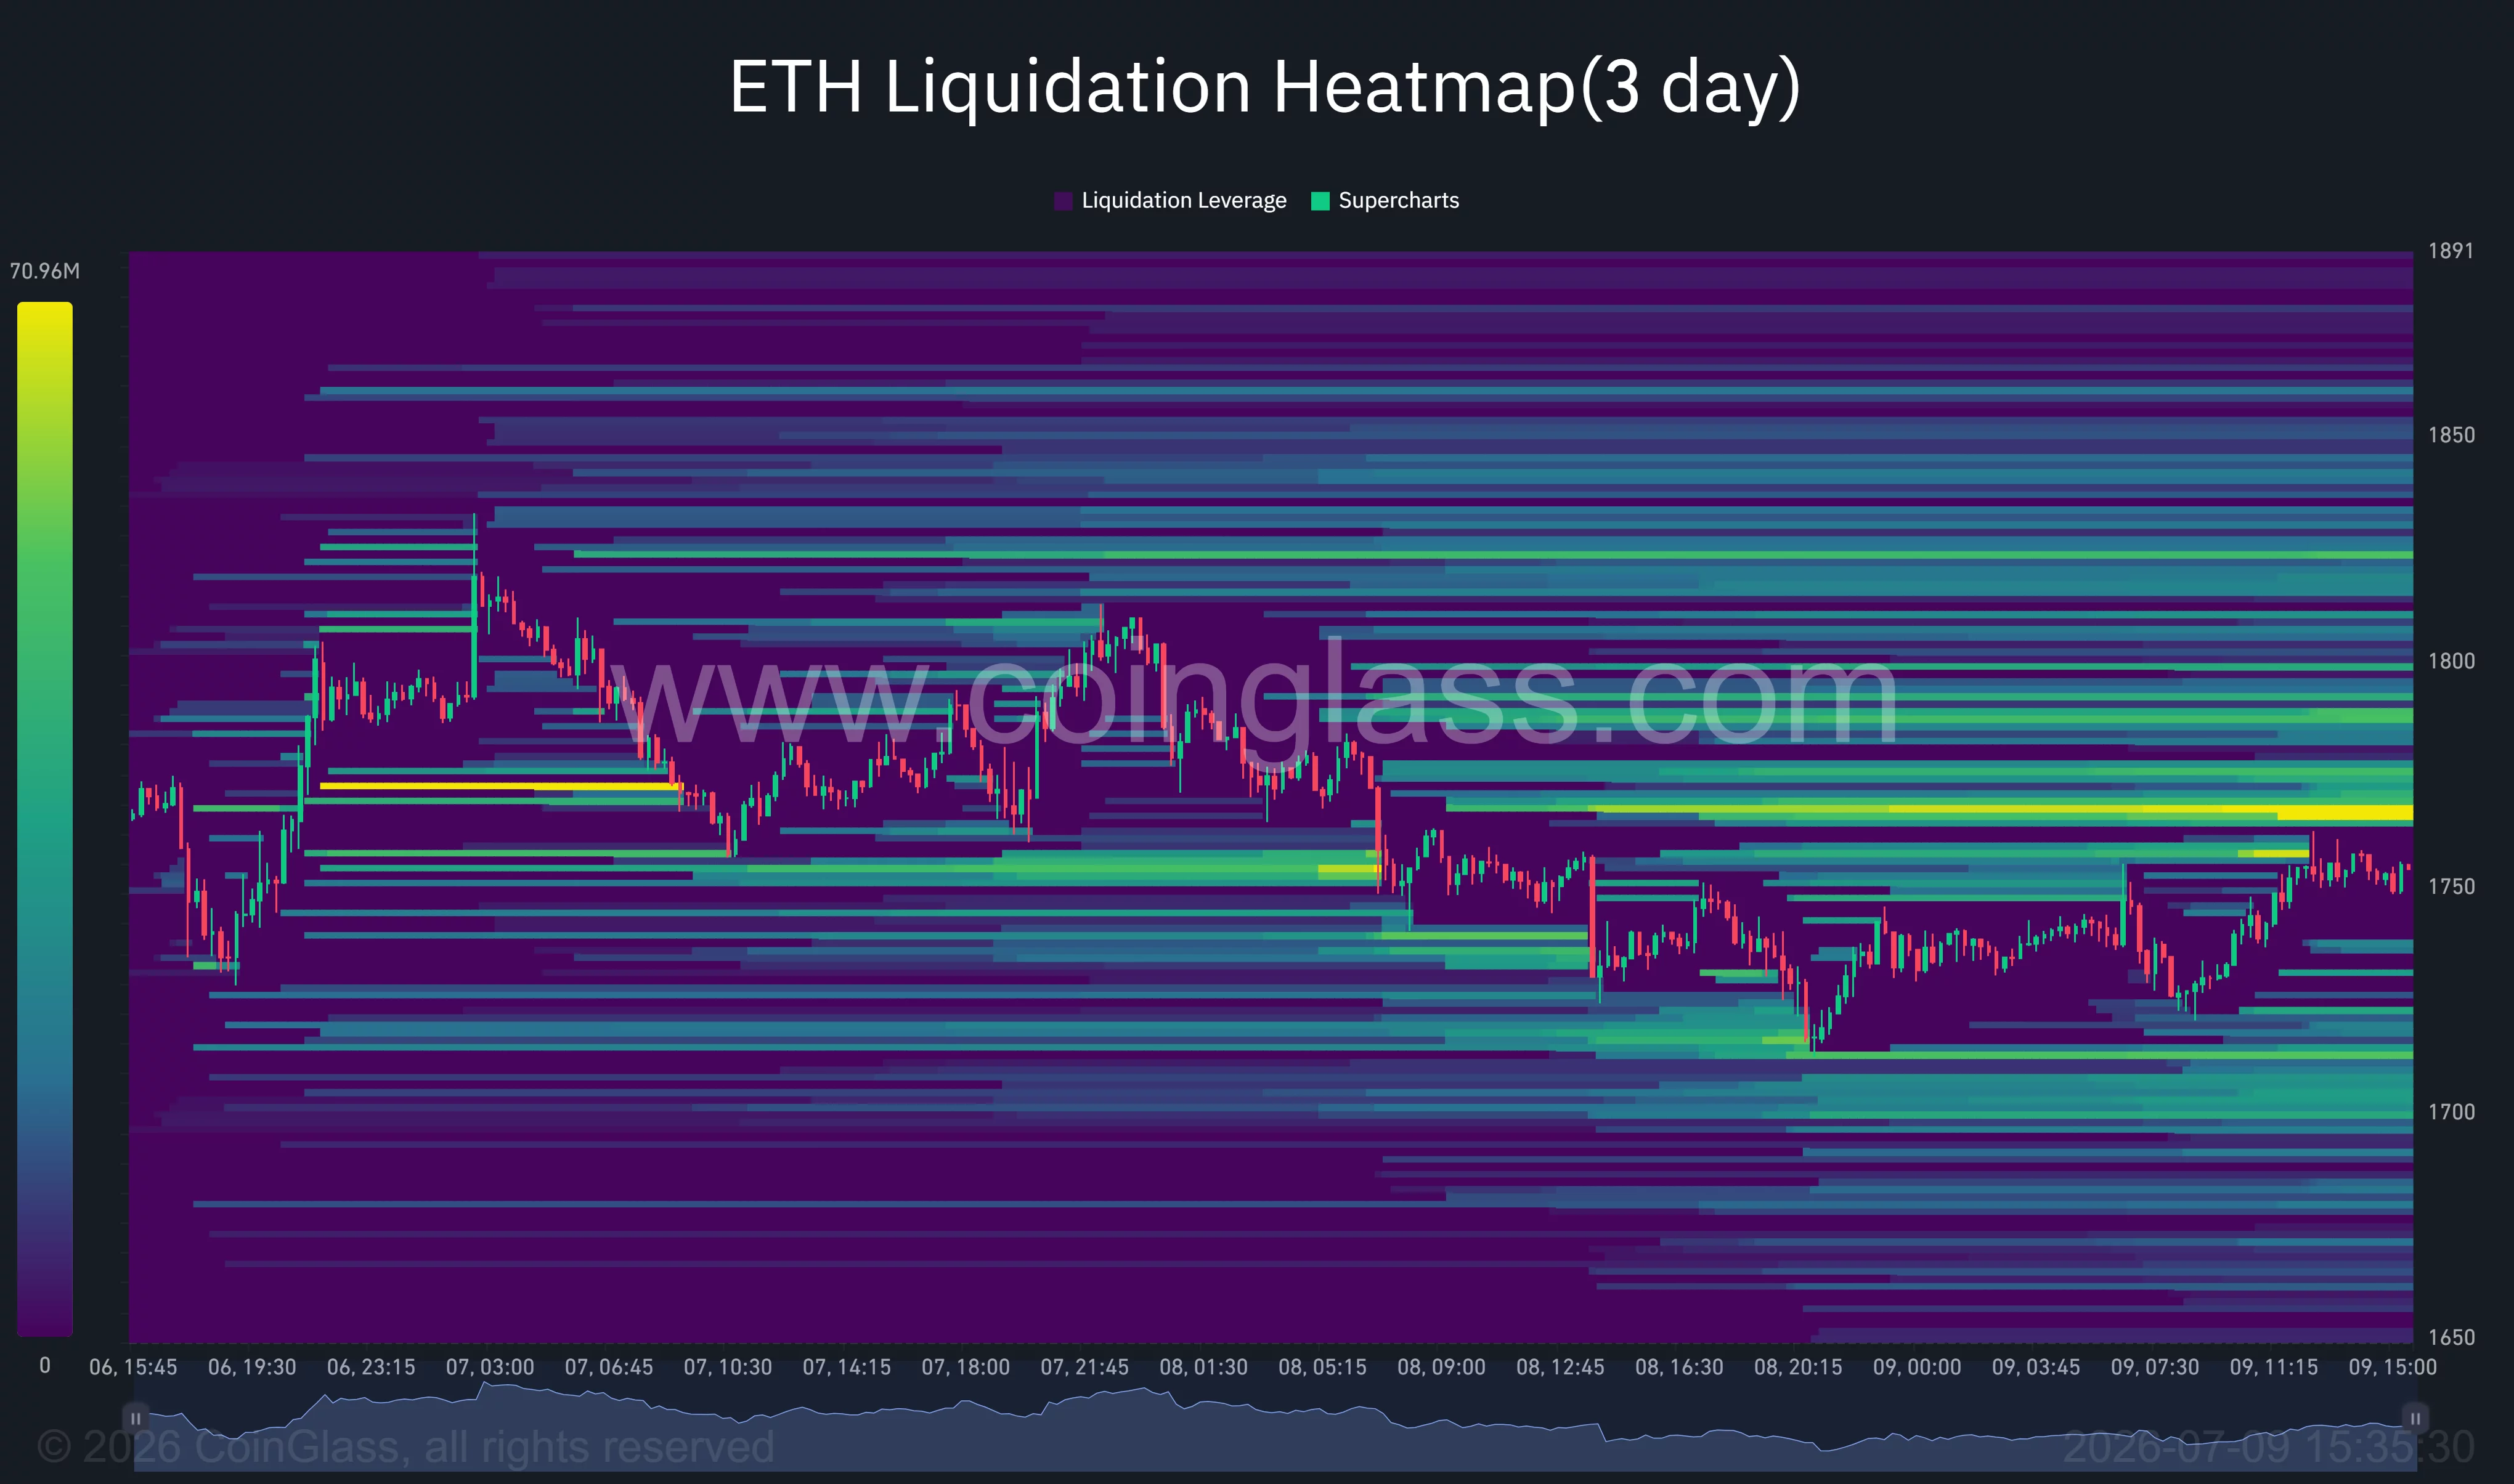
On the downside, notable long liquidation pools have developed around $1,720 and near the psychological $1,700 level, leaving both directions vulnerable to sharp moves if either boundary gives way.
Beyond price action, Ethereum continues to face structural headwinds inside its own ecosystem. Activity has increasingly migrated toward layer-2 networks and competing layer-1 blockchains, reducing activity on Ethereum’s mainnet. Lower transaction fees have weakened ETH’s burn rate while decentralized finance activity remains below previous cycle highs.
Even Vitalik Buterin’s newly released Lean Ethereum roadmap, which outlines upgrades for scalability, privacy and quantum resistance through 2029, has so far failed to generate a meaningful market response.
A break below $1,750 could reopen the path toward $1,700
The bullish case remains intact as long as Ethereum holds above its current support band. Commenting on the market, analyst Ted Pillows argued:
“ETH is still holding above the $1,750 level. As long as Ethereum stays above it, there’s a decent chance of a relief rally.”
His chart identifies the next upside objective near $2,000 if buyers reclaim momentum.
A close below $1,750 would weaken that outlook. Such a move could expose the $1,720 liquidity pocket before opening the door toward $1,700 and the nearby 200-day moving average around $1,694.
Additional geopolitical escalation, higher oil prices, delays to U.S. crypto legislation, or another wave of risk-off selling across global markets could strengthen bearish pressure and postpone Ethereum’s attempt to reclaim the $1,800-$1,850 resistance zone.
Disclosure: This article does not represent investment advice. The content and materials featured on this page are for educational purposes only.

Although it has rebounded by $5,000 since its July 1 low at under $58,000, bitcoin remains in a highly pressured market structure that has halted each major breakout attempt.
There are good reasons for that, of course, as multiple factors have aligned to keep it suppressed. Here are five of them.
Macro Landscape
The first reemerged yesterday when the US and Iran broke the ceasefire and initiated new attacks against each other in the Middle Eastern region. The actual threat came hours later when, during a NATO meeting, US President Donald Trump said he believes the memorandum of understanding between the two nations is over.
A new wave of attacks followed earlier this morning before Trump claimed, once again, that Iran wanted a peace deal ‘badly’ and had resumed contact. However, similar statements have been made multiple times in the past, but a deal is yet to be reached.
The second macro reason comes from the Federal Reserve, which continues to refuse to lower interest rates. Moreover, recent reports indicated that several Fed officials considered raising the rates in one of the next FOMC meetings. They justified this with the war’s fallout, as oil prices continue to rise and inflation is jumping in tandem. Similar moves tend to increase the pressure on risk-on assets, such as bitcoin and the altcoins.
Strategy, ETFs, and Coinbase
Aside from the aforementioned macro reasons, the tighter landscape around bitcoin is not flourishing either. Perhaps the most painful one comes from Michael Saylor’s Strategy. The company that has consistently accumulated BTC over the last five years and enhanced its purchases in late 2024 sold twice in the past couple of months. The last one, announced earlier this week, was even more worrisome as it was for over 3,500 units.
The ETFs are the fourth overall reason. They lost over $8 billion from the total cumulative flows in just two months. Some weekly numbers set anti-records with over $1.5 billion leaving in just five trading days. Although they managed to turn green in three out of the last four business days, the demand still lacks, and BTC would need a major trend reversal to change its trajectory.
The last key factor that we will discuss in this article is the Coinbase Bitcoin Premiums Index. The metric measures the difference between BTC on the largest US exchange and the global average. In general, if it’s positive, it means that the demand for the asset in the States is higher, and vice versa.
The reality shows that it hasn’t been positive for a very long time. Recent data provided by Wu Blockchain noted that the metric had been in a negative state for a record 50 consecutive days. The previous anti-record was again in 2026 and lasted for 40-days – from January 16 to February 24. Once it flipped, BTC went from $64,000 to $76,000 in about a month.
Coinbase Bitcoin Premium Index Hits Record 50-Day Negative Premium Streak
According to Coinglass data, the Coinbase Bitcoin Premium Index has remained negative for 50 consecutive days since May 19, extending the longest negative streak since the indicator was launched. The… pic.twitter.com/jwGfPK6iCj
— Wu Blockchain (@WuBlockchain) July 7, 2026
The post 5 Key Reasons Bitcoin’s Price Remains Under Heavy Pressure appeared first on CryptoPotato.

Trading on the forex market isn’t just about reading charts and sensing where price is headed next. It’s also a steady stream of routine work — calculations, analysis, news monitoring, and technical checks. The more services and browser tabs a trader has to juggle at once, the higher the chance of a mistake and the slower the reaction to a sudden market move. That’s why one of the biggest factors behind comfortable, effective trading isn’t necessarily how clever a single indicator is — it’s how convenient the overall ecosystem is when every tool a trader needs lives in one place.
The problem with scattered tools
A beginner trader often discovers that fully preparing for a trade means checking a dozen different resources: one site for the economic calendar, another for calculating position size, a third for volatility analysis, and finally the actual trading platform to place the order. Switching between tabs eats up time, and on a fast-moving market every second can matter. On top of that, data pulled from different sources isn’t always in sync — quotes may differ slightly, spreads may be calculated differently, and formulas may rest on different assumptions.
Experienced traders know that the fewer “seams” there are between preparing a trade and executing it, the lower the risk of a technical error. When a broker offers a built-in set of analytical and calculation tools directly inside the trading terminal or on its website, this significantly simplifies the workflow and reduces cognitive load.
What a trader should have close at hand
A well-rounded toolkit integrated into a single ecosystem usually includes:
- An economic calendar — so you can see important data releases in advance and avoid getting caught in a sharp price swing.
- Technical and fundamental analysis from the broker’s analysts, useful as a starting point for your own conclusions.
- A tool for calculating pip value, commonly known as a pip calculator, which quickly shows how much one pip of price movement is worth in your account currency for a given trade size.
- A tool for sizing trades, or position size calculator, which lets you match your risk per trade to your account balance and stop-loss distance without manual math in a notebook or a third-party spreadsheet.
- Historical and streaming quote data for backtesting strategies.
- A personal account dashboard where you can quickly review trade history, commissions, and swap charges.
When all of these elements are gathered on a single platform, a trader spends less time on preparation and more time on actually analyzing the market and making sound decisions.
An example of the integrated approach: Dukascopy
A good illustration of this approach is the Swiss bank and broker Dukascopy. The company has spent years building out its own trading ecosystem, which includes not just trading platforms (such as its proprietary JForex) but also a broad set of supporting services: historical quotes for nearly every instrument, publicly available technical and fundamental reviews, an economic calendar, and a block of calculation tools that includes pip and margin calculators.
This kind of integrated setup means a trader never has to leave their familiar environment — all the data is consistent, quotes come from a single source, and calculations reflect the actual execution conditions of that specific broker rather than some averaged market parameters. For traders who are active across multiple instruments at once, this saves real time and cuts down on technical slip-ups.
How this affects trading results
Convenience isn’t just a matter of comfort — it’s a direct factor in risk management. When sizing a position takes a few seconds inside the platform’s interface instead of five minutes in a separate app, a trader is far more likely to actually run that calculation before every trade, rather than relying on gut feeling. The same goes for understanding pip value: knowing exactly how much a certain number of pips will cost helps set stop-loss and take-profit levels more precisely and avoid situations where the real risk on a trade ends up larger than planned.
On top of that, a unified ecosystem reduces the chance of simple but costly mistakes — using stale quotes from a third-party source, for instance, or miscalculating a cross-currency conversion. This matters especially for traders working several currency pairs at once or running intraday strategies with dozens of trades a day.
Conclusion
Forex trading demands not just analytical skill but organization. Having every necessary tool — from the economic calendar to calculators for position size and pip value — available in one place lets a trader focus on what actually matters: reading the market and making decisions, rather than getting bogged down in technical routine. Brokers like Dukascopy demonstrate that a genuinely integrated trading ecosystem can meaningfully improve a trader’s efficiency and discipline, and ultimately, the quality of their trading decisions.
Disclaimer: This is a Press Release provided by a third party who is responsible for the content. Please conduct your own research before taking any action based on the content.

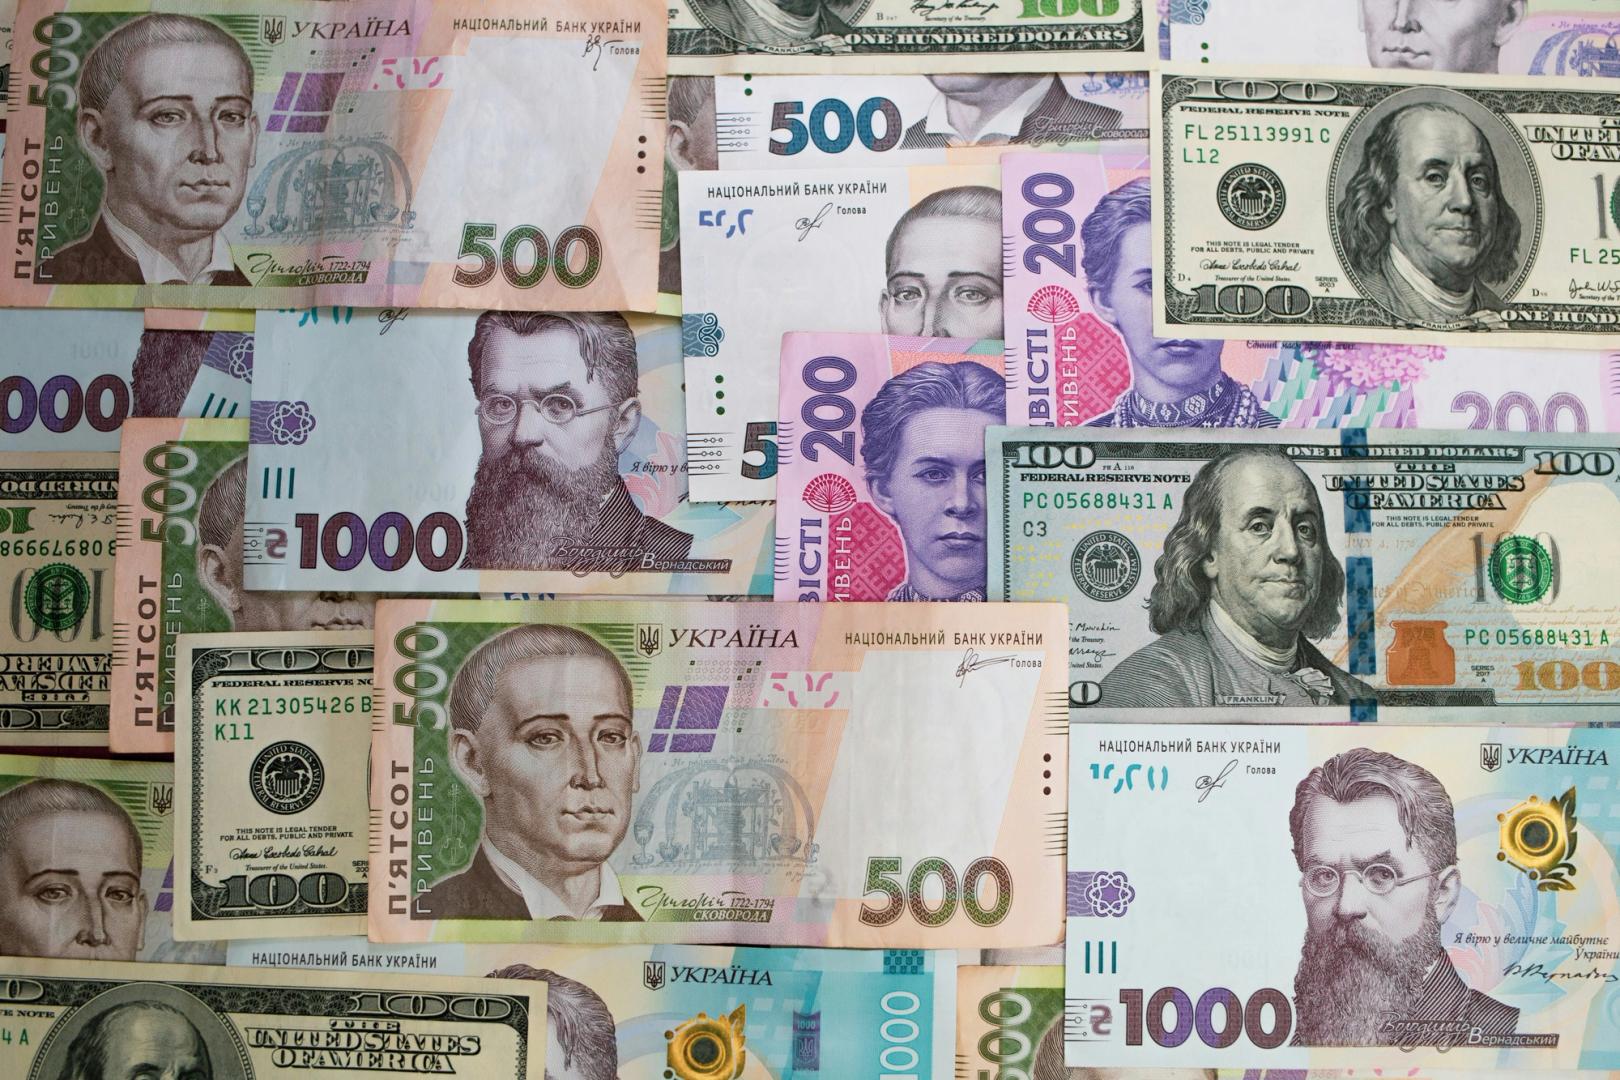
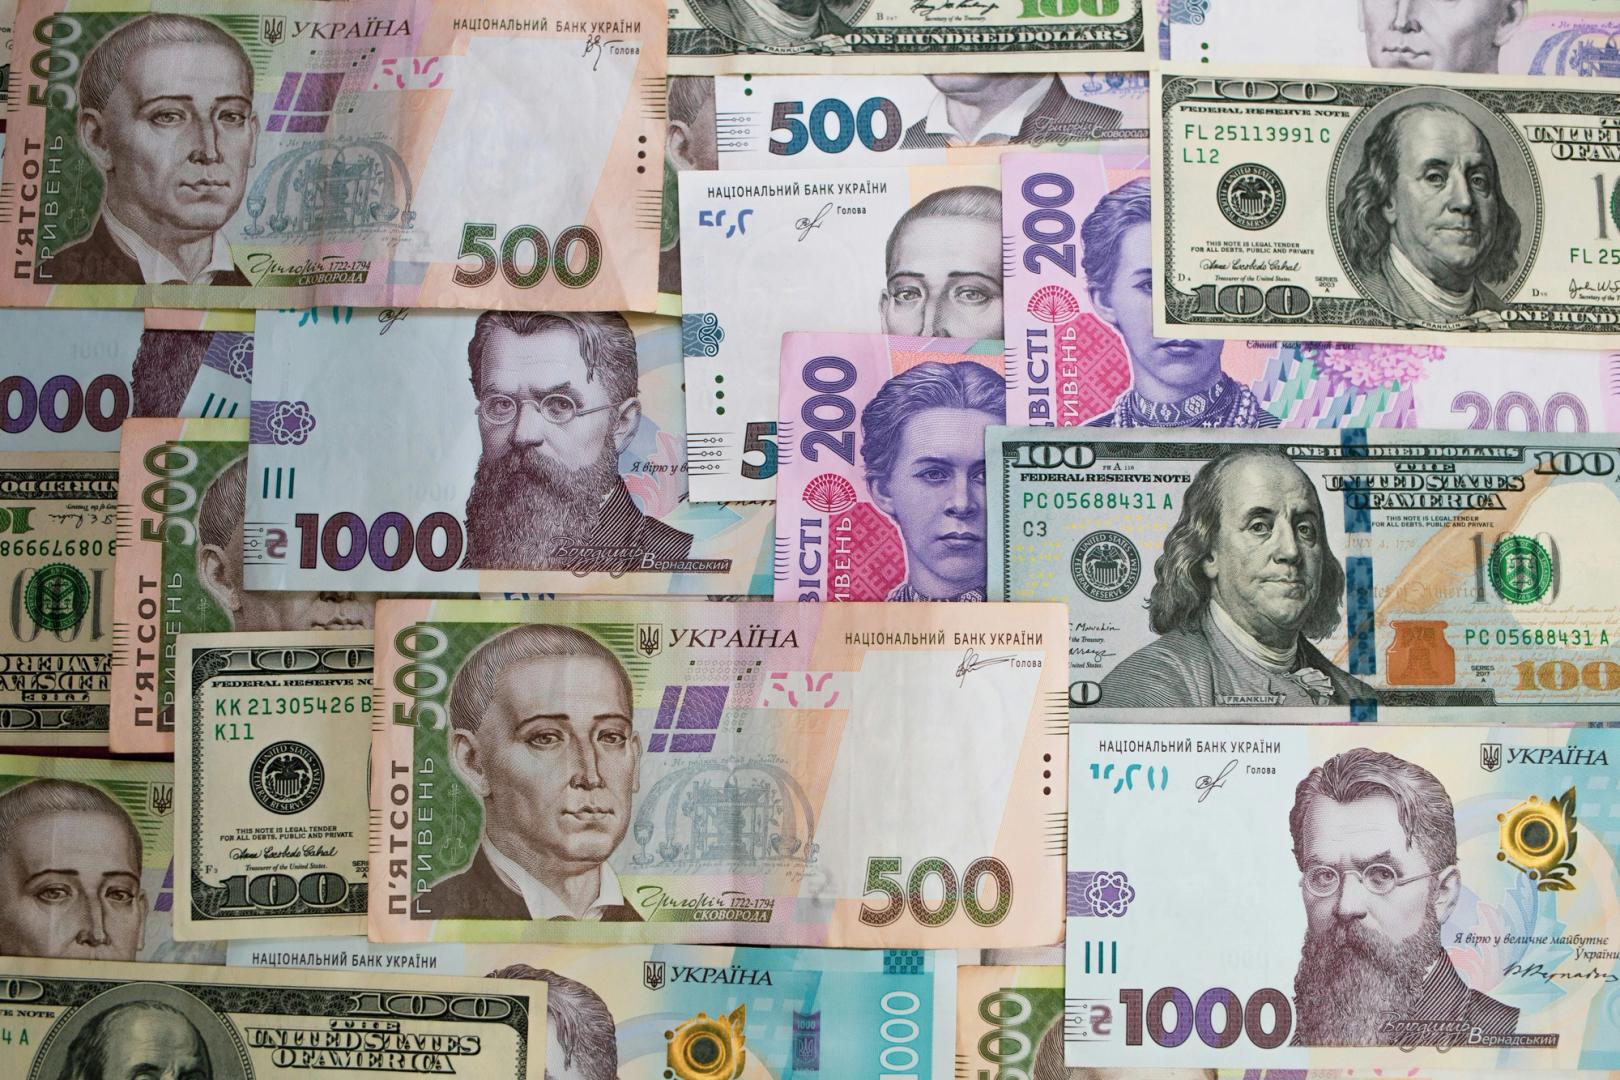
The term “HODLing,” crypto slang for buying and holding an asset for a long time, has historically been associated almost exclusively with bitcoin and ether (ETH).
One trader has now applied the same long-term approach to perpetual futures tied to the euro-dollar pair (EUR/USD) listed on the decentralized exchange (DEX) Ostium, which is powered by Nasdaq data.
A trader has held a long position in EUR/USD worth $1,139,490 for 400 days, Ostrium said on Tuesday. The bullish bet, expecting the euro to strengthen against the U.S. dollar, was opened around early June 2025. EUR/USD traded above 1.14 as of this writing, largely unchanged from where it was in June last year, but it did rise as high as 1.2082 in January this year.
Onchain FX trading offered by platforms such as Ostium, Gains Network, Synthetix, GMX, and others remains a very tiny fraction of the global traditional FX market, which sees daily trading volume exceeding $9 trillion.
Nevertheless, this single 400-day HODL on EUR/USD demonstrates that some traders are comfortable using blockchain rails and perpetual contracts to take leveraged positions on major traditional assets.
Crypto World
Binance Co-CEO Says Regulators Invited Exchange to Apply for New Licenses After MiCA Setback

Binance co-CEO Richard Teng said the exchange is discussing with regulators in “premature” talks about applying for crypto licenses after it pulled back its MiCA application in Greece. Speaking at the Reuters NEXT Asia conference in Singapore on Thursday, Teng did not name the jurisdictions involved, adding that the dialogue is still at an early stage.
The comments come after Binance’s regulatory pivot inside the EU. MiCA—the European Union’s single, harmonized crypto licensing regime—became fully applicable after the bloc’s transition period ended on July 1. As a result, the European Securities and Markets Authority (ESMA) said crypto firms must serve EU clients through a MiCA-authorized entity, with limited exceptions for unsolicited cross-border business.
Key takeaways
- Binance is in early discussions with regulators about obtaining crypto licenses, Teng said, without identifying the countries.
- Binance withdrew its MiCA license application in Greece on June 24, citing concerns about how quickly EU users would face a shortened transition period.
- Teng argued that EU users increasingly moved funds to self-custody rather than to MiCA-authorized platforms, questioning MiCA’s consumer-protection impact.
- Competition among licensed exchanges has intensified following the transition end, according to statements citing app download growth.
- Binance says it continues expanding in Asia through partnerships, including in the Philippines, while noting the regulatory landscape there is split between different agencies.
Binance seeks a new licensing path after Greece withdrawal
Binance’s Greek setback followed reports that Greek regulators intended to reject its MiCA licensing bid. According to earlier coverage by Cointelegraph, Binance withdrew its Greece MiCA application on June 24. Teng said at Reuters NEXT Asia that the situation took the company by surprise even though it submitted what it believed to be a fully compliant application.
“It caught us by surprise because we submitted a fully compliant application. The regulators told us as much,” Teng said, adding that the company was “not quite sure” why the approval process continued to be delayed. He said Binance withdrew the application to avoid a scenario where users would be forced into an extremely short transition window.
Separately, ESMA’s guidance after the MiCA transition ended emphasized that EU-facing services should route through a MiCA-authorized entity, with only narrow carve-outs for unsolicited cross-border activity. That framework is intended to bring crypto firms under a consistent EU rulebook, replacing a patchwork of national regimes.
Self-custody dominates outflows, Teng says
At the conference, Teng argued that the post-transition reality in Europe has not played out in the way MiCA’s consumer-protection goals might suggest. He pointed to user behavior after MiCA requirements took effect, saying that users who withdrew assets from Binance overwhelmingly chose self-custody.
According to Teng, “Of the users in the EU [who] have subsequently withdrawn their funds out of our platform, 70% of those funds went to self-hosted wallets. Only 30% flowed to MiCA-regulated entities.” Teng suggested that this outcome reduces the level of oversight available to consumers, since self-hosted wallets are not subject to the same licensing and operational constraints as regulated exchange platforms.
Cointelegraph also reported that Binance recorded net outflows of $1.23 billion during the week beginning June 29, which it noted was up 207% from roughly $400 million the prior week, referencing DefiLlama data reviewed by Cointelegraph.
The key tension in the exchange’s argument is straightforward: even if MiCA strengthens licensing standards for intermediaries, it may not reduce the volume of users holding assets in unhosted environments. That matters for investor protection because wallet custody shifts risk from licensed venues to end users, including risks around backups, access control, and security hygiene.
MiCA transition end reshapes competition among licensed exchanges
Another theme from Teng’s remarks was how quickly the competitive map can change once MiCA becomes enforceable. He referenced ongoing market dynamics inside the EU, while also highlighting that licensed exchanges are vying for the attention of users and liquidity that move once a major platform changes its regulatory stance.
OKX, for example, said its app downloads rose 158% between June 24 and July 5, citing Sensor Tower data. While download metrics do not directly translate into regulated trading volume, they can indicate faster user inflows during periods when compliance-driven changes affect how and where EU clients can access services.
For traders and allocators, this kind of shift can influence both execution quality and on-platform liquidity. But it also raises practical questions: whether users consolidate into a smaller set of MiCA-authorized venues, and how quickly those venues can absorb order flow compared with the speed at which users move out of non-compliant pathways.
Binance continues Asia expansion amid different regulators
Beyond Europe, Teng said Binance is working to expand its regulatory footprint across Asia. He cited deployments in multiple jurisdictions, naming Japan, Korea, Thailand, Indonesia, Australia, and announcing the Philippines as a recent addition.
Binance re-entered the Philippine market through a partnership with BlockShoals Technologies after regulators moved to restrict access to the exchange in 2024. The relationship, however, sits within a regulatory split: neither Binance nor BlockShoals is licensed by the Bangko Sentral ng Pilipinas to handle peso transfers or other central bank-regulated virtual asset services.
Earlier reporting from Cointelegraph included an interview with BlockShoals’ head of legal, Marie Antonette Quiogue, who said the arrangement allows Binance to offer crypto trading because the trading activity is under the jurisdiction of the Philippine Securities and Exchange Commission. Services regulated by the central bank, she indicated, would require separate authorization.
That distinction underscores a recurring challenge for global exchanges: “one license” approaches can work poorly when oversight is divided across regulators with different scopes. It also means that compliance strategies often need to be tailored to the exact product—trading, custody, transfers, or other regulated functions—rather than treated as a single, uniform permission.
As Binance explores further licensing talks after its Greece withdrawal, investors and users will want to watch how the EU situation evolves: whether Binance can secure an authorization pathway for EU clients, whether more withdrawals keep flowing toward self-custody, and how quickly MiCA-licensed competitors can translate user interest into sustained liquidity.
Crypto World
Crypto News, July 9: Iran Market Fears Fade as Bitcoin and Ethereum Price Shrug Off Another Panic

Fresh Iran headlines sent us scrambling last night, but the panic did not last. Markets, especially Bitcoin and Ethereum price, sold off after new geopolitical developments, only to reverse within hours once the narrative changed. Bitcoin price bounced sharply from the lows, while Ethereum held relatively steady, as many expected.
The first reaction was predictable as traders dumped crypto, oil jumped, and stocks went lower. For a moment, it looked like another geopolitical shock would drag the market into a deeper correction. Instead, buyers showed up almost immediately, refusing to let the bears gain momentum.
By this morning, the fear had mostly disappeared, with Bitcoin recovered most of its losses, and Ethereum barely lost its footing. It was another classic whipsaw that punished emotional trading more than anything else.
The latest Iran headlines looked scary enough to spark a classic risk-off move. Oil climbed, stocks weakened, and the Bitcoin price slipped as traders rushed to reduce exposure. The Ethereum price also moved lower but avoided the heavier selling that hit Bitcoin during the first wave.
Then the market did what it does best. It flipped. Reports that Iran was willing to return to negotiations erased much of the fear within hours. Bitcoin ripped higher, Ethereum stabilized, and anyone who panicked sold was suddenly chasing prices instead. Headlines may move markets, but they rarely stay in control for long.
Don’t Miss Out on Our $1,000 USDT Airdrop on ByBit
Bitcoin Price Refuses to Stay Down

Bitcoin price once again proved why betting against it after a headline-driven selloff is rarely an easy trade. Buyers defend support and erased most of the decline. In the end, bulls pushed the market back into familiar territory.
That recovery came despite spot Bitcoin ETFs recording $84 million in net outflows, ending a three-day buying streak. Normally, that would weigh on sentiment, yet Bitcoin ignored the script. It has built a habit of frustrating traders who expect every negative headline to become a lasting trend.

Regulators also stayed busy as Europe continued reviewing crypto rules under MiCA, the United States pushed stablecoin legislation forward, and India’s central bank repeated its call for tighter restrictions. None of those developments mattered as much as the market’s ability to shrug off another wave of geopolitical fear.
Discover: The Best Token Presales
Ethereum Price Fights Bears
Ethereum is in a tight price range while the rest of the market bounced around. It did not match Bitcoin’s rebound, but it also avoided a meaningful breakdown. On a day dominated by uncertainty, it surprisingly stays steady.
However, the chart is still flashing warning signs. A weekly death cross has formed, convincing the bears after months of weakness. Momentum indicators remain soft, and another move lower cannot be ruled out if sellers regain control. Even so, experienced traders know those signals often appear near the end of a downtrend.
Outside the charts, the crypto industry kept moving. AscendEX confirmed it is winding down operations, tokenized equities continued gaining traction, and lawmakers debated fresh crypto legislation. In the end, Bitcoin price erased most of its losses, the Ethereum price held key support, and the latest Iran drama faded almost as quickly as it appeared.
Discover: The Best Crypto to Diversify Your Portfolio
The post Crypto News, July 9: Iran Market Fears Fade as Bitcoin and Ethereum Price Shrug Off Another Panic appeared first on Cryptonews.

THD: The Shining Star Of The ASEAN ETF Pack Faces A Tricky Outlook

Netflix: Attempting to Break the Short-Term Downtrend

Loro Piana Fall 2026 Enters Houston’s Art Scene


-

 Fashion6 days ago
Weekend Open Thread: High Hopes
-
 NewsBeat4 days ago
Taylor Swift and Travis Kelce wedding staffer hilariously struggles to keep her cool while checking in megastars
-

 Fashion3 days ago
Open Thread: What Great Books Have You Read Recently?
-
 Crypto World6 days ago
Standard Chartered Secures MiCA License as ESMA Adds 37 New Crypto Firms
-

 Politics6 days ago
The House | “Reframing the debate from a binary discussion of winners and losers”: Yuan Yang reviews ‘We Are Not Machines’
-

 News Videos2 days ago
Whats Hidden Inside This Cash Register? #treasure #reselling #money
-
 Tech2 days ago
Anthropic’s new “J-lens” reveals a silent workspace inside Claude that mirrors a leading theory of consciousness
-

 Business3 days ago
AXT Shares Jump Nearly 14% as Semiconductor Materials Maker Rebounds on AI-Linked Indium Phosphide Demand
-

 Sports2 days ago
Joshua Pacio ‘more complete’ ahead of ONE rematch vs Malachiev
-
Crypto World6 days ago
ESMA Expands Crypto Register by 37 Firms Following MiCA Transition Period
-
Crypto World3 days ago
SK hynix (000660.KS) Stock Dips as $28B Nasdaq ADR Offering Drives AI Memory Expansion
-

 Crypto World4 days ago
South Africa proposes crypto tax guidance under existing rules
-

 News Videos3 days ago
Best Time to Enter Small Caps Right Now? Another Bull Run? | Financially Free
-
 Tech4 days ago
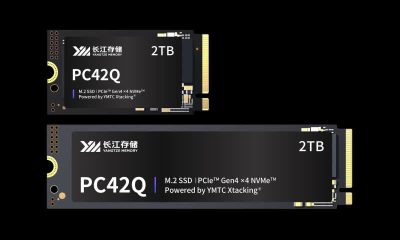
Lenovo laptops are now shipping with YMTC SSDs, a sign of Chinese NAND entering the mainstream
-

 Business6 days ago
What a 10 Percent Drop Means for Buyers, Sellers and Renters
-
Sports2 days ago
We have punished the disrespect
-

 Crypto World7 days ago
Binance Re-Enters Philippines As EU MiCA Rules Restrict Access
-
 News Videos3 days ago
Avoid entering in FOMO #bitcoin #cryptocurrency #trading #scalping
-

 Crypto World6 days ago
Alibaba bans Claude Code over alleged backdoor security concerns
-

 Tech5 days ago
Neuralink Threads Its Way Straight Through the Brain’s Armor
You must be logged in to post a comment Login