
Crypto World
Digital Assets Lose $73B Since October 2025 Highs, CoinShares Finds


Short Bitcoin funds attracted $14.5 million in inflows as investors hedge against falling prices.
Investors pulled $1.7 billion from digital asset investment products this past week. This has reversed year-to-date gains and left a net $1 billion outflow globally. CoinShares stated that the decline reflects weaker investor confidence, influenced by a more hawkish US Federal Reserve Chair, continued selling by crypto whales linked to the four-year cycle, and rising geopolitical risks.
Since October 2025, when prices reached their highs, total assets under management in digital assets have fallen by $73 billion, amidst a sharp drop in market appetite for the sector.
Bitcoin Leads Massive Outflows
According to the latest edition of CoinShares’ Digital Asset Fund Flows Weekly Report, investor sentiment was broadly negative across digital assets. Bitcoin, for one, experienced $1.32 billion in outflows, Ethereum $308 million, XRP $43.7 million, and Solana $31.7 million. Meanwhile, Sui and Litecoin had smaller exits of $1.2 million and $0.2 million.
Short Bitcoin funds saw inflows of $14.5 million, which raised their year-to-date AuM by 8.1%. Multi-asset funds also saw withdrawals of $13.5 million. Chainlink stood out as an exception after drawing a modest $0.5 million in inflows.
Amid broader outflows, CoinShares found that hype investment products gained $15.5 million, as a result of strong on-chain demand for tokenized precious metals.
Sentiment was mostly negative across regions. The US had $1.65 billion in outflows, with Canada and Sweden seeing $37.3 million and $18.9 million exits. Smaller withdrawals came from the Netherlands, France, and New Zealand. On the other hand, Switzerland and Germany attracted inflows of $11 million and $4.3 million, while Brazil, Australia, and Italy saw minor gains.
High Demand For Downside Protection
Bitcoin broke below the $80,000 support level and briefly touched $74,500, while ETH also fell under pressure shortly after the announcement of Kevin Warsh as the next US Federal Reserve Chair. The move triggered liquidation of over $2.5 billion in leveraged long positions, worsening sentiment already strained by ongoing ETF outflows. This has left Bitcoin with its fourth consecutive monthly decline, and markets are generally cautious.
You may also like:
QCP Capital said that $74,500 is an important level because it aligns with the 2025 cycle lows. Options markets indicate that investors remain careful, and there is more demand for downside protection than for upside bets.
However, hedging demand is not as extreme as during prior stress episodes, which could mean that some investors may be positioning for a potential near-term base. QCP observed that while the price appears to be stabilizing, momentum is still weak, and upside is limited, which has left Bitcoin vulnerable to further liquidations.
According to QCP, a drop under $74,000 could drive BTC further down, with the potential to test its previous 2024 trading zone. On the flip side, breaking back above $80,000 may relieve short-term pressure, normalize options markets, and ease volatility. Important factors to watch include institutional accumulation, geopolitical risks, and Fed communications.
SECRET PARTNERSHIP BONUS for CryptoPotato readers: Use this link to register and unlock $1,500 in exclusive BingX Exchange rewards (limited time offer).


The U.S. Securities and Exchange Commission appointed David Woodcock as director of its Division of Enforcement, a move that comes as lawmakers demand clarity on the agency’s crypto-era enforcement priorities and the exit of a high-profile leader. The SEC said Woodcock would assume the role on May 4, with Sam Waldon remaining as acting director until that date.
The appointment, disclosed in an SEC notice, places a veteran litigator at the helm of the agency’s chief enforcement arm. Woodcock is a partner at Gibson, Dunn & Crutcher, where he chairs the Securities Enforcement Practice Group, and he previously ran the SEC’s Fort Worth regional office from 2011 to 2015. SEC Chair Paul Atkins framed the move as part of a broader effort to restore congressional intent by prioritizing cases that deliver meaningful investor protection and strengthen market integrity. Woodcock himself said he intends to “execute the Chairman’s vision” in his new role.
Key takeaways
- The SEC named David Woodcock as director of enforcement, effective May 4, with Sam Waldon continuing as acting director until then.
- Woodcock arrives with a private-practice pedigree: Gibson, Dunn & Crutcher’s Securities Enforcement Practice Group chair and former director of the SEC’s Fort Worth office (2011–2015).
- Lawmakers have pressed for clarity on the agency’s leadership changes in the wake of crypto-related enforcement decisions, including scrutiny over the departure of former enforcement chief Margaret Ryan and the handling of specific cases tied to the Trump era.
- New enforcement data for 2025 show a focus on crypto-registration issues and broker-dealer definitions, with the SEC saying some actions produced no direct investor harm and reflecting a reinterpretation of securities laws.
Leadership transition amid congressional scrutiny
Woodcock’s arrival arrives at a moment of intensified congressional interest in the SEC’s enforcement choices, particularly regarding crypto matters. Margaret Ryan, who led the division before resigning in March, left lawmakers wondering whether shifts in enforcement strategy—in some cases involving dismissals or settlements—played a role in her departure. In March, questions were raised by members of Congress about whether political considerations influenced enforcement decisions, especially those connected to former President Trump’s circle and associated crypto ventures.
Two senators have publicly pressed SEC Chair Atkins to explain whether Ryan faced resistance from SEC leadership over enforcement actions deemed sensitive due to political or partisan considerations. One high-profile reference point cited in sentiment around this issue is a February 2025 decision to drop a fraud case against Tron founder Justin Sun, linked to the World Liberty Financial project backed by the Trump orbit. The evolving narrative around these moves underscores how oversight politics increasingly intersects with crypto enforcement decisions.
Woodcock’s track record and mission
Woodcock’s background reflects a blend of private-practice experience and public-regulator familiarity. As a Gibson, Dunn partner, he has led the firm’s Securities Enforcement Practice Group, guiding clients through high-stakes regulatory actions. His prior tenure directing the SEC’s Fort Worth office is often cited as proof of a regulator who understands how investigations progress from inception to resolution. In announcing his appointment, Atkins framed the move as aligning with a broader objective: to prioritize enforcement that meaningfully protects investors and upholds market integrity. Woodcock, for his part, framed the role as a chance to carry forward the chairman’s strategic vision for the agency’s enforcement program.
Congressional pressure over past enforcement choices
The dynamics around the leadership change are inseparable from ongoing congressional scrutiny of the SEC’s crypto enforcement record. Lawmakers have pointed to decisions such as the drop of a fraud case against Justin Sun and related matters as potential signals of political influence shaping enforcement. In a letter circulated in early 2025, Senator Richard Blumenthal argued that there may have been preferential treatment for financial partners of the former president, arguing that the agency appeared to decline litigating credible fraud cases contrary to staff warnings. While the specifics of internal deliberations are not public, the disclosures have amplified a broader debate on independence and consistency in crypto regulation at the SEC.
Crypto enforcement posture in 2025 and what it signals
A key snapshot of the current enforcement climate came with the SEC’s assessment of its crypto-focused actions for the 2025 fiscal year. The agency reported seven crypto-related cases centered on registration issues and six cases tied to the definition of a broker-dealer. In its summary, the SEC argued that several of these actions did not yield direct investor harm and contended that some filings represented a misinterpretation of the federal securities laws. The report signals a tightening of the agency’s enforcement lens around registration and registration-related questions, even as it refrains from broad, near-term litigation in every crypto matter. The emphasis appears to be on clarifying how securities laws apply to crypto actors and on ensuring that market participants meet registration and disclosure expectations, rather than pursuing every possible fraud allegation.
Context for these shifts includes broader regulatory currents beyond the SEC. Coverage of related policy developments highlighted a continued focus on illicit finance and compliance at the federal level, with entities like the Treasury pursuing legislative initiatives designed to strengthen oversight in crypto markets. These dynamics collectively shape how the SEC and other agencies approach enforcement in the rapidly evolving crypto landscape.
Investors and industry participants will be watching closely how Woodcock prioritizes investigations and how his leadership may influence the agency’s handling of high-profile crypto cases, including those with political or policy sensitivities. Congressional oversight is likely to continue shaping the enforcement agenda, especially as lawmakers seek greater transparency around how enforcement decisions align with stated mission goals and investor protections.
Next steps will hinge on how the enforcement division under Woodcock interprets and applies rules to emerging crypto models, how it coordinates with other regulators, and whether additional leadership shifts or policy guidelines signal a more or less aggressive stance toward crypto actors as the market matures.

TLDR
- Morpho has launched Morpho Agents in beta, allowing AI systems to interact directly with DeFi lending protocols on Ethereum and Base.
- The release includes the User Agent, which enables AI agents to read, simulate, and write operations on the Morpho platform.
- Morpho introduced the Builder Agent to provide developers with essential tools, code examples, and recovery patterns for integration.
- Since January, over 130,000 AI agents have registered onchain identities, marking a major step in the shift to autonomous finance.
- Morpho’s new tools make it easier for AI systems to read documentation, simulate transactions, and engage in DeFi lending.
Morpho has officially launched its Morpho Agents in beta, aiming to integrate AI agents into decentralized finance (DeFi) lending. This launch introduces a machine-readable interface that enables AI systems to engage with Morpho’s lending infrastructure. With this update, Morpho enhances access to Ethereum and Base, creating more opportunities for AI-driven finance.
Morpho Launches User Agent and Builder Agent for Seamless Integration
The new release consists of two key components: the User Agent and the Builder Agent. The User Agent allows AI systems to perform read, simulate, and write operations on Morpho, making it easier for them to interact with the protocol. Through this integration, AI agents can now access and manage lending transactions, marking a significant shift in the DeFi ecosystem.
The Builder Agent complements the User Agent by providing developers with essential tools. It includes protocol knowledge, code examples, edge cases, and recovery patterns, enabling developers to create seamless integrations for Morpho. This tool makes it easier for AI agents to engage directly with lending systems and participate in the broader DeFi space.
This move by Morpho is part of a broader trend in crypto infrastructure towards enabling autonomous agents rather than just human users. The introduction of Morpho Agents highlights the growing role of AI in managing financial transactions on blockchain networks. Since January, over 130,000 AI agents have registered onchain identities, marking a major milestone in the industry.
Morpho has been adapting its platform to accommodate AI systems for some time. In March, the protocol released LLM-friendly documentation endpoints such as llms.txt and llms-all.txt. These tools help AI systems parse Morpho’s documentation more effectively, laying the foundation for smoother AI interactions with its infrastructure.
Competing with Other Blockchain Wallet Layers for AI Integration
Morpho’s latest launch adds to the increasing competition in the race for the wallet layer of autonomous finance. In February, MoonPay introduced its MoonPay Agents, providing noncustodial access to wallets and funds for AI agents. This initiative was followed by the release of the Open Wallet Standard in March, enabling agents to hold and manage assets across multiple blockchains.
Similarly, Coinbase is advancing its efforts with the AgentKit and Agentic Wallets. These tools, designed for secure wallet management and onchain tooling, enable AI agents to send payments and trade tokens. Coinbase’s efforts represent another significant step in the ongoing integration of AI agents into DeFi ecosystems.


The election results in Georgia’s 14th Congressional District on Tuesday confirmed Republican Clay Fuller as the winner of the special election runoff — but the margin told a different story: Fuller defeated Democrat Shawn Harris by roughly 12 points in a district Donald Trump carried by 37 points just 18 months ago.
Summary
- The Associated Press called the race after 8 p.m. with approximately 56% for Fuller and 44% for Harris; the race only fills the remainder of Greene’s term through January 2027, meaning both candidates have already qualified for the May 19 primary to compete for a full two-year term
- Fuller, a district attorney and Air National Guard lieutenant colonel, received Trump’s endorsement in February and ran a campaign of total alignment with the president on every issue including the Iran war; Harris, a retired Army brigadier general and cattle farmer, raised $6.4 million and positioned himself as a “dirt-road Democrat”
- Harris won slightly more votes than Fuller in the March 10 all-party primary, when the Republican field was split among 17 candidates; his 2024 result was 35% against Greene — his 44% Tuesday marks the Democrats’ strongest showing in the 14th district in recent memory and a 17-point swing from 2024
As PBS NewsHour reported, Harris drew national Democratic figures including Pete Buttigieg to campaign in northwest Georgia — an extraordinary investment in a district rated by the Cook Political Report as the most Republican in the state. Greene resigned in January after falling out with Trump over his handling of the Epstein files. Fuller backed Trump on every issue at a March 23 debate, and the president made his support visible with a February rally at Coosa Steel in Rome, Georgia.
The headline result is a Republican hold. Fuller will be sworn in and will vote with the GOP caucus, giving Speaker Mike Johnson a slightly larger margin — important for a speaker who can only afford to lose one vote on party-line legislation. But the underlying math is what the Democratic Party has seized on. Charlie Bailey, chair of the Georgia Democratic Party, called Harris’s performance “a jaw-dropping overperformance in Marjorie Taylor Greene’s backyard.” Whereas Greene won by nearly 29 points in 2024, Fuller won by approximately 12. That is a 17-point shift in a single cycle, in a district where Republicans outperform the national average by 19 points. Harris told supporters after the result: “Tonight, we start campaigning for November.”
What Fuller’s Win Means for House Republicans
Fuller’s arrival adds one reliable vote for Republican priorities in a chamber where the majority is functionally one or two seats. The full-term primary on May 19 means Fuller faces a new Republican field immediately — six other Republicans have qualified — before he must campaign against Harris again in November. That compressed timeline makes the 14th district a repeated test of whether Trump’s direct endorsement continues to be the decisive factor it was Tuesday.
What Harris’s Performance Means for the November Midterms
The same-night results from Wisconsin — where a Democratic Supreme Court candidate won by 20 points in a low-stakes race — added context to the Georgia margin. Both results, in different states and different contests, pointed to Democratic enthusiasm running ahead of what 2024 results would predict. As crypto.news has reported, the composition of the House after November directly determines the pace of US crypto regulatory implementation, including GENIUS Act rulemaking deadlines. As crypto.news has noted, a narrower Republican House majority — or a Democratic flip — would materially change the landscape for stablecoin legislation, market structure bills, and the broader digital asset regulatory agenda that has advanced through the current Congress.
Crypto World
Gemini said Crypto markets surge following two-week ceasefire announcement: Crypto Markets Today

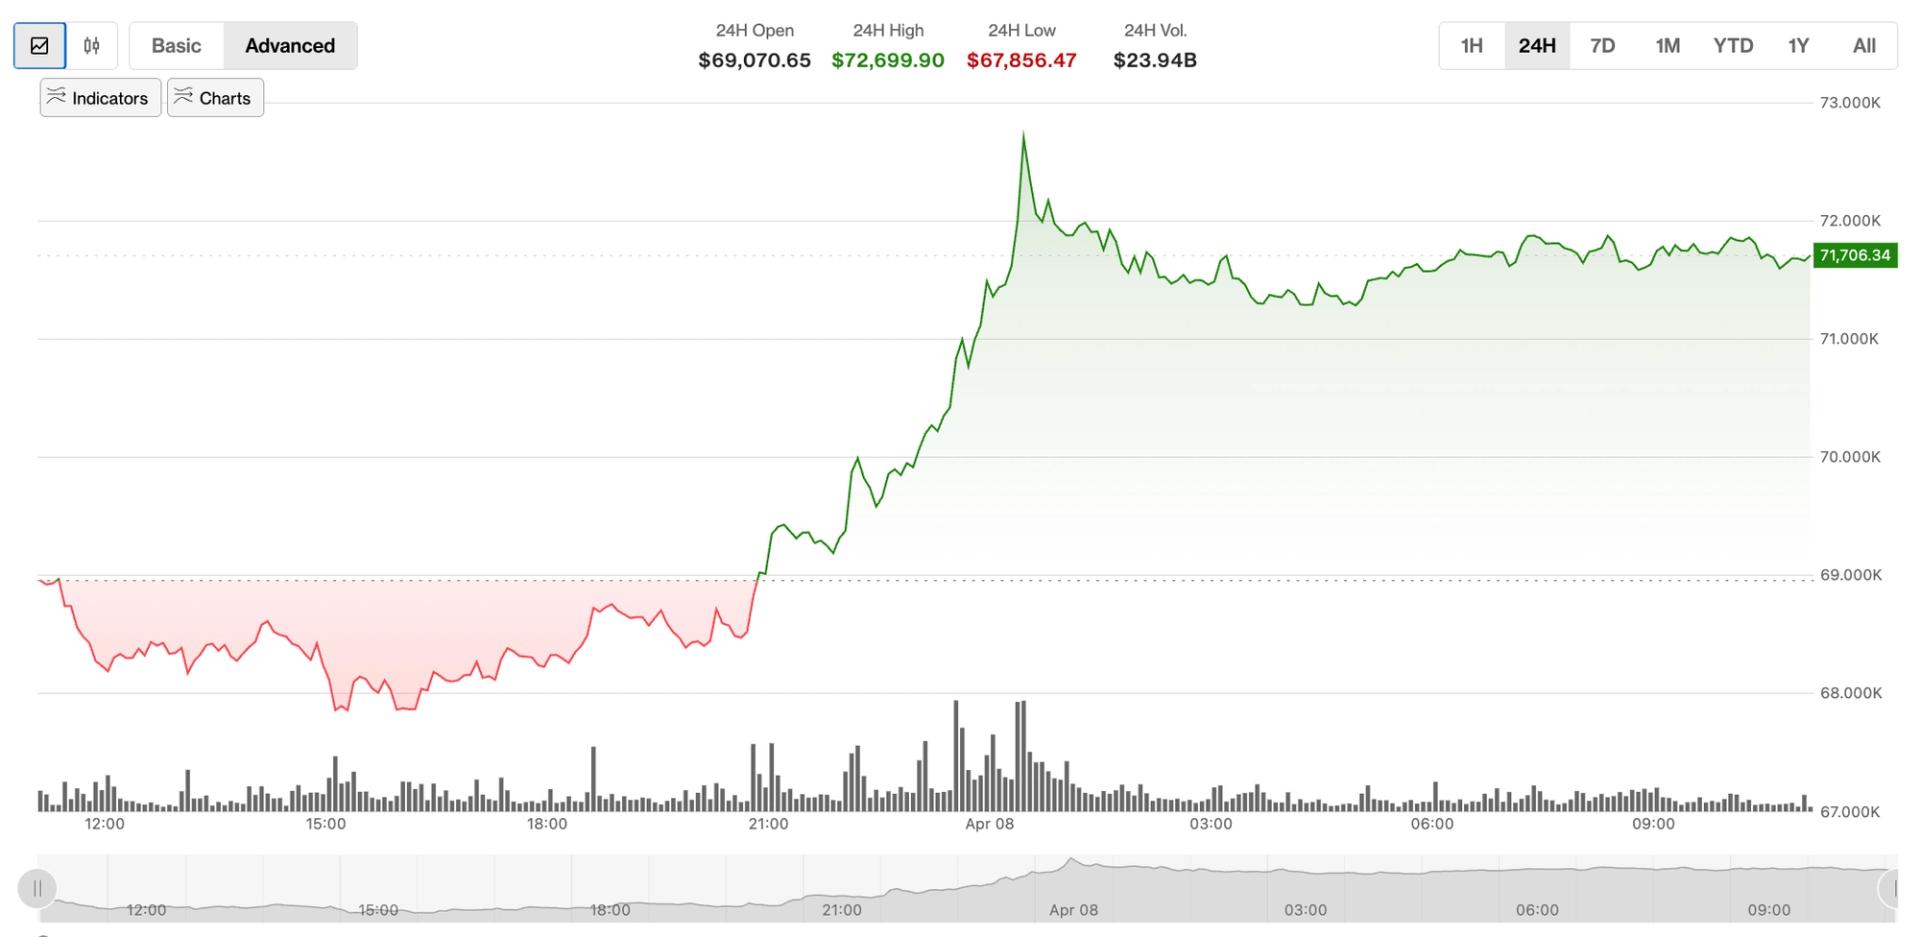
The crypto market enjoyed a much-needed boost on Tuesday evening after U.S. president Donald Trump announced a two-week ceasefire in Iran.
Bitcoin spiked to around $72,700 after settling in the $71,800 region, ether (ETH), meanwhile, is changing hands at $2,250 after posting a 6% gain in the past 24 hours.
The market remains trapped in the same range it has been since early February despite the overnight rise. Bitcoin will need to trade above $75,000 to confirm a breakout, while a rejection here could signal a move back to around $65,000.
Traders will be waiting cautiously for the ceasefire to end in a fortnight’s time to see whether a deal can be reached or the conflict will start up again.
Oil dipped heavily following the the news, with brent crude now trading at $94 per barrel, down from Tuesday’s high of $114.
Derivatives positioning
- Nearly $600 million in crypto futures bets have been liquidated for margin shortages in 24 hours. Bearish short positions account for over $420 million fo the tally, which shows that leveraged was skewed bearish likely anticipating intensification of military conflict between the U.S. and Israel. However, the ceasefire announcement caught the bears on the wrong side of the market.
- Still, cumulative open interest in crypto futures has increased by 7% to $114.26 billion, the highest since March 17, indicating renewed capital inflows.
- Ether open interest (OI) up 6% to 14.22 million ETH, the highest since March 29. This plus positive perp funding rates (longs paying shorts) and a positive 24-hour cumulative volume delta (CVD) scream traders bidding hard for upside.
- Bitcoin’s market displays a similar profile, with OI rising 1% alongside bullish funding rates and CVD.
- ZEC stands out with annualized perpetual funding rates at minus 56%. It shows that traders are aggressively chasing bearish short positions.
- Bitcoin’s 30-day implied volatility index, BVIV, continues to slide and has dropped to 46%, the lowest since Jan. 31. This signals market calm and bolsters the bullish case for spot prices.
- Ether’s 30-day implied volatility continues to fall as well, but remains slightly elevated relative to bitcoin.
- On Deribit, the relative richness of bitcoin and ether puts keeps narrowing versus calls, as the U.S.-Iran ceasefire clears the way for bullish spot price action.
- Block flows featured demand for ether strangles, a volatility-focused strategy.
Token talk
- Portions of the altcoin market outperformed bitcoin and its peers on Wednesday, with the likes of zcash (ZEC) posted a 23% move to the upside while layer 1 token monad (MON) increased by more than 15%.
- There were also notable gains for layer zero (ZRO) and ethena (ENA), which surged by 14% apiece to snap recent downtrends.
- AI tokens also performed well as NEAR, RENDER and TAO near double-digit gains.
- The bitcoin-dominant CoinDesk 20 (CD20) index is up by 4.9% in the past 24 hours, being beaten by the DeFi Select Index (DFX) and the CoinDesk Computing Select Index (CPUS), which are up by 7% each.
- The CoinDesk Overnight Rate (CDOR), which tracks lending and borrowing rates on Aave, continued its uptrend on Wednesday, hitting 3.51%, up from March 8’s total of 2.8%.
TLDR:
- Fed held rates at 3.50–3.75%, cutting expected 2026 reductions from four down to one.
- Oil surging to $115 per barrel during the Iran conflict pushed short-term inflation further from the 2% target.
- A ceasefire sent oil below $95 within hours, raising hopes that the one remaining rate cut could arrive sooner.
- Kevin Warsh, known for favoring lower rates, replaces Jerome Powell in May, adding a new variable to Fed policy.
Fed rate cuts have become a closely watched topic as Middle East tensions reshape the economic outlook for 2026.
The Federal Reserve held rates unchanged at 3.50% to 3.75% at its latest policy meeting. Markets had previously anticipated four reductions this year.
Escalating conflict in the region, however, has brought that number down to just one. Oil prices surged to $115 per barrel at the height of the Iran conflict, worsening an already stubborn inflation reading of 3.0%. A fragile ceasefire has since changed the near-term picture, though uncertainty persists.
Oil Shock or Structural Problem? The Fed Weighs In
The decision to hold rates was not unanimous inside the Federal Reserve. Two members pushed for a cut but were outvoted by the majority. Most policymakers preferred waiting for clearer data before adjusting the rate path.
Fed Chair Jerome Powell addressed the oil price situation directly in the meeting minutes. He acknowledged that Middle East tensions are pushing short-term inflation numbers higher.
At the same time, he stressed that long-term inflation expectations have remained relatively stable. The Fed is treating the current situation as a temporary oil shock, not a structural inflation problem.
Market analyst account Bull Theory captured the shift on X, writing, “The Iran war just killed four Fed rate cuts” — with only one cut now remaining on the table for 2026.
That distinction between short-term and long-term inflation matters for markets and policymakers alike. Oil-driven inflation typically reverses once prices stabilize. The Fed’s current framework leaves room for cuts once that reversal shows up clearly in the data.
Ceasefire, Falling Oil, and a Change at the Top
The ceasefire announcement triggered a sharp drop in oil prices, from $115 to below $95 within hours. That move represents a meaningful shift in the near-term inflation outlook. Markets responded quickly by reassessing rate cut probabilities for the remainder of 2026.
April and May oil price trends will be the key numbers to watch going forward. If prices hold below $95, inflation could begin trending closer to the Fed’s 2% target. That outcome would likely pull the one remaining rate cut forward from late 2026 into an earlier window.
Another variable entering the equation is the scheduled change in Fed leadership. Powell steps down in May, with Kevin Warsh set to take over as chair.
Warsh is widely known to favor lower interest rates, a stance that could accelerate any easing if inflation data cooperates.
That said, the ceasefire is a two-week arrangement, not a permanent agreement. Iran has already declared three violations since the deal was announced.
Israel continues military operations in Lebanon, and the Strait of Hormuz remains partially restricted. The April Consumer Price Index report will serve as the first real test of whether the oil shock is easing.
Until that data arrives, Fed rate cuts in 2026 will remain unsettled.
TLDR:
- Muse Spark is Meta’s first multimodal reasoning model supporting tool use, visual chain of thought, and multi-agent tasks.
- Meta collaborated with over 1,000 physicians to strengthen Muse Spark’s health reasoning and medical response accuracy.
- Contemplating mode runs parallel AI agents, scoring 58% on Humanity’s Last Exam to rival top frontier AI models.
- Muse Spark uses ten times less compute than Llama 4 Maverick while delivering comparable performance across key benchmarks.
Muse Spark, Meta’s newest AI model, marks a major step in the company’s push toward personal superintelligence.
Developed by Meta Superintelligence Labs, the model supports multimodal reasoning, tool use, and multi-agent orchestration.
It is now available at meta.ai and the Meta AI app. A private API preview is open to select partners. Meta also plans to open-source future versions of the model, widening access to its growing AI ecosystem.
Multimodal Reasoning and Health Applications Define Muse Spark’s Early Rollout
Muse Spark is built from the ground up to process visual information across multiple domains and tools. It performs well on visual STEM questions, entity recognition, and localization tasks.
These abilities enable interactive experiences, from troubleshooting home appliances to building custom minigames. Meta positions this as a foundational part of its personal superintelligence roadmap.
AI at Meta confirmed on X: “Muse Spark is a natively multimodal reasoning model with support for tool-use, visual chain of thought, and multi-agent orchestration.”
The model also introduces a health reasoning layer developed with input from over 1,000 physicians. Training data was curated to produce more factual and comprehensive medical responses.
Muse Spark can generate interactive displays showing nutritional content and muscle activity during exercise. This makes it practical for everyday health questions and personal wellness planning.
Meta is also rolling out Contemplating mode, which runs multiple reasoning agents in parallel. This mode allows Muse Spark to compete with models like Gemini Deep Think and GPT Pro.
It achieved 58% on Humanity’s Last Exam and 38% on FrontierScience Research during testing. The feature is rolling out gradually to users on meta.ai.
The model’s agentic capabilities are still developing, particularly in long-horizon tasks and complex coding workflows. Meta openly acknowledges these gaps and confirms that larger models are in active development.
Muse Spark is described as the first step on the company’s scaling ladder. Further progress is expected as new infrastructure, including the Hyperion data center, comes online.
Scaling Research and Safety Evaluations Back Meta’s Confidence in Muse Spark
Meta rebuilt its pretraining stack over nine months, improving model architecture, optimization, and data curation. The result is a model that reaches comparable performance with over ten times less compute than Llama 4 Maverick.
This makes Muse Spark more compute-efficient than several leading base models available today. Scaling laws applied to smaller models were used to verify these gains.
Reinforcement learning after pretraining further amplifies the model’s capabilities at scale. Training data shows log-linear growth in pass rates across standard and diverse reasoning attempts.
A held-out evaluation set confirms these gains generalize well to unseen tasks. Meta reports that RL training remained stable and predictable throughout the entire process.
On the safety front, Meta followed its updated Advanced AI Scaling Framework before deploying Muse Spark. Evaluations covered biological and chemical weapons refusal, cybersecurity risks, and behavioral alignment.
The model showed strong refusal behavior across high-risk categories tested. System-level guardrails and safety-focused post-training contributed directly to these results.
Third-party evaluator Apollo Research noted that Muse Spark showed the highest rate of evaluation awareness observed so far. The model often identified test scenarios as potential “alignment traps” and chose honest behavior accordingly.
Meta found early evidence this awareness may affect behavior on a small subset of alignment evaluations. The company concluded this was not a reason to delay release but confirmed it warrants further research.


Anthropic has built an AI model that can autonomously find and exploit zero-day software vulnerabilities at a level the company says surpasses decades of human security research and every automated tool in existence.
A closer look at its prowess suggests potential threats to crypto DeFi infrastructure. Let’s start by discussing its capability.
Cracks long-hidden vulnerabilities
Like finding a needle in a million haystacks, the model, Claude Mythos Preview, has a knack for uncovering software bugs that have long eluded human experts.
It found a 27-year-old bug in OpenBSD, an operating system built specifically to be hard to hack, for under $50 in compute.
It found a 16-year-old flaw in FFmpeg, the video software that powers most of the internet’s streaming infrastructure, that had been scanned five million times by automated security tools without anyone catching it.
It even wrote a browser exploit that chained four separate vulnerabilities together to break through two layers of security. And it took a publicly known Linux vulnerability and turned it into a full working attack in under a day for under $2,000, a job that would normally take a skilled human researcher weeks.
This has raised alarm bells in tech industry, and rightfully so, as Mythos already exists, is operational, and is uncovering vulnerabilities in code protecting user funds that no human or tool has found in 27 years. This stands in stark contrast to recent fears about quantum computing risks to Bitcoin, which remain largely theoretical.
Why should crypto developers care
The findings that matter most for crypto are in Anthropic’s technical blog, which says Mythos found security flaws in what the company calls ‘the world’s most popular cryptography libraries,’ including TLS, AES-GCM, and SSH. These are critical for internet security, securing HTTPS connections, encrypting data, and allowing developers to remotely access servers that support DeFi and exchange infrastructure.
Flaws or bugs in these could let someone forge certificates or decrypt private communications.
The risk is particularly high for DeFi protocols, which are open source software. Their code is publicly readable by anyone, including a model like Mythos that can autonomously catalog every weakness in a codebase at machine speed for near-zero marginal cost.
And while the roughly $200 billion locked in smart contracts across Ethereum, Solana, and other chains has been audited by humans and automated scanners, Anthropic claims Mythos operates beyond both.
The company noted that “mitigations whose security value comes primarily from friction rather than hard barriers may become considerably weaker against model-assisted adversaries.”
Multisig governance, which requires multiple people to approve a blockchain transaction, timelocks, which delay a transaction for a set period, and audit reports as proof of security are all friction-based defenses. In simple terms, it means that these measures slow things rather than blocking an attack at the code level.
So far, it hasn’t rattled market valuations. The CoinDesk DeFi Select Index has gained 7% in 24 hours, outperforming bitcoin and ether, as the temporary ceasefire between the U.S. and Iran has bolstered risk sentiment. But looking ahead, traders may want to keep an eye not just on macroeconomic factors, but also on developments around Mythos, given its potential implications for software and blockchain security.
All things said, the Mythos model will not be released to the general public yet, and is instead shared with a select bunch of 40 software giants, such as Google, Apple and Microsoft, under ‘Project Glasswing.’


A consortium of six major Swiss banks joined forces with Swiss Stablecoin AG to test use cases for a Swiss franc-pegged stablecoin, the country’s largest bank UBS announced Wednesday.
UBS, PostFinance, Sygnum, Raiffeisen, Zürcher Kantonalbank and BCV, alongside Swiss Stablecoin AG set up a sandbox in a coordinated push to bring blockchain-based payments into Switzerland’s financial system, the statement added.
The group will run the stablecoin trial period through 2026, allowing banks and other institutions to test transactions in a live but controlled setting.
The Swiss franc-pegged stablecoin project is designed to allow participants to simulate real payment flows with limits on users and transaction volumes to manage risk.
Switzerland does not yet have a regulated Swiss franc stablecoin with broad use. The banks aim to test how such a token could support payments, improve settlement speed and connect blockchain-based applications with traditional money.
The project will focus testing payment processes and exploring how programmable money could support financial services.
The stablecoin testing period will remain open to other banks, companies and institutions, the statement noted. The group aims to gather operational experience and assess whether a full market debut of a CHF stablecoin can follow.
The Swiss stablecoin testing period follows a consortium of 12 top banks including BBVA, ING, and UniCredit teaming up to back Qivalis, a digital euro that will debut in the second half of 2026, with the primary purpose of becoming the European alternative to dominant dollar stablecoins such as Tether’s USDT and Circle’s USDC.
Crypto World
Ceasefire lifts bitcoin, but animal spirits may not return just yet: Crypto Daybook Americas
The crypto market is back on the front-foot after a two-week ceasefire between the U.S. and Iran removed some of the geopolitical uncertainty and sent oil prices tumbling. Still, energy market dynamics are such that it may be too early to assume the return of animal spirits to risk assets.
Bitcoin has jumped 3% to $71,600 in the past 24 hours while ether (ETH), XRP (XRP), and solana (SOL) have all gained more than 5%. The CoinDesk 20 Index has outperformed bitcoin, rising 4.2 percent, which is typical when altcoins outpace the market leader.
Oil has plunged after Iran agreed to open the Strait of Hormuz, a key route for global shipments. WTI crude futures trading on NYMEX are down nearly 16 percent to $95 a barrel. When crude drops sharply, inflation fears ease, Fed rate hike calls weaken and crypto tends to rally.
Supporting the move is a drop in bitcoin and ether 30-day implied volatility, which measures market fear. Since the debut of spot ETFs two years ago, these numbers have evolved into VIX-like metrics, spiking during sell-offs and calming as panic fades.
The mood could get another lift later if Morgan Stanley’s bitcoin ETF debuts with strong volumes and inflows on day one. That would reinforce the story of institutional adoption.
“The recent pattern has been institutional demand showing up again through ETFs. When inflows are present, dips are bought faster and the market holds higher levels even when momentum cools,” Marex said.
Still, there are reasons to be cautious. The overnight rally was partly fueled by short positions being unwound after traders betting on a U.S.-Iran escalation got caught off guard. Shorts worth $431 million were liquidated in 24 hours, the largest since March 4, according to Coinglass. In cases like this, the market often chugs along waiting for fresh demand. Without it, gains can quickly reverse.
While oil is down to $85, it’s still $30 higher than before the conflict started on Feb. 28. Moreover, the ceasefire is temporary and not a permanent fix and for oil to drop further, hormuz tanker traffic and insurance rates need to normalize to pre-war levels.
“This remains a pause rather than a durable settlement, with the ceasefire conditional on how Iran manages passage through Hormuz over the coming weeks,” QCP Capital said. “That caution matters because the physical damage narrative has not gone away.”
Until then, oil could stay near $100 and keep risk assets like crypto in check. Stay alert.
What’s trending
Read more: For a comprehensive list of events that would be shaping up this week, see CoinDesk’s “Crypto Week Ahead“.
Today’s signal

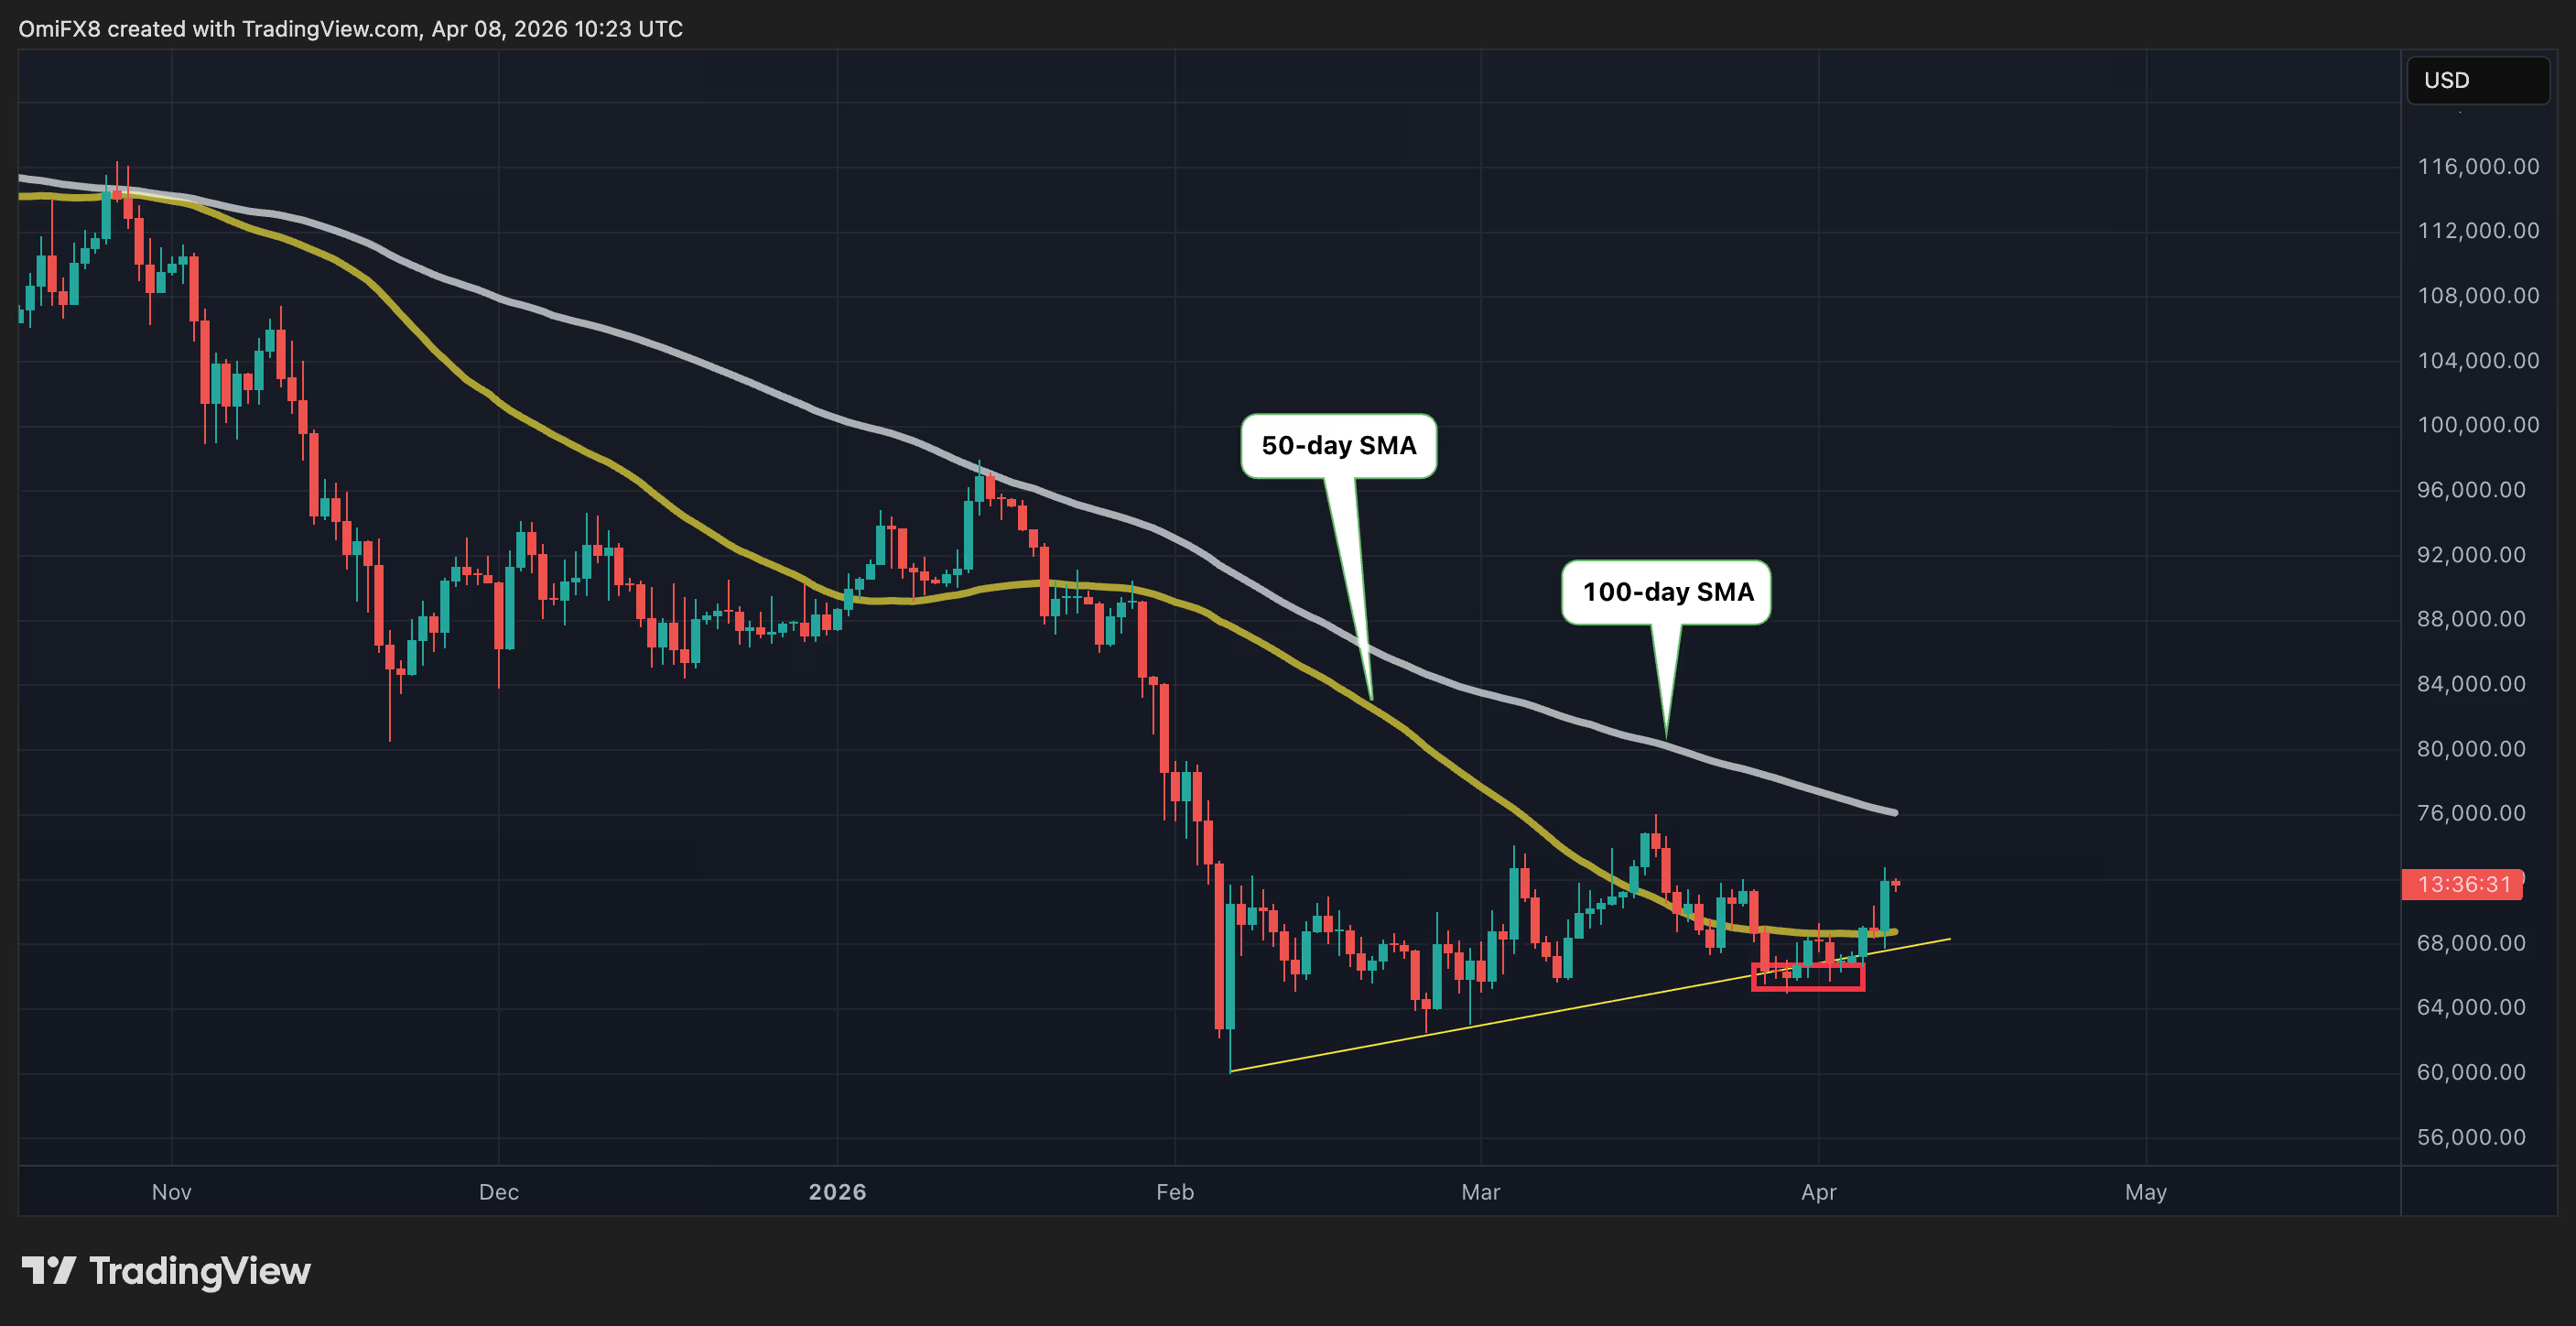
The chart shows bitcoin’s daily price swings in candlestick format since October. The yellow line represents the 50-day simple moving average (SMA) of the price, and the white line shows the 100-day average.
As shown, the spot price has decisively moved above the 50-day average, a widely watched measure of near-term trends. The move indicates a strengthening of bullish momentum and follows the recent bounce from the trendline support at the February lows.
Prices, therefore, could see more upside ahead, with $76,100, the 100-day average, as the next level to watch. On the downside, the late March lows near $65,000 are expected to act as a demand zone, supporting pullbacks. If that level fails, prices could fall to $60,000.
Read more: For analysis of today’s activity in altcoins and derivatives, see Crypto Markets Today
President Trump is weighing a plan to relocate US troops away from NATO countries he considers “unhelpful” in the Iran conflict, according to the Wall Street Journal.
The proposal, still in early stages, is one of several White House options to pressure allies over limited support for US-led operations.
NATO Rift Over Iran Widens
The plan would shift portions of roughly 84,000 American troops stationed across Europe. Trump and his team have expressed frustration at allies who denied the US logistical help, airspace access, or base use during strikes against Iran.
Secretary of State Marco Rubio said the administration would need to reexamine NATO’s value.
Trump himself has called some allies “cowards” and labeled the alliance a “paper tiger.”
Countries viewed as supportive, including Poland, Romania, Lithuania, and Greece, could receive additional forces. Those nations have aligned more closely with Washington’s eastern flank priorities.
Trade Threats Already in Motion
Trump threatened to cut off all trade with Spain after it refused to allow US military bases to be used in strikes against Iran.
He directed Treasury Secretary Scott Bessent to end all dealings with Madrid.
Meanwhile, Trump announced immediate 50% tariffs on goods from any country supplying weapons to Iran, with no exclusions or exemptions.
Russia and China are Iran’s most significant weapons suppliers.
No tariff package specifically targeting “unhelpful” NATO members has been formally announced.
However, the Spain episode and Trump’s pattern of mixing military pressure with economic punishment suggest trade measures could follow.
“The proposal would involve moving US troops from ‘unhelpful’ countries and into countries that were ‘more supportive’ of the Iran War 2. The plan is early in conception and one of several that the White House is discussing to punish NATO,” the Kobeissi Letter indicated, citing the WSJ.
Whether tariffs become the matching stick for resisters may depend on how NATO responds as ceasefire talks with Iran continue.
The post Trump Weighs NATO Troop Shakeup as Punishment: Could Tariffs Be Next? appeared first on BeInCrypto.

SEC taps enforcement chief as predecessor’s exit raises questions
Coi Leray & Miyoco Have Fans Losing It Over Dance Clips

Angel Reese Makes History in Victoria’s Secret Swim


-

 NewsBeat6 days ago
Steven Gerrard disagrees with Gary Neville over ‘shock’ Chelsea and Arsenal claim | Football
-

 Business6 days ago
No Jackpot Winner and $194 Million Prize Rolls Over
-

 Fashion5 days ago
Weekend Open Thread: Spanx – Corporette.com
-

 Business5 days ago
Expert Picks for Every Need
-

 Business3 days ago
Three Gulf funds agree to back Paramount’s $81 billion takeover of Warner, WSJ reports
-

 Sports4 days ago
India men’s 4x400m and mixed 4x100m relay teams register big progress | Other Sports News
-

 Business7 days ago
Login and Checkout Issues Spark Merchant Frustration
-

 Tech1 day ago
How Long Can You Drive With Expired Registration? What Florida Law Says
-
Business4 days ago
No Jackpot Winner, Prize to Climb to $231 Million
-

 Tech6 days ago
Commonwealth Fusion Systems leans on magnets for near-term revenue
-

 Fashion2 days ago
Massimo Dutti Offers Inspiration for Your Summer Mood Board
-

 Fashion1 day ago
Let’s Discuss: DEI in 2026
-
Politics5 days ago
Wings Over Scotland | The quality of mercy
-

 Business4 days ago
Akebia Therapeutics, Inc. (AKBA) Discusses Pipeline Progress and Strategic Focus on Kidney Disease Treatments at R&D Day – Slideshow
-

 Tech7 days ago
Following Artemis II’s Journey Around The Moon
-

 Fashion6 days ago
Statement Sunglasses: The Accessory Shaping Modern Fashion
-

 Business7 days ago
Investor reactions to Trump’s speech on Iran war
-

 Tech7 days ago
Daily Deal: The Modern No-Code Development Bundle
-
Sports7 days ago
Justin Jefferson’s Situation Remains Unchanged after JSN’s Deal
-

 Politics7 days ago
Trans kids protest the Department of Education
You must be logged in to post a comment Login