

Crypto World
Zuckerberg’s new AI tool signals Meta workplace overhaul


Meta CEO Mark Zuckerberg is reportedly testing an internal AI agent to assist with his daily work. The move reflects a wider shift within the company as it pushes to integrate AI tools across its operations and workforce.
Summary
- Zuckerberg tests AI agent to speed up decisions and reduce internal communication layers at Meta.
- Meta expands AI tools like MyClaw and Second Brain to improve workforce productivity.
- Reports suggest possible layoffs as Meta shifts toward AI-driven efficiency and flatter team structures.
Reports indicate that Zuckerberg is already using an AI agent to retrieve information more efficiently. Instead of relying on internal teams, the system gathers data directly, reducing delays in decision-making. The tool remains under development but is already part of the CEO’s workflow.
This effort aligns with Meta’s broader strategy to improve productivity across its workforce. The company is exploring ways to simplify internal processes and reduce dependency on layered communication structures.
Meta has been expanding its use of AI tools among employees. Internal systems such as MyClaw allow staff to access files, review chat logs, and interact with both colleagues and AI systems. These tools aim to streamline collaboration and reduce time spent searching for information.
Another tool, known as Second Brain, supports employees in managing tasks and projects. Built on Anthropic’s Claude infrastructure, it has been described internally as an “AI chief of staff.” These tools reflect Meta’s goal of increasing efficiency within its workforce of around 78,000 employees.
In addition, Zuckerberg has previously outlined plans to reshape how Meta operates. During a recent earnings call, he said that 2026 would mark a shift in how AI influences the company’s structure and productivity. He stated,
“AI starts to dramatically change the way” Meta works.
He also noted that Meta is focusing on building an environment where individuals can contribute more directly. He said the company is “investing in AI-native tooling” and “flattening teams,” signaling a move toward fewer management layers and more independent contributors.
Layoff reports and industry trends
Separate reports suggest that Meta may consider additional layoffs as part of its AI strategy. Sources cited in recent coverage indicated that up to 20% of the workforce could be affected, though no timeline has been confirmed. Meta responded by describing such reports as “speculative.”
The move toward AI-driven efficiency is not limited to Meta. Several firms across the tech and crypto sectors have announced layoffs while increasing investment in AI tools. Companies such as Messari and Crypto.com have also reduced staff as they shift toward AI-focused operations.

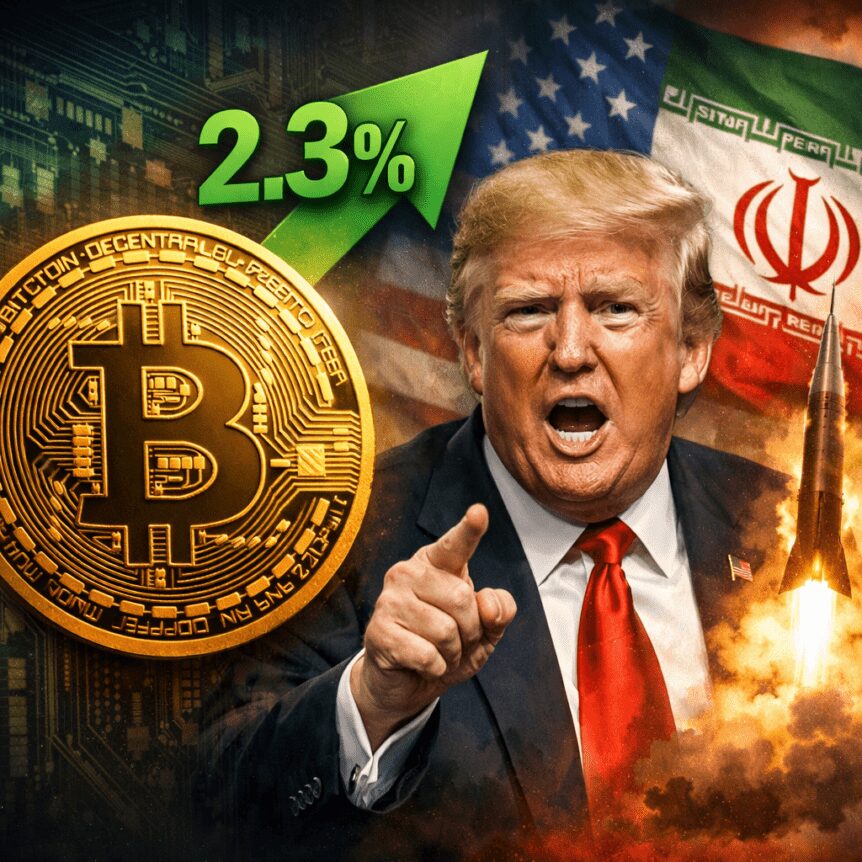
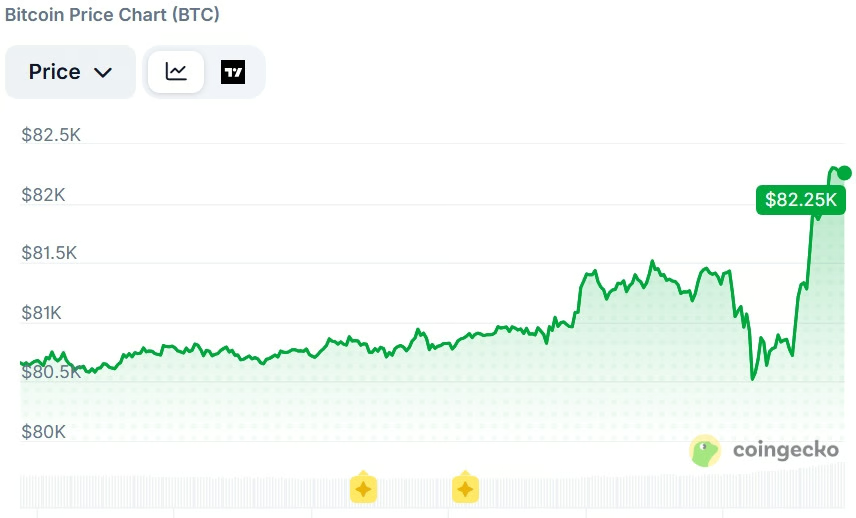
Bitcoin traded in a choppy session as geopolitical headlines dominated sentiment, with a dramatic swing after President Donald Trump rejected Iran’s counteroffer to a peace deal. The cryptocurrency briefly dipped below the 81,000 level before reclaiming ground and punching above 82,000 in a matter of hours.
Price data from CoinGecko show BTC slipping from around 81,430 to about 80,520 within 45 minutes, then rallying to a high near 82,347 less than three hours later. Derivatives data from Coinglass indicated roughly $64 million worth of short positions were liquidated in the four-hour window surrounding the move, underscoring the speed and sensitivity of markets to headlines. The broader backdrop remains a tense US-Iran dynamic, with oil prices advancing and U.S. stock futures nudging higher as the day progressed. Trump characterized Iran’s proposal as “totally unacceptable” in a Truth Social post addressing the offer.
The political flare-up sits atop a longer-running narrative around Middle East risk, the Strait of Hormuz, and the way macro forces translate into crypto and conventional assets. Oil prices rose about 4.6% to roughly $98.7 per barrel after Trump’s comments, while the S&P 500 futures index edged higher by about 0.13% in early trading. The headlines also intersect with regional instability and its potential to influence global risk sentiment, complicating an already nuanced environment for investors and traders in digital assets.
Key takeaways
- Bitcoin briefly dipped to around 80.5k and rebounded to about 82.3k within hours following Trump’s rejection of Iran’s counteroffer, showcasing BTC’s sensitivity to geopolitical headlines.
- About $64 million worth of short positions were wiped out in a four-hour window as the price moved higher, according to Coinglass data.
- Oil rose roughly 4.6% to near $98.7 per barrel, while U.S. equity futures showed modest gains, illustrating a broader risk-off/risk-on dynamic around the same headlines.
- Two potential catalysts in the U.S. Senate this week could inject regulatory clarity into the crypto sector: the confirmation vote for Kevin Warsh as Federal Reserve chair and the CLARITY Act markup.
- Bitcoin has climbed about 29.7% since the US-Iran conflict began on Feb. 28, outperforming the S&P 500 and gold over the same period, according to available market tallies.
Market pulse after headlines
The price action around BTC underscores how sensitive digital assets remain to real-time geopolitical developments. After a sharp downward move on the initial volley of headlines, Bitcoin’s bounce back above 82,000 signals persistent demand at the higher end of the trading range, even as risk sentiment flickers between caution and appetite for allocation in non-traditional assets. While some traders have continued to ride the volatility, others have used the volatility as an opportunity to adjust hedges or recalibrate risk exposure.
From a liquidity perspective, the short-covering burst highlighted in Coinglass’ data is notable: liquidations can amplify near-term moves as market participants recalibrate positions in response to headlines and evolving risk signals. In the same moment, the oil market’s reaction—the 4.6% jump to around $98.7 per barrel—reflects how macro shocks and geopolitical risk translate into both commodity and crypto markets, underscoring the interconnectedness of energy, equities, and digital assets.
Regulatory momentum could shape the Bitcoin roadmap
Beyond the immediate headlines, market observers say this week could mark an inflection point for regulatory clarity around digital assets in the United States. Markus Thielen, CEO of 10x Research, highlighted two upcoming Senate actions as potential catalysts that could “lean bullish” for Bitcoin by reducing institutional friction and smoothing the path for policy transitions.
“Two catalysts stand out this week: a Senate vote on Monday for Kevin Warsh’s confirmation as Federal Reserve chair and the Senate Banking Committee’s markup on the CLARITY Act on Thursday. Warsh is widely regarded as more hawkish on inflation than the current chair, Jerome Powell, but his confirmation could remove an overhang of uncertainty. The CLARITY Act represents what many in the industry view as the most significant crypto-legislation in years, potentially paving a clearer regulatory path for digital assets.”
Thielen’s view points to a broader narrative: regulatory clarity can lower the friction for institutional participation and foster a more predictable operating environment for crypto markets. In this framing, the two events could complement monetary policy dynamics, reducing policy uncertainty that often weighs on risk assets during leadership transitions and major legislative reviews.
Bitcoin’s resilience through the US-Iran conflict
Since the onset of the crisis — marked by events in late February that intensified after a U.S. airstrike targeted Iranian leadership figures — Bitcoin has advanced roughly 29.7%. That recovery places BTC ahead of the S&P 500 and gold over this span, suggesting that investors view digital assets as a potential hedge or diversification instrument even as traditional markets wrestle with geopolitical risk. The price trajectory adds a layer to a longer-running debate about Bitcoin’s role in macro risk-off or risk-on environments, and whether the asset can sustain a narrative of resilience during heightened tensions.
Looking back, Bitcoin’s volatility in response to geopolitical headlines is not a new phenomenon, but the current episode reinforces how macro shocks can intersect with sector-specific narratives around custody, liquidity, and regulatory clarity. If the regulatory tailwinds materialize in the coming weeks, the market could see a more stable path for institutional flows, potentially supporting a broader adoption arc for digital assets beyond a purely risk-on or speculative cycle.
As markets digest both diplomacy-focused headlines and policy signals, investors will be watching how the central bank’s leadership transition unfolds and what lawmakers deliver on crypto legislation. The coming days may reveal whether the combination of macro resilience and regulatory certainty can sustain Bitcoin’s momentum or whether volatility will reassert itself as geopolitical headlines evolve.
Readers should stay tuned for the next wave of regulatory updates and any fresh color on Fed leadership’s approach to inflation and market stability, as these factors will likely shape crypto volatility and institutional participation in the weeks ahead.


Digital Asset Holdings is reportedly raising about $300 million at a valuation near $2 billion, according to Bloomberg.
Summary
- Digital Asset’s reported $300 million round could become its largest funding raise to date.
- a16z crypto’s lead role points to rising venture interest in privacy-focused institutional blockchains.
- Canton Network’s recent Visa and DTCC links strengthen its pitch to regulated finance firms.
The round is said to be led by Andreessen Horowitz’s crypto arm, a16z crypto, and could close in the coming weeks.
The company is known for developing Canton Network, a blockchain built for financial institutions. Bloomberg cited people familiar with the matter, while Digital Asset and a16z crypto did not comment on the report.
Canton Network draws institutional attention
Canton Network is designed for tokenized assets, payments, and settlement activity where privacy is required. Its model allows institutions to share selected transaction data while keeping sensitive details private.
That privacy focus has helped Canton attract major financial names. Visa joined Canton Network as a Super Validator in March 2026 and added Canton to its stablecoin settlement pilot in April.
Additionally, the reported round would follow Digital Asset’s $135 million raise in June 2025. That funding was backed by DRW Venture Capital, Tradeweb Markets, Goldman Sachs, Citadel Securities, DTCC, and other financial firms.
Digital Asset also raised $50 million in December 2025 from investors including BNY Mellon, Nasdaq, S&P Global, and iCapital, according to prior reports. The new round would mark a larger vote of confidence in Canton’s role in institutional blockchain infrastructure.
DTCC and tokenized assets add context
The funding talks come as DTCC prepares to test tokenized securities activity. As previously reported, DTCC has said it plans to pilot tokenized versions of some assets it custodies, with testing expected in July and a wider launch targeted for October.
Canton has also gained links with Moody’s, Japan Securities Clearing Corporation, and Swiss crypto bank Amina. These moves show how Digital Asset is positioning Canton for regulated finance rather than retail crypto trading.

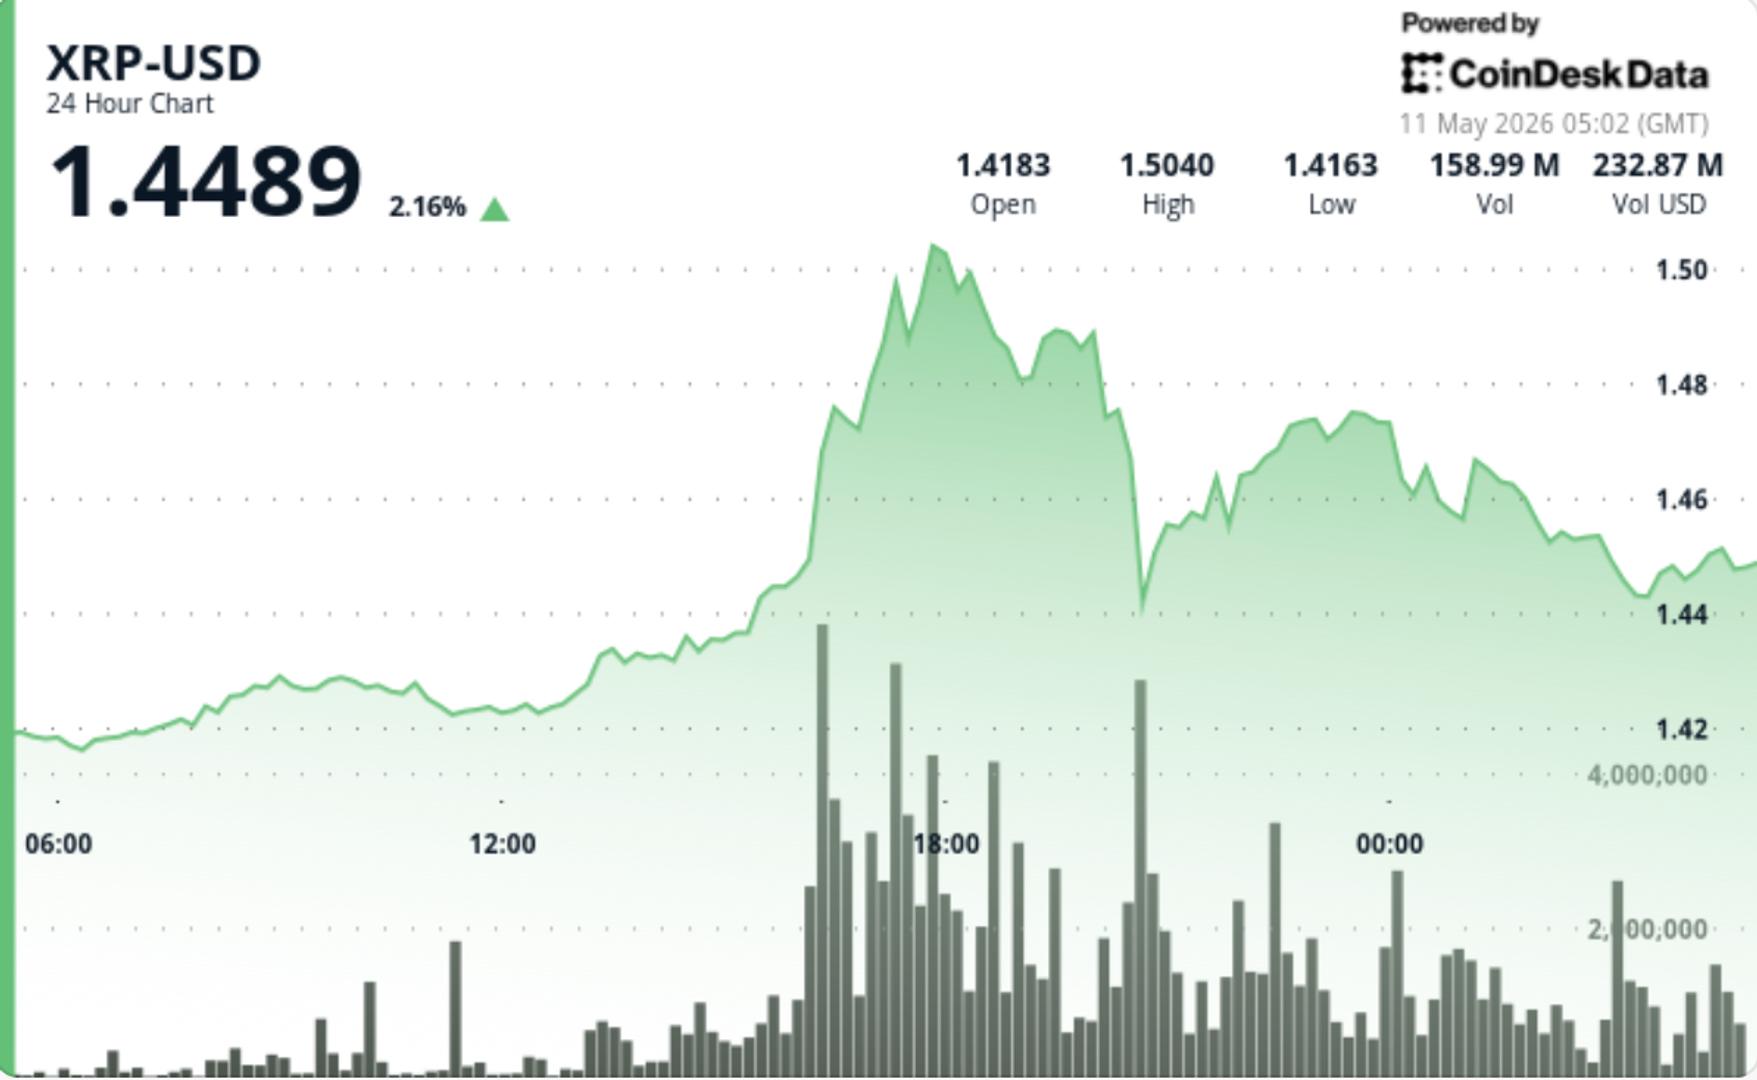
XRP finally forced its way through the $1.45 area that had capped rallies for weeks, and the move came fast. Volume arrived all at once during the breakout, which usually points to larger positioning rather than retail chasing, though the rally started losing momentum as price approached the psychological $1.50 level.
News Background
• Traders had been watching XRP’s tightening range for days as multiple analysts pointed to bull flag and triangle formations building beneath resistance.
• Thin liquidity conditions across major exchanges added to expectations that any confirmed breakout could produce exaggerated moves in either direction.
Price Action Summary
• XRP climbed from $1.4176 to $1.4524 during the 24-hour session, trading within a 6.5% range.
• The breakout accelerated during the May 10 16:00–17:00 window, when volume surged above 169M and pushed price through $1.4450.
• XRP later reached a session high of $1.5073 before pulling back toward the $1.45 area as traders locked in profits.
Technical Analysis
• The move above $1.45 matters because that level had repeatedly rejected upside attempts since April.
• Breakout volume was unusually strong, suggesting real participation behind the rally rather than a thin squeeze higher.
• Momentum cooled quickly near $1.50, where sellers stepped back in and triggered short-term liquidation pressure.
• Despite the pullback, XRP is still holding above the prior breakout zone, keeping the broader bullish structure intact for now.
What traders should watch
• $1.44-$1.45 is now the key support area. Holding above it keeps the breakout structure alive.
• $1.50 remains the immediate resistance level after the sharp rejection from session highs.
• A sustained move above $1.50 could reopen momentum toward $1.56 and potentially the $1.80 area highlighted by several analysts.
• Failure back below $1.44 would increase the risk of a retracement toward the $1.38-$1.40 range.
A crypto whale, Garrett Jin, has transferred $1.35 billion in Ethereum (ETH) to Binance, sparking concerns of a sell-off amid swelling exchange reserves.
The deposits, tracked by Lookonchain, coincide with institutional outflows and exchange inflow spikes that have pushed Binance’s ETH holdings to nearly a quarter of the centralized supply.
Whale Sends $1.35 Billion in ETH to Binance Over Just 4 Days
Lookonchain data shows Jin moved the entire 577,896 ETH position to Binance over four days. Most of these tokens were swapped from Bitcoin (BTC) eight months ago. At the time, the second-largest cryptocurrency was trading around $4,591.
“He is now down ~$1.3 billion,” the post added.
Meanwhile, asset managers added to the pressure. BlackRock and Fidelity sent more than 35,000 ETH into Coinbase Prime last week.
Follow us on X to get the latest news as it happens
While transfers to exchanges do not always indicate imminent selling, they often raise market concerns about potential liquidation pressure.
The pattern among large holders has added to these concerns. An analyst flagged a series of hourly spikes in Ethereum inflows on Binance in May.
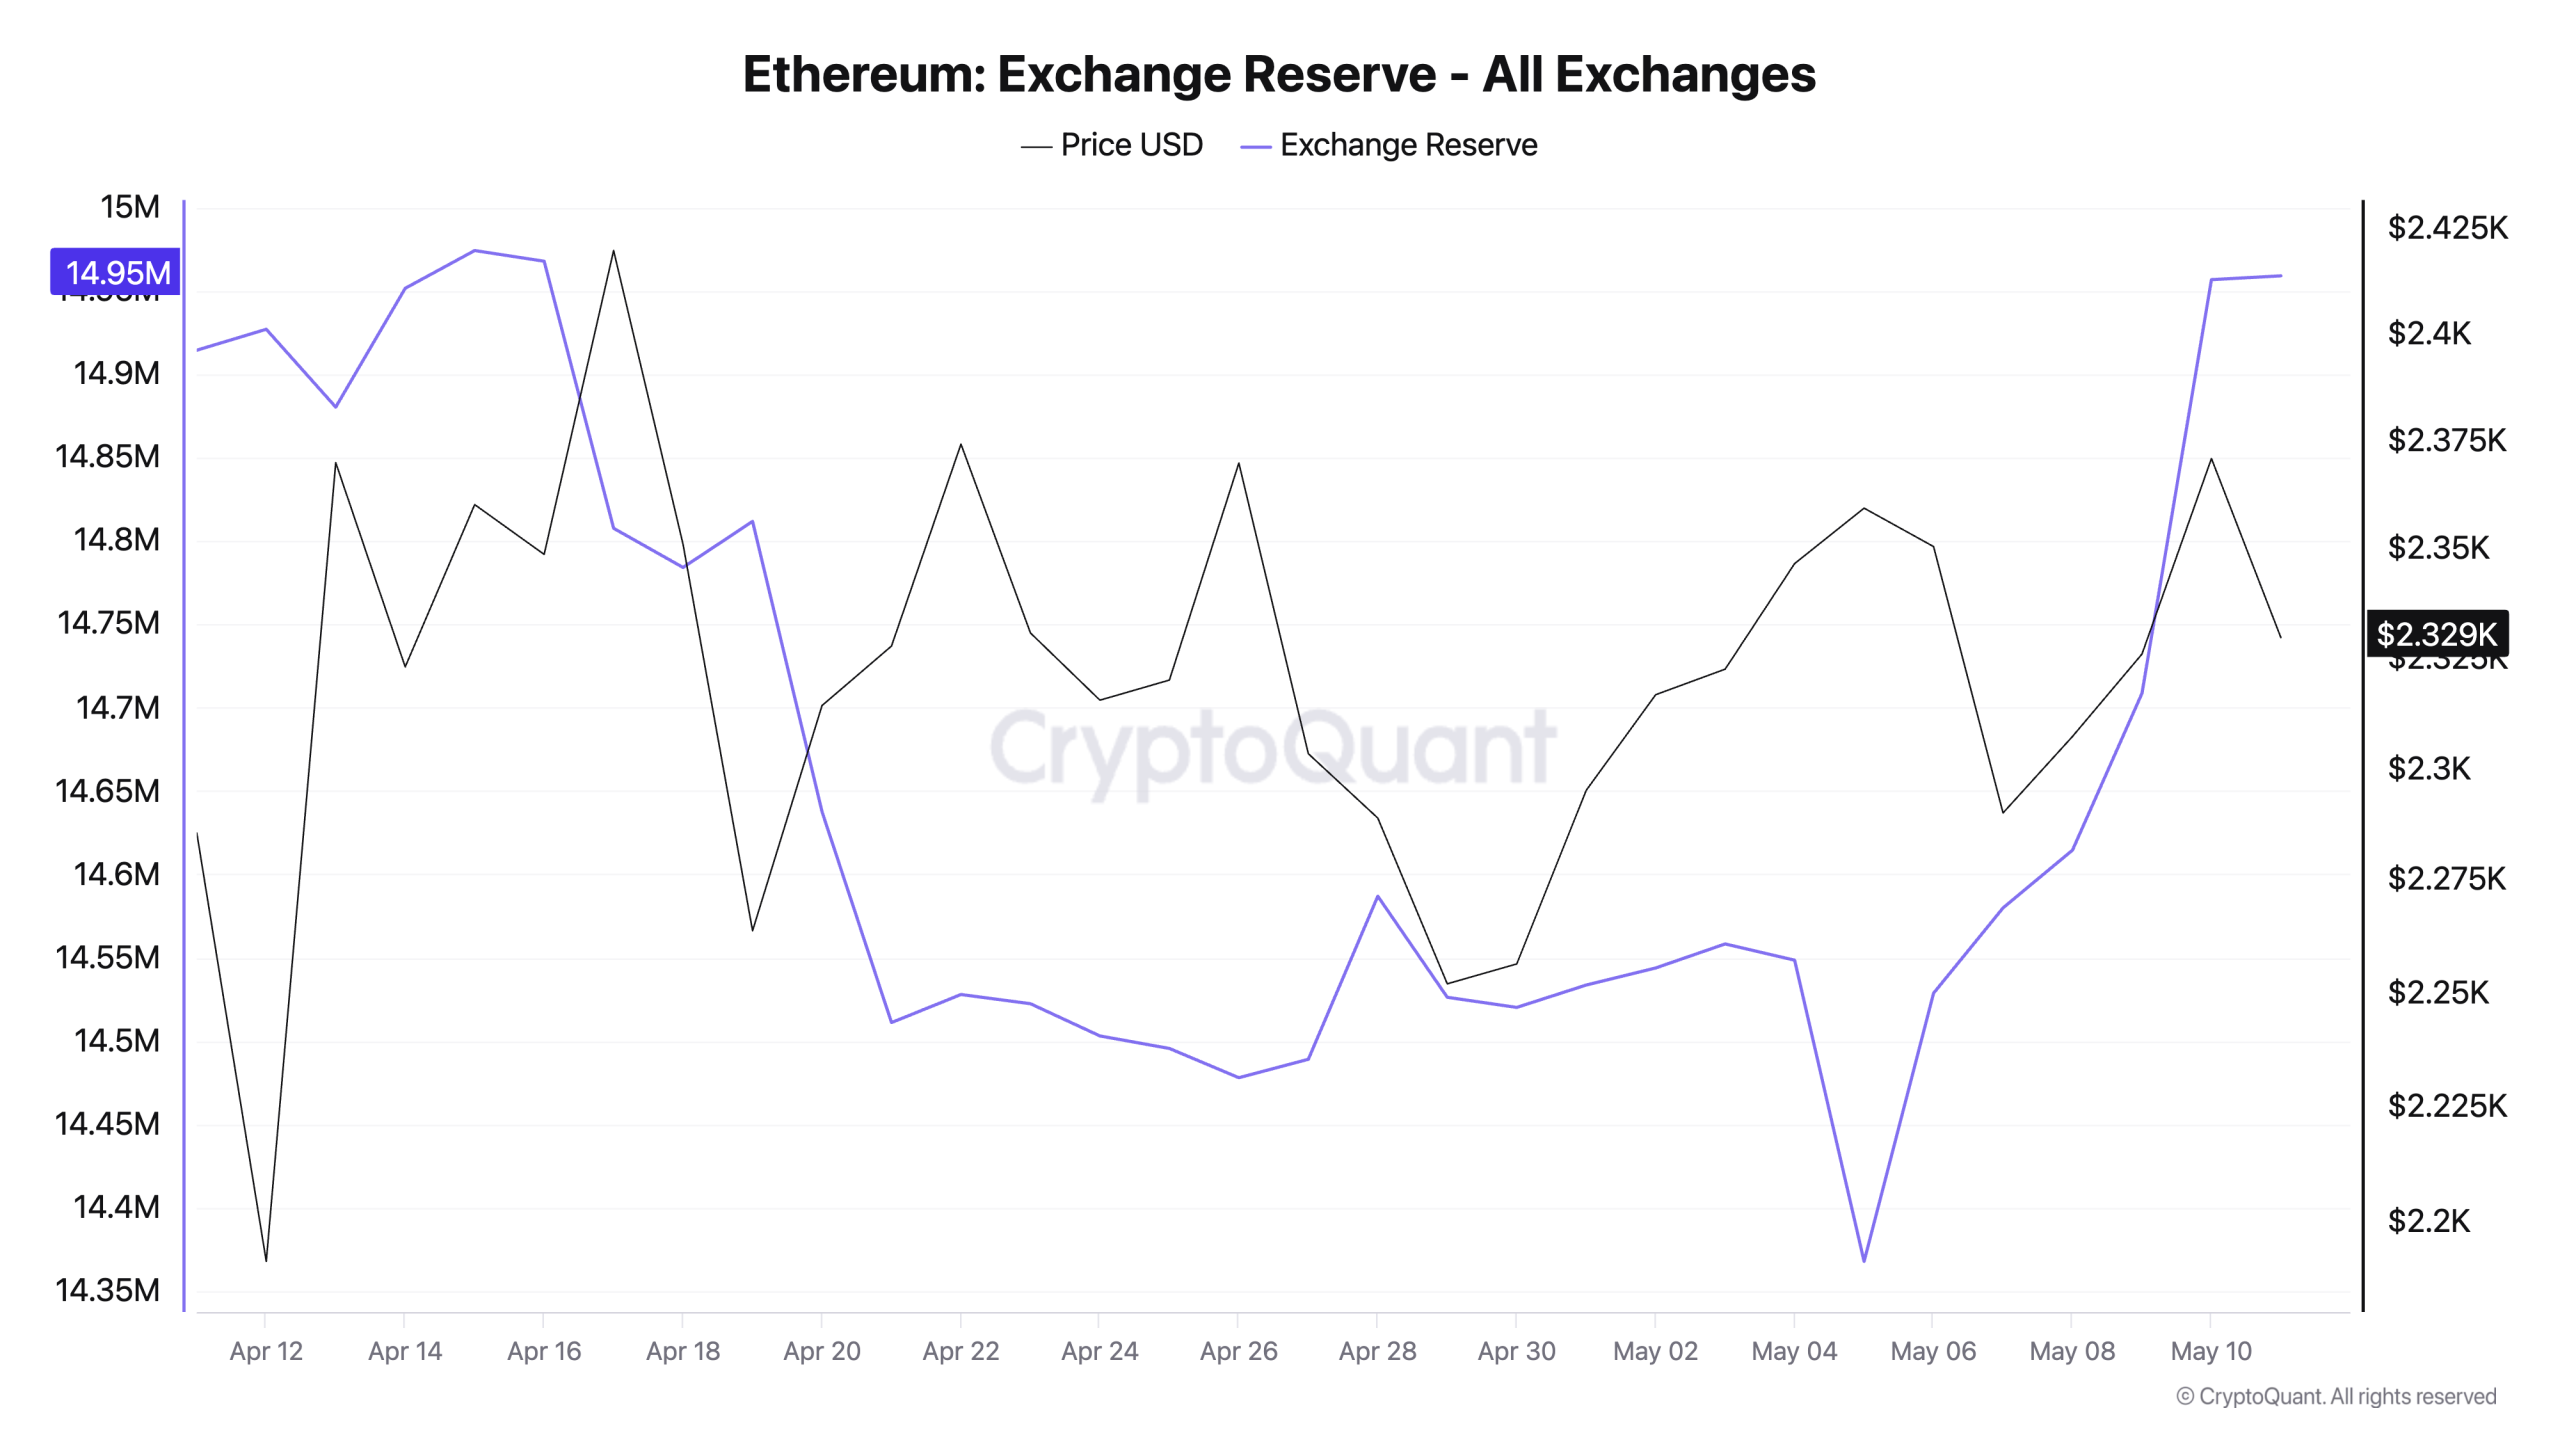
The analyst noted that Binance now holds around 3.62 million ETH, accounting for roughly 24.6% of all centralized exchange ETH supply.
According to CryptoQuant data, total exchange reserves have also climbed from 14.36 million ETH on May 5 to 14.95 million ETH.

Whether these deposits become outright sales remains to be seen. Whales sometimes move funds for collateral or liquidity management rather than immediate disposal.
Still, the convergence of whale activity and rising reserves leaves a heavier supply overhang.
Subscribe to our YouTube channel to watch leaders and journalists provide expert insights
The post Ethereum Faces Sell-Off Risk as Whale Moves $1.35 Billion in ETH to Binance appeared first on BeInCrypto.
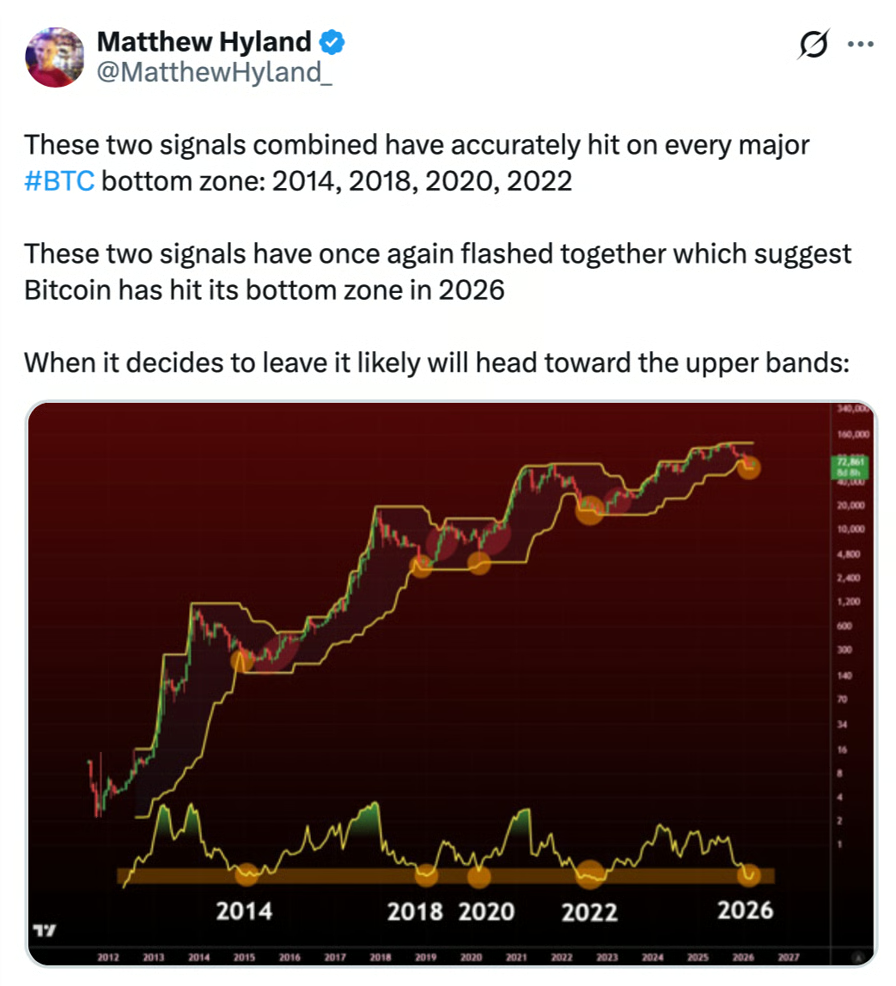
Bitcoin may have already bottomed in early February at around $60,000 and is unlikely to go lower this year, according to a crypto analyst, despite expectations of another downturn.
“The dozens of bottom signals only flashed in synchrony at the bottoms. They were not flashing in the middle. Yet they all flashed in Q1 2026 at 60k,” Matthew Hyland said in an X post on Friday.
“To compare the current price action to mid bear market price action has major visible flaws because you did not have bottom signals flashing in the middle; they flashed at the bottoms,” Hyland said, pointing to chart movements in prior cycles.

Source: Matthew Hyland
Analysts are divided over whether $60,000 was the bottom
Bitcoin (BTC) analysts have recently been divided over whether the asset already bottomed in February or if it still has further downside in this cycle.
Veteran trader Peter Brandt said in March that $60,000 may not be the lowest level for 2026, forecasting that Bitcoin could retest or even move “slightly lower” in September or October this year.
Bitcoin analyst Willy Woo said in an X post on March 17 that, from a liquidity perspective, Bitcoin is about one-third of the way “through the bear market.”
More recently, in an X post on Friday, MN Trading Capital founder Michael van de Poppe pointed to a forming pattern on Bitcoin’s short-to-long-term realized value ratio chart to argue that Bitcoin is nearing the end of the bear phase.
“The levels are hit again, which shows that we’re at the end of the bear market, and not at the start,” van de Poppe said.

Source: Michael van de Poppe
Bitcoin recently reached its highest price in three months
Bitcoin reached $82,499 on Wednesday, its highest price since Jan. 31. At the time of publication, Bitcoin is trading at $79,646, approximately 32.74% higher than the $60,000 level it reached in February, according to CoinMarketCap.
Related: Bitcoin bulls target $115K by December: Does data back the expectation?
Bitcoin analyst Kyle Chasse pointed out the price increase in an X post on Thursday, saying he expects further upside in the near term.
“$82,000 this week. Up 5% in five days. Crypto legislation is moving through Congress. Iran peace talks reducing risk-off pressure,” Chasse said.
“The technicals are clean. Bull-stacked moving averages. Shorts getting squeezed,” Chasse said, adding that the “next wall” is $85,000.
“Above that, the path to $100k opens back up,” Chasse said.
Magazine: XRP ‘probably going to $12,’ Bitcoin ETFs add $1B: Market Moves

Pacific Investment Management Company (PIMCO), a leading US bond manager, has warned that the Federal Reserve may need to raise rates rather than cut them.
This comes as the US-Iran war drives inflation higher and undermines the central bank’s 2% target.
Wall Street Heavyweights Warn Against Fed Easing Path
CIO Dan Ivascyn said Iran’s closure of the Strait of Hormuz has compounded long-standing challenges for US policymakers who have struggled to bring inflation down to target.
“US is further away from that, but you are going to see more tightening as it looks today in Europe, the UK and maybe even Japan, and I wouldn’t take it completely off the table for the US either,” he said
Ivascyn warned that cutting borrowing costs now could backfire.
“He added that any reduction in US borrowing costs ‘would be counter-productive . . . given the inflation dynamic and the uncertainty around inflation, the uncertainty around inflation expectations’, noting that any such move ‘very well could lead to higher intermediate long-term rates,” the FT reported.
Franklin Templeton Chief Executive Jenny Johnson also said inflation will be difficult to contain.
“It’s going to be difficult for the Fed to cut,” she warned.
Meanwhile, Goldman Sachs pushed back its forecast for the next two Fed cuts to December 2026 and March 2027. The bank expects energy cost passthrough to keep core PCE near 3% through 2026.
Follow us on X to get the latest news as it happens
Sticky Inflation Tightens Liquidity for Crypto
The Fed has held its benchmark rate at 3.50% to 3.75% since January 2026, pausing after three reductions delivered through 2025. March consumer prices climbed 0.9% on the month, pushing annual inflation to 3.3%.
Personal Consumption Expenditures (PCE), the Fed’s preferred gauge, rose to 3.5%, the highest level in nearly three years.
A higher-for-longer rate path compresses valuations for risk assets, including Bitcoin (BTC) and Ethereum (ETH). Historically, a stronger dollar tied to that outlook weighs on broader crypto markets, with altcoins absorbing the bulk of the selling.
Bitcoin reclaimed $80,000 in early May after the Trump administration moved to ease tensions with Iran, but a hawkish Fed pivot at the June FOMC meeting could cap further upside.
Subscribe to our YouTube channel to watch leaders and journalists provide expert insights
The post Rate Hike Back on the Table? Pimco Sounds Alarm Over Iran War Inflation appeared first on BeInCrypto.

Digital Asset Holdings, the enterprise blockchain company behind the Canton Network, a permissioned blockchain network for financial institutions with privacy features, is reportedly raising fresh capital at a $2 billion valuation.
The $300 million round is being led by venture capital firm a16z crypto, and is expected to close in several weeks, according to Bloomberg, which cited unidentified people with knowledge of the deal.
The report comes less than a year after Digital Asset announced it had raised $135 million in a strategic funding round led by DRW Venture Capital and Tradeweb Markets. A company spokesman on Sunday declined to comment in response to an email query from Cointelegraph.
In December, Digital Asset, the Canton Network and Depository Trust & Clearing Corporation (DTCC) announced a partnership to enable the tokenization of DTCC-custodied assets on the Canton Network.

Canton Network topology. Source: Canton Network Whitepaper
Last week, DTCC announced plans to pilot trading of tokenized versions of some of the $114 trillion in liquid assets that it custodies beginning in July with a goal of a full service launch in October.
Related: Canton, ZKsync clash over how blockchains enforce rules
Financial institutions are onboarding or experimenting with Canton Network
While the Canton Network has drawn mixed reactions from the crypto community over its role in the blockchain ecosystem and its level of decentralization, it continues to onboard global financial institutions, banks and government entities.
In March, financial rating agency Moody’s deployed its ratings data on the network, allowing financial institutions to use the data directly within blockchain workflows, making it the first credit ratings firm to publish its data onchain, according to an announcement from the firm.
In April, Japan Securities Clearing Corporation (JSCC), a financial clearinghouse and settlement service for equities, commodities and derivatives, announced it was testing onchain government bonds on the Network.
More specifically, JSCC is testing whether ownership of Japan’s government bonds can be transferred onchain and used as digital collateral.

The Canton Coin’s price action since December 2025. Source: CoinMarketCap
Earlier this month, Swiss crypto bank Amina, announced custody and trading support for Canton Coin, the utility token of the Canton Network.
Amina is the first bank regulated by the Swiss Financial Market Supervisory Authority (FINMA) to announce support for the Canton token, according to an announcement from the crypto bank.
Magazine: One metric shows crypto is now in a bear market: Carl Moon
Bitcoin briefly dipped before surging over $82,000 on Sunday as US President Donald Trump rejected Iran’s counteroffer to a peace deal, which could prolong tension in the Middle East.
“I don’t like it — TOTALLY UNACCEPTABLE, Trump said in a post to Truth Social on Sunday after reading Iran’s proposal to end the war. Iran has previously requested that the US pay for war reparations and unfreeze blocked Iranian financial assets.
Bitcoin (BTC) fell from $81,430 to $80,520 within 45 minutes of Trump’s post before whipsawing nearly 2.3% to $82,347 less than three hours later, according to CoinGecko data. Bitcoin’s rise also resulted in nearly $64 million worth of short positions being wiped out over the last four hours, according to Coinglass data.

Bitcoin’s change in price over the last 24 hours. Source: CoinGecko
The US-Iran war and dispute over control of the Strait of Hormuz — which handles one-fifth of oil trade — has caused significant disruption in the financial markets over the past ten weeks, particularly in oil markets, which rose another 4.6% to $98.7 per barrel on Trump’s latest comments.
The S&P 500 futures index has risen 0.13% since the market opened about two hours after Trump’s post.
Trump’s refusal to accept Iran’s counteroffer dashes hopes of an imminent end to the war on Wednesday. Israeli Prime Minister Benjamin Netanyahu also said the war won’t be over until Iran’s uranium sites are dismantled.

Source: Rapid Response 47
Bitcoin could see more regulatory momentum in US this week
Bitcoin’s strength at the $80,000 level could be supported by two favorable decisions in the US Senate this week, 10x Research CEO Markus Thielen told Cointelegraph.
“Two catalysts stand out this week,” a Senate vote on Monday for Kevin Warsh’s confirmation as Federal Reserve chair and the Senate Banking Committee’s markup on the CLARITY Act on Thursday, Thielen said.
Related: Bitcoin price may dip toward $70K as Fed estimates hotter inflation print
Thielen noted that while “Warsh is widely regarded as more hawkish on inflation” than the current Fed Chair, Jerome Powell, his confirmation would remove “uncertainty overhang.”
Thielen described the CLARITY Act as the “most significant piece of crypto legislation in years,” adding that it could be a “turning point for regulatory certainty across digital assets.”
“Both events lean bullish for Bitcoin: regulatory clarity reduces institutional friction, and a smooth Fed leadership transition avoids the policy uncertainty that typically pressures risk assets.”
Bitcoin up 29.7% since the US-Iran war began
Despite the US-Iran conflict, Bitcoin has now risen 29.7% since the US-Iran conflict started on Feb. 28, when a US airstrike killed Iran’s Supreme Leader Ayatollah Ali Khamenei.
Bitcoin has outperformed the S&P 500 and gold since the US-Iran war started, clawing back some lost ground from October when Bitcoin hit a high of $126,080.
Magazine: Adam Back says current demand is ‘almost’ enough to send Bitcoin to $1M


A bitcoin whale came back to life Sunday, moving coins worth $40 billion to a new address after more than a decade of inactivity.
The transfer took place at around 19:16 UTC, according to blockchain tracking service Whale Alert. The coins were moved from address “1KAA8GGhVjjUjVTz1HKAjCyGNzAKQd882j” to “bc1qm6m6d33d02edr0k8yj9jgt027zl6dvx6thjrxy.”
The wallet had remained inactive since November 2013, when BTC was originally acquired and subsequently held untouched for more than a decade.
The reason behind the latest transfer remains unclear. Large holders often move coins between wallets for address management or security purposes, though such activity can also precede sales or transfers to exchanges. In this case, the destination address does not appear to be linked to a known exchange wallet.
Dormant bitcoin wallets have increasingly resurfaced since BTC first crossed the $100,000 mark in late 2024. Several early investors and miners have moved long-held coins over the past year, with some ultimately taking profits after bitcoin’s massive rally.
The trend was most intense in July last year, when blockchain analytics firms flagged eight Satoshi-era wallets, each holding 10,000 BTC, moving their coins for the first time in 14 years. Those transfers came as bitcoin traded above $100,000 and hovered near all-time highs.
As of writing, bitcoin changed hands near $80,700, down over 1% since midnight UTC, according to CoinDesk’s market data.

Strategy, the Bitcoin treasury vehicle co-founded by Michael Saylor, signaled it would resume BTC purchases this week after its first-quarter earnings call, during which executives floated selling portions of its Bitcoin reserve to fund dividends on its corporate credit facilities. Saylor, who has historically marked new buys with an X post, sent a Sunday message: “Back to work, BTC.” The cadence has often preceded fresh accumulation.
The last known buy occurred on April 27, when Strategy purchased 3,273 BTC for roughly $255 million, lifting total holdings to 818,334 BTC. Strategy’s own purchases page at the time valued the stash at about $61.8 billion. The company had paused its BTC buying streak for one week ahead of the Q1 2026 earnings call, where management indicated it could periodically sell portions of BTC to fund dividends on its debt instruments.
Key takeaways
- Strategy plans to resume BTC purchases this week after pausing ahead of its Q1 2026 earnings call, continuing a pattern that has accompanied prior buying waves.
- During the earnings call, executives flagged the possibility of selling portions of its Bitcoin to fund dividends on corporate credit instruments, marking a shift from an earlier stance against selling.
- Strategy’s BTC stake stands at about 818,334 BTC, roughly 4% of the total supply, with the group asserting purchases and sales should not meaningfully move Bitcoin’s price.
- Reaction within the crypto community has been mixed: some view periodic sales as a way to finance future buys, while others warn of potential price pressure or a “doom loop” for the spot market.
- The firm cited an estimated $1.5 billion per year in dividend-equivalent payments, arguing Bitcoin’s high daily liquidity—over $60 billion on average—could absorb such demand without destabilizing prices.
Strategy restarts BTC purchases as a revised treasury playbook
On the earnings call, Strategy executives indicated that the company could periodically liquidate portions of its Bitcoin holdings to fund dividends on its corporate credit products. In a direct nod to this approach, Saylor told the call that the firm would “probably sell some Bitcoin to fund a dividend, just to inoculate the market, just to send the message that we did it.” The remark underscored a strategic pivot toward treasury management that blends accumulation with targeted selling for yield support.
The move drew a spectrum of responses from investors and observers. Some supporters argued that measured sales could provide a predictable mechanism to nurture future BTC purchases, effectively broadening Strategy’s financing toolkit. Others cautioned that even small, regular sales could add selling pressure to a market already sensitive to large holders’ actions.
Industry voices highlighted differing interpretations of the plan. Samson Mow, a prominent Bitcoin advocate, argued that Strategy’s sales would grant the firm additional optionality in the financial landscape. Critics, meanwhile, raised concerns about potential market implications and referred to the risk of reinforcing negative sentiment if sales appeared episodic or unpredictable. Strategy’s leadership tried to temper these concerns, with CEO Phong Le stressing that any sales would occur in specific, defensible circumstances—such as dividend distributions or tax deferral—while insisting that neither the company’s actions nor their timing should materially move Bitcoin’s price.
Le also framed the size of the operation in context: Strategy owns about 4% of the total BTC supply, and he pointed to Bitcoin’s substantial daily trading volume as a cushion. In an interview with CNBC, Le noted that the market’s liquidity could readily absorb the targeted cash flow associated with annual dividend payments—roughly $1.5 billion—without creating outsized price volatility. He reinforced the message that the firm does not intend to manipulate prices and that its buying and occasional selling are not expected to move the market significantly.
Market context, risks, and what to watch next
Strategy’s approach sits at the intersection of treasury policy and market dynamics. By expanding the toolbox beyond passive holding to include strategic liquidations, the firm aims to sustain its BTC holdings while delivering yields to creditors. Yet the decision to monetize a portion of the reserve raises questions about long-term price discovery for Bitcoin and the potential signaling effect for other large holders contemplating similar moves.
Analysts and traders will be watching several factors: the cadence and size of any future BTC sales, how the dividends on Strategy’s credit instruments are structured, and whether other institutions with sizable BTC treasuries adjust their strategies in response. The company’s reported scale—standing around 4% of the total supply—ensures that even modest shifts can become meaningful talking points for market participants. At the same time, observers point to Bitcoin’s liquidity as a mitigating factor; with daily volumes well north of $60 billion, the market could theoretically absorb substantial on-chain activity tied to dividends without a wholesale price revaluation in the near term.
Beyond market mechanics, regulatory and macro considerations loom. If Strategy proceeds with a measurable program of sales, nearby observers will scrutinize tax treatment, dividend timing, and the broader implications for corporate treasury strategies in the crypto space. As always with Bitcoin’s largest treasury holders, the balance between long-term accumulation and opportunistic monetization will shape both the price narrative and the strategic calculus of other institutions contemplating similar moves.
For now, the sequence is clear: Strategy intends to resume BTC purchases this week, while leaving open the possibility of measured sales to support its credit instrument dividends. The coming weeks will reveal how the market prices this nuanced treasury playbook and whether Strategy’s approach becomes a blueprint for a new era of corporate crypto treasury management.

Takeaways: Ducks impress with bounce-back performance vs. Golden Knights

FMR shares rise following acquisition update

Taylor Frankie Paul Shares Cryptic Mother’s Day Post
Manchester United reach agreement with Casemiro over contract clause amid transfer speculation

US brings back mandatory military draft registration

Steven Gerrard disagrees with Gary Neville over ‘shock’ Chelsea and Arsenal claim | Football


-
 Crypto World3 days ago
HarrisX Poll Found 52% of Registered Voters Support the CLARITY Act
-

 Crypto World4 days ago
Upbit adds B3 Korean won pair as Base token gains Korea access
-

 Fashion2 days ago
Weekend Open Thread: Marianne Dress
-

 Tech6 days ago
Image AI models now drive app growth, beating chatbot upgrades
-
 NewsBeat4 days ago
NCP car park operator enters administration putting 340 UK sites at risk of closure
-
 Business2 days ago
Ignore market noise, India’s long-term story intact, say D-Street bulls Ramesh Damani and Sunil Singhania
-

 Politics2 days ago
Politics Home Article | Starmer Enters The Danger Zone
-
 Sports7 days ago
2026 NHL playoff picks: Second-round predictions, series odds, Stanley Cup bracket
-

 Crypto World6 days ago
UAE Free Zone Deploys Blockchain IDs to Verify Registered Firms
-

 Crypto World5 days ago
BlackRock CEO Larry Fink Discusses a New Asset Class
-

 Crypto World4 days ago
Robinhood says Wall Street is building onchain
-

 Tech5 days ago
Apple and Samsung are dominating smartphone sales so thoroughly that only one other company makes the top 10
-
Entertainment6 days ago
Serena Williams hits Met Gala in metallic dress after GLP-1 reveal
-

 Fashion4 days ago
The Best Work Pants for Women in 2026
-
 Sports7 days ago
Hearts v Rangers LIVE: Prediction, team news and line-ups as Scottish Premiership title rivals meet at Tynecastle
-

 Politics6 days ago
Met Gala 2026: Madonna’s Dramatic Red Carpet Look Steals The Show
-

 Tech5 days ago
I tested the Xiaomi 17 Ultra’s camera and I don’t think I’ll ever go back to an iPhone
-

 Entertainment7 days ago
Skai Jackson Responds To AI Baklash After Viral Snapchat Photos
-
Crypto World4 days ago
The FOMO Is Back: Why Bitcoin’s Latest Rally Has Analysts Flashing Warning Signs
-
 Tech4 days ago
AI agents are missing all the discussions your team is having. SageOX has an answer: agentic context infrastructure
You must be logged in to post a comment Login