

Crypto World
Dogecoin price targets $0.15 despite bulls’ struggles


- Dogecoin price was around $0.094, up 4% in the past 24 hours.
- Bulls continue to show resilience as the technical picture suggests a potential breakout.
- Despite geopolitical headwinds, the $0.15 target remains in play.
Dogecoin (DOGE) is holding near the psychologically important $0.09–$0.10 range, as the broader crypto market navigates the geopolitical tensions linked to Iran.
The digital asset space has shown pockets of resilience, with Bitcoin remaining close to the $70,000 level, helping support sentiment.
Dogecoin had briefly climbed to around $0.15 in early 2026, and that level could remain relevant if buying interest returns, despite continued selling pressure over the past month.
DOGE eyes $0.10 retest
Dogecoin (DOGE) is trading around $0.094 at the time of writing, having slipped below the $0.10 level after a roughly 9% decline over the past week.
The $0.092 area has continued to provide near-term support through much of February and March.
The token is slightly higher on the day, after recently testing the lower band of its daily Bollinger Bands.
Broader market direction remains key. Bitcoin is attempting to stabilise near $70,000 despite ongoing geopolitical pressures, a level closely watched by market participants.
A sustained move higher in Bitcoin could support sentiment across altcoins.
For DOGE, the $0.10 mark remains a critical inflection point.
A break above this level could shift momentum in favour of buyers, while continued macroeconomic and geopolitical uncertainty may test the token’s ability to hold current support levels.
Dogecoin price outlook: $0.15 target remains
From a technical perspective, the case for Dogecoin (DOGE) revisiting the $0.15 level in the near term rests on two key factors.
First, the token has continued to hold above the $0.090 support zone.
Second, the Bollinger Bands on the daily chart are tightening, a setup that often precedes a stronger directional move.
These conditions have coincided with repeated rebounds from the lower Bollinger Band, suggesting that the $0.09–$0.10 range is acting as an intermediate support area.
Some analysts view this price action as indicative of a potential double bottom formation.
This structure implies that, for now, a sharp breakdown into a sustained free-fall scenario appears less likely.
At present, DOGE is trading close to the middle band of its Bollinger Bands, hovering near a key psychological level that has defined recent price action.
The continued contraction in the bands points to building pressure, with a breakout likely to determine the next directional move.

Dogecoin price chart by TradingViewIf the squeeze resolves upward, DOGE could retest the upper band and potentially post a sharp directional move.
Fundamentally, strong trading volume that’s up 120% in the last 24 hours to $1.69 billion suggests buyer interest.
This, aligned with whale accumulation, indicates a structural floor just beneath the current price.
As long as Dogecoin avoids an extended breakdown below $0.08–$0.09, the $0.15 target continues to appear technically plausible.

Crypto World
Circle Q1 Earnings: $21.5 Trillion USDC Volume Fails to Stop 15% Profit Drop as Investors Panic

Circle Internet Group (CRCL) reported a 263% surge in USD Coin (USDC) on-chain transaction volume to $21.5 trillion in Q1 2026, while net income from continuing operations fell 15% to $55 million.
The drop in reported profit largely reflects post-IPO stock-based compensation and continued investment in the company’s new Arc network and Agent Stack rather than operational weakness. Adjusted EBITDA still grew 24% to $151 million.
On-chain Volume Sets a New Record
USDC onchain transaction volume grew 263% year over year to $21.5 trillion in the first quarter, the standout metric in Circle’s earnings release. The token captured 63% of all stablecoin transaction volumes during the period, according to Visa Onchain Analytics.
USDC on Platform climbed 254% year over year to $13.7 billion, representing 17.2% of total USDC supply at quarter-end. Meaningful wallets holding more than $10 in USDC rose 47% to 7.2 million.
Enterprise integrations support the read that USDC activity is shifting toward programmable use cases. Kyriba embedded USDC into corporate treasury workflows during the quarter. Polymarket continued to scale USDC as core settlement collateral.
Profit Falls 15% as Circle Funds the Next Layer
Net income from continuing operations declined to $55 million in Q1 2026, down from $65 million in the prior-year quarter. The 15% slide came despite a 20% revenue increase to $694 million.
The squeeze came from compensation expenses. Stock-based compensation jumped to $51.8 million, roughly four times the $12.7 million booked in Q1 2025, driven by post-IPO equity awards and related payroll taxes.
Operating expenses overall rose 76% to $242 million as Circle invested in product, distribution, and infrastructure. Adjusted Operating Expenses, which strip out the stock-based items, grew 32% to $136 million.
Adjusted EBITDA tells a different story. The non-GAAP measure grew 24% to $151 million, reflecting underlying operating strength once stock-based items and one-off charges are stripped out. Reserve Income rose 17% to $653 million.
ARC Token Raise Funds Circle’s Layer-1 Pivot
Circle disclosed a $222 million ARC token presale at a $3 billion fully diluted valuation. The whitepaper, published Monday, details how the token will support governance, security, and network operations on Arc.
The presale signals Circle plans to channel stablecoin revenue into seeding a Layer-1 ecosystem rather than rely on third-party rails.
The Agent Stack pairs Circle CLI, Agent Wallets, and an Agent Marketplace with the existing Nanopayments product on Circle Gateway.
The toolkit is purpose-built for autonomous agents transacting in USDC across chains and payment protocols.
“Circle’s first quarter reflected strong execution against a much bigger opportunity: the rapid convergence of AI platforms and economic operating systems into a new internet stack,” said Allaire, Circle Co-Founder, Chief Executive Officer, and Chairman.
A Stablecoin Market Splitting in Two
Notwithstanding, Tether remains the volume king of stablecoin supply at roughly $189 billion as of this writing, supported by demand on Tron, Binance Smart Chain, and emerging-market payment corridors.
The company reported $1.04 billion in Q1 net profit and excess reserves of $8.23 billion through its BDO Italia attestation.
Meanwhilem, Circle’s stablecoin market share slipped 62 basis points year over year to 28%.
Even so, USDC overtook USDT in adjusted onchain volume during Q1, according to Mizuho Financial Group research that filters out wash and arbitrage flows.

Circle reaffirmed multi-year USDC growth guidance of roughly 40% compound annual growth, with FY 2026 adjusted operating expenses projected between $570 million and $585 million.
The June Form 10-Q filing and Arc’s mainnet timeline should reveal whether Q1’s onchain-utility advantage is widening.
The post Circle Q1 Earnings: $21.5 Trillion USDC Volume Fails to Stop 15% Profit Drop as Investors Panic appeared first on BeInCrypto.

France-listed Bitcoin treasury specialist Capital B has completed a new funding round, pulling in 15.2 million euros ($17.8 million) from strategic investors including Blockstream CEO Adam Back and Paris-based asset manager TOBAM. The capital was raised via a private placement of shares, with four share subscription warrants attached to each share at a fixed price of $0.78, Capital B said on Monday. The raise is framed as a step to accelerate the company’s Bitcoin accumulation strategy.
The company disclosed that the proceeds, combined with ongoing operations, could enable it to acquire an additional 182 BTC, potentially lifting its total holdings to 3,125 BTC. If all warrants associated with the transaction are exercised, Capital B could raise as much as $116.5 million through the issuance of roughly 92 million additional shares, according to comments from Alexandre Laizet, the board director of Bitcoin strategy at Capital B.
Capital B pointed to a broader context in which corporate treasury programs are diverging: some treasuries are hedging risk through derivatives and balance-sheet actions, while Capital B itself continues to pursue BTC accumulation. The timing follows a separate capital injection a week earlier when Capital B raised $1.3 million from Adam Back to fuel its Bitcoin treasury strategy.
The company’s announcement arrived as a number of other Bitcoin treasury players rebalanced exposure in various ways. In April, Nakamoto announced an actively managed Bitcoin derivatives program intended to generate recurring income and hedge part of its BTC holdings against downside volatility. In February, Genius Group disclosed it had sold its remaining treasury holdings to reduce debt, according to SEC filings. Against this backdrop, Capital B’s fundraising signals a continued push to expand crypto holdings rather than pare back exposure.
Capital B raises $17.8 million from Adam Back and TOBAM. Source: Capital B
Key takeaways
- Capital B secured 15.2 million euros ($17.8 million) in a private placement, with four warrants per share priced at $0.78, backed by investors including Adam Back and TOBAM.
- If all warrants are exercised, the deal could raise about $116.5 million and authorize roughly 92 million additional shares, expanding the potential capital footprint of the round.
- The funding supports an expansion of Capital B’s Bitcoin treasury, potentially adding 182 BTC to reach a target of 3,125 BTC, according to the company’s disclosure.
- Market reaction was positive in the immediate term, with Capital B stock rising about 4.3% after the announcement; shares were around 0.67 euros ($0.79) at the time of writing, and the stock had fallen about 11% year-to-date.
- Capital B currently ranks as Europe’s second-largest Bitcoin treasury holder, with 2,943 BTC (roughly $237 million), behind Germany’s Bitcoin Group SE, according to Bitcointreasuries data.
Strategic investors back Capital B’s growth plan
Capital B disclosed that the latest funding was conducted as a private placement of shares, with four warrants attached for each share at a fixed price of $0.78. The arrangement gives investors potential upside tied to the company’s ongoing equity issuance, should warrants be exercised. The disclosed terms and the accompanying corporate filing were published by Capital B on May 11, 2026, and include a note that the warrants could be exercised to issue a large volume of new shares, potentially expanding the equity base significantly.
Adam Back’s participation—alongside TOBAM, a quantitative asset manager with a long-standing crypto tilt—underscores continuing investor interest in corporate treasury strategies aligned to Bitcoin accumulation. Back’s involvement follows a separate fundraising round with Capital B a week prior, highlighting a pattern of strategic allies backing the company’s approach to growing its BTC reserve.
Funding terms, dilution risk, and what it means for the treasury
The key leverage in this deal is the attached warrants. If exercised, they could inject substantial additional capital and dilute existing shareholders, effectively allowing Capital B to issue up to about 92 million extra shares. The company’s board noted that the proceeds from exercising warrants could total roughly $116.5 million, contingent on investor demand and market conditions. In practical terms, the warrants create a potential future infusion that could accelerate BTC purchases, depending on how many warrants are ultimately exercised and how Capital B deploys the capital.
Capital B’s stated objective remains straightforward: expand its Bitcoin treasury. The company’s disclosure indicates a potential path to increasing holdings by up to 182 BTC from the capital now being raised, moving the position toward 3,125 BTC. The size of the total BTC reserve will depend on execution dynamics, BTC price levels, and the pace of purchases as part of the broader treasury strategy. For investors, the deal highlights the willingness of strategic backers to fund continued accumulation at a time when other corporate treasuries are diversifying or hedging risk.
Industry backdrop: hedges, raises, and the pursuit of yield in treasuries
The fundraising activity around Capital B occurs amid a mixed environment for corporate Bitcoin treasuries. While some firms have turned to hedging to mitigate downside risk, others continue to bolster BTC exposure. For instance, Nakamoto announced an actively managed derivatives program to generate recurring income and reduce downside exposure. In parallel, Strategy and XCE have undertaken separate capital actions in the broader market, with Strategy raising $2.5 billion through a combination of STRC issuance and stock sales, and XCE securing approximately $794,000 in capital with backing from Adam Back.
Even within Europe, Capital B’s latest round cements its position as a major player among Bitcoin treasuries. Bitcointreasuries data places Capital B as the 25th-largest holder, with 2,943 BTC valued around $237 million. The company’s European standing is reinforced by its designation as the continent’s second-largest treasury behind Bitcoin Group SE.
The ongoing activity suggests a continued appetite among selective investors for corporate Bitcoin exposure, even as the overall macro environment remains challenging for risk assets. The mix of new capital, strategic partnerships, and a willingness to use warrants to monetize future upside points to a nuanced strategy: grow the BTC reserve while maintaining flexibility to adapt to shifting market dynamics.
Market response and the current positioning
The immediate market response to Capital B’s news was constructive. Shares rose roughly 4.3% following the announcement, reflecting investor anticipation of an expanded BTC position and the potential for additional equity issuance via warrants. At the time of writing, Capital B trades near 0.67 euros per share (about $0.79), with year-to-date performance slightly negative as investors weigh the company’s growth trajectory against broader market headwinds.
From a fundamental perspective, the deal emphasizes Capital B’s continued commitment to Bitcoin accumulation as a central pillar of its business strategy, contrasting with peers that are taking defensive steps. The combination of new capital today and additional capacity from warrants creates a potential runway for more aggressive BTC purchases, subject to the cap table and market conditions.
The company’s publicly disclosed holdings place it well within Europe’s Bitcoin treasury landscape, providing a concrete example of how corporate treasuries are evolving in 2026. As BTC prices fluctuate and regulatory signals evolve, the pace and scale of Capital B’s purchases will be a barometer for investor confidence in corporate BTC strategies and the viability of warrant-based fundraising as a financing tool for continued digital-asset accumulation.
For readers tracking the corporate treasury space, the developments around Capital B will be worth watching in the coming quarters: how many warrants are ultimately exercised, how quickly the company deploys new capital into BTC purchases, and how broader market liquidity affects the appetite of strategic investors to back aggressive accumulation strategies.
Earlier in the year, other capital actions by related players—alongside Capital B’s own activity—suggest a continued, albeit selective, interest in expanding corporate Bitcoin treasuries rather than winding them down. The balance between hedging and accumulation will likely shape the trajectory of this niche sector in the months ahead.
As readers monitor the next filings and market data, the key questions remain: will the warrants be exercised to meaningfully expand Capital B’s equity base and BTC holdings, and how will BTC price dynamics influence the pace of accumulation and investor appetite for future rounds?


Strategy acquired 535 Bitcoin for about $43 million, paying an average price of roughly $80,340 per BTC, Michael Saylor said on Monday.
Summary
- Strategy added 535 BTC, raising its total Bitcoin holdings to 818,869 coins as of May 10.
- The purchase followed debate after Saylor said limited Bitcoin sales could help fund dividends.
- Strategy’s Bitcoin plan remains under scrutiny as preferred-share obligations raise fresh funding questions.
The purchase lifted the company’s total holdings to 818,869 BTC as of May 10, 2026.
Saylor said Strategy has now spent about $61.86 billion on its Bitcoin position at an average purchase price of about $75,540 per coin. He also said the company has achieved a BTC Yield of 9.4% year to date in 2026.
Moreover, the update followed Saylor’s May 10 X post, where he wrote, “Back to work, BTC.” The phrase drew market attention because similar posts have often come before Strategy purchase notices.
Buy follows dividend-sale debate
The new purchase came days after Saylor drew attention for saying Strategy may sell some Bitcoin to fund dividends. crypto.news reported that Saylor said the company could sell BTC while still remaining a net buyer over time.
Saylor said, “Even if we were to sell one Bitcoin, we’d be buying 10 to 20 more Bitcoin.” That claim should be treated as Strategy’s own view, as future purchases depend on market prices, financing access, and investor demand.
Q1 loss added pressure
The debate started after Strategy reported a $12.54 billion first-quarter net loss. crypto.news reported that the loss was tied to the lower value of the company’s Bitcoin holdings during the quarter.
The same report said Strategy held 818,334 BTC as of May 3 before the latest purchase. It also noted that preferred stock dividends had raised questions about how the company would fund payouts if Bitcoin failed to rise enough.
Meanwhile, Strategy’s prior purchase came on April 27, when it bought 3,273 BTC for about $255 million. That deal brought its holdings to 818,334 BTC before the company paused buying ahead of its Q1 call.
The April purchase was funded through sales of MSTR Class A common stock. At the time, Strategy said it still had $26.47 billion in MSTR shares available under its current program.


Ronin, the gaming-centric blockchain once synonymous with the industry’s infamous $625 million exploit, is officially shedding its sidechain skin on May 12 to become an Ethereum layer 2 to improve security while maintaining throughput.
Ronin, which announced the migration in April, will execute a hard fork at block 55,577,490, a process that will result in about 10 hours of downtime for users, the network said Monday on X. According to onchain data, the migration is expected to begin on Tuesday around 15:16 UTC.
“Four years ago, we launched Ronin because Axie Infinity needed a faster and more efficient network,” Ronin said when announcing the migration. “It worked. Axie Infinity onboarded millions of gamers to crypto, and Pixels proved that it was possible to do it again.” The time has come to plug “back into the mothership.”
While operating as an independent sidechain in mid-May 2022, Ronin suffered what is still today the largest DeFI bridge exploit in history. Layer 2 protocols benefit from tighter links to the underlying blockchain than sidechains, offering benefits that include greater security.
The network’s native token, RON, is currently trading at around 11 cents with a market capitalization of about $89.5 million, according to CoinDesk data. While the token remains significantly below its 2024 peak, the migration sparked a rally, with prices climbing 30% over the last 30 days as investors eye a shift in the network’s supply dynamics.
“During this downtime window, all network transactions [including transfers, swaps, and smart contract interactions] will be paused,” Ronin said, adding that all games using its network will also be affected. “To avoid any inconvenience, please complete all necessary transactions/onchain game actions on the Ronin Network before the downtime begins.”
During the downtime, a “Proof of Distribution” model will be introduced to reward builders based on active network contribution rather than passive staking, Ronin said. The team noted that “this is fundamentally bullish for RON as it dramatically cuts token inflation from over 20% to below 1%.”
The company also said that transitioning to the OP Stack will allow it to inherit Ethereum’s robust security while maintaining high throughput. The move redirects 90 million RON tokens previously earmarked for staking rewards into the Ronin Treasury, while more than doubling marketplace fees to 1.25% from 0.5%.
Ronin said its narrative is dominated by its pivotal return to Ethereum, a strategic move to reset its economics, secure its bridge infrastructure, and secure its future in an upgrade intended to improve scalability and reduce costs through the use of EigenDA for data availability.
Crypto World
BOJ Rate Decision Looms: What Japan’s Corporate Funding Crisis Means for Crypto Markets

Key Takeaways
-
Corporate credit concerns push BOJ toward potential June rate adjustment amid market uncertainty
-
Yen carry trade dynamics threaten Bitcoin stability as Japan considers monetary policy shift
-
XRP traders monitor Japanese credit market developments ahead of central bank announcement
-
Rising energy expenses and sluggish economic expansion challenge BOJ’s rate decision timeline
-
Central bank’s inflation projections heighten concerns over cryptocurrency liquidity and yen-based trades
The Bank of Japan’s upcoming policy decision extends beyond simple inflation management, as corporate financing vulnerabilities now dominate central bank considerations. A governmental advisory committee has pushed the monetary authority to evaluate credit market health before implementing any policy adjustments. This recommendation intensifies scrutiny ahead of the June 16 Tokyo policy announcement, particularly as energy sector pressures mount.
Business representatives on the economic and fiscal strategy council delivered their recommendations Monday via Cabinet Office documentation. They requested the BOJ monitor both funding availability and pricing dynamics in financial markets simultaneously. The group emphasized that resource scarcity and escalating costs could strain borrowing requirements for small and medium enterprises throughout the country.
This guidance arrives after last month’s split decision by central bank leadership, which maintained existing policy parameters. The 6-3 voting outcome revealed growing support among policymakers for another rate adjustment. Market-based swap contracts currently indicate a 75% probability of a June increase at the upcoming meeting.
Yen Carry Trade Mechanics Threaten Bitcoin Positions
Cryptocurrency market participants face direct exposure to Japan’s monetary trajectory through yen-denominated carry strategies. Market operators secure low-cost yen financing and redirect capital toward higher-yielding opportunities during stable policy environments. Japanese rate increases can trigger forced liquidations across Bitcoin and alternative digital assets.
The central bank elevated its core inflation projection to 2.8% for the present fiscal period. Simultaneously, officials reduced growth expectations to 0.5%, signaling economic weakness. This contrasting data complicates decision-making before the June gathering.
Bitcoin has profited from extended periods of inexpensive yen financing throughout international markets during accommodative financial conditions. However, any abrupt BOJ policy reversal could dismantle leveraged holdings and deplete market liquidity. Consequently, digital asset traders stand ready to respond swiftly to firmer rate indications from Japanese authorities.
Energy Pressures and Credit Vulnerabilities Impact XRP Outlook
XRP exists within the wider asset universe vulnerable to yen carry trade adjustments. Historical Japanese rate modifications have prompted rapid position reductions across prominent cryptocurrency tokens. XRP may experience downward pressure should traders decrease leverage exposure before the central bank’s determination.
The advisory group connected corporate financial strain to Middle Eastern geopolitical tensions and elevated crude oil valuations. Climbing energy expenditures can damage Japanese corporate profitability and amplify default probabilities, particularly among financially weaker entities. Additionally, Tokyo authorities have broadened subsidized loan program availability for struggling enterprises since April.
The BOJ Financial System Report highlighted vulnerabilities in shadow banking sectors and potential contagion from international conflicts. The IMF emphasized the necessity for transparent policy messaging given Japan‘s substantial sovereign debt burden and elevated debt servicing vulnerability. As a result, cryptocurrency market participants currently evaluate BOJ communications alongside inflation trajectories, energy market developments, corporate financing pressures, and worldwide liquidity dynamics.


Disclosure: The author of this story owns shares in Strategy (MSTR).
Michael Saylor, the executive chairman of Strategy (MSTR), the largest publicly traded corporate holder of bitcoin , announced Monday on X the purchase of 535 bitcoin for roughly $43 million at an average price of about $80,340 per coin
The purchases bring the company’s total holdings to 818,869 BTC, acquired for $61.86 billion at an average cost basis of $75,540. With bitcoin currently trading above $81,000, Strategy’s stash is currently in profit.
Last week’s purchases were funded by $42.9 million raised through sales of the company’s preferred stock, according to a May 11 SEC filing.
This purchase follows Strategy’s first-quarter earnings call, where the company said it was prepared to sell bitcoin to repay convertible debt or fund dividend obligations, provided the move remains accretive on a bitcoin-per-share basis.
MSTR shares rose more than 1% in pre-market trading.
Two Trump-branded ventures aimed at retail buyers are both in difficult positions months after their debuts, though for different reasons.
Roughly 600,000 buyers have paid $100 deposits for the gold-colored Trump Mobile T1 phone since its initial announcement, putting around $60 million into a venture that has not delivered a single confirmed device as of May 2026, per Moneywise.
Deposits were paid to Trump Mobile’s registered company T1 Mobile LLC, which uses a limited liability agreement from DTTM Operations, LLC – the company that manages intellectual property, trademarks, and likeness on merchandise associated to U.S. president Donald Trump.
Wow those Gold Trump phones that 590,000 people paid a $100 deposit on still haven’t been delivered after told they would be by September so NBC who bought one tried to call the Company & there’s no phone number only a email.They asked if they could get a refund & were told NO!😂 pic.twitter.com/EucWcjyorm
— Suzie rizzio (@Suzierizzo1) November 26, 2025
Promised delivery dates have slipped from late summer 2025 to November, then to December, and finally to first-quarter 2026, before being removed from the website entirely.
According to IBTimes reporting, the company updated its terms of service in April to clarify that deposits represent a “conditional opportunity” to buy the device if the company chooses to sell it, removing any binding contract. (CoinDesk has not independently reviewed the previous version of the terms.)
Trump Mobile did not respond to a request for comment send by email as of publication time.
The TRUMP memecoin, a separately structured venture, has had its own difficult run. The token launched in January 2025 at $1.21, zoomed to $73 within 48 hours as retail speculators piled in around the inauguration, and has spent the 16 months since grinding lower.
TRUMP traded at $2.45 on Monday, down roughly 97% from its peak and 82% on the year, CoinGecko data show. Chainalysis estimated retail investors in TRUMP have collectively lost roughly $2 billion since its introduction.
TRUMP launched with 80% of supply held by Trump-affiliated entities CIC Digital and Fight Fight Fight, with those tokens scheduled to unlock at approximately $500,000 worth per day (at current prices) through mid-2028. The schedule was disclosed as part of the token’s launch terms, but has produced sustained sell-side supply during a period of declining buyer interest.
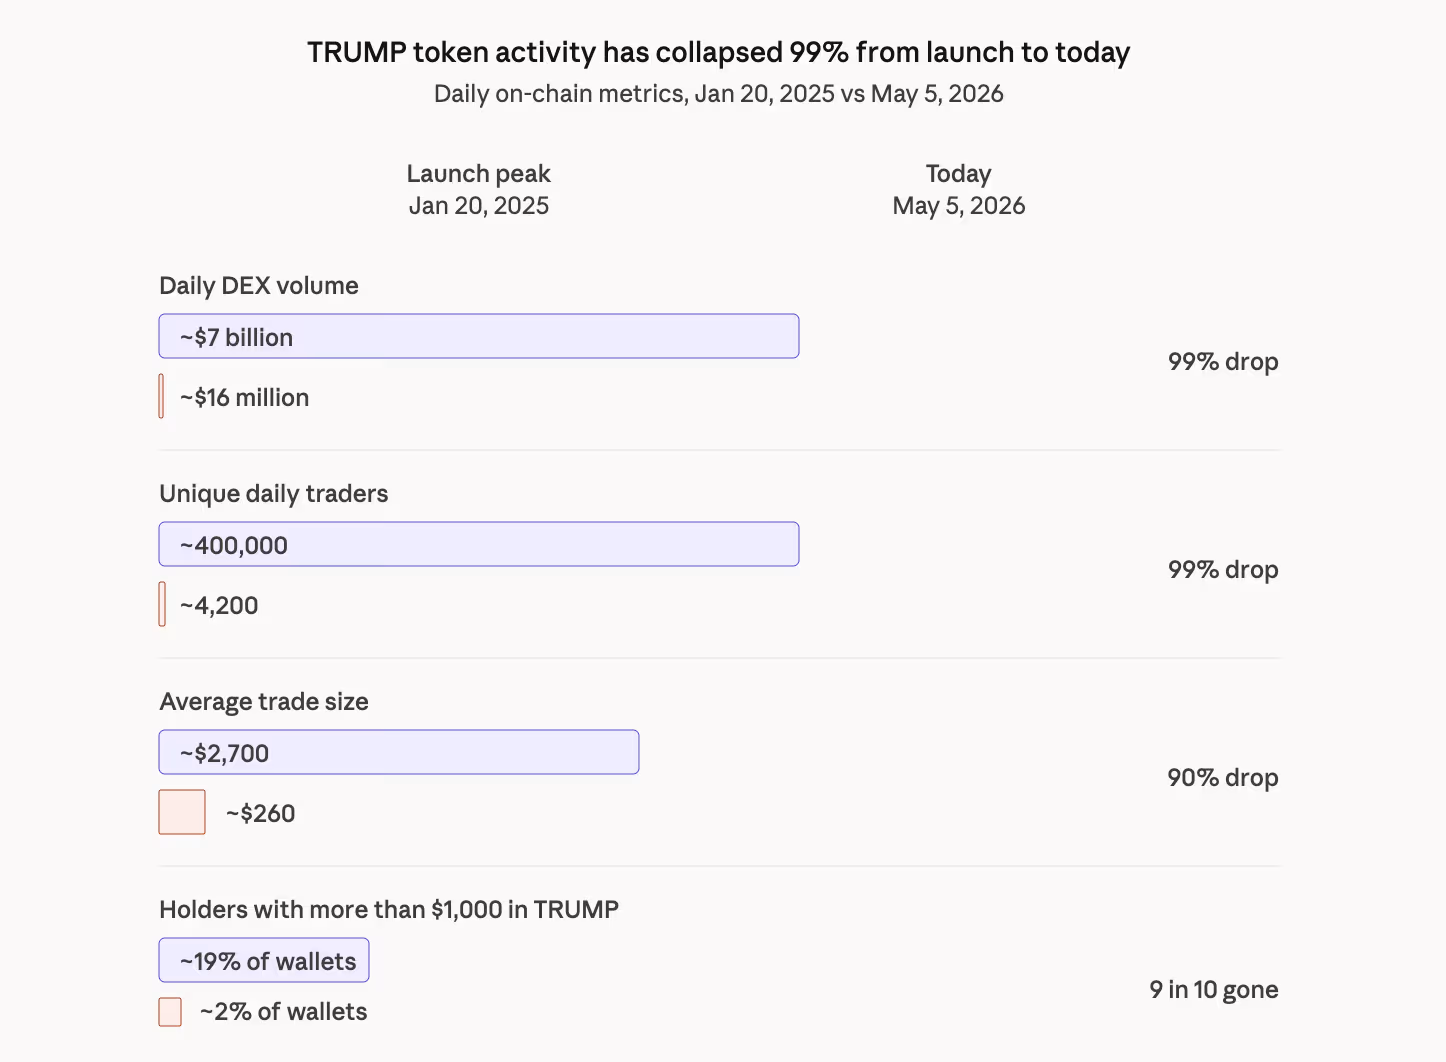
TRUMP’s daily DEX trading volume has dropped from a January 20, 2025 peak of nearly $7 billion across roughly 400,000 traders to about $16 million across just 4,200 traders on May 5, 2026, per Dune Analytics data tracked by user @seoul.
That is a 99% drop in both daily turnover and unique daily participants. Average trade size has fallen from around $2,700 to $260 over the same period, suggesting the remaining buyers are smaller retail accounts rather than the larger speculators who drove the original launch.
The share of TRUMP holders with more than $1,000 in the token has collapsed from roughly 19% at launch to about 2% today, meaning almost every remaining wallet now holds less than $1,000 worth of TRUMP. The token has effectively settled into a long tail of small bag-holders with no large position holders left to drive meaningful price action.

For TRUMP holders, the onchain math suggests that a return to launch-era valuations is becoming increasingly unlikely. At current prices, the remaining insider token unlocks represent more than $2.5 billion in potential supply overhang.
Absorbing that supply would require a demand event larger than anything the token has seen since launch, with the token down 13.6% over the past 30 days and roughly 0.1% on the day.
A dinner hosted by Trump for the top 220 token holders at his Virginia golf club in May 2025 produced a rally that faded within weeks. Tron founder Justin Sun pledged $100 million in TRUMP purchases ahead of the July 2025 unlock, with the token continuing to drift lower in the months that followed.
A separate Mar-a-Lago Crypto & Business Conference on April 25, 2026, limited to the top 297 TRUMP token holders with VIP access for the top 29, drew a letter from Senators Warren, Adam Schiff (Democrat, California), and Richard Blumenthal (Democrat, Connecticut) requesting documents about the President’s role in promoting the event.
While Trump tokens and the mobile ventures have different structures and mechanisms, they debuted on the back of front-loaded political enthusiasm, and have struggled in the months since to translate that initial momentum into either delivered product or sustained price support.


Ripple’s prime-brokerage unit has secured up to $200 million in financing from Neuberger Berman to expand margin services for institutional investors.
Summary
- Ripple Prime can draw up to $200 million based on institutional client borrowing demand across markets.
- The Neuberger facility supports margin trading across crypto, equities, fixed income, and foreign exchange.
- The deal follows Ripple’s Hidden Road acquisition and wider push into institutional brokerage services.
The facility was arranged through Neuberger Berman’s specialty finance group, according to Bloomberg.
The funding is designed to support trading across traditional and digital markets. Ripple Prime can draw on the facility based on client borrowing demand across equities, fixed income, foreign exchange, and crypto assets.
Meanwhile, Prime brokers provide financing, custody, clearing, and trading support to large clients. In this case, Ripple Prime plans to use the debt facility to increase the margin it can offer investors trading across multiple asset classes.
Ripple Prime President Noel Kimmel said, “The future of prime finance is supporting all major asset classes through a single structure and credit line.” That remains Ripple Prime’s position, while the actual use of the facility will depend on client demand and market conditions.
Hidden Road deal set up Ripple Prime
The move follows Ripple’s $1.25 billion acquisition of Hidden Road, which closed in October 2025. After the deal closed, Ripple renamed the multi-asset prime brokerage business Ripple Prime.
That transaction gave Ripple a larger role in institutional trading. Hidden Road already served clients across digital assets, foreign exchange, derivatives, and fixed income before becoming part of Ripple’s wider finance stack.
Moreover, Ripple has also moved Ripple Prime deeper into U.S. digital asset trading. In November 2025, the company launched digital asset spot prime brokerage for U.S. institutional clients, including over-the-counter spot access for XRP and RLUSD.
The institutional push continued in April, when Ripple Prime connected clients to Bullish’s regulated Bitcoin options market. That deal gave clients direct access to a crypto-settled BTC options venue while Ripple and OKX also worked to expand RLUSD access in compliant markets.
Credit line adds to Wall Street strategy
The Neuberger Berman facility gives Ripple Prime more capacity at a time when crypto firms are trying to serve institutional investors with products that resemble traditional finance. The structure also links credit, margin, and multi-asset trading under one brokerage platform.
Ripple’s wider expansion has included custody, treasury, stablecoin, and wallet infrastructure. In November 2025, the company acquired Palisade, adding another institutional custody and wallet business to a year of dealmaking.
Crypto World
Bitcoin Price Prediction: Bitcoin Is Coiling Below $83,000: Can CME’s New Volatility Futures Push BTC to $85,000 This Week?
Bitcoin price is clinging to the $81,000 zone right now, but the chart whispers a far more dramatic prediction than that flat headline suggests.
BTC has already slipped roughly 2% from its recent multi-month peak above $82,800, and the big question is whether this tight consolidation will hold—or if stretched oscillators will drag it into a sharper unwind.
One level towers over the entire setup: the $83K mark, home to the 200-day simple moving average that bulls must reclaim to reignite momentum. Fresh institutional infrastructure is arriving fast.
CME Group recently announced Bitcoin Volatility futures, set to launch June 1 (pending regulatory approval).
This marks a game-changing shift, letting big players hedge or speculate on BTC swings without touching the spot market itself, pure volatility exposure in a regulated wrapper.
ETF flows paint a nuanced picture of conviction mixed with caution. Morgan Stanley’s Bitcoin Trust has shown strong early traction with solid inflows since its debut, while Grayscale’s vehicle has posted net positives in recent sessions.

Yet selective profit-taking persists—BlackRock’s IBIT and Fidelity’s FBTC have seen mixed action, with some days of outflows (e.g., around May 8) amid broader choppiness, even as the complex logged strong multi-week inflow streaks earlier in May totaling billions.
Corporate buying marches on undeterred. Strategy (formerly MicroStrategy) continues its legendary accumulation, now holding over 818,000 BTC, close to 4% of total supply, with relentless quarterly additions that dwarf many ETF flows.
Public company Bitcoin treasuries keep climbing overall, underscoring a structural bid from balance sheets even as retail and some institutions rotate.
Macro crosswinds add spice. Lingering US-Iran tensions and stalled peace talks have injected risk-off vibes, propping up oil while keeping Bitcoin range-bound despite the building institutional scaffolding beneath it.
The next big directional cue will likely come from a decisive weekly close outside this consolidation zon, either breaking higher on fresh catalysts or testing lower supports if geopolitics or profit-taking intensify.
The setup is tense but loaded with potential: technical hurdles at $83K, volatility tools on the horizon, selective ETF appetite, and corporate giants still stacking. Bitcoin isn’t just holding ground, it’s coiling.
Bitcoin Price Prediction: Can BTC Price Hit $85,000 This Week?
Bitcoin is trading at $80,849, sitting above its SMA-20 at $78,658 and SMA-50 at $73,922. The structure is technically constructive but pinned below the SMA-200 at $82,755, which has capped every rally attempt this week.
The 24-hour range has been tight between $80,525 and $82,303. Daily volume at $18.3 billion shows engagement but not the explosive buying pressure that typically precedes breakouts.
Momentum is mixed. MACD and ADX lean bullish on the daily chart, but oscillators are flashing caution. RSI at 68, Stoch RSI at 94, and CCI at 140 are all approaching or inside overbought territory.
Sporadic lower-timeframe selling has already appeared.
One level defines everything right now. The SMA-200 at $82,755.
Clear it on a daily close, and the path toward $85,000 opens up, with CoinCodex projecting further upside toward $92,800 in an extended range.
Fail to break it, and Bitcoin grinds sideways between $77,000 and $82,755 as overbought conditions normalize. Polymarket currently assigns 60% odds to BTC trading in the $80,000 to $82,000 band near-term.
Lose $78,000 to $78,500, near the Ichimoku Kijun at $78,079, and selling accelerates as oscillators unwind. Key supports stack at $79,700 and $79,300. The 5-day probability of a meaningful upward move from that level is assessed at less than 20%.
Longer-term targets of $120,000 remain in play for analysts focused on macro tailwinds. But the near-term picture demands patience. A close above $82,755 changes everything. A break below $78,000 confirms the retracement.
The post Bitcoin Price Prediction: Bitcoin Is Coiling Below $83,000: Can CME’s New Volatility Futures Push BTC to $85,000 This Week? appeared first on Cryptonews.
XRP price is trading at $1.46, up 2% in 24 hours, and quietly outpacing both Bitcoin and Ethereum on a relative basis. The move builds on a breakout through $1.43 resistance that held traders hostage for weeks, and the volume behind it was anything but big.
The breakout accelerated yesterday when volume surged above $3.6 billion and forced the price through the $1.43 ceiling. XRP briefly tagged $1.50 before profit-taking pulled it back toward $1.45.
Meanwhile, network activity and institutional adoption metrics have been accelerating in parallel, adding structural weight to the technical setup.
Bitcoin sits at $81,000, and Ethereum is stalling at $2,330. Both are consolidating, and both also need triple-digit percentage gains to reach analyst targets.
Discover: The best crypto to diversify your portfolio with
Can XRP Price Hit $2 Short-Term, and Is $10 A Realistic Target?
XRP is holding above the prior breakout zone at $1.44–$1.45, which has flipped from resistance to support. As long as the price stays above it, the bullish thesis remains intact. Immediate resistance sits at $1.50, where sellers returned aggressively after the session high. A sustained close above $1.50 reopens momentum toward $1.60 first, then the $1.80 zone.
The scenario map breaks down cleanly. If XRP absorbs the $1.50 rejection, it could consolidate in a tight range to reclaim $1.50 on volume, which targets $1.80 and eventually $2.35 resistance. In this scenario, a breakout at that level points toward $3–$5.
We place the $10 trajectory in the context of XRP’s 580% surge from $0.50 to $3.40 between late 2024 and January 2025, a move that established the asset’s capacity for violent repricing. The $10 target is not fringe. A trader consensus is building around $10 before 2026 closes, citing regulatory clarity post-SEC settlement, RippleNet expansion, and Ripple Payments adoption by firms including Rakuten.
Discover: The best pre-launch token sales
LiquidChain Presale Approaches $750K as Cross-Chain Infrastructure Gains Attention
XRP’s outperformance reflects a market rotation into assets with clear utility narratives and institutional catalysts. But now, already more than 200% above its 2024 pre-surge levels, the asymmetric upside available to late entrants is structurally compressed compared to what early holders captured. That gap is driving renewed interest in early-stage infrastructure plays where price discovery has barely begun.
LiquidChain is one project attracting that attention. Positioned as a Layer 3 cross-chain infrastructure layer, it fuses Bitcoin, Ethereum, and Solana liquidity into a single execution environment. It is here, solving the fragmentation problem that forces traders and developers to manage separate positions across disconnected ecosystems.
The final layer emerges. — LiquidChain (@getliquidchain) May 10, 2026
LiquidChain is the future.  ⟁https://t.co/vqvBcdSQYC pic.twitter.com/gAhIyFxdXV
The presale is currently priced at $0.01458 per $LIQUID token, with $750K raised to date, and 1470% APY staking bonus. Key architecture features include a Unified Liquidity Layer, Single-Step Execution, Verifiable Settlement, and a Deploy-Once Architecture that lets developers access BTC, ETH, and SOL ecosystems without redeployment overhead.
Explore LiquidChain’s presale details here.
The post XRP Price Outperforms ETH and BTC: $2 Next Target as Ripple Token Eyes $10 appeared first on Cryptonews.
China’s marriages drop to decade low, deepening demographic concerns

Circle Q1 Earnings: $21.5 Trillion USDC Volume Fails to Stop 15% Profit Drop as Investors Panic

Prime Video’s Near-Perfect Crime Thriller Makes Sudden Comeback as a #1 Streaming Hit
Manchester United reach agreement with Casemiro over contract clause amid transfer speculation

US brings back mandatory military draft registration

Steven Gerrard disagrees with Gary Neville over ‘shock’ Chelsea and Arsenal claim | Football


-
 Crypto World3 days ago
HarrisX Poll Found 52% of Registered Voters Support the CLARITY Act
-

 Crypto World4 days ago
Upbit adds B3 Korean won pair as Base token gains Korea access
-

 Fashion3 days ago
Weekend Open Thread: Marianne Dress
-

 Tech7 days ago
Image AI models now drive app growth, beating chatbot upgrades
-
 NewsBeat4 days ago
NCP car park operator enters administration putting 340 UK sites at risk of closure
-

 Politics2 days ago
Politics Home Article | Starmer Enters The Danger Zone
-
 Business2 days ago
Ignore market noise, India’s long-term story intact, say D-Street bulls Ramesh Damani and Sunil Singhania
-

 Tech1 day ago
Auto Enthusiast Carves Functional Two-Stroke Engine from Solid Metal
-

 Tech6 hours ago
GM Agrees To Pay $12.75 Million To Settle California Lawsuit Over Misuse Of Customers’ Driving Data
-

 Crypto World6 days ago
UAE Free Zone Deploys Blockchain IDs to Verify Registered Firms
-
 Sports7 days ago
2026 NHL playoff picks: Second-round predictions, series odds, Stanley Cup bracket
-

 Crypto World5 days ago
BlackRock CEO Larry Fink Discusses a New Asset Class
-

 Crypto World4 days ago
Robinhood says Wall Street is building onchain
-
Entertainment7 days ago
Serena Williams hits Met Gala in metallic dress after GLP-1 reveal
-

 Entertainment7 days ago
Skai Jackson Responds To AI Baklash After Viral Snapchat Photos
-

 Tech5 days ago
Apple and Samsung are dominating smartphone sales so thoroughly that only one other company makes the top 10
-

 Tech5 days ago
I tested the Xiaomi 17 Ultra’s camera and I don’t think I’ll ever go back to an iPhone
-

 Politics6 days ago
Met Gala 2026: Madonna’s Dramatic Red Carpet Look Steals The Show
-

 Fashion5 days ago
The Best Work Pants for Women in 2026
-
 Sports7 days ago
Hearts v Rangers LIVE: Prediction, team news and line-ups as Scottish Premiership title rivals meet at Tynecastle
You must be logged in to post a comment Login