

Crypto World
Liquidity Zones and Liquidity Voids: Analysing Price Dynamics

Liquidity zones are areas where large buy and sell orders cluster, often acting as support or resistance. Liquidity voids (or imbalances) are fast price moves where little trading occurred, and price often returns to fill them.
Traders use liquidity zones to identify entry and exit points, while liquidity voids may help anticipate retracements and continuation moves.
This article explains how liquidity zones and liquidity voids function in market structure and highlights their role on price charts.
Takeaways
- Liquidity zones = high trading activity (support/resistance)
- Liquidity voids = low activity (fast price moves)
- Price tends to:
- move towards liquidity
- return to fill voids
- Commonly used with:
- market structure
- volume analysis
Liquidity Zones vs Liquidity Voids
Liquidity zones and liquidity voids differ primarily in how order flow is distributed and how price behaves within each environment.
In liquidity zones, trading activity is elevated due to the presence of clustered orders around previous highs, lows, or consolidation ranges. This concentration of liquidity typically causes prices to slow down, rotate, or produce reactions, reinforcing their role as support and resistance areas.
In contrast, liquidity voids form during strong directional moves, leaving behind areas where little trading activity has previously occurred. As a result, when price revisits these regions, it often moves quickly due to the absence of significant opposing orders.
Liquidity zones are generally associated with reversal or breakout strategies, where traders anticipate interaction between buyers and sellers. Liquidity voids, however, are typically approached with mean reversion expectations, as the market tends to rebalance prior inefficiencies.
Understanding Liquidity in Trading
In trading, liquidity refers to how easily an asset can be bought or sold without significantly affecting its price. High liquidity means there are enough buyers and sellers at a given price level, facilitating smoother transactions. This concept is critical because it affects how quickly and at what price a trader can enter or exit positions.
Assets with high liquidity tend to have tighter spreads, which may reduce trading costs.
Conversely, assets with low liquidity can experience abrupt price movements due to limited order flow. Understanding liquidity may help traders make decisions.
These dynamics give rise to two important phenomena in trading: liquidity zones and voids. Liquidity zones are areas with a high concentration of trading activity, while liquidity voids represent gaps in the market where trading activity is sparse, each presenting unique conditions for trading strategies.
What Are Liquidity Zones in Trading?
Liquidity zones (also called liquidity levels) are specific areas on a price chart where trading activity is highly concentrated. These zones indicate areas where large orders can be executed with minimal price impact.
Forex liquidity zones highlight areas where currency pairs tend to see higher activity.
These areas may be useful for identifying reversals or breakouts, providing reference points for entries and exits.
These zones often form around historical price levels where significant trading activity has occurred. They often act as magnets, attracting future price movement due to expected order flow. Liquidity levels are commonly associated with support and resistance. When price approaches these levels, traders can expect increased order flow, which may lead to clearer price reactions.
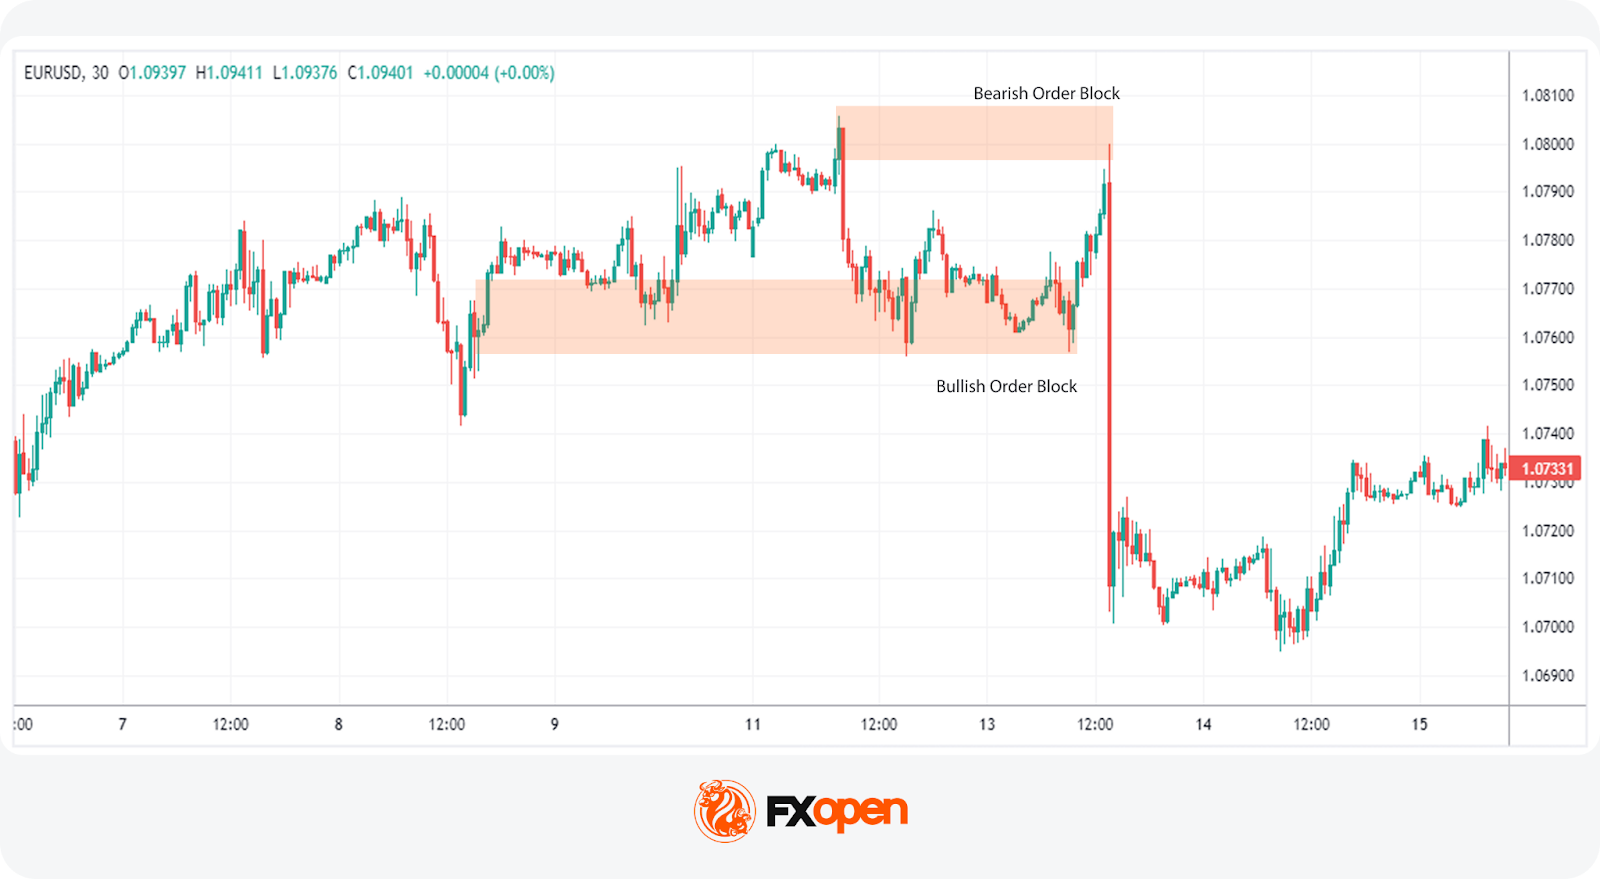
Liquidity Zones vs Order Blocks
How Traders Identify Liquidity Zones (With Examples)
Traders identify liquidity zones using volume, price structure, and historical levels. Liquidity zone trading depends on accurately identifying areas where trading activity is concentrated. These levels highlight regions of high volume and may act as pivot points for price action.
Volume Profile
This approach uses the volume profile to show where most trading activity has occurred.
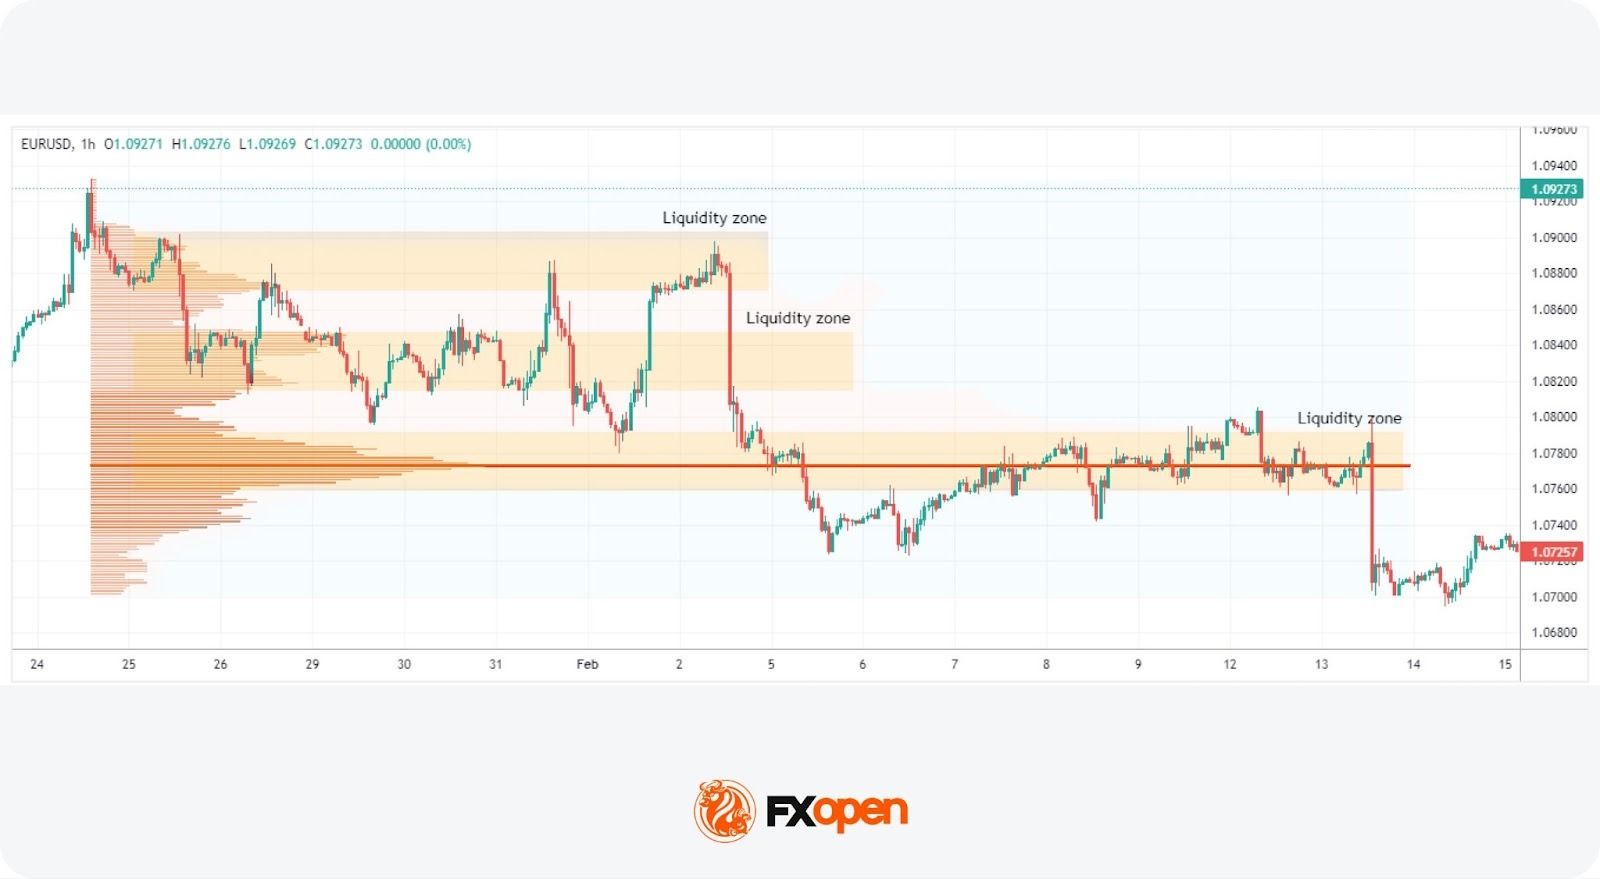
Unlike traditional indicators that display volume over time, the volume profile shows volume at specific price levels. This may help traders identify peaks in volume, highlighting areas of significant liquidity.
To use the volume profile tool as we have in the picture above, you can head over to FXOpen’s TickTrader trading platform and search for “Volume Profile Fixed Range” under the Indicators tab.
Price Consolidation Areas
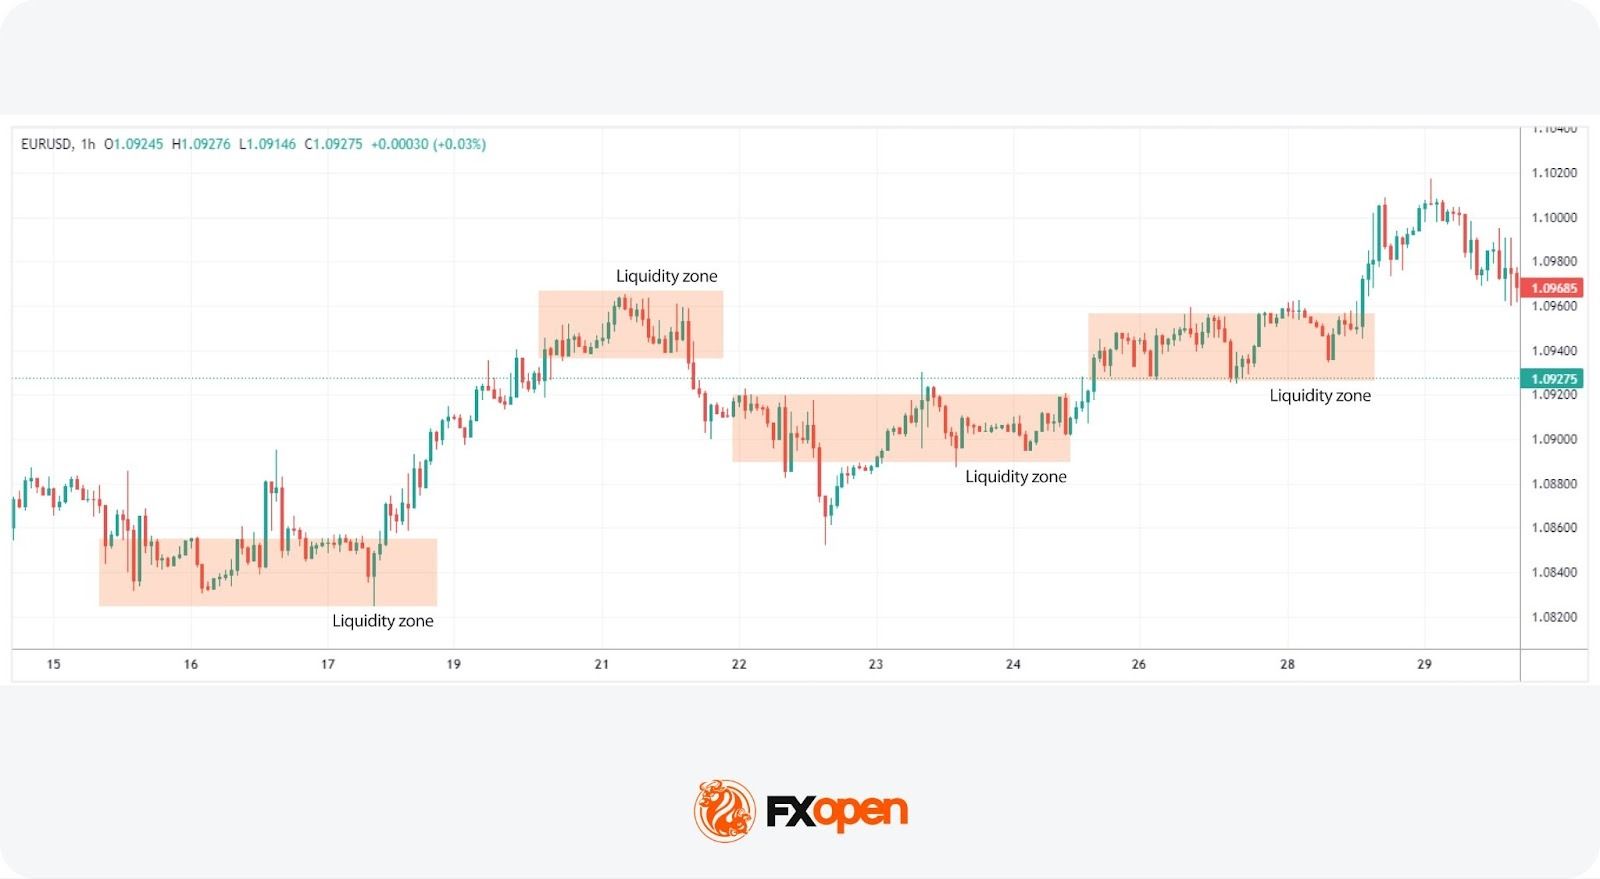
Recognising zones where the price has consolidated for a notable period is another method. These areas represent a tug-of-war between buyers and sellers, resulting in a high volume of trades. Such levels often act as magnets for future price action, making them critical for liquidity area trading.
Previous Support and Resistance Levels
Historical support and resistance levels are invaluable for spotting zones. These are levels at which significant reversals or pauses in trend have occurred, indicating areas where large volumes of orders may accumulate. When price approaches these levels again, it often does so with increased trading activity, making them prime candidates for liquidity areas.
What Is a Liquidity Void (Imbalance)?
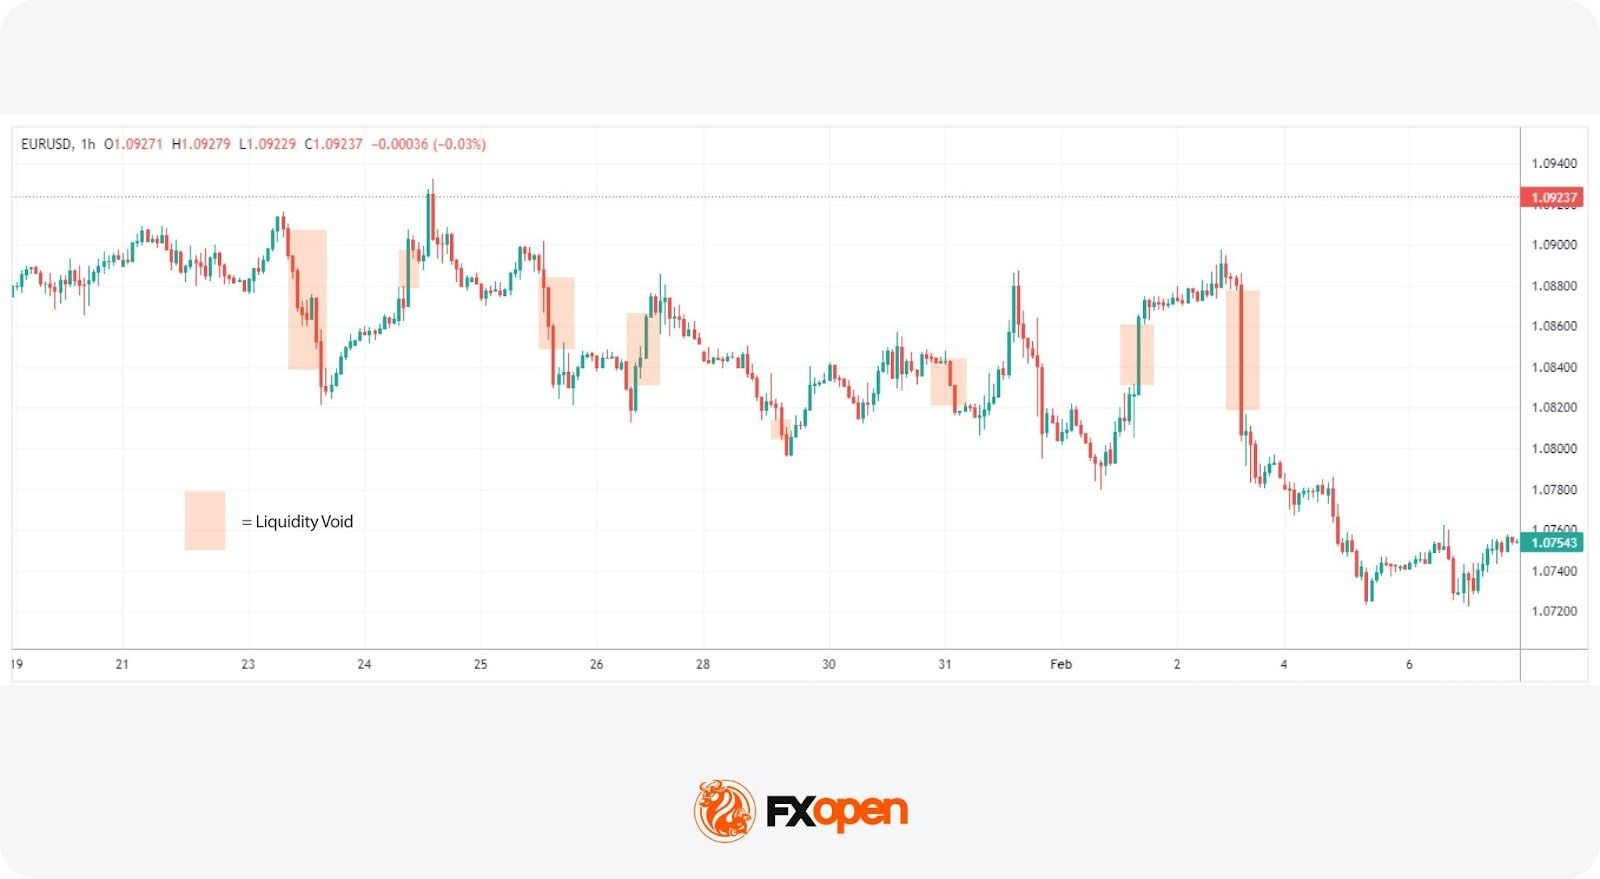
Liquidity voids (imbalances) are rapid price movements where little trading activity occurs between two levels. These gaps can lead to abrupt price changes and are often visible as sharp moves on a chart.
A liquidity void in forex signals an imbalance between buyers and sellers, causing prices to move quickly. This can result in sharp price movement as the market seeks a new equilibrium. These voids often occur after major news releases, during low-liquidity periods, or due to large institutional trades.
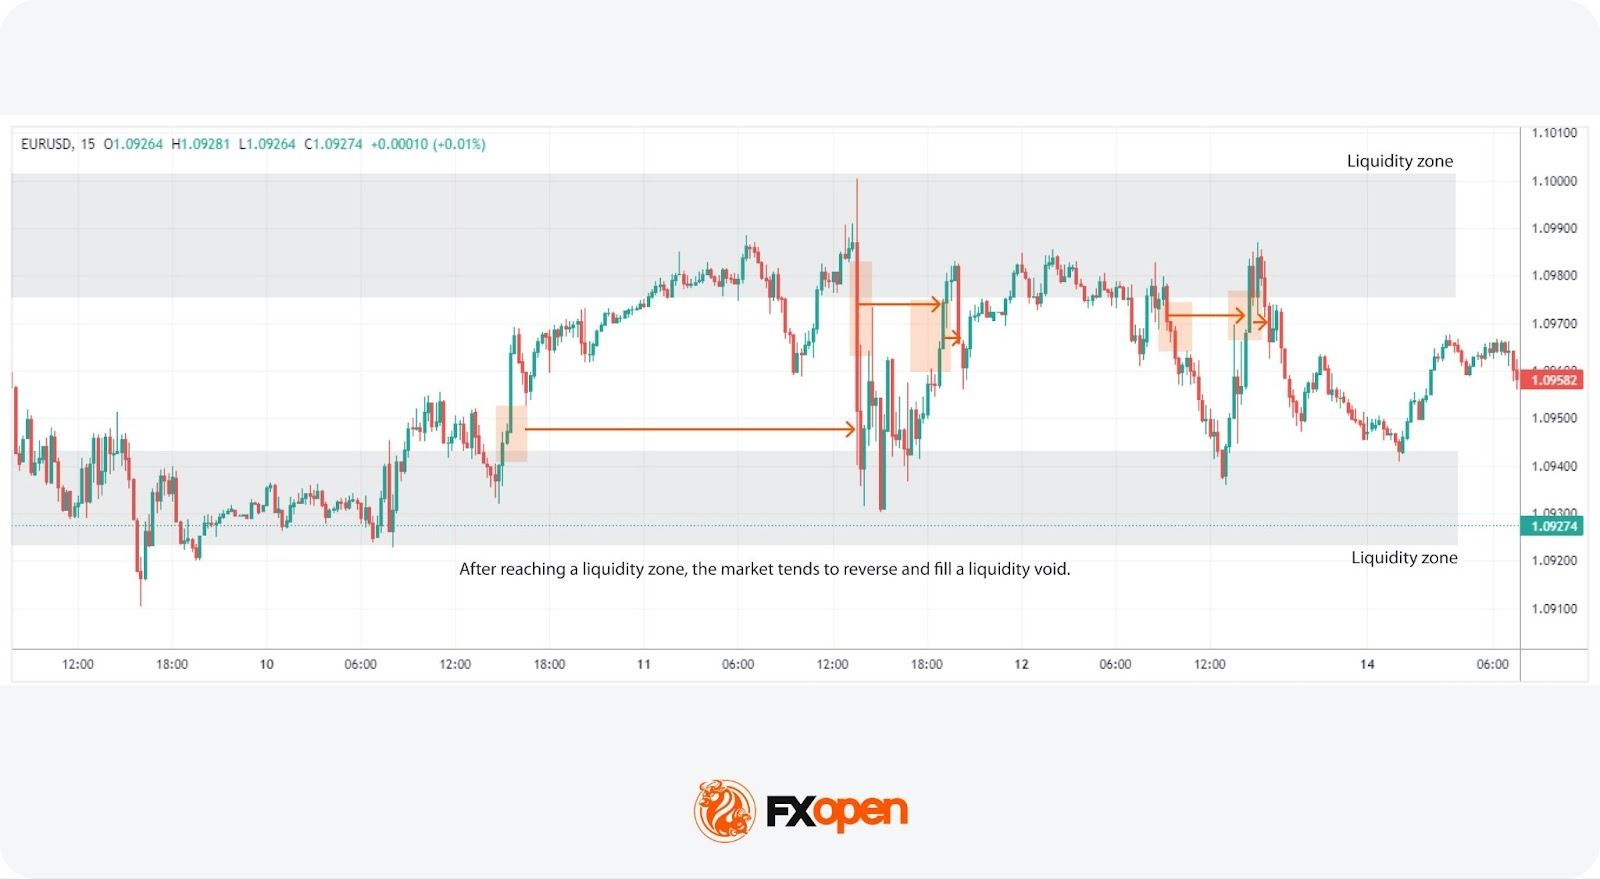
Their impact extends beyond the initial move. They represent areas where the market has not established a consensus price, which may lead to increased volatility later. Prices often return to these areas to “fill” the imbalance and restore balance in the market.
Traders navigate the increased volatility and unpredictability associated with these gaps but can also strategise to take advantage of the potential return to equilibrium.
How Traders Spot Liquidity Voids (Types of Liquidity Voids)
Liquidity voids can be classified based on where they appear in a trend. Liquidity voids in the forex market manifest in various forms, each with distinct characteristics and implications for traders. Understanding the different types of voids may support traders in navigating these challenging areas. Some notable types of liquidity voids are common, exhaustion, breakout, and runaway. Let’s take a look at them:
Common Liquidity Voids
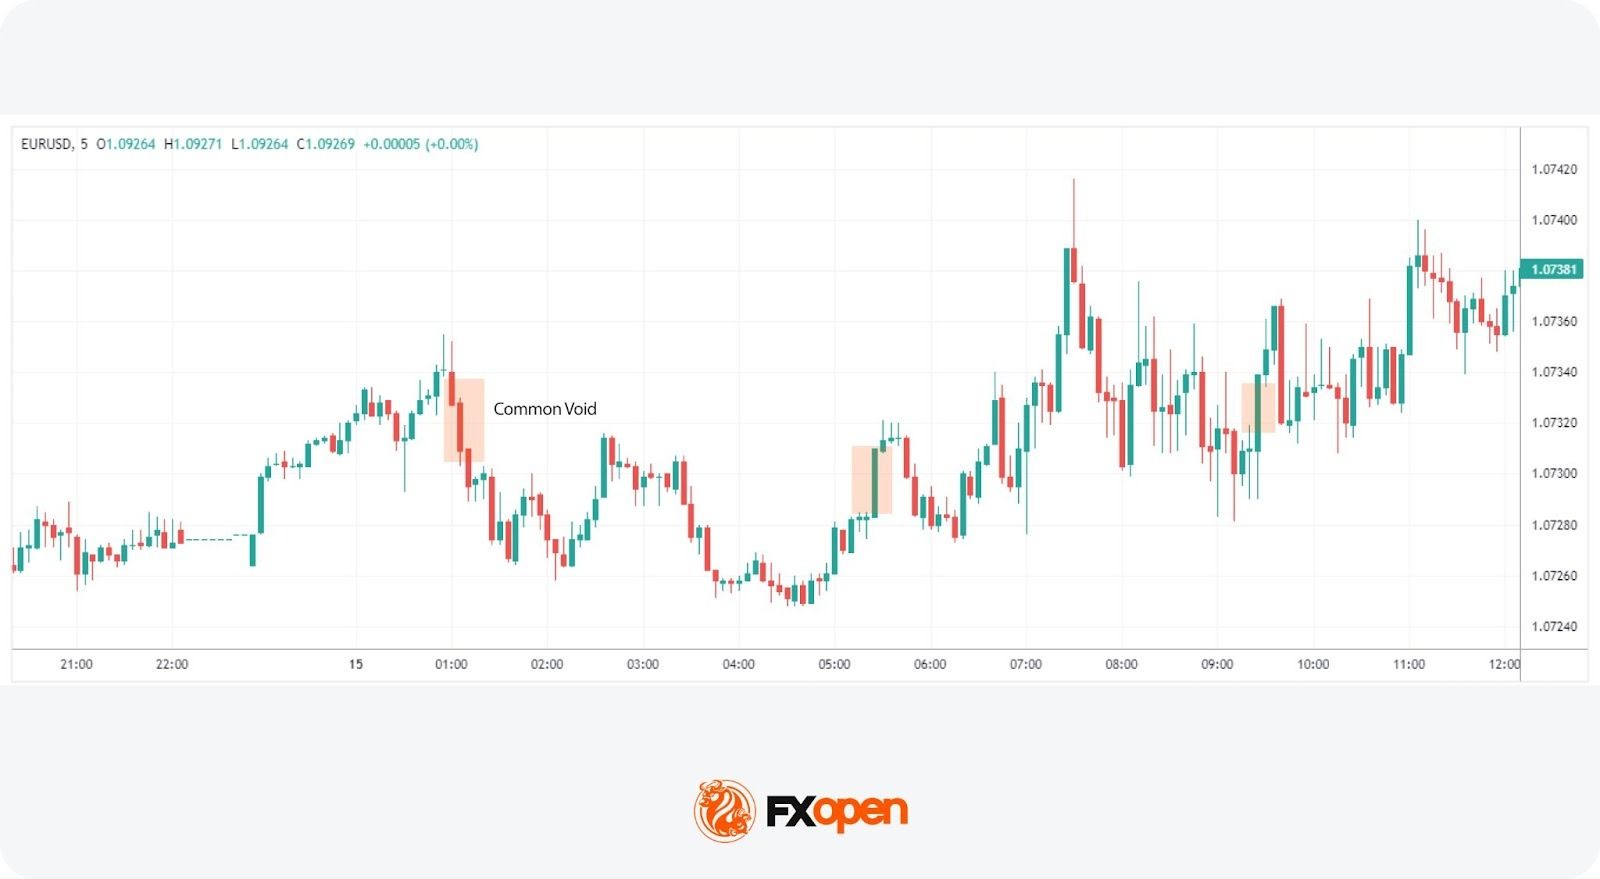
Common voids appear randomly across charts without any news or event trigger, forming from natural market ebb and flow. They don’t always carry significant analytical value but are still worth monitoring for risk management purposes.
Exhaustion Liquidity Voids
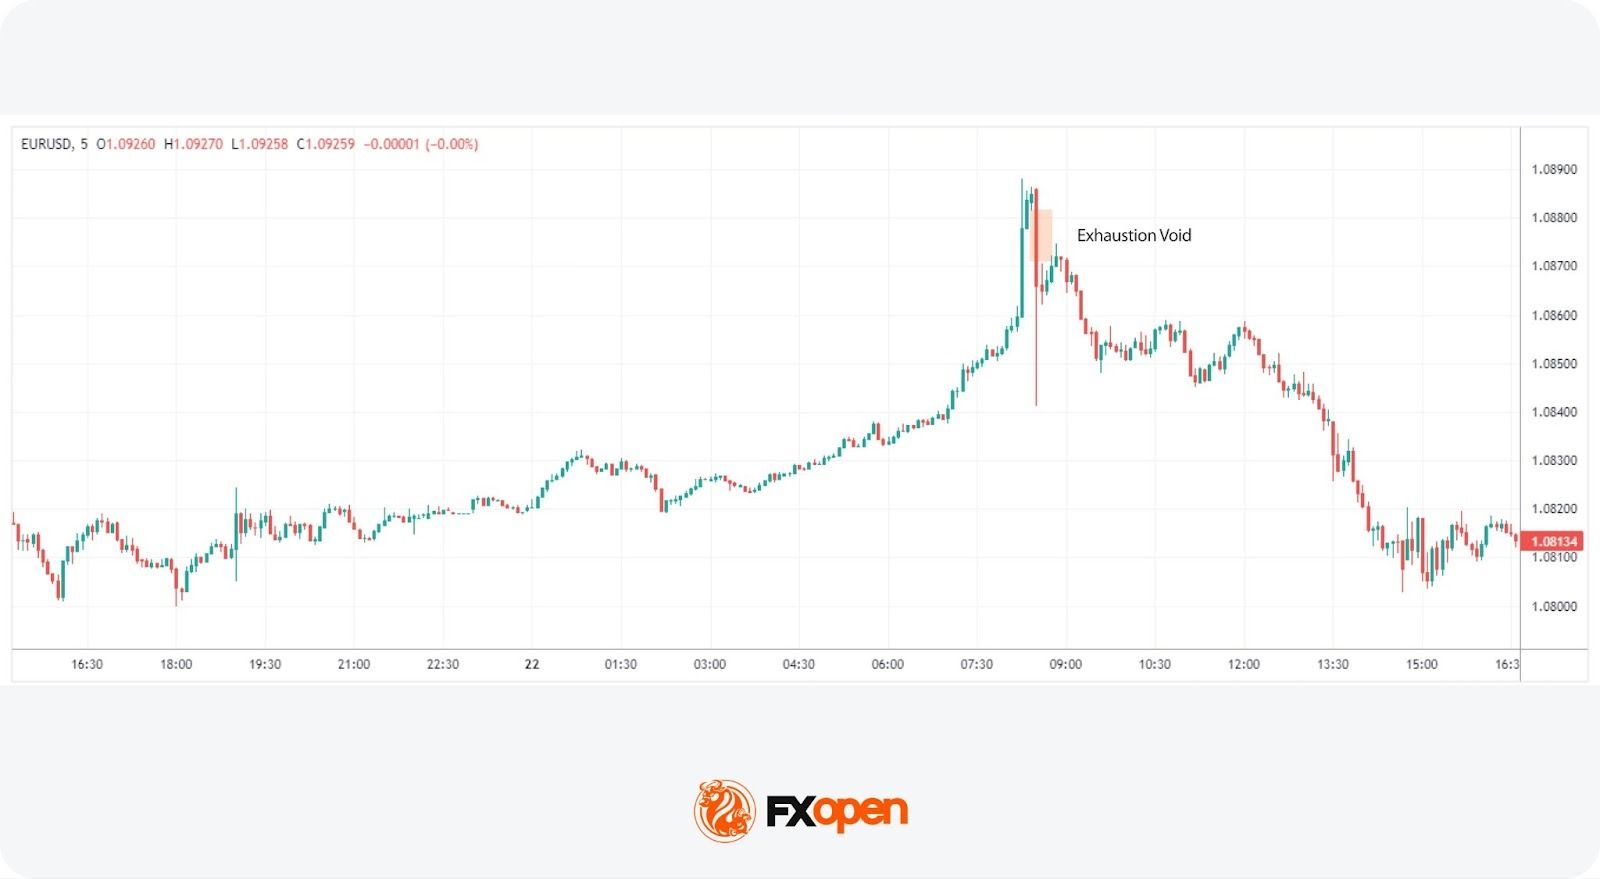
Exhaustion liquidity voids appear at the end of a trend when momentum fades and price makes a final push before reversing. Traders often watch for them as potential signals of a trend reversal.
Breakout Liquidity Voids
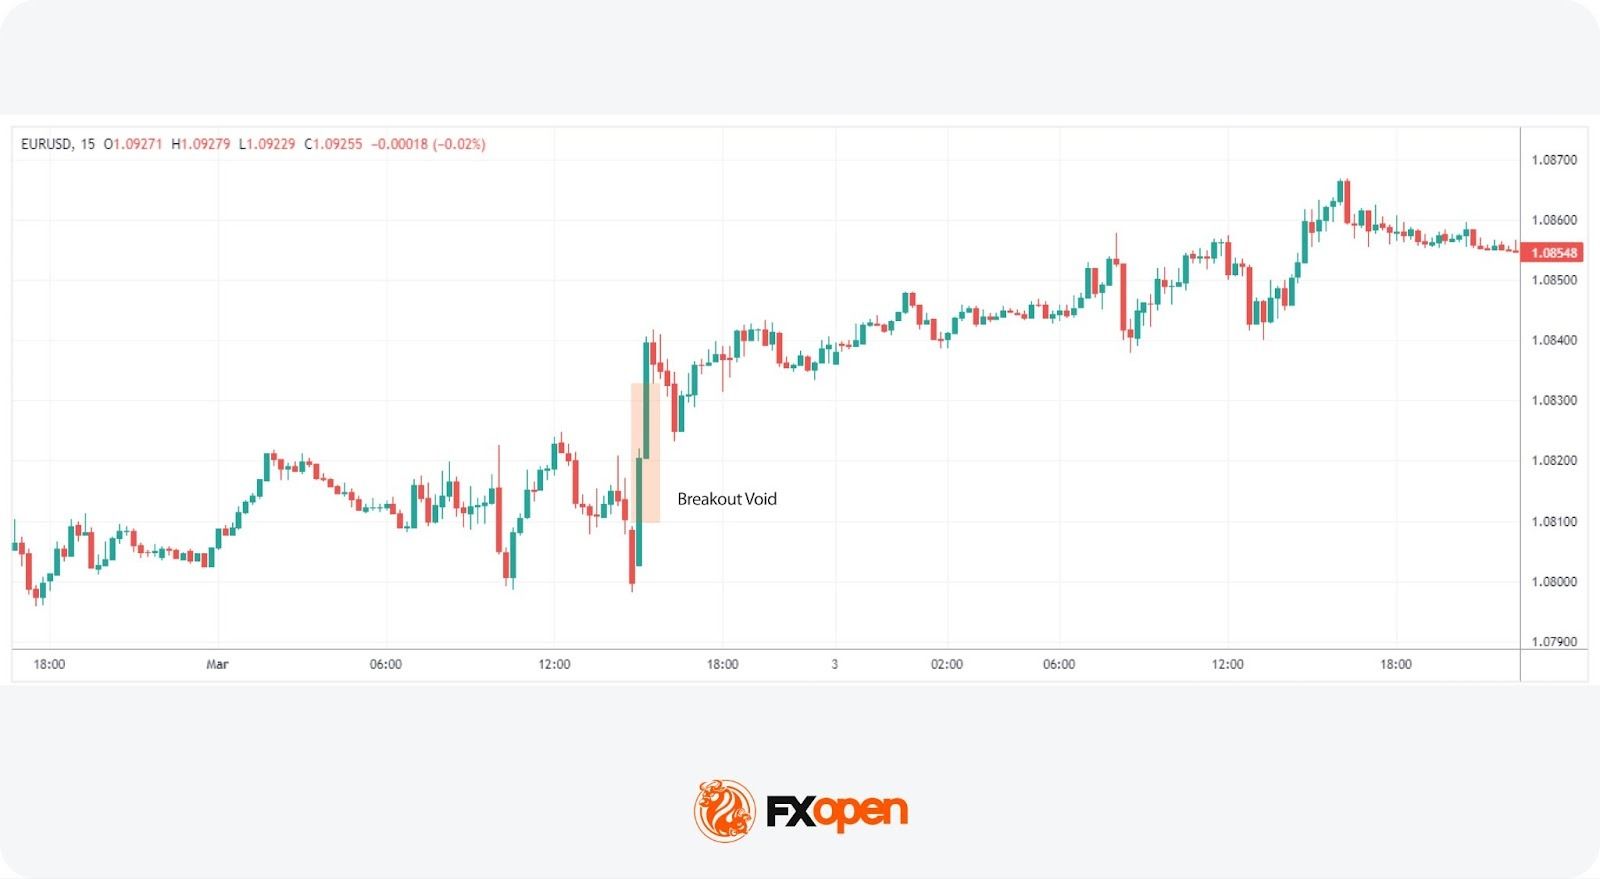
Breakout voids form when price breaks through a key support or resistance level with enough force to leave behind an imbalance. They often signal the beginning of a new trend.
Runaway Liquidity Voids
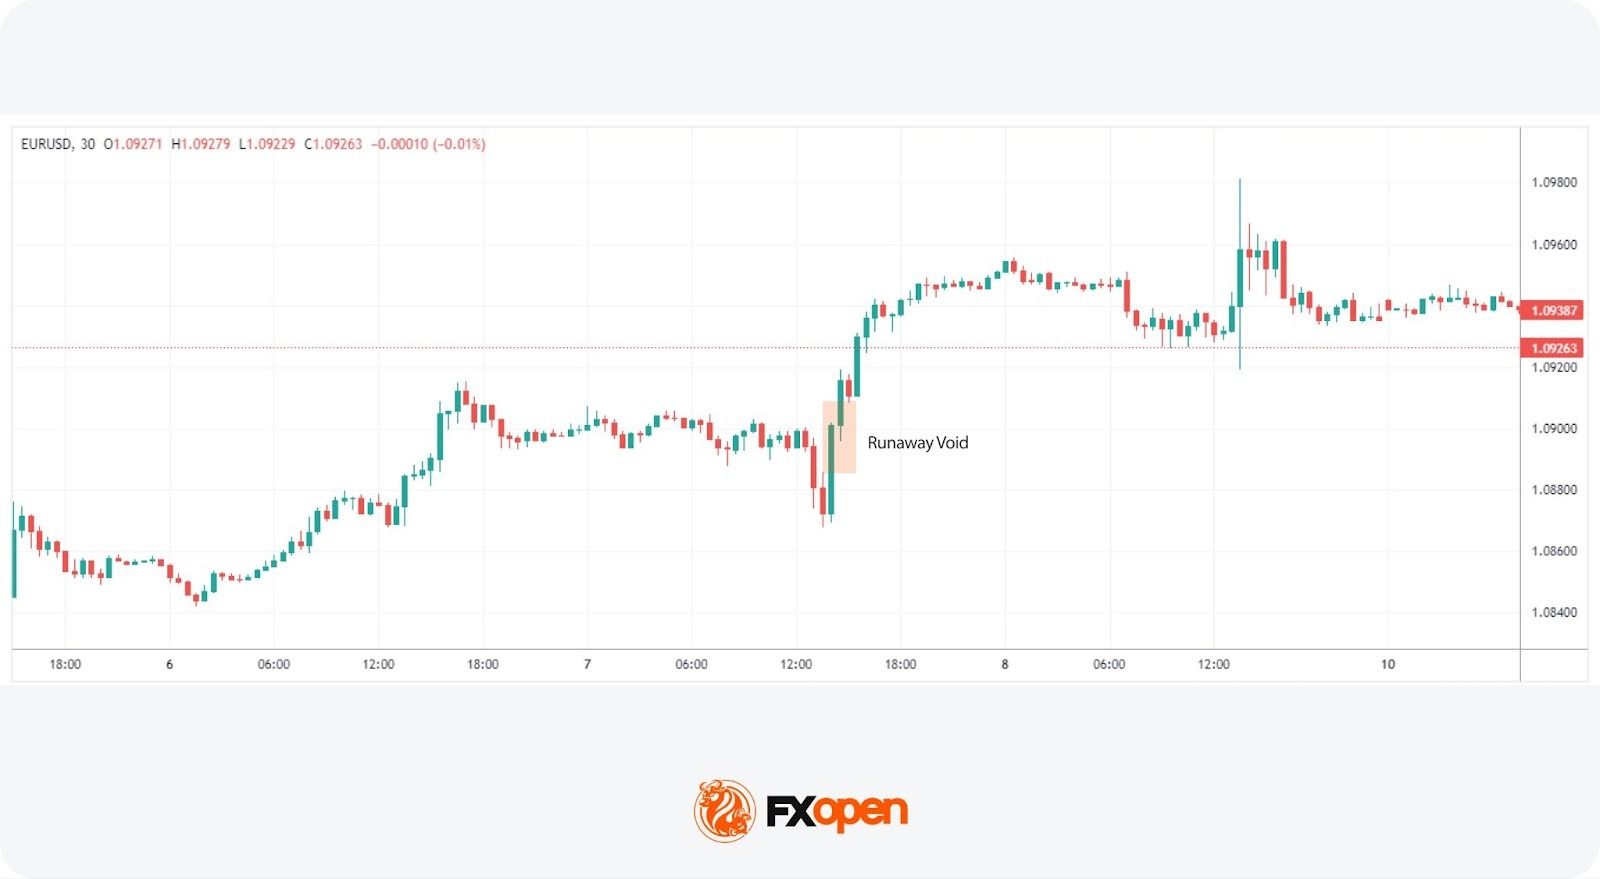
Runaway voids occur within an existing trend and signal its continuation. Price moves sharply in the trend’s direction, bypassing levels where liquidity would normally sit, which may support trend strength confirmation.
How Traders Use Liquidity Zones and Voids
Liquidity zones and voids form the basis of several common trading approaches. Here’s how traders typically work with them.
Step 1: Identify a Liquidity Zone
Traders start by locating areas where price has repeatedly reacted, such as support and resistance levels or high-volume nodes on a volume profile. These clusters of resting orders act as magnets for price.
Step 2: Wait for a Price Reaction
Rather than acting immediately, traders watch how price behaves when it reaches the zone. Does it stall? Reverse? Push straight through? The reaction tells the story.
Step 3: Look for Confirmation
A reaction alone isn’t enough. Traders look for confirmation through candlestick patterns (like pin bars or engulfing candles) or a shift in market structure, such as a break of a recent swing high or low.
Step 4: Target Nearby Liquidity or a Void
Once confirmed, traders typically set targets at the next liquidity zone or unfilled void. Voids act as areas price is likely to move toward, since they represent unfinished business on the chart.
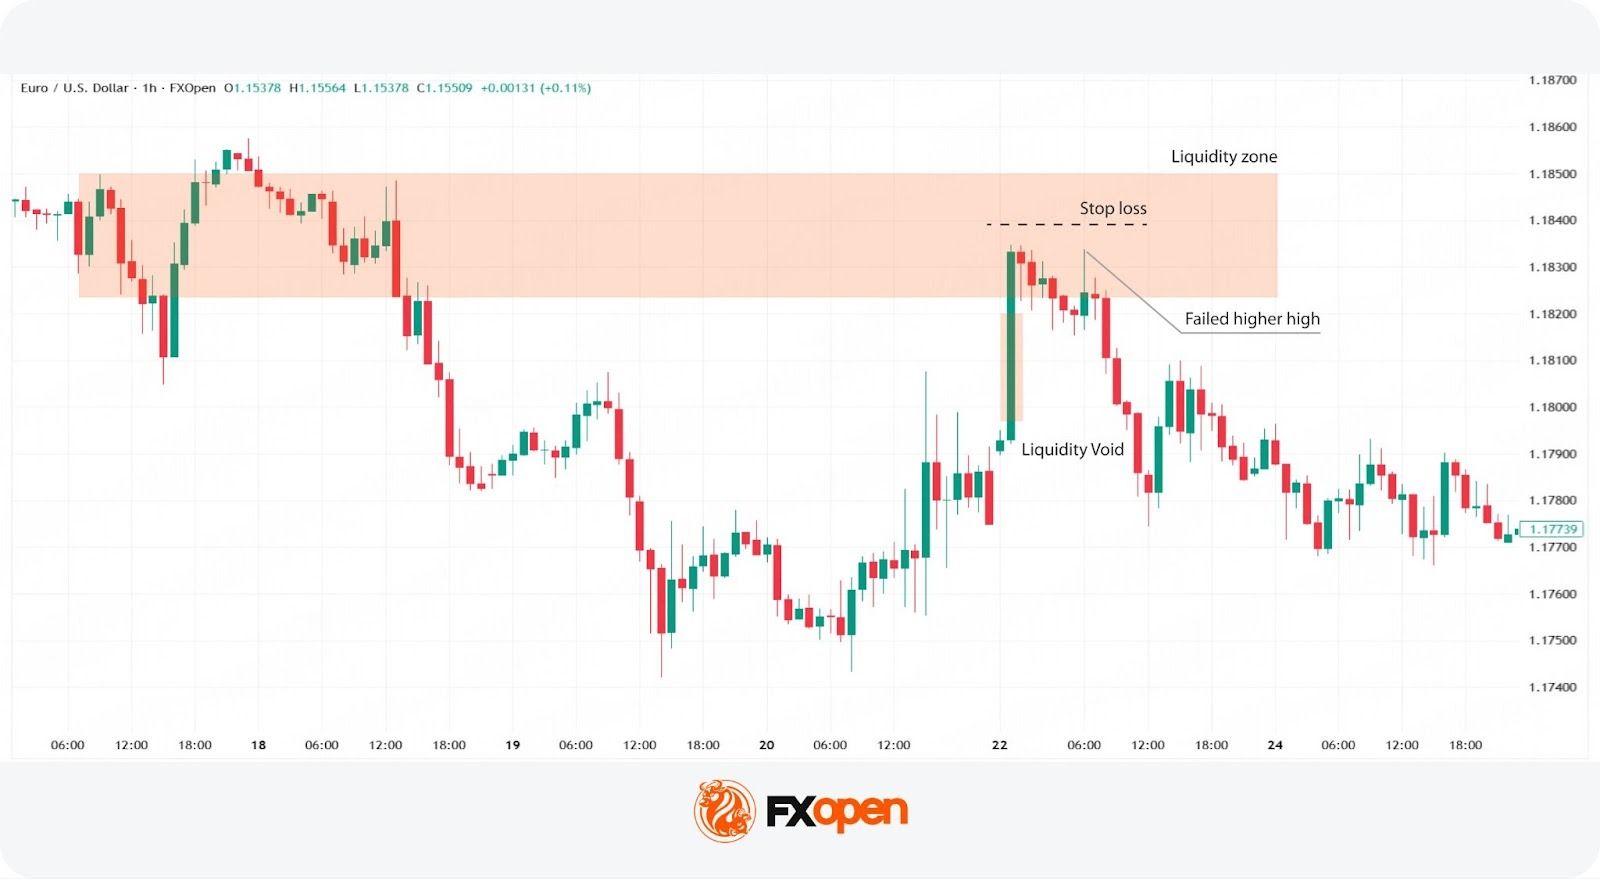
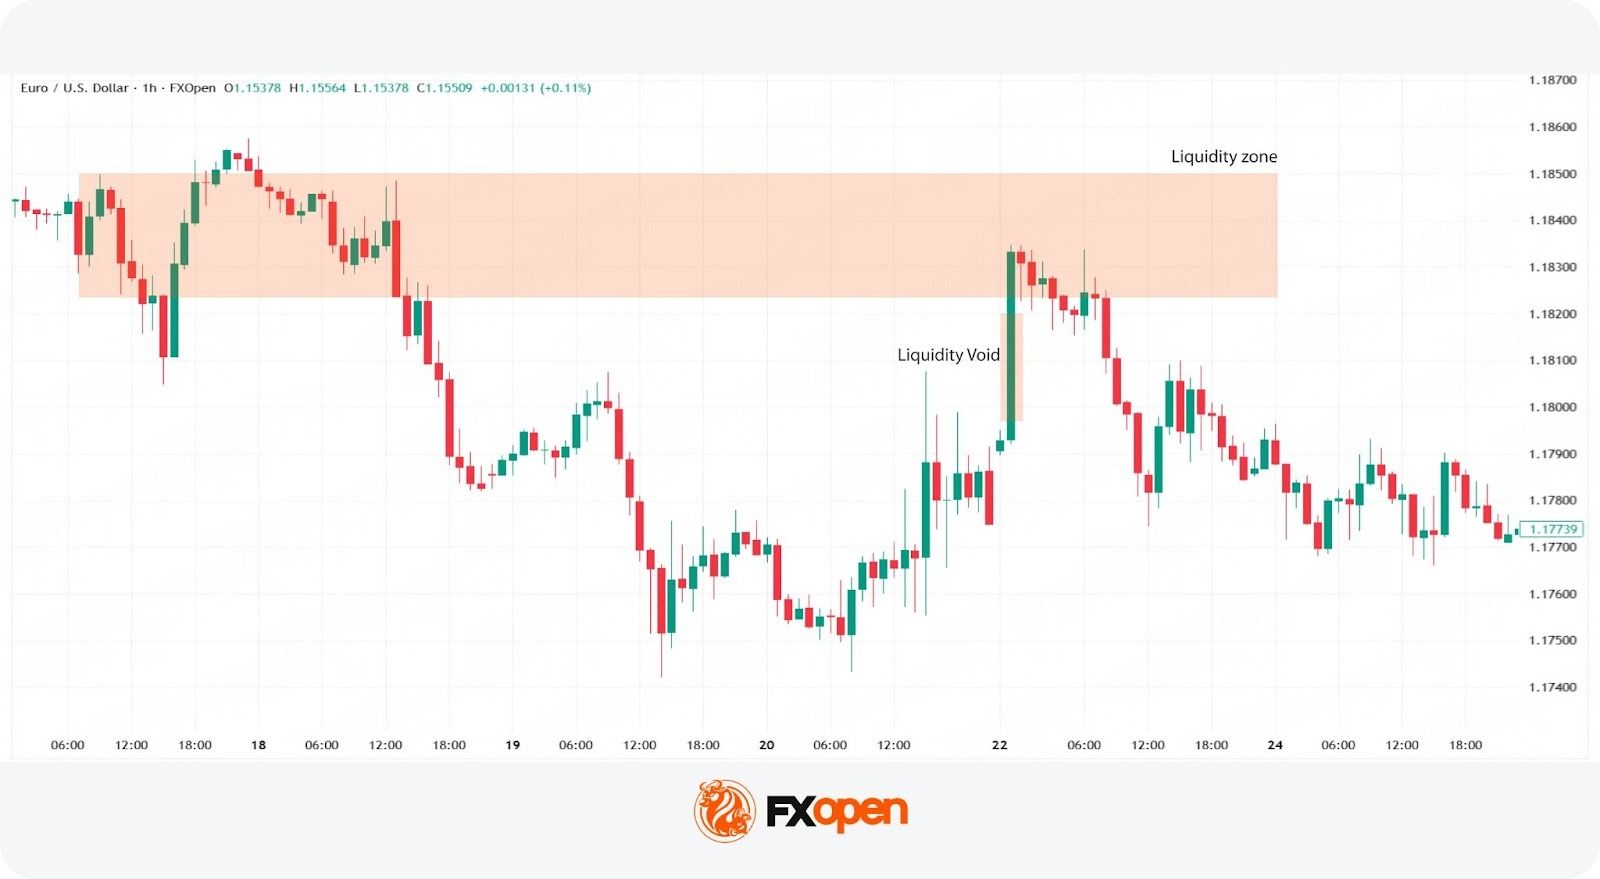
In this example, price moves into a liquidity zone, leaving a void behind it. Buyers attempt to push higher but fail, printing a long upper wick and signalling weakening momentum. Price then breaks below the established low and drops to fill the liquidity void left on the way up. A trader could have opened a sell position after the price broke below the low, set a stop-loss level above the nearest swing high, and closed the trade once the liquidity void was filled.
Limitations of Liquidity Zones and Voids
Understanding liquidity zones and voids provides traders with valuable insights into market dynamics, yet relying solely on these concepts comes with limitations. Here are some specific challenges to consider:
- Market Volatility: Market volatility can disrupt liquidity patterns, making historical levels less reliable.
- Influence of External Events: External events such as economic announcements can override expected behaviour.
- Timeframe Sensitivity: The relevance of zones and voids varies across timeframes, which may affect analysis.
- False Signals: These patterns can also produce false signals, leading to premature decisions.
The Bottom Line
Liquidity zones and voids may help explain how price moves within the forex market. They highlight areas of trading activity and imbalance, offering insight into potential price behaviour.
However, traders use them alongside other tools due to their limitations.
For traders seeking to apply these insights, opening an FXOpen account could provide a practical platform to explore and leverage the dynamics of liquidity in their trading across hundreds of tradable assets.
FAQs
What Are Liquidity Zones?
Liquidity zones are areas on a chart where buy and sell orders are concentrated, often acting as support or resistance. Traders monitor these levels to identify potential entry and exit points.
How Are Liquidity Zones Identified in Trading?
Liquidity zones are identified using tools such as volume profile, price consolidation, and historical support and resistance. These methods highlight areas where trading activity is concentrated.
How May Liquidity Zones Be Traded?
Liquidity zones are commonly used to identify potential entry and exit points. Traders monitor price reactions at these levels and may combine them with other tools to refine trading decisions.
What Are Liquidity Voids?
Liquidity voids are areas where price moves quickly due to low trading activity, creating an imbalance. Price often returns to these areas to “fill” the gap and restore market balance.
This article represents the opinion of the Companies operating under the FXOpen brand only. It is not to be construed as an offer, solicitation, or recommendation with respect to products and services provided by the Companies operating under the FXOpen brand, nor is it to be considered financial advice.


MARA Holdings (MARA) is scheduled to report first quarter earnings after the market close on May 11, with Wall Street analysts expecting the company to post losses on revenue and earnings (EPS) of $184.21 million and $2.34 respectively.
Results are expected to reflect the sharp decline in bitcoin prices during the first quarter, with BTC falling roughly 25% over the period, from roughly $87,000 to $67,000, creating significant mark-to-market losses on MARA’s digital asset holdings.
However, investor focus is likely to center less on short term bitcoin price volatility and more on the company’s strategic transition into artificial intelligence and high performance computing infrastructure. MARA has increasingly positioned itself as part of a broader industry shift in which bitcoin miners are leveraging their existing energy assets and data center expertise to secure more stable, long term AI-related revenue streams.
The AI transition includes FTAI Infrastructure agreeing to sell Long Ridge Energy to MARA in a $1.5 billion transaction. The deal is expected to provide MARA with long-term power-generation capacity and exposure to steadier cash flow opportunities tied to AI and data center contracts, reducing reliance on the highly cyclical bitcoin mining business, where revenues fluctuate with bitcoin prices, network difficulty, and transaction fees.
In the fourth quarter, MARA reported declining revenue of 6% year-over-year from $214 million to $206 million, though it also announced a partnership with Starwood to develop AI data centers delivering approximately one gigawatt of computing capacity in the near term.
During Q1, MARA sold 15,133 BTC, valued at approximately $1.1 billion, using proceeds to repurchase $1.0 billion of convertible notes, strengthen liquidity, and continue funding its AI expansion strategy.
The broader bitcoin mining sector is increasingly following a similar path. IREN (IREN) recently expanded its AI transition through a $3.4 billion AI cloud agreement with NVIDIA (NVDA), while also recording a $140.4 million non-cash impairment charge tied to the sale of ASIC mining hardware as it reallocates infrastructure toward AI cloud services.
In addition, HIVE Digital Technologies (HIVE) announced additional investments into AI and digital infrastructure, including $3.1 million to install high speed fiber infrastructure supporting a planned 50MW AI factory.
MARA shares rose 1% to $13 in pre-market trading.
BitMine Immersion Technologies chairman Tom Lee put a $22,000 Ethereum target on the table at a Miami event this week, with ETH trading at $2,280.70, a nearly 10x call from current levels.
The mechanism is a two-part thesis: ETH/BTC ratio reversion toward historical averages applied against a $250,000 Bitcoin fair value assumption, layered with a structural demand argument that AI agents will require on-chain settlement infrastructure that legacy banking cannot provide.
That combination, Lee argued publicly and on stage, makes Ethereum cheap right now.
The tension in the call is real. Every condition in that chain has to cooperate simultaneously. Bitcoin has to reach $250,000.
The ETH/BTC ratio has to recover toward its 2021 peak of 0.087 from its current 0.03. And AI-driven blockchain adoption has to materialize at a scale the market has not yet priced.
What follows is an examination of whether the data supports any of those assumptions – and which one is doing the heaviest lifting.
Discover: The best pre-launch token sales
The Math Behind the $22,000 Target Is Specific – and Demanding
Lee’s ratio math is straightforward. The ETH/BTC long-term average sits near 0.048. The 2021 cycle peak hit 0.087.
Applied to a $250,000 Bitcoin price Lee’s stated fair value, those ratios produce ETH targets of roughly $12,000 and $21,750, respectively.
The $22,000 figure is essentially the bull case of the bull case: peak ratio, peak BTC assumption, both arriving at the same time.

The AI-blockchain demand component is where Lee diverges from a pure ratio trade. His argument: AI agents operating autonomously in the global economy will need a payment layer that functions 24/7 without correspondent banking dependencies.
Ethereum’s uninterrupted uptime record and decentralized validator set make it the default candidate. Lee also cited stablecoin transaction volumes surpassing Visa’s annual throughput, a claim that holds up. Ethereum-based stablecoin volumes (USDC, USDT, DAI combined) ran approximately $220 trillion annualized in 2025, against Visa’s $12.2 trillion.
That data point is not speculative.
On supply, Lee’s position at BitMine adds direct context. The firm holds more than 4% of all circulating Ethereum and generates over $300 million annually from staking rewards, which places Lee’s bullish thesis in direct financial proximity to his institution’s balance sheet.
That conflict of interest is worth naming. It does not make the thesis wrong. It does mean the assumptions deserve scrutiny.
Discover: The best crypto to diversify your portfolio with
Where Ethereum Price Trades Now and What the Chart Needs to Do
ETH is sitting at $2,330 on the daily chart, and the macro picture here is a coin that peaked near $4,900 in August and has been in a downtrend for the better part of a year, shedding over 60% before finding a floor around $1,750 in February.
The recovery since that low has been the most sustained positive price action since the downtrend began, with price grinding higher lows from February through May and now sitting in the $2,300 to $2,400 zone which is a critical area.
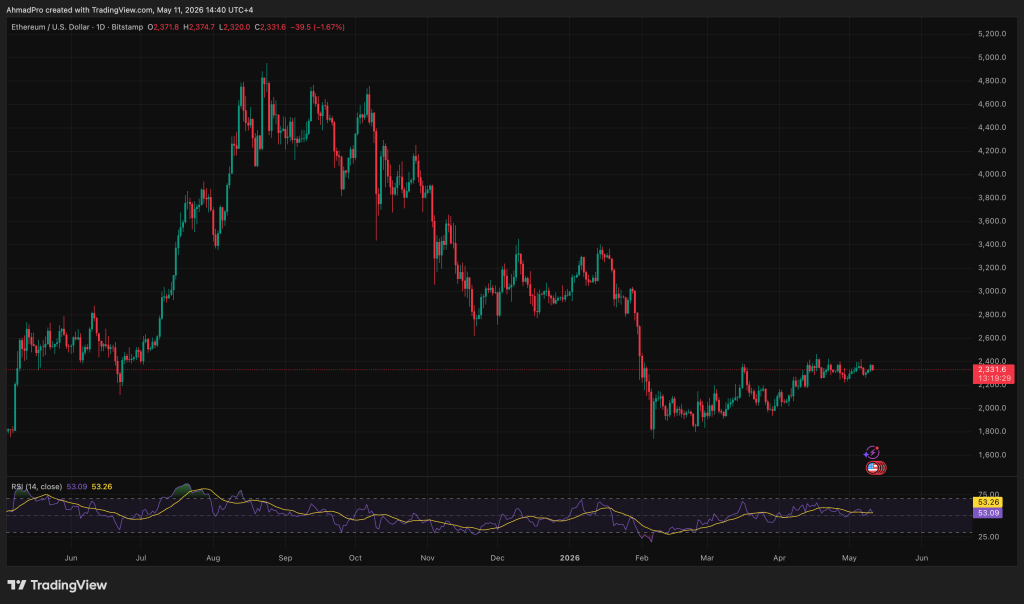
That $2,400 level is where the February breakdown accelerated from, making it the first major overhead supply zone that needs to flip before any meaningful recovery can develop, and price has been churning just below it for weeks without a clean break.
A daily close above $2,400 held over multiple sessions opens $2,800 first, then $3,000 and $3,400 as the next resistance clusters from the November and December distribution.
On the downside, $2,000 is the immediate floor that has held on every dip since March, and $1,750 is the absolute line that cannot break without the entire base structure collapsing.
The longer ETH spends consolidating below $2,400 without breaking down, the more pressure builds for an eventual resolution to the upside, but until that break happens, this remains a recovery inside a longer downtrend and not yet a confirmed reversal.
Discover: The best crypto to diversify your portfolio with
The post Tom Lee Floats $22,000 Ethereum Target: What Has to Be True? appeared first on Cryptonews.
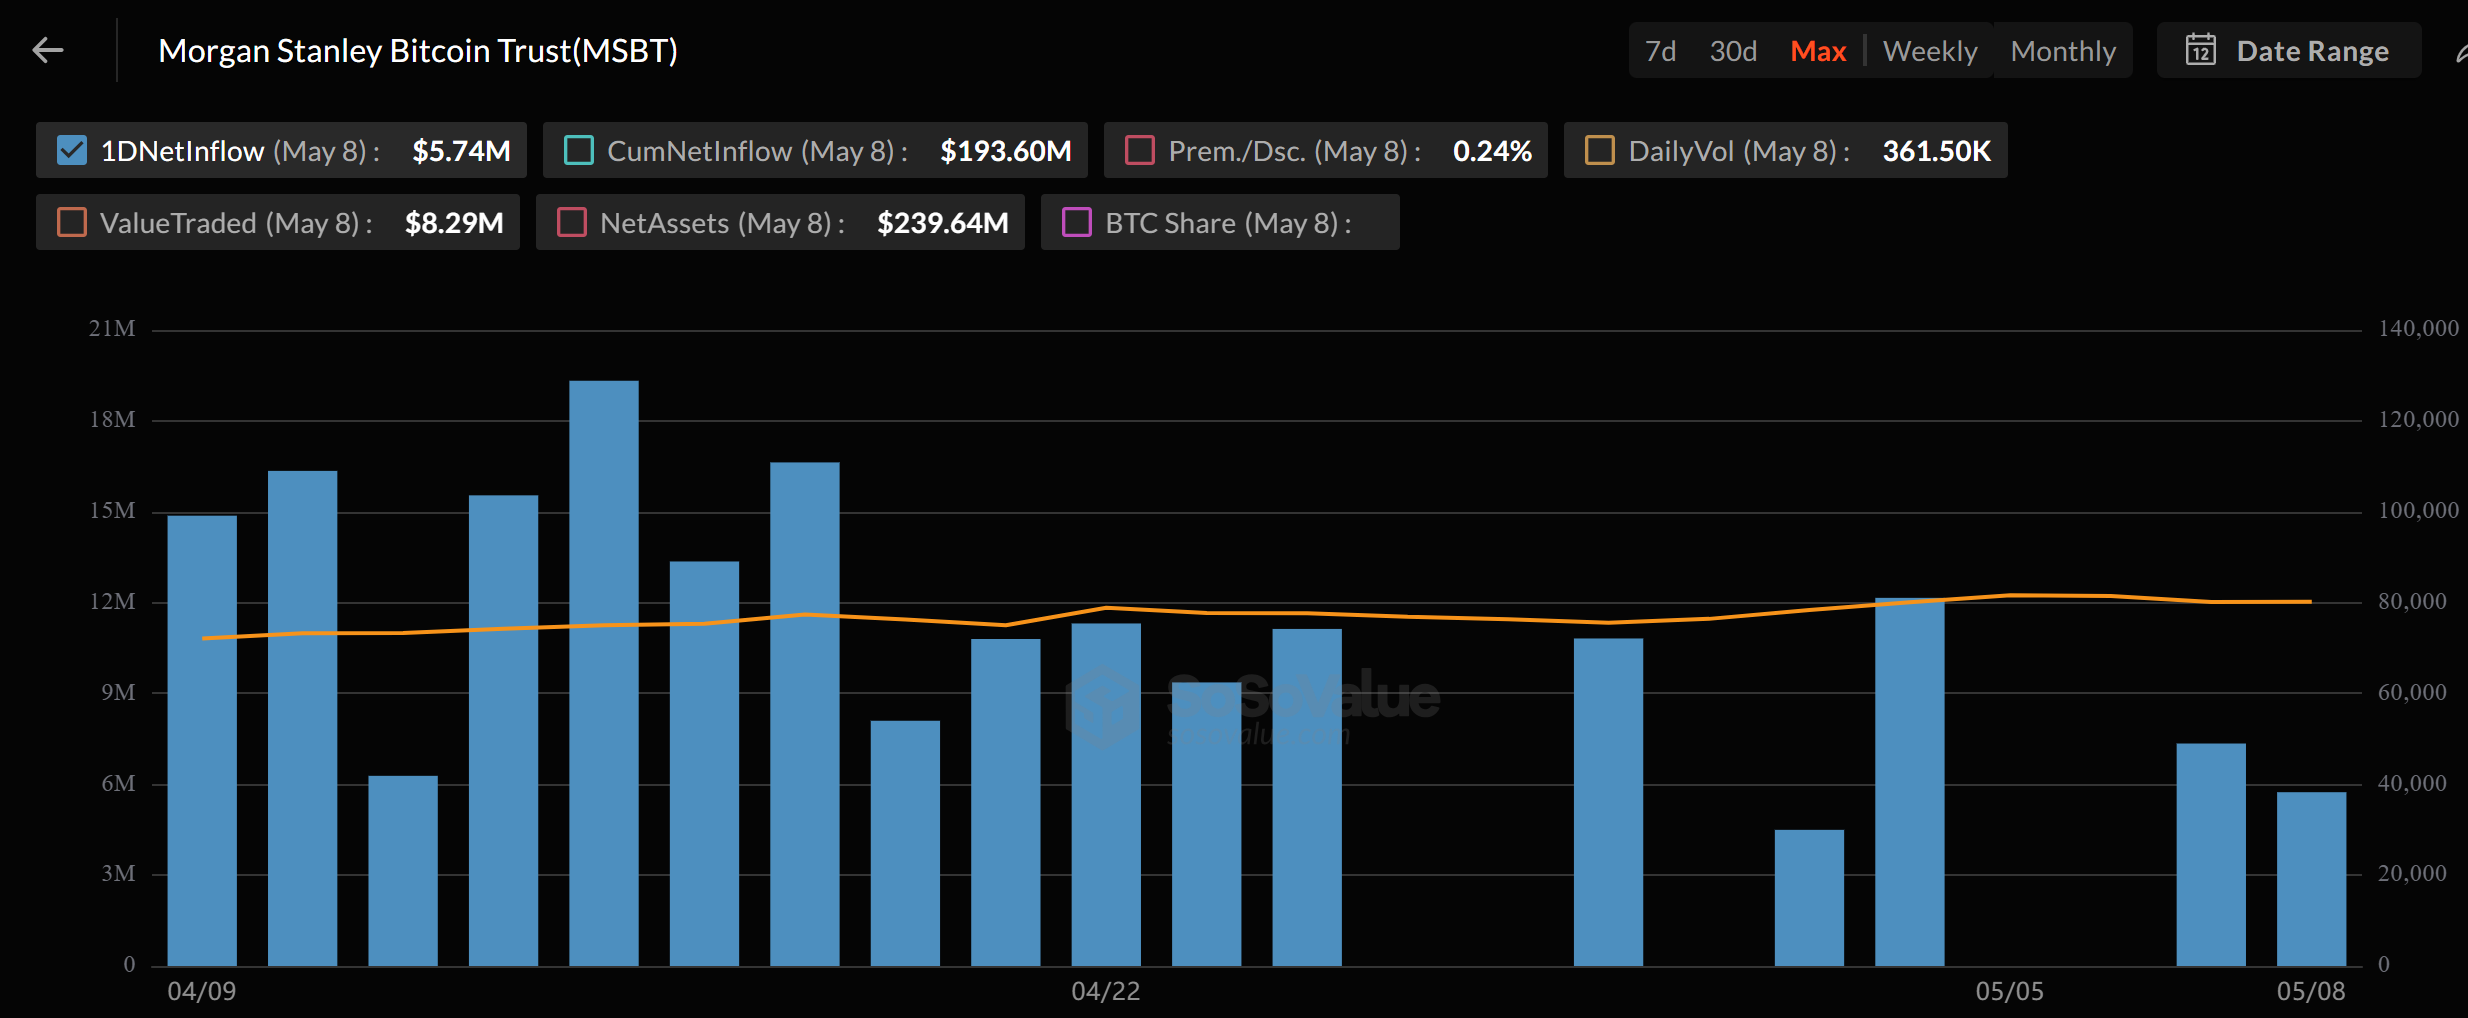
Morgan Stanley’s spot Bitcoin ETF cleared 30 days of trading without a single outflow day, drawing roughly $194 million while BlackRock, Fidelity, and ARK Invest all lost capital over the same stretch.
MSBT, which began trading April 8 on NYSE Arca, posted 17 inflow days and 5 flat sessions through May 8, lifting its asset base above $240 million.
How MSBT Outflanked Every Rival in Month One
SoSoValue data shows MSBT launched with $30.6 million in deposits and $34 million in trading volume on day one. Net inflows climbed to roughly $194 million by May 8, pushing the fund’s bitcoin holdings near 2,920 BTC.

Every other major spot Bitcoin ETF lost ground during the same window. Products from BlackRock, Fidelity, and ARK Invest each posted net outflows as BTC traded between the mid-$70,000s and low-$80,000s.
MSBT’s 0.14% fee, the cheapest in the category, helped insulate it from the rotation.
BlackRock’s IBIT set the 2024 benchmark with 71 inflow days after launch. Its first flat session arrived in April 2024, followed by a $36.9 million outflow on May 1.
MSBT now joins that pattern on a shorter, sharper scale.
Sticky Capital Signals Advisor-Led Allocation
Morgan Stanley’s roughly 16,000 advisors steward more than $9 trillion in client assets. That captive channel gives MSBT reach pure-play issuers cannot match.
The fee gap and in-house distribution help explain why the six-week sector tailwind landed disproportionately on the fund.
Whether MSBT can hold the streak as BTC volatility returns is the next test. The fund’s $240 million asset base sits far below IBIT’s scale.
Still, its first-month retention sets a new bar for late entrants in the spot ETF lineup.
The post Zero Outflows in 30 Days: How Morgan Stanley’s MSBT Outflanks Every ETF Rival appeared first on BeInCrypto.

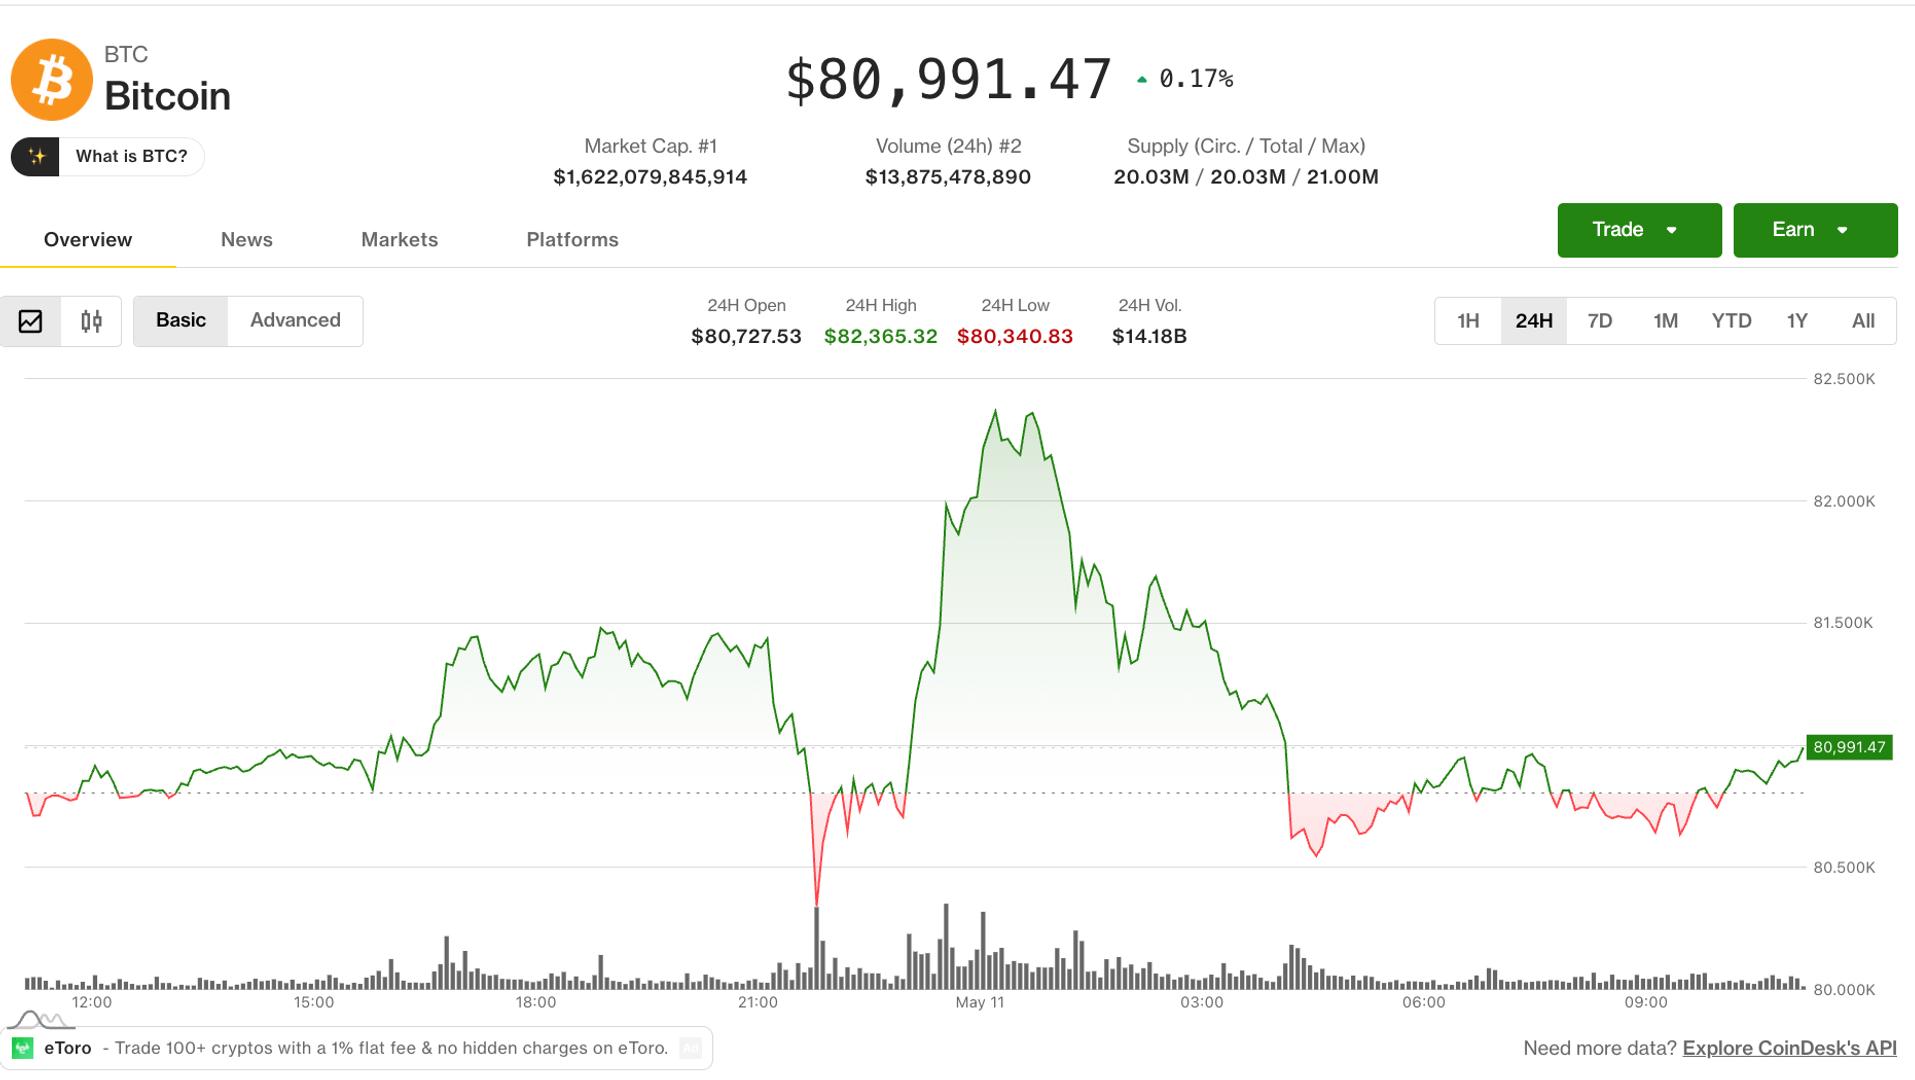
The crypto market started the week in a volatile mood, with bitcoin rising from $80,670 at 23:00 UTC on Sunday before topping out at $82,400 an hour later. The price subsequently dropped to trade in a fairly narrow range just beneath $81,000.
The move coincided with the weekly open of bitcoin futures on the CME and U.S. equity futures — a period that often sparks a frenzy of repositioning and a phenomenon called the “CME gap,” which occurs when the price opens at a different point to where it closed on Friday.
Due to the timing of the move, all crypto benchmarks are down on Monday with the broad CoinDesk 100 (CD100) leading the way at a 1.5% loss while the bitcoin-dominant CoinDesk 5 (CD5) dropping 0.6%.
Price action is also being dictated by geopolitical developments in Iran. U.S. President Donald Trump said Iran’s response to a peace proposal was “totally unacceptable,” leading to a rise in the price of oil and the dollar and a decline in risk assets.
Derivatives positioning
- The market-wide crypto futures open interest (OI) remains pinned just above $130 billion for the fourth straight day, pointing to a lack of fresh leverage inflows and broadly stalled momentum across the derivatives market.
- Centralized exchanges have liquidated over $400 million in leveraged futures bets, with shorts accounting for most of that amount.
- SUI’s OI has surged by 29%, validating the double-digit rise in the token’s price. This, coupled with positive funding rates and 24-hour OI-adjusted cumulative volume delta, points to growing demand for bullish exposure.
- DOGE and HBAR are other notable OI gainers, while BTC and ETH futures OI remains largely steady.
- OI in futures tied to the privacy-focused ZEC token has declined by 6%, a sign of capital outflows.
- Despite the U.S. CPI and PPI releases due later this week, the market remains calm, as evidenced by bitcoin’s 30-day implied volatility index, which is pinned near three-month lows.
- On Deribit, bitcoin calls at strikes, ranging from $81,000 to $86,000 dominate the volume rankings. Call options are inherently bullish plays on the underlying asset.
- Block flows featured bitcoin long call condors, a strategy initiated to profit from low volatility and minimal price movement in the underlying asset.
Token talk
- Venice’s VVV token more than doubled in the past month as traders reacted to a string of emissions cuts, token burns, new products and the growing demand for AI.
- The move started with supply. Venice doubled its subscription-linked burn rate in late April, with Pro, Pro+ and Max subscriptions on the platform now triggering $2, $5 and $10 VVV burns, respectively, according to VeniceStats data.
- Venice then cut annual emissions of the token, which can be used for privacy-focused artificial intelligence, from 6 million tokens to 5 million on May 1, the first step in a planned reduction to 3 million by July, according to the project.
- The rally accelerated after StrikeRobot, which develops AI software for robots, said Venice would become a primary inference API backend for its robotics products, starting with SR Agentic and SR Platform.
- Meanwhile, subscription revenue is rising. Co-founder Jesse Proudman said Monday that subscription and credit purchases hit a record, topping the prior high by 10%.
- VVV remains below its $22.5 January 2025 record. The token had fallen as much as 50% shortly after its debut amid insider-trading concerns tied to early purchases by Aerodrome Finance contributors.
Crypto World
Circle (CRCL) beats earnings estimates but misses on revenue amid $222 million Arc raise


Circle, issuer of the world’s second-largest stablecoin, USDC, posted estimate-beating first-quarter earnings as revenue rose 20% and it raised $222 million for its Arc blockchain network in a presale of the ARC token.
Earnings per share (EPS) of 21 cents beat analyst estimates of 17 cents, while revenue rose 20% to a less-than-forecast $694 million. Adjusted earnings before interest, taxes, depreciation and amortization (Ebitda) grew 24% from a year earlier to $151 million, the New York-based company reported.
USDC onchain transaction volume jumped over 260% from the year-earlier quarter to $21.5 trillion, and USDC in circulation increased 28% to $77 billion.
The ARC token presale values the project at $3 billion. The fundraising round included investment from a mix of Wall Street heavyweights and crypto-native firms, including BlackRock, Apollo Funds, a16z crypto, ARK Invest, CoinDesk’s parent company Bullish, Haun Ventures, Intercontinental Exchange and Standard Chartered Ventures.
The fundraising marks Circle’s most ambitious expansion beyond USDC and payments infrastructure, pushing the stablecoin issuer deeper into the race to build blockchain infrastructure for institutional finance.
Circle also published the Arc whitepaper on Monday, outlining ARC as a “native coordination asset” designed to support governance, validator security and network operations across the chain.
Arc, which began testing in October, is being positioned as a blockchain optimized for stablecoin-based capital markets and regulated financial activity, which includes tokenized assets, cross-border settlement and onchain finance.
Unlike USDC, which functions as a dollar-pegged payment token, ARC appears intended to play a role closer to ether (ETH) on Ethereum or SOL on Solana — helping coordinate the network’s economic and security model.
CRCL shares were nearly 1.2% higher at $115 in pre-market trading at around 7:30 a.m. ET.
UPDATE (May 11, 11:20 UTC): Adds Circle’s first-quarter earnings report information and restructures article to lead with earnings.
Crypto World
Wall Street giants are triggering a massive fee war that could crush crypto exchange margins


Immediately after Morgan Stanley announced it was rolling out E*Trade, charging a mere 50 basis points undercutting established rivals Coinbase, Robinhood and Schwab, Bloomberg analyst Eric Balchunas said “crypto exchanges should be scared.”
Others were less blunt, saying the Wall Street giant’s “isn’t entering crypto to complement Coinbase—it’s entering to replace it…”
The battle for cheap crypto trading resembles the trading fee race when spot ETFs launched in 2024, which saw providers begin high, offering 50 basis points before Morgan Stanley undercut them all with a 14 basis point offering.
In the long run, this means that trading crypto will be cheaper, where the clear winners will be retail traders, while crypto exchanges see their margins significantly trimmed, potentially affecting the likes of Coinbase, who recently cited financial issues as a reason for to reduce its workforce by 14%.
When announcing E*Trade, Jed Finn, Morgan Stanley’s head of wealth management, suggested the move was more about dominance than control. “This is much bigger than trading crypto at a cheaper rate.
“In a way, the strategy is disintermediating the disintermediators.” He added: “It’s going to be very competitive in the next couple of years,” explaining the move is aimed at ensuring its 8.6 million clients remain within its banking system instead of resorting to other platforms as the demand for crypto increases.
In his X post last week, Balchunas echoed Finn’s sentiment, framing the Wall Street giant’s move as a “SHOTS FIRED” moment. “Morgan Stanley is rolling out crypto trading on its E*Trade platform for 50bps per trade, undercutting Schwab’s 75bps (who undercut Coinbase).”
He said that based on his knowledge of how Schwab works, it will “likely won’t let this stand. Others will probably undercut too.” He also said that “by the time the dust settles it’ll be pretty dirt cheap to trade crypto everywhere.” Before concluding by saying “this is why (traditional financial) TradFi is no joke and crypto exchanges should be scared.”
However, crypto-native leaders rebuffed the “doom and gloom” narrative as U.S.-centric.
“While we respect Eric Balchunas’s insights on TradFi’s push into crypto, the perspective feels somewhat localized to the U.S. market and oversimplified for quick engagements on X,” said Kevin Lee, chief business officer at Gate, which ranks seventh on Coingecko with a 24 hour volume of nearly $2 billion.
Lee also told CoinDesk that Balchunas’ comments do not “fully capture the mature, global evolution of the crypto industry.”
The Gate CBO explained that the recent moves by the Wall Street giants to cut spot trading fees reflects the ongoing reduction of commissions that is normal to see when competition intensifies.
“This mirrors long-established patterns in equities markets, where fierce competition naturally compresses fees,” Lee said. “Smart platforms moved on long ago from fee-only models to diversified revenue streams including staking, structured products, institutional services, and ecosystem growth.”
Georgii Verbitskii, derivatives trader and founder of TYMIO, a non-custodial decentralized finance (DeFI) protocol, told CoinDesk he believes Morgan Stanley’s move into crypto trading is a good sign.
“This is clearly positive for crypto adoption overall,” Verbitskii said. “Morgan Stanley bringing crypto trading to millions of brokerage users is another sign that digital assets are becoming part of mainstream investment infrastructure, although the 50 bps fee itself is not especially competitive.”
Keneabasi Umoren, a crypto market analyst and Web3 researcher, recently told CoinDesk, he does not believe Wall Street will “kill exchanges, but it will squeeze U.S. spot-trading and custody revenue and push exchanges further into derivatives, DeFi and global markets.”


Anchorage Digital, the first federally chartered crypto bank in the U.S., says it will take a back seat to the Global Dollar stablecoin (USDG) consortium, which includes Robinhood and Kraken.
USDG, which has a circulating supply of around $3 billion, is issued by Paxos Digital Singapore and supervised by the Monetary Authority of Singapore. Other members include Galaxy Digital, OKX, Visa, Worldpay and Bullish (the owner of CoinDesk).
“We’re still supportive of it, and want to see it succeed, and are still part of the thing,” said Anchorage Digital co-founder and CEO Nathan McCauley in an interview. “But maybe not as up-front of a role as before.”
McCauley said that previously, Anchorage might have been boosting USDG specifically, but now the firm will take a more neutral approach. “I think one of the things you’re gonna see from us is increased neutrality on the stablecoins. It just makes sense to be neutral and not specifically be pushing any one stablecoin.”
Anchorage recently mentioned as many as 20 banks and tech giants are currently looking to issue stablecoins with the San Francisco-based custody firm. In April, Anchorage said it would partner with stablecoin issuance platform M0, which works with MetaMask and Bridge.
“With us becoming a white-label stablecoin issuer for so many different groups, you start to think about what’s the incentive structure, and is everything still aligned,” McCauley said.
Paxos did not respond to requests for comment by press time.

Michael Saylor’s business intelligence software giant, which turned into a massive bitcoin buyer, missed the mark last week but promised to return with more BTC accumulation.
It made it official minutes ago, announcing the latest substantial acquisition of 535 BTC for $43 million. The total stash has grown to 818,869 BTC, acquired for almost $62 billion.
It’s worth noting that Strategy’s position has turned green as the average acquisition price stands at $75,540, and its holdings’ current value is up to over $66 billion as of press time.
Strategy has acquired 535 BTC for ~$43.0 million at ~$80,340 per bitcoin and has achieved BTC Yield of 9.4% YTD 2026. As of 5/10/2026, we hodl 818,869 $BTC acquired for ~$61.86 billion at ~$75,540 per bitcoin. $MSTR $STRC https://t.co/qScHXi2BBJ
— Michael Saylor (@saylor) May 11, 2026
Today’s announcement comes shortly after Strategy’s Q1 results from last week, which outlined a substantial $12.5 billion loss mostly due to bitcoin’s declining price in that period.
Separately, the firm’s former CEO and co-founder, Michael Saylor, attracted some controversy earlier this month when he hinted that Strategy could sell some BTC to cover operational costs or pay dividends to shareholders.
It was a bit of a surprise for most investors as he had previously sworn not to sell any BTC. The topic went viral, and many industry participants weighed in. Some, such as Samson Mow, believe Strategy has the right to sell to fulfill its obligations to investors.
Agne Linge, Advisor to the Board at Wefi, told CryptoPotato that if Saylor and his company decide to sell, it would be a “calculated decision” rather than issuing new shares to fund dividend payments.
“I think the market for Bitcoin is rather mature, considering the players that are involved now- institutionals, seasoned long-term traders, therefore they understand that Mr. Saylor is running strategies for his corporation,” Linge added.
The post Strategy’s Bitcoin Buying Spree Resumes With Fresh 535 BTC Accumulation appeared first on CryptoPotato.
Sui’s native cryptocurrency has outperformed all top 10 digital assets over the past week after its valuation surged by double digits.
While optimism is running high on crypto X that the uptrend is far from over, some technical indicators suggest that a downside move could also be approaching.
What Sparked the Rally?
Several hours ago, SUI briefly pushed above $1.40, marking its highest level since January. The bears, though, quickly stepped in and trimmed part of the gains, bringing the price back to around $1.27 – still an impressive 35% jump on the week. SUI’s market capitalization surged past the $5 billion milestone, making it the 23rd-biggest cryptocurrency.
The main catalyst behind the upswing seems to be Sui Group Holdings’ decision to stake 108.7 million SUI tokens (worth over $140 million), thus removing almost 3% of the coin’s circulating supply from the market.
The analytics platform Santiment Intelligence added two more factors that could have also positively impacted the valuation. The first is the upcoming launch of CME Group SUI futures (scheduled for May 29) and the partnership with Paga, which focuses on cross-border African payments.
Paga is a leading settlement platform that allows millions of people to send, receive, and manage money across Africa. The collaboration with Sui aims to bring the Sui Dollar (USDsui) to the continent, giving users access to faster, cheaper, and more reliable digital payments.
Numerous analysts believe the asset’s valuation may reach new peaks soon. X user OxNeena noted the “massive breakout attempt” on the daily chart, envisioning an explosion above $2.50 should the price make a “clean flip” of the $1.30 zone.
For their part, CoinForge said they dismiss 98% of altcoins, but SUI isn’t among those. They argued that the asset’s price trajectory repeats the pattern seen last cycle, suggesting it could be gearing up for a major bull run in the coming months.
The Pre-Correction Signs
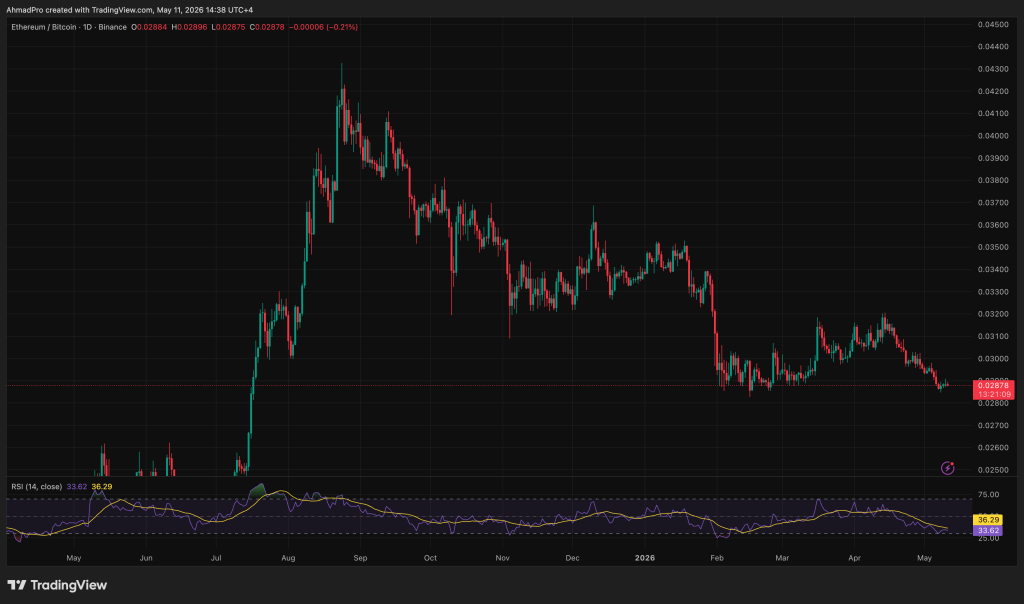
Contrary to the prevailing optimism among market observers, SUI’s Relative Strength Index (RSI) suggests a pullback may be the next move in the short term. The technical analysis tool measures the speed and magnitude of recent price changes and is used by traders to spot potential price reversal points.
It ranges from 0 to 100, where anything above 70 signals that the valuation has risen too much in a short period, which could be a precursor to a cool-off. Conversely, ratios below 30 hint that the asset is oversold and could be on the verge of a pump. Currently, SUI’s RSI stands at nearly 75.

In the meantime, exchange inflows have outpaced outflows over the past few days, indicating that investors have abandoned self-custody in favor of centralized platforms. This, in turn, increases the immediate selling pressure.

The post Sui (SUI) Soars 35% Weekly: What Fueled the Pump and What’s Next? appeared first on CryptoPotato.
The top 3 meme coins on the weekly radar split into very different technical paths. BUILDon (B) extends a breakout, MemeCore (M) loses key support, and Siren (SIREN) coils below a descending trendline that has capped price since March.
Daily charts show BUILDon pressing the 0.618 Fibonacci level at $0.48, MemeCore correcting toward $3.27 after rejection near $4, and SIREN testing the 0.786 Fibonacci retracement at $1.07 with expanding volatility.
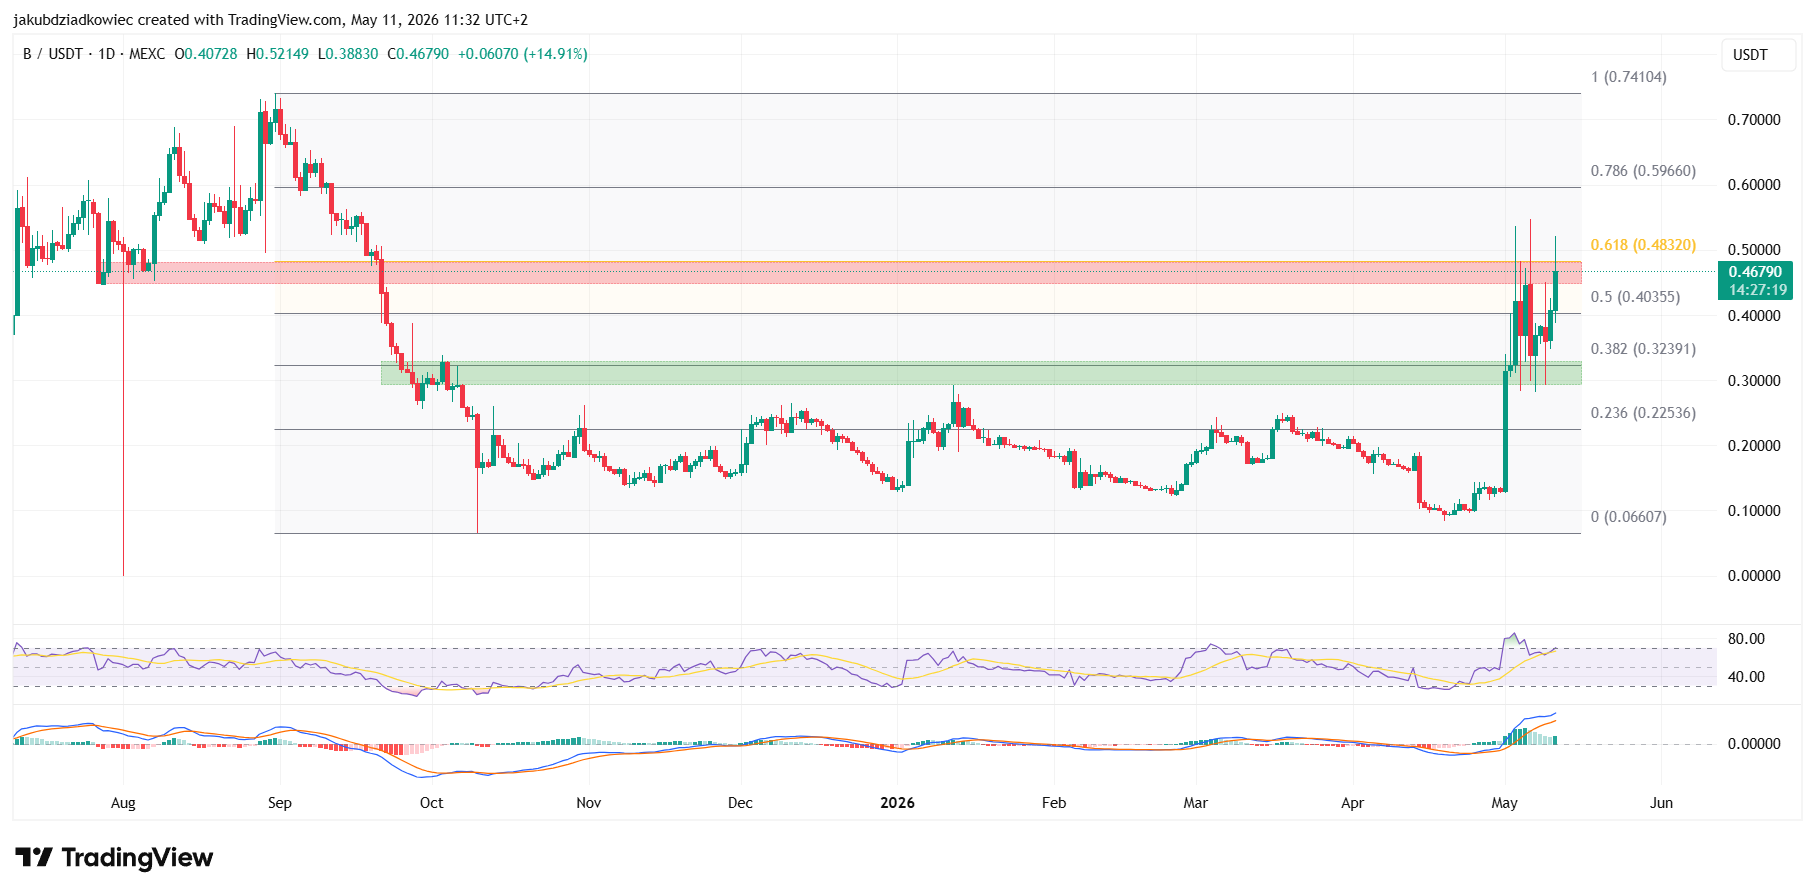
BUILDon (B) Bulls Press the $0.48 Resistance for a Third Time
BUILDon trades close to $0.4679 after a 14.91% daily gain, with intraday highs near $0.52 and lows at $0.38. The coin spent months inside a wide accumulation zone between $0.09 and $0.30 that reached back to September 2025.
Price broke out of that range on May 1 and confirmed the 0.382 Fibonacci retracement at $0.32 as fresh support. However, the 0.618 level at $0.48 has rejected B on three separate attempts so far in May.

The Relative Strength Index (RSI) sits close to 70, deep inside bullish territory. Meanwhile, the Moving Average Convergence Divergence (MACD) prints another taller green histogram bar after a short pause, which signals renewed upside momentum.
A confirmed daily close above $0.48 would open a path toward the 0.786 Fibonacci level near $0.60. Failure to clear that resistance could send the price back toward the $0.32 support shelf.
MemeCore (M) Slides Back After Losing Curved Support
In contrast to BUILDon, MemeCore trades at $3.27 after a 1.24% daily drop and shows clear technical weakness. The price action lost its exponential support curve at the end of April, which ended a steady advance that had held since February 1.
After that breakdown, M corrected to the 0.618 Fibonacci retracement at $2.59 before bouncing higher. The recovery retested the broken curve as resistance on May 7, then stalled around $4 at the 0.236 Fibonacci level.

The MACD now prints taller red histogram bars, which point to expanding bearish momentum. The RSI hovers in the neutral zone but trends lower, which warns that selling pressure has not yet been absorbed.
A second visit to $2.59 remains the base case if the current pullback continues. On the upside, bulls would need to reclaim $4 to invalidate the bearish setup, with the prior high near $4.85 the next major hurdle.
Siren (SIREN) Coils Under the Trendline as Volatility Returns
Siren offers a different setup again, with price compressing under a descending trendline that goes back to March 23. The line was confirmed as resistance on April 17 and tested once more on May 9.
SIREN currently trades at $1.17, close to the 0.786 Fibonacci retracement at $1.07, which has acted as a near-term magnet. Volatility, measured by the Bollinger Band Width Percentile (BBWP), recently sat at very low readings consistent with a contraction phase.

However, from May 6 through May 8, price activity began to expand again, with volatility ticking higher even though readings have not yet reached extreme zones. The RSI sits near 60 and slopes upward, which reinforces the building momentum.
A breakout above the trendline would extend gains toward the 0.618 Fibonacci retracement at $1.85 and then $2.40. The long-term support sits near $0.75, and a daily loss of $1.07 would put that floor back in play.
The post Top 3 Meme Coins to Watch This Week as BUILDon Targets $0.60 Breakout appeared first on BeInCrypto.

MARA’s AI expansion takes center stage ahead of Q1 earnings

Dozens Of Labour M Ps Urge Starmer To Quit

Aberdeen’s Jack Milne alleged racist abuse towards Jeremy Bokila ‘not proven’
Manchester United reach agreement with Casemiro over contract clause amid transfer speculation

US brings back mandatory military draft registration

Steven Gerrard disagrees with Gary Neville over ‘shock’ Chelsea and Arsenal claim | Football


-
 Crypto World3 days ago
HarrisX Poll Found 52% of Registered Voters Support the CLARITY Act
-

 Fashion3 days ago
Weekend Open Thread: Marianne Dress
-

 Crypto World4 days ago
Upbit adds B3 Korean won pair as Base token gains Korea access
-

 Tech7 days ago
Image AI models now drive app growth, beating chatbot upgrades
-
 NewsBeat4 days ago
NCP car park operator enters administration putting 340 UK sites at risk of closure
-

 Tech1 day ago
Auto Enthusiast Carves Functional Two-Stroke Engine from Solid Metal
-

 Politics2 days ago
Politics Home Article | Starmer Enters The Danger Zone
-
 Business2 days ago
Ignore market noise, India’s long-term story intact, say D-Street bulls Ramesh Damani and Sunil Singhania
-

 Crypto World6 days ago
UAE Free Zone Deploys Blockchain IDs to Verify Registered Firms
-

 Tech11 hours ago
GM Agrees To Pay $12.75 Million To Settle California Lawsuit Over Misuse Of Customers’ Driving Data
-

 Crypto World5 days ago
BlackRock CEO Larry Fink Discusses a New Asset Class
-

 Crypto World5 days ago
Robinhood says Wall Street is building onchain
-
Entertainment7 days ago
Serena Williams hits Met Gala in metallic dress after GLP-1 reveal
-

 Tech6 days ago
Apple and Samsung are dominating smartphone sales so thoroughly that only one other company makes the top 10
-

 Tech6 days ago
I tested the Xiaomi 17 Ultra’s camera and I don’t think I’ll ever go back to an iPhone
-

 Fashion5 days ago
The Best Work Pants for Women in 2026
-
 Sports7 days ago
Everton v Man City LIVE: Haaland’s two-word response as visitors collapse to hand Arsenal advantage in Premier League title race
-

 Politics6 days ago
Met Gala 2026: Madonna’s Dramatic Red Carpet Look Steals The Show
-
 Tech4 days ago
AI agents are missing all the discussions your team is having. SageOX has an answer: agentic context infrastructure
-
Crypto World4 days ago
The FOMO Is Back: Why Bitcoin’s Latest Rally Has Analysts Flashing Warning Signs
You must be logged in to post a comment Login