

Crypto World
Solana (SOL) Price Analysis: Can Bulls Push Toward $102? Technical Breakdown
Key Takeaways
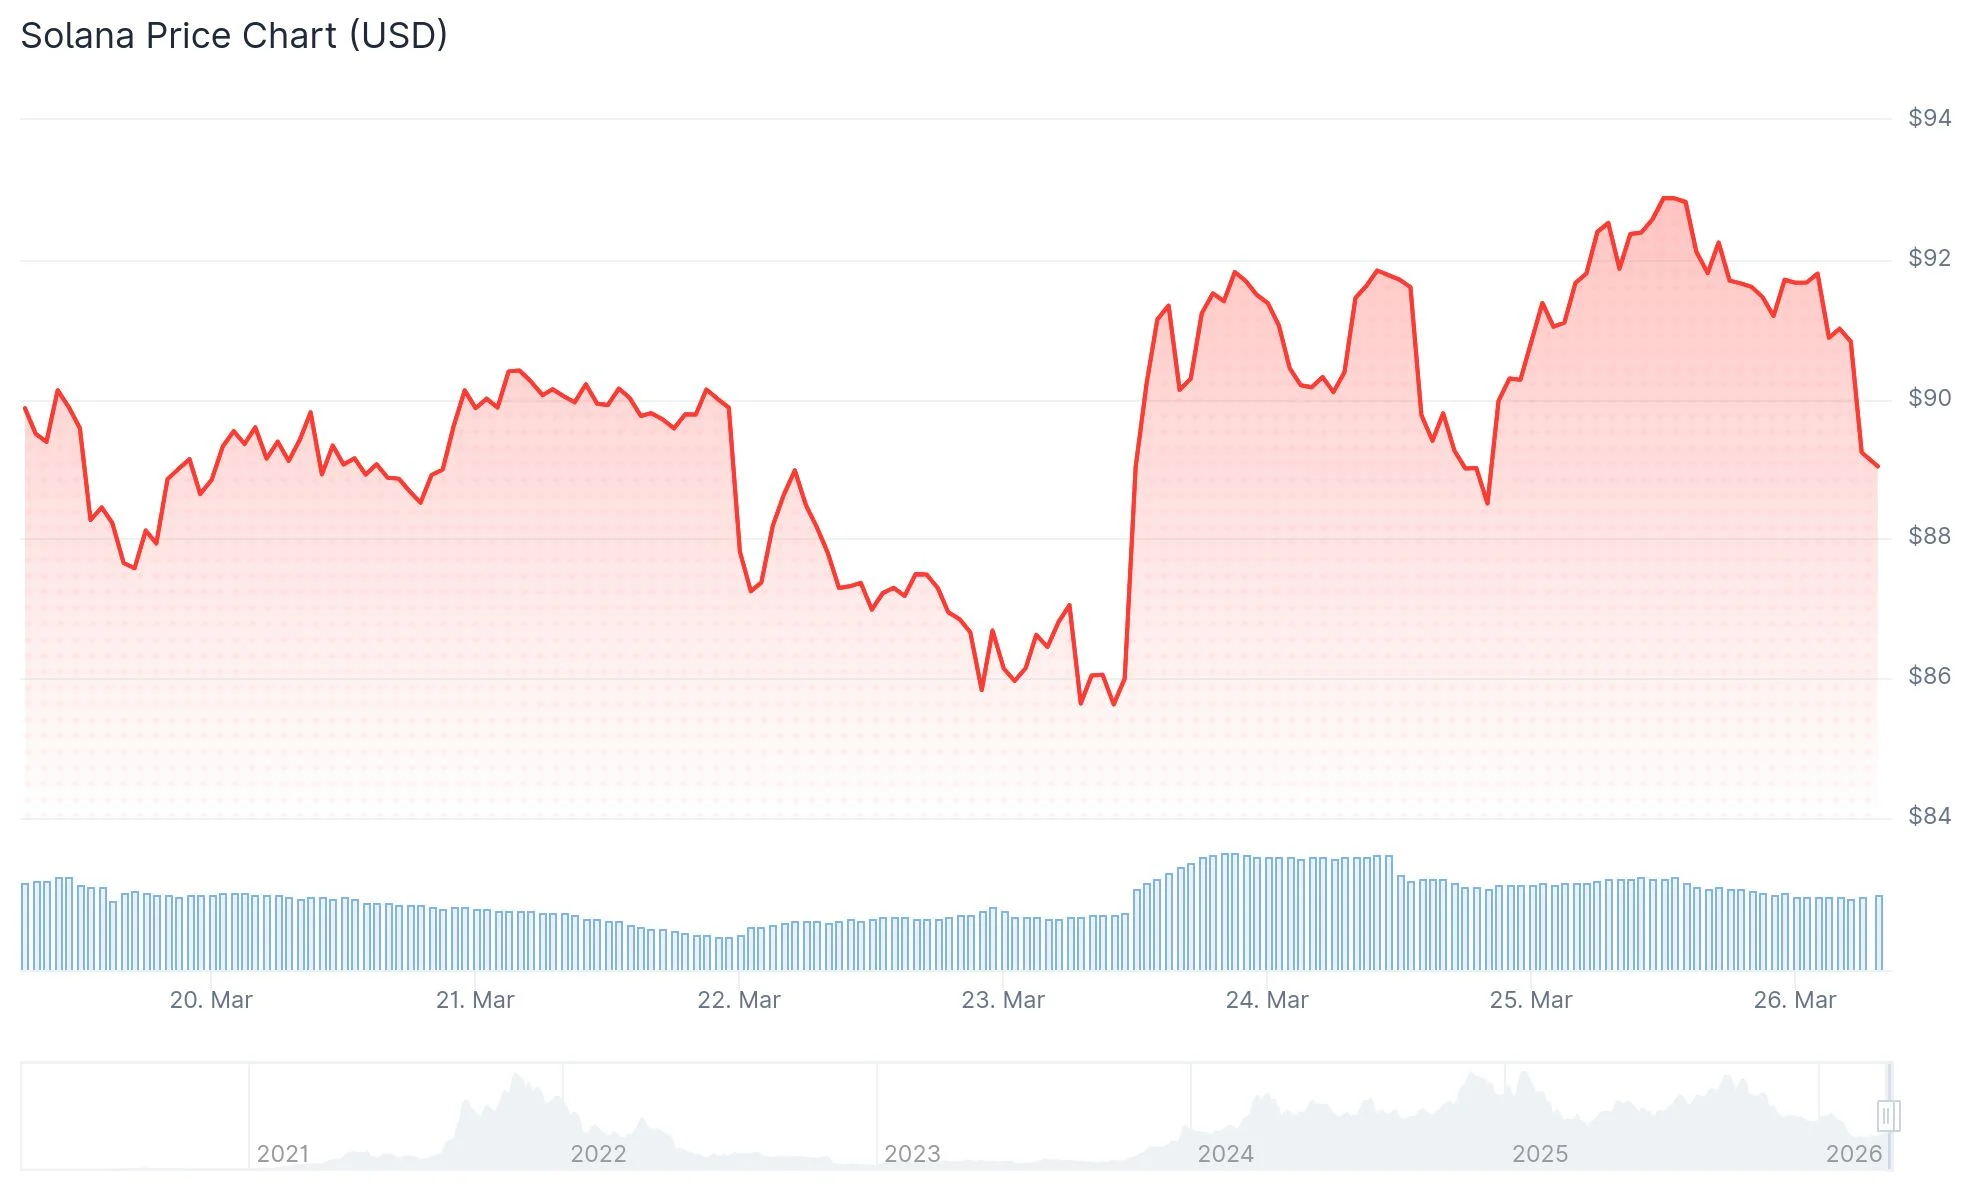
- A bearish reversal requires SOL to fall beneath $88.57—this hasn’t occurred yet.
- The $82–$86 zone shows robust buying activity, supported by Fibonacci levels.
- Price rejection occurred near $92.70, with resistance concentrated between $91–$94.
- Breaking above the $94–$96 threshold could propel SOL toward $98 and beyond.
- Major compliance firm Elliptic has partnered with Solana’s Developer Platform, bringing enterprise-grade tools used by Mastercard, Worldpay, and Western Union.
Solana continues defending a critical support area as market participants monitor a tight price corridor that may determine the asset’s upcoming trajectory. Multiple technical formations indicate indecision, while fresh institutional collaboration strengthens the network’s infrastructure.

The token has been trading within the $82 to $86 bracket, a zone that aligns with key Fibonacci retracement markers and an ascending trendline. This convergence indicates persistent demand at these price points. Following successful defense of this area, a consolidation pattern has emerged.
The subsequent upward movement from this foundation displayed an A-B-C corrective wave formation visible on shorter timeframes. Such patterns generally indicate consolidation rather than trend reversal. While this maintains bullish potential, it stops short of confirming directional commitment.
$91–$94 Zone Acts as Ceiling
During recent attempts to climb higher, SOL encountered significant selling pressure. The $91–$94 area features clustered Fibonacci resistance levels creating a formidable barrier. Price rejection around $92.70 demonstrated continued seller presence at these elevations.
Should this overhead resistance persist, expect potential retracement toward $85 or marginally lower to absorb liquidity. This wouldn’t compromise the overarching structure unless price action breaches $88.57—the critical threshold analysts identify as confirming bearish control.
Conversely, decisive movement above the $94–$96 region would shift technical dynamics. Such a breakthrough would negate the corrective interpretation and establish pathways toward $98 or higher targets.
The SOL/BTC trading pair reveals encouraging developments. Daily timeframe analysis shows the pair challenging horizontal resistance while maintaining position above an upward-sloping trendline. The Relative Strength Index demonstrates upward momentum and recently crossed above its signal line, indicating strengthening performance against Bitcoin.
Weekly chart examination places SOL near the lower boundary of a widening wedge formation. Maintaining this support level is crucial. Failure would suggest extended downside risk, while successful defense preserves recovery possibilities within the pattern.
Major Compliance Integration Announced
Beyond technical considerations, Solana secured an important infrastructure advancement. Elliptic has been designated as the official compliance partner for Solana’s Developer Platform.
This platform provides developers with unified access to construct financial applications including tokenized deposits, stablecoin payment systems, and real-world asset infrastructure. Elliptic contributes integrated wallet screening capabilities, transaction surveillance, and comprehensive risk assessment tools.
Notable organizations already utilizing the platform include payment giants Mastercard, Worldpay, and Western Union.
Currently, SOL must maintain support above $88.57 to preserve existing technical formation, while the $91–$94 region remains the critical area monitoring for potential breakout scenarios.


Crypto World
Bitcoin’s Realized Cap Turns Positive, Signaling Fresh Capital Inflows After February Slump

TLDR:
-
- Bitcoin’s realized cap monthly growth has returned to +0.25%, ending a steep -2.6% decline recorded in February 2025.
- The February correction triggered realized losses as investors who bought BTC at higher prices exited their positions.
- The downturn reflected a weak-to-strong hands transfer, with patient buyers absorbing supply from loss-realizing sellers.
- Analysts now watch whether rising profit-taking will slow recovery or if fresh demand will sustain the positive cap trend.
- Bitcoin’s realized cap monthly growth has returned to +0.25%, ending a steep -2.6% decline recorded in February 2025.
Bitcoin’s realized cap has moved back into positive monthly growth, posting a gain of +0.25% after a steep decline.
This shift follows a difficult correction period that pushed the metric to -2.6% in February. The realized cap tracks the difference between realized profits and realized losses in the market.
It is considered one of the clearest measures of capital movement. Analysts are now watching closely to see whether the trend can hold as market conditions improve.
Realized Cap Drop Reflected Investor Losses During Correction
The February decline in Bitcoin’s realized cap came as investors sold holdings at a loss. Many of those investors had purchased BTC at higher price levels earlier in the cycle. As selling pressure grew, the realized cap pulled back sharply, reflecting capital destruction in the market.
Crypto analyst Darkfost explained the pattern on X, noting that the realized cap measures “the difference between realized profits and realized losses.” During the downturn, this balance tilted heavily toward losses. That shift dragged the monthly growth rate deep into negative territory.
The correction phase also produced a shift in ownership. Investors unwilling to absorb further losses exited their positions and transferred holdings to buyers at lower prices.
This process is commonly referred to as a transfer from weak hands to strong hands. It is a pattern that has appeared in previous Bitcoin market cycles.
Even so, overall sentiment during the correction remained cautious. New capital did not immediately return to the market after prices fell. Buyers waited for valuations to reach levels they considered attractive before committing fresh funds to Bitcoin.
Positive Shift Suggests New Capital Is Returning to Bitcoin
Now that the realized cap has turned positive again, the market dynamic appears to be changing. According to Darkfost, “investor sentiment is improving as capital begins flowing back into the market.”
That change is reflected in the monthly growth figure moving above zero for the first time since the downturn.
The +0.25% reading is modest on its own. However, coming directly after a -2.6% monthly decline, it carries weight as a directional shift. Analysts tend to look at this kind of recovery as an early sign that buyers are returning with confidence.
Capital inflows at this stage often reflect improved sentiment among both retail and institutional participants. When new money enters the market, it tends to push realized profits higher. That, in turn, supports further growth in the realized cap over subsequent months.
The central question, as Darkfost noted, is whether this recovery can continue as more investors take profits. If selling pressure increases alongside rising prices, the growth rate could stall again. However, if demand absorbs that supply, the realized cap is likely to continue its upward trend.
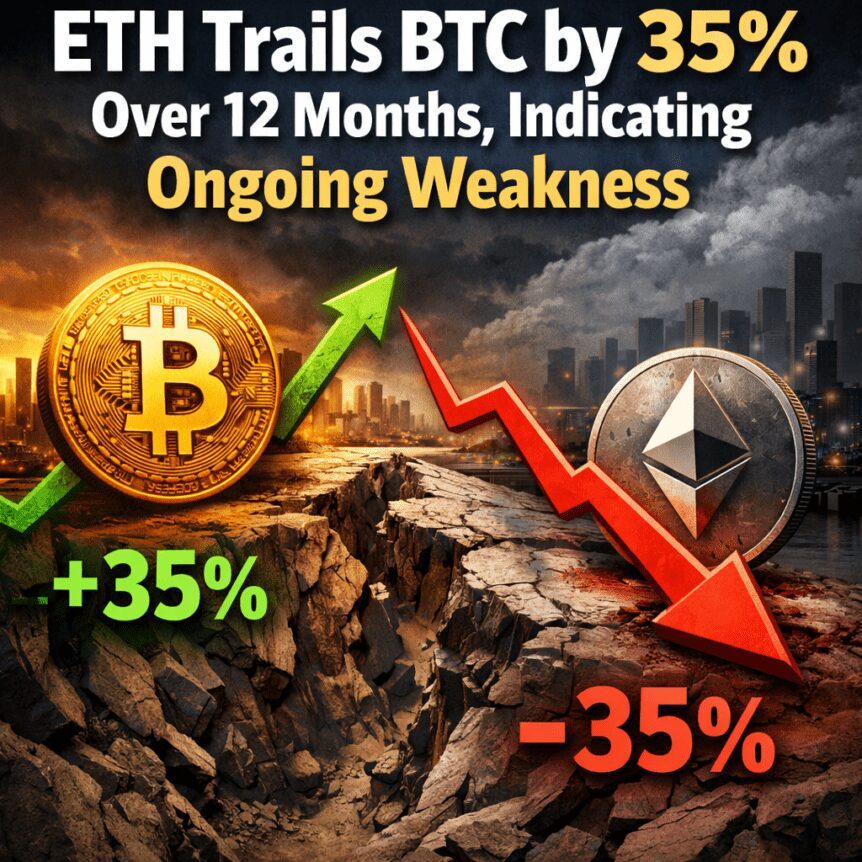
Ethereum’s native token, Ether (ETH), has dropped more than 35% versus Bitcoin (BTC) over the last 12 months, a slide that market observers say could have further to run if technical and on-chain signals play out. The underperformance comes as Bitcoin continues to attract corporate interest and mainstream adoption, while Ethereum faces a mix of liquidity and momentum headwinds that have tempered its rally narratives.
Key takeaways:
- ETH/BTC remains trapped below a multi-year descending trend line that has capped breakouts since 2022, with a potential 40% downside target toward 0.0176 BTC if the weakness persists into 2026.
- Binance ETH reserves climbed to 3.62 million ETH as of May, about 24.6% of all Ether held on exchanges, signaling higher near-term selling risk, according to CryptoQuant data.
- Bitcoin reserves on Binance have fallen, highlighting divergent exchange liquidity trends between the two assets.
- The broader market narrative, including Ethereum’s lingering “ultrasound money” momentum and BTC’s growing institutional interest, continues to shape relative performance and risk sentiment.
ETH-BTC: technical setup points to extended weakness
ETH/BTC has remained entrenched beneath a long-standing descending trend line that has constrained every major breakout since 2022. The pattern mirrors a similar setup that preceded the steep drop from late 2024 into 2025, suggesting the same structural pressure could reassert itself if BTC and ETH fail to find fresh demand.
In August 2025, ETH/BTC briefly retested the trend line, only to be repelled at a convergence zone that included the 0.382 Fibonacci retracement and the 50-month exponential moving average. Since then, the pair slid back below the 20-month moving average, which now acts as a resistance-turned-signal of selling pressure around the 0.034 BTC level.
The chart implies a potential objective around 0.0176 BTC if selling continues, a level that would represent roughly a 40% decline from recent prices and aligns with the 2020 cycle bottom. Traders watching the eth/btc ladder see this as a crucial test of whether Ether can regain tempo or if Bitcoin’s uptrend remains the dominant driver of market risk appetite.
On-chain and exchange signals paint a mixed liquidity picture
On-chain data from CryptoQuant highlights a notable divergence in exchange balances between ETH and BTC. Ether reserves on Binance—the world’s largest crypto exchange by volume—have risen to 3.62 million ETH as of May, accounting for about 24.6% of all Ether held on crypto exchanges. This increase in available ETH suggests more supply could be poised for sale if buyers do not absorb it in the current market environment.
In contrast, Bitcoin reserves on Binance have fallen, signaling tighter exchange-side liquidity for BTC. The opposite dynamics—rising ETH supply versus diminishing BTC supply on exchanges—help explain, at least in part, the ongoing divergences in price action between the two assets.
Higher exchange balances for ETH often translate into greater near-term selling pressure, especially when demand lacks the vigor to match supply. By contrast, shrinking BTC reserves can reflect a combination of hodling behavior and a rotation of liquidity away from centralized venues, which can give BTC a relative edge when risk sentiment shifts.
These reserve patterns add a practical dimension to the broader narrative: Ether appears more exposed to potential supply-driven downside on exchange rails, while Bitcoin benefits from tighter liquidity and, in some cases, a stronger bid from institutional participants stepping into the market.
Narrative tensions and market context: where the momentum sits
Beyond the charts and on-chain metrics, the fundamental backdrop for Ether remains a topic of debate. For years, Ether’s “ultrasound money” narrative — the idea of a deflationary or steadily scarce asset embedded in Ethereum’s monetary dynamics — helped frame ETH as a better long-term store of value relative to fiat or even BTC in some cycles. However, that narrative has cooled in recent periods, contributing to a prolonged period of lag versus Bitcoin on a relative performance basis.
Bitcoin, meanwhile, has benefited from growing corporate engagement and wider adoption into traditional portfolios. Market observers have pointed to evidence of corporate accumulation and strategic participation by institutions as a tailwind for BTC’s price resilience. Notably, retail and institutional access to spot BTC trading, including upcoming offerings and integration into mainstream platforms, continues to shape the adoption trajectory for BTC more than ETH in several market segments.
Recent coverage underscores this asymmetry: corporate players have shown sustained interest in BTC, while Ethereum’s growth narrative has faced headwinds that temper a broad-based upside versus BTC. In parallel, developments such as retail access expansions for spot BTC and ETH trading — including moves from traditional financial firms into crypto markets — remain in focus for readers watching how the market prices risk, liquidity, and opportunity across the digital asset spectrum.
Related commentary has explored how these dynamic shifts could influence capex decisions for developers, liquidity provisioning for exchanges, and the pace of adoption on Layer 2s and decentralized finance ecosystems. As the market absorbs these cross-currents, traders may look for catalysts that could tilt the balance—ranging from further macro normalization to concrete progress on Ethereum’s scaling roadmap and the evolution of centralized exchange liquidity pools.
On balance, the ETH-BTC relationship continues to hinge on a mix of technical barriers, on-chain liquidity signals, and the evolving narrative around what each asset represents to investors and users in different market regimes. While BTC’s path remains susceptible to institutional demand and liquidity dynamics, Ether’s fate will likely be decided by how supply pressure on exchanges interacts with network upgrades, layer-2 maturation, and the broader pace of Ethereum’s ecosystem development.
Readers should watch whether ETH can push through the established trend line, or if the combination of rising ETH supply on major exchanges and continued resistance around key moving averages keeps the pair under pressure. The next price pivot around 0.0176 BTC would not only mark a technical breakpoint but also signal whether Ether can reassert a case for value relative to BTC in the face of shifting liquidity and narrative forces.
The data underpinning these observations draw from CryptoQuant’s exchange-flow analytics, with ETH reserve figures specifically cited for Binance as of May. For anyone tracking the liquidity landscape, these metrics provide a practical lens into where risk might be concentrated in the near term and how institutional and retail behavior could shape the next leg of the crypto cycle.
What unfolds next could hinge on how much buy-side demand returns to ETH in the face of a higher supply ceiling on exchanges and whether BTC’s liquidity backdrop remains supportive as institutional participation continues to expand. Keep an eye on reserve trends, price action around the critical trend line, and any regulatory or product developments that could tilt market sentiment in the coming weeks and months.

Pump.fun traders, after a long stretch of weak performance, are beginning to see a clear turnaround in 2026, according to fresh data from CoinGecko.
Between April 2024 and late 2025, most traders exiting positions on the popular Solana-based meme coin platform ended each month with losses. During this period, the share of profitable wallets rarely crossed the 50% mark and fell as low as 30.1% in June 2025, amid significant underperformance among active participants.
Pump.fun Profitability Improves
The trend began to reverse in early 2026. In February, Pump.fun recorded almost 57% of traders in profit, followed by a sharp rise to 70% in March and 73.3% in April 2026. In April 2026, profits were heavily concentrated at the lower end of the spectrum.
CoinGecko found that the largest cohort, about 2.05 million wallets or 65.1%, earned between $1 and $500. Another 87,000 wallets, or 2.8%, made between $500 and $1,000, while 169,000 wallets, representing 5.4%, booked gains above $1,000.
On the loss side, 793,000 wallets, or around 25%, lost between $1 and $500, while 22,000 wallets (0.7%) lost $500 to $1,000, and 24,000 wallets (0.8%) saw losses of more than $1,000. The data indicated that both gains and losses are largely clustered in small amounts, which “reflects the small-size, high-frequency nature of memecoin trading, where participants typically deploy small amounts of capital.”
The report also noted that the improvement in profitability may be tied to a shakeout of weaker participants, as monthly active wallets fell from a peak of 5.2 million in May 2025 to 1.8 million in December 2025. The subsequent recovery in early 2026 points to a smaller but potentially more experienced trader base returning to the platform.
“This decline can be seen as the exit of the broader retail crowd and subsequent recovery in wallet counts from early 2026 onward implies the return of a more selective, experienced trader base, naturally shifting the profitability distribution in their favour.”
Token Policy Change
Last week, Pump.fun announced it had burned all previously repurchased PUMP tokens and introduced a new buyback-and-burn program funded by 50% of future net revenue. The project said the burned tokens were worth about $370 million and represented 36% of the circulating supply.
It added that, facing trust issues over the longevity of its business, the certainty of buybacks, and how repurchased tokens would be used. According to Pump.fun, the move was meant to address uncertainty through a community-first approach going forward.
The post Solana-Based Meme Coin Launchpad Pump.fun Traders See Turnaround in 2026: CoinGecko appeared first on CryptoPotato.

Bitcoin, Ripple’s token, Solana’s SOL, and several other altcoins made impressive moves over the past few hours, which was rather unexpected given the Sunday market sentiment and lack of major developments.
Interestingly, these recent gains coincided with Donald Trump’s latest message on Iran.
The statement on Truth Social from the POTUS reads that Iran has been “playing games with the United States, and the rest of the World, for 47 years.” He also placed significant blame on former President Barack Obama, saying the situation hit “pay dirt” during his time in office.
“He was not only good to them, he was great, actually going to their side, jettisoning Israel, and all other Allies, and giving Iran a major and very powerful new lease on life. Hundreds of Billions of Dollars, and 1.7 Billion Dollars in green cash, flown into Tehran, was handed to them on a silver platter. Every Bank in D.C., Virginia, and Maryland was emptied out — It was so much money that when it arrived, the Iranian Thugs had no idea what to do with it. They had never seen money like this, and never will again. It was taken off the plane in suitcases and satchels, and the Iranians couldn’t believe their luck.”
After also blaming Joe Biden, Trump said Iran will be laughing no longer at the USA. This statement comes after reports that Iran had sent their response to the US’s latest peace proposal. However, there’s no further information as of press time regarding the actual decision.
As mentioned above, many crypto assets are in the green now. Bitcoin’s gains are among the most modest, but the asset still tapped $81,600. XRP has stolen the show from the larger-cap alts, surging by over 5% daily to a multi-week peak of just over $1.50.
SOL has risen to almost $100 after a 3.5% daily increase, ETH is well above $2,350, and ADA has gained over 5% to sit close to $0.29.
The post BTC, XRP on the Move Amid Trump’s Latest Message on Iran: Details appeared first on CryptoPotato.

XRP is trading in the $1.40 range, as on-chain data paints a picture that looks worse than the news headlines are saying. New daily addresses on the XRP Ledger have collapsed by over 80% from 18,000 in December 2024 to just 2,700. Yet institutions are quietly settling tokenized assets on public blockchains in real time.
. @Ripple network activity continues slowing down! — CryptoBusy (@CryptoBusy) May 8, 2026

New wallet creation dropped from 18,000 per day in December 2024 to around 2,700 today.
Active $XRP supply also declined sharply during the same period. pic.twitter.com/hkOGsMmUXL
According to Glassnode data, monthly active supply dropped more than 70% from 7.45 billion XRP to roughly 2 billion XRP. Exchange reserves simultaneously hit historic lows at 12.9 billion XRP, suggesting holders are moving coins to self-custody and not to sell.
Whales have also accumulated 110 million tokens through March, even as retail participation faded. “The network is shifting from retail speculation only to institutional rails,” RedStone co-founder Marcin Kazmierczak notes. “That transition rarely looks pretty in the address chart.”
With institutional XRP interest accelerating, the market is sending mixed signals.
Discover: The best crypto to diversify your portfolio with
Can XRP Price Recover to $1.50 With Institutional News?
XRP stabilized between $1.38 and $1.42 over the past 48 hours after a bounce from $1.38 to a high of $1.45. The volume surge is the only genuinely bullish data point on the board right now. Everything else is neutral-to-soft.
RSI, MACD, Stochastic, and CCI are all sitting at neutral readings. Analysts note that “thin participation means rebounds lack follow-through,” which is precisely the problem when network payments risk falling below the 500 million threshold that has historically anchored baseline demand.
Right now, resistance still sits at $1.45; XRP has been grinding against that top without a clean break.
The volume spike is encouraging, but sustained spot demand is what confirms institutional accumulation is absorbing sell pressure.
Discover: The best pre-launch token sales
Bitcoin Hyper Presale With More Upside Potential
XRP’s current setup offers limited asymmetric upside at a $80B+ market cap. For XRP, a clean double requires institutional inflows at scale that may take years, not weeks. Traders hunting for higher-beta exposure are rotating attention toward earlier-stage infrastructure plays where the entry price hasn’t already priced in the thesis.
Bitcoin Hyper ($HYPER) is positioning as the first-ever Bitcoin Layer 2 with Solana Virtual Machine (SVM) integration, delivering sub-second finality and low-cost smart contract execution on top of Bitcoin’s security layer.
The project targets Bitcoin’s core bottlenecks directly: slow transactions, high fees, and zero programmability. Its Decentralized Canonical Bridge enables seamless BTC transfers into the fast-execution environment without sacrificing custody trust.
The presale has raised more than $32.6 million at a current price of just a mere $0.0136, with staking rewards already live for early participants. The presale momentum has been building steadily as Bitcoin infrastructure narratives gain traction.
Research Bitcoin Hyper before the presale phase concludes.
The post XRP News: Institutional Adoption Accelerates, Network Activity At Lowest appeared first on Cryptonews.

White House adviser Patrick Witt said it’s possible the Clarity Act becomes law by July 4 while Senator Kirsten Gillibrand pushed for an ethics provision in the market structure bill. Consensus Miami 2026 wrapped up with a fiery debate on the role of prediction markets, and a lot otherwise happened at our first conference in the Sunshine State.
CoinDesk also released the results of a survey it commissioned of 1,000 registered voters on their views toward crypto heading into the 2026 election.
PS: I’ll be at the Bermuda Digital Finance Forum next week. Let’s catch up if you’re there.
You’re reading State of Crypto, a CoinDesk newsletter looking at the intersection of cryptocurrency and government. Click here to sign up for future editions.
The narrative
White House Executive Director of the President’s Council on Digital Assets Patrick Witt told the audience at Consensus Miami this week that he believed it was possible to have President Donald Trump sign the Clarity Act into law by July 4. The timeline would require a markup this month (which seems very possible), four weeks for the Senate to merge the Banking and Agriculture bills (technically possible), a few weeks for reconciliation with the House (also technically possible) and the House vote (will depend on the House) and finally, the part where the president signs the bill.
Beyond Witt, we heard from various industry participants and policymakers at Consensus Miami. Catch up below.
Why it matters
Look, if you’ve read this newsletter for more than a few weeks, you know the Clarity Act has taken center stage for the last several months. Maybe it’ll happen and we can move on to other things. Maybe not. But there does seem to be more momentum now than there has been in weeks, and so we’ll see — I imagine quite soon — what that means.
Breaking it down
Consensus this year had a number of other sessions with lawmakers, policymakers and lawyers weighing in on everything from what the Clarity Act needs (ethics provisions, per Senator Kirsten Gillibrand) to whether or not prediction markets are gambling (we did not reach a conclusion but it was an excellent debate!).
Some highlights:
CoinDesk also released the results of a survey of registered voters it commissioned from April 21-27. We found that while voters generally don’t care about crypto leading into the 2026 midterm election when facing other issues like the economy and healthcare. This likely isn’t a surprise to anyone.
Voters did overwhelmingly say that they did not want senior government officials to have ties to crypto business interests, a majority said they did not feel comfortable with President Donald Trump’s administration overseeing crypto (though just 17% of voters said they knew he and his family had co-founded World Liberty Financial). Voters also overwhelmingly favored banks to crypto projects when asked which was more likely to bring them financial services.
You can read our articles on this data below:
Crypto is at bottom of U.S. voters’ priorities heading into elections, CoinDesk survey shows
U.S. voters don’t trust Trump administration to oversee crypto sector, CoinDesk poll finds
Americans still prefer banks over crypto for financial access, CoinDesk’s survey shows
Thursday
- 14:30 UTC (10:30 a.m. ET) The Senate Banking Committee plans to hold a markup hearing to advance the Clarity Act.
If you’ve got thoughts or questions on what I should discuss next week or any other feedback you’d like to share, feel free to email me at nik@coindesk.com or find me on Bluesky @nikhileshde.bsky.social.
You can also join the group conversation on Telegram.
See ya’ll next week!
Crypto World
BlackRock’s Fink Spots Three U.S. Bottlenecks: Crypto Has 15 Altcoins Building the Answer
TLDR:
- Larry Fink identified power, compute, and chips as critical U.S. shortfalls, putting 15 altcoins in focus.
- Five compute tokens including $TAO and $RENDER offer decentralized GPU access below traditional cloud pricing.
- Power tokens like $EWT and $POWR enable peer-to-peer renewable energy trading without central intermediaries.
- Chip-focused tokens such as $HNT, $IOTX, and $CHIP build hardware and lending layers for AI infrastructure.
Altcoins tied to U.S. shortages in power, compute, and chips are gaining fresh attention across digital asset markets. BlackRock CEO Larry Fink recently named these three sectors as critical bottlenecks for the American economy.
The crypto community has identified 15 blockchain projects that directly target each of these gaps. With BlackRock managing more than $11 trillion in assets, Fink’s remarks carry weight among institutional investors tracking decentralized alternatives. Their growing interest has put these altcoins under fresh scrutiny.
Compute Tokens Offer Decentralized GPU Access for Growing AI Demand
The compute group holds five altcoins, each addressing a distinct gap in AI infrastructure. $TAO operates as a decentralized AI marketplace with 128 specialized subnets running varied machine learning tasks. $RENDER provides a GPU network built for 3D rendering and AI inference at commercial scale.
$IO pools idle GPUs across the Solana blockchain into a single, unified cloud platform for developers. $AKT offers H100 chip access at rates well below standard AWS pricing. $NOS is a Solana-based GPU grid designed specifically for independent AI developers and small teams.
A post from @ourcryptotalk stated these tokens are building for exactly the demand Fink publicly described. Each project targets a separate layer in the compute stack, reducing direct competition among them. $TAO focuses on model training incentives, while $RENDER handles inference and creative rendering workloads.
Traditional data centers are approaching capacity limits as global AI adoption continues to accelerate. Decentralized compute networks offer a practical option for developers needing affordable GPU access at scale. The connection between Fink’s stated concern and these token use cases has raised their visibility across markets.
Power and Chip Tokens Address Energy and Hardware Shortfalls
The power sector includes five altcoins focused on renewable energy distribution and peer-to-peer energy trading.
$POWR enables direct solar and renewable energy trading between participants without any central intermediary. $EWT is a grid-scale energy blockchain already in active deployment by Shell and EDF.
$GLOW rewards verified solar farms in tokens based on measurable clean energy output. $DAY links home batteries and solar panels to wholesale energy markets through a token-based bidding system. $SNC provides a marketplace where neighbors can trade surplus rooftop solar energy directly.
The @ourcryptotalk post framed these power tokens as direct responses to the bottleneck Fink identified. On the chip side, $HNT leads as the largest wireless DePIN network and now integrates 5G on Solana. $ATH runs an enterprise GPU cloud serving game studios and AI labs on a commercial basis.
$IOTX proves real-world chip data on-chain through Internet of Things hardware connectivity. $HONEY builds a dashcam hardware network mapping global roads with data stored directly on-chain.
$CHIP offers GPU-collateralized lending to finance AI infrastructure, acting as a financial layer within the chip sector. The crypto community is now asking which of these 15 altcoins has the capacity to absorb institutional capital flows.
President Donald Trump rekindled the Fort Knox audit debate during a May 10 interview with investigative journalist Sharyl Attkisson. He said he still wants to verify whether America’s gold reserves remain inside the vault.
The remarks reignited a transparency question first raised by Trump and Elon Musk in February 2025.
Why the Fort Knox Audit Question Returns
When Attkisson asked what happened to the audit, Trump said he wanted to “knock on the door of Fort Knox.” He added that the goal was to confirm whether the reserves remain intact.
“I do want to go to Fort Knox sometime. I want to see if the gold is there, which I’m sure it will be,” Trump stated.
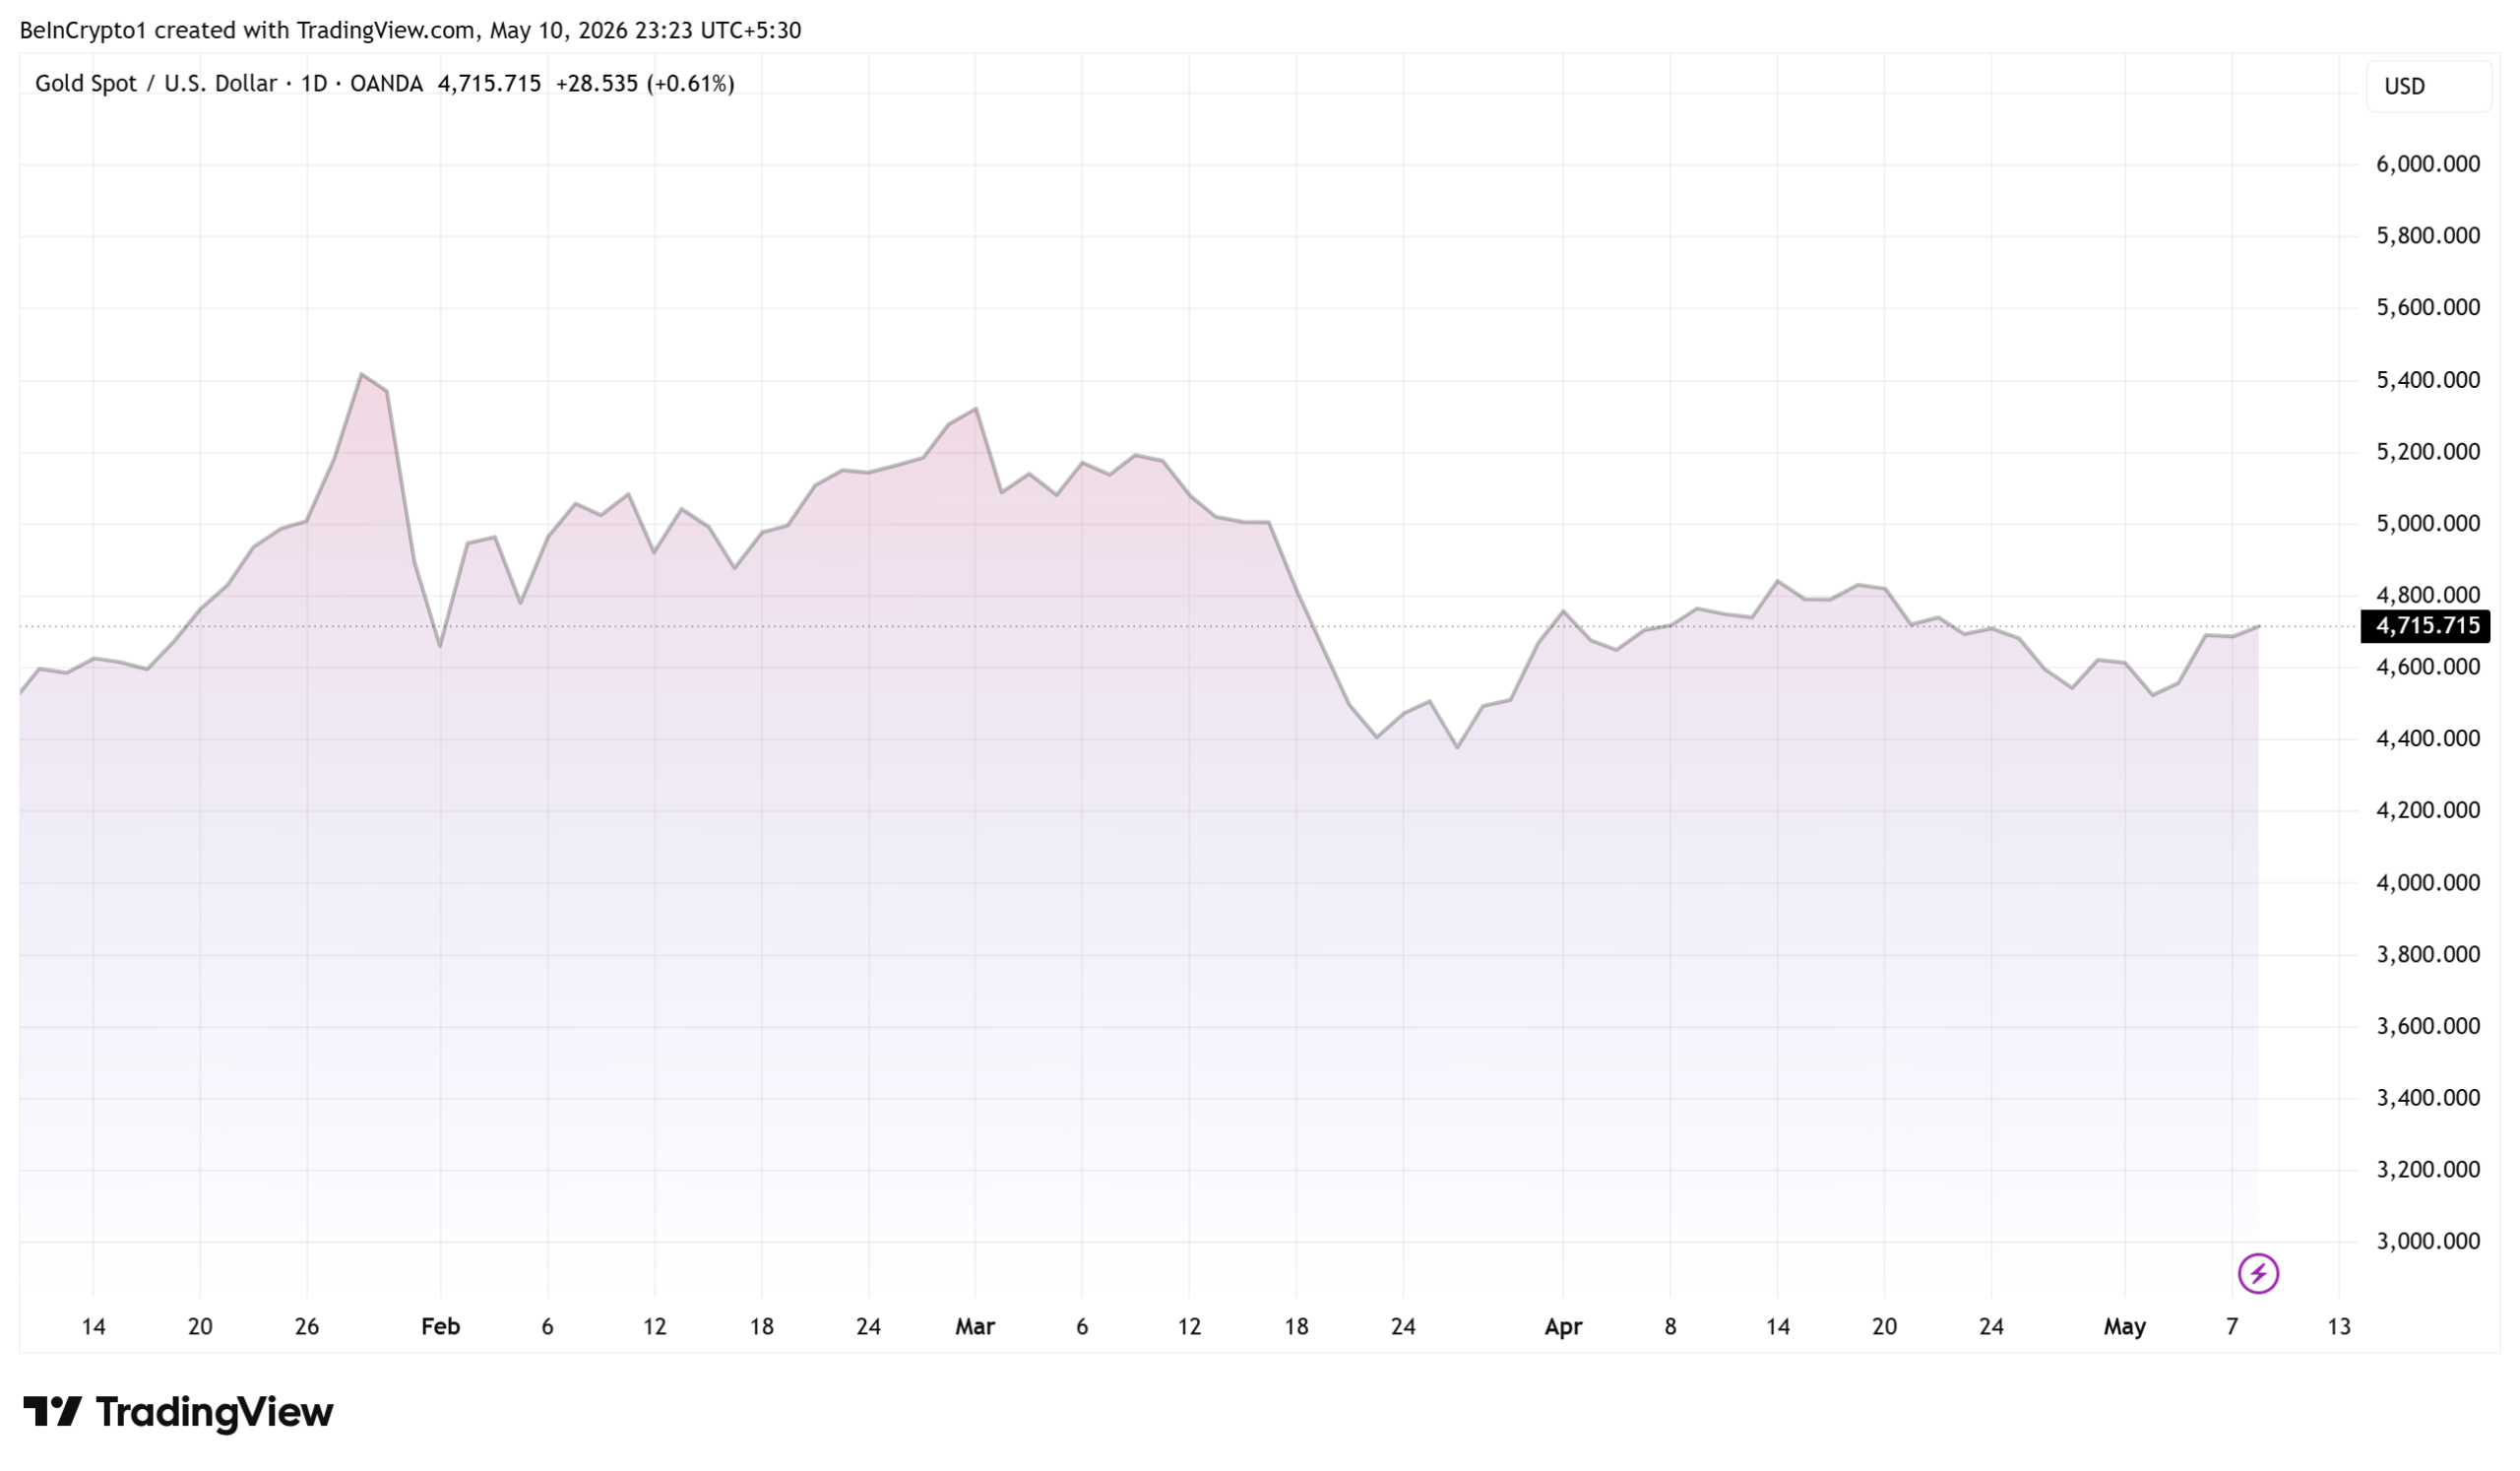
The United States Bullion Depository in Kentucky holds roughly 147 million ounces of gold. Treasury figures place that stash near 59% of total US official holdings.
At current gold (XAU) prices, the bars are worth several hundred billion dollars.

Treasury Secretary Scott Bessent stated in February 2025 that annual internal verifications confirm every bar is accounted for.
However, the last public audit involving outside observers occurred in 1974, a gap that has fueled decades of speculation.
What Comes Next
Trump did not announce a new inspection, formal audit, or visit timeline. The Department of Government Efficiency (DOGE), which originally floated the idea, has gone quiet.
A related bill from Representative Thomas Massie also remains stalled in committee.
“I just introduced HR 3795, the Gold Reserve Transparency Act of 2025, to audit U.S. gold reserves. In February, President Trump said he wanted to go to Fort Knox to “make sure the gold is there.” This bill provides the full disclosure President Trump seeks,” Massie stated.
Renewed attention from the president could nudge gold and safe-haven markets, although no measurable price reaction followed the interview.
The rhetoric becoming a physical inspection could shape the next chapter of one of America’s longest-running monetary mysteries.
The post Trump Revives Fort Knox Audit Push, Wants to Knock on the Vault Door appeared first on BeInCrypto.
Crypto World
JASMY Price Outlook: Can JasmyCoin Repeat Its 4,000% Rally from Current Accumulation Lows?
TLDR:
- JASMY has corrected 98.7% from its $0.36 all-time high and now sits in a HTF demand zone at $0.0045–$0.0060.
- A weekly close below $0.0040 invalidates the bullish structure, making this the most critical risk level to watch.
- Analysts project a potential 10x–40x rally for JASMY during the 2026–2027 altseason if key levels are reclaimed.
- JASMY must reclaim and hold above $0.01030 on higher timeframes to confirm any valid bullish market structure shift.
JasmyCoin (JASMY) is drawing attention from crypto analysts as it trades near multi-year lows. The token has completed a near-total macro correction from its all-time high.
Technical patterns suggest a possible long-term expansion phase may be forming. Analysts are now watching key demand zones closely. Price compression at range lows points to a potential shift in market structure ahead.
JASMY Sits Inside Critical HTF Accumulation Zone After Steep Decline
JASMY reached its previous cycle peak at approximately $0.36 before entering a prolonged downtrend. From that high, the token corrected by roughly 98.7%, placing it near historically significant demand levels.
The price is currently trading between $0.0045 and $0.0060, which analysts identify as a high-risk accumulation zone.
Crypto analyst Crypto Patel noted on X that JASMY “may be forming the same structure that led to a 4,000%+ expansion.”
The token has been trading inside a multi-year descending channel since its 2021 cycle top. Consistent lower highs and lower lows have defined price action throughout this period.
A confirmed breakout and retest occurred in 2024, representing a temporary shift in order flow. However, JASMY failed to reclaim the $0.05 level on higher timeframes, which led to redistribution. Price eventually returned to the current HTF demand region near cycle lows.
Compression at range lows is being read as a sign of seller exhaustion by market participants. The pattern mirrors behavior seen before the 2023–2024 rally, which produced a 1,933% gain. Analysts are treating the current zone as a late accumulation phase before any potential move higher.
Key Price Levels and Cycle Targets Guide Market Outlook for JASMY
For any bullish structure to remain valid, JASMY must reclaim and hold above $0.01030 on higher timeframes. Below that, mid-range resistance sits between $0.0070 and $0.0100. A weekly close below $0.0040 would invalidate the current accumulation thesis entirely.
The structure break level that would confirm a higher timeframe shift is $0.0208. Beyond that, major liquidity targets include $0.05 and $0.18. Bull cycle price targets outlined by the analyst are $0.0185, $0.050, and $0.185 respectively.
The 2026–2027 window is being flagged as a period for a potential massive breakout and retest. Analysts point to a possible 10x–40x rally during a broader altseason phase.
This projection is based on the repeating channel compression and expansion structure seen across previous cycles.
The current phase is described as late accumulation near cycle lows, with risk remaining elevated. Traders are advised to monitor weekly closes carefully around the $0.0040 invalidation level. No confirmed breakout has occurred yet, and price remains within the descending channel structure.
Although most of the cryptocurrency market is in the green now, with BTC climbing to $81,500 minutes ago, Ripple’s native token is actually among the top performers.
The asset posted a notable surge in the past hour or so, going from $1.42 to almost $1.50. This became its highest price tag since April 18, when it was rejected at $1.50 and spent the following three weeks trading sideways between $1.34 and $1.45.

This impressive price surge of almost 5% daily comes on the heels of many analysts predicting it over the past weeks.
As reported yesterday, Ali Martinez noted that the TD Sequential metric had flashed a major buy signal on the 4-hour chart. The analyst outlined targets of up to $1.82 if it manages to decisively break through the $1.45 resistance.
Fellow analyst CW noted that the token’s current chart shows significant strength, and predicted that “a full-scale rise for XRP is imminent.” Before that, they forecasted a “historic rally” in the making.
Another popular analyst on X who often touches upon XRP’s price moves, EGRAG CRYPTO, was significantly more bullish on the asset’s long-term performance. They touched upon the historical EMA Ribbon and outlined three different scenarios for the asset’s future.
Even the most modest one envisioned a mind-blowing 1,000% surge based on historical performance, while the most likely to occur, according to EGRAG, predicted a 1,250% surge, which would send the token flying to $13.
The post Ripple (XRP) Is Breaking Out as Analyst Expects ‘Full-Scale Rise’ appeared first on CryptoPotato.

Barcelona vs Real Madrid LIVE, El Clasico: Marcus Rashford Scores Stunning Free-Kick, Barcelona Take Early Lead | FCB 1-0 RMA

Anthropic Mythos AI finds thousands of zero-day vulnerabilities as Fed and Treasury convene bank CEOs on cyber rik
Apple TV’s 8-Part Sci-Fi Thriller Doesn’t Have a Single Bad Episode
Manchester United reach agreement with Casemiro over contract clause amid transfer speculation

US brings back mandatory military draft registration

Steven Gerrard disagrees with Gary Neville over ‘shock’ Chelsea and Arsenal claim | Football


-
 Crypto World2 days ago
HarrisX Poll Found 52% of Registered Voters Support the CLARITY Act
-

 Crypto World3 days ago
Upbit adds B3 Korean won pair as Base token gains Korea access
-

 Fashion2 days ago
Weekend Open Thread: Marianne Dress
-

 Tech6 days ago
Image AI models now drive app growth, beating chatbot upgrades
-
 NewsBeat3 days ago
NCP car park operator enters administration putting 340 UK sites at risk of closure
-
 Business1 day ago
Ignore market noise, India’s long-term story intact, say D-Street bulls Ramesh Damani and Sunil Singhania
-

 Politics2 days ago
Politics Home Article | Starmer Enters The Danger Zone
-

 Crypto World7 days ago
BlackRock Buys $284M In Bitcoin On May 1 As The Best Crypto To Invest In For 2026 Sits Below A Pending Binance Listing
-

 Entertainment7 days ago
Olivia Wilde Reacts To Viral ‘Corpse’ Comparison
-

 Sports7 days ago
Inter Milan Win Serie A Title After Victory Over Parma
-

 Sports7 days ago
La Liga: Vinicius Jr scores twice as Real Madrid win to keep Barcelona waiting for title
-

 Crypto World5 days ago
UAE Free Zone Deploys Blockchain IDs to Verify Registered Firms
-
 Sports7 days ago
Every word of Arne Slot’s heated rant after Manchester United win vs Liverpool
-

 Sports7 days ago
Joel Embiid urges Sixers fans not to sell playoff tickets to Knicks fans
-
 Sports6 days ago
2026 NHL playoff picks: Second-round predictions, series odds, Stanley Cup bracket
-
Entertainment7 days ago
Jennifer Lawrence’s Mary Jane Sneakers Are Spring’s It-Girl Shoe
-

 Entertainment7 days ago
Moroccan Reacts To Nick Cannon’s Dating Rules For His Sister
-

 Entertainment7 days ago
Kylie Jenner and Timothee Chalamet Hold Hands in NYC Outing
-

 Crypto World4 days ago
BlackRock CEO Larry Fink Discusses a New Asset Class
-
Crypto World7 days ago
Warren Buffett Calls Stock Market a Casino and Warns U.S. Dollar Is Not Safe in 2026
You must be logged in to post a comment Login