
Crypto World
Market Analysis: Gold Slips While WTI Crude Oil Eyes Fresh Upside

Gold price extended losses below $4,800 before the bulls appeared. WTI Crude oil prices are rising and could climb further higher toward $92.00.
Important Takeaways for Gold and WTI Crude Oil Prices Analysis Today
· Gold price failed to clear $4,900 and declined steadily against the US Dollar.
· There is a key bearish trend line forming with resistance at $4,815 on the hourly chart of gold at FXOpen.
· WTI Crude oil prices are moving higher above the $85.00 pivot zone.
· There is a connecting bearish trend line forming with resistance at $89.10 on the hourly chart of XTI/USD at FXOpen.
Gold Price Technical Analysis
On the hourly chart of Gold at FXOpen, the price failed to settle above $4,900 and reacted to the downside, as discussed in the previous analysis. The price traded below $4,850 and $4,800 to enter a short-term bearish zone.
There was a sharp drop below $4,750. The price settled below the 50-hour simple moving average, and RSI dipped below 40. Finally, it tested the $4,700 zone. A low was formed at $4,699, and the price is now correcting some losses.
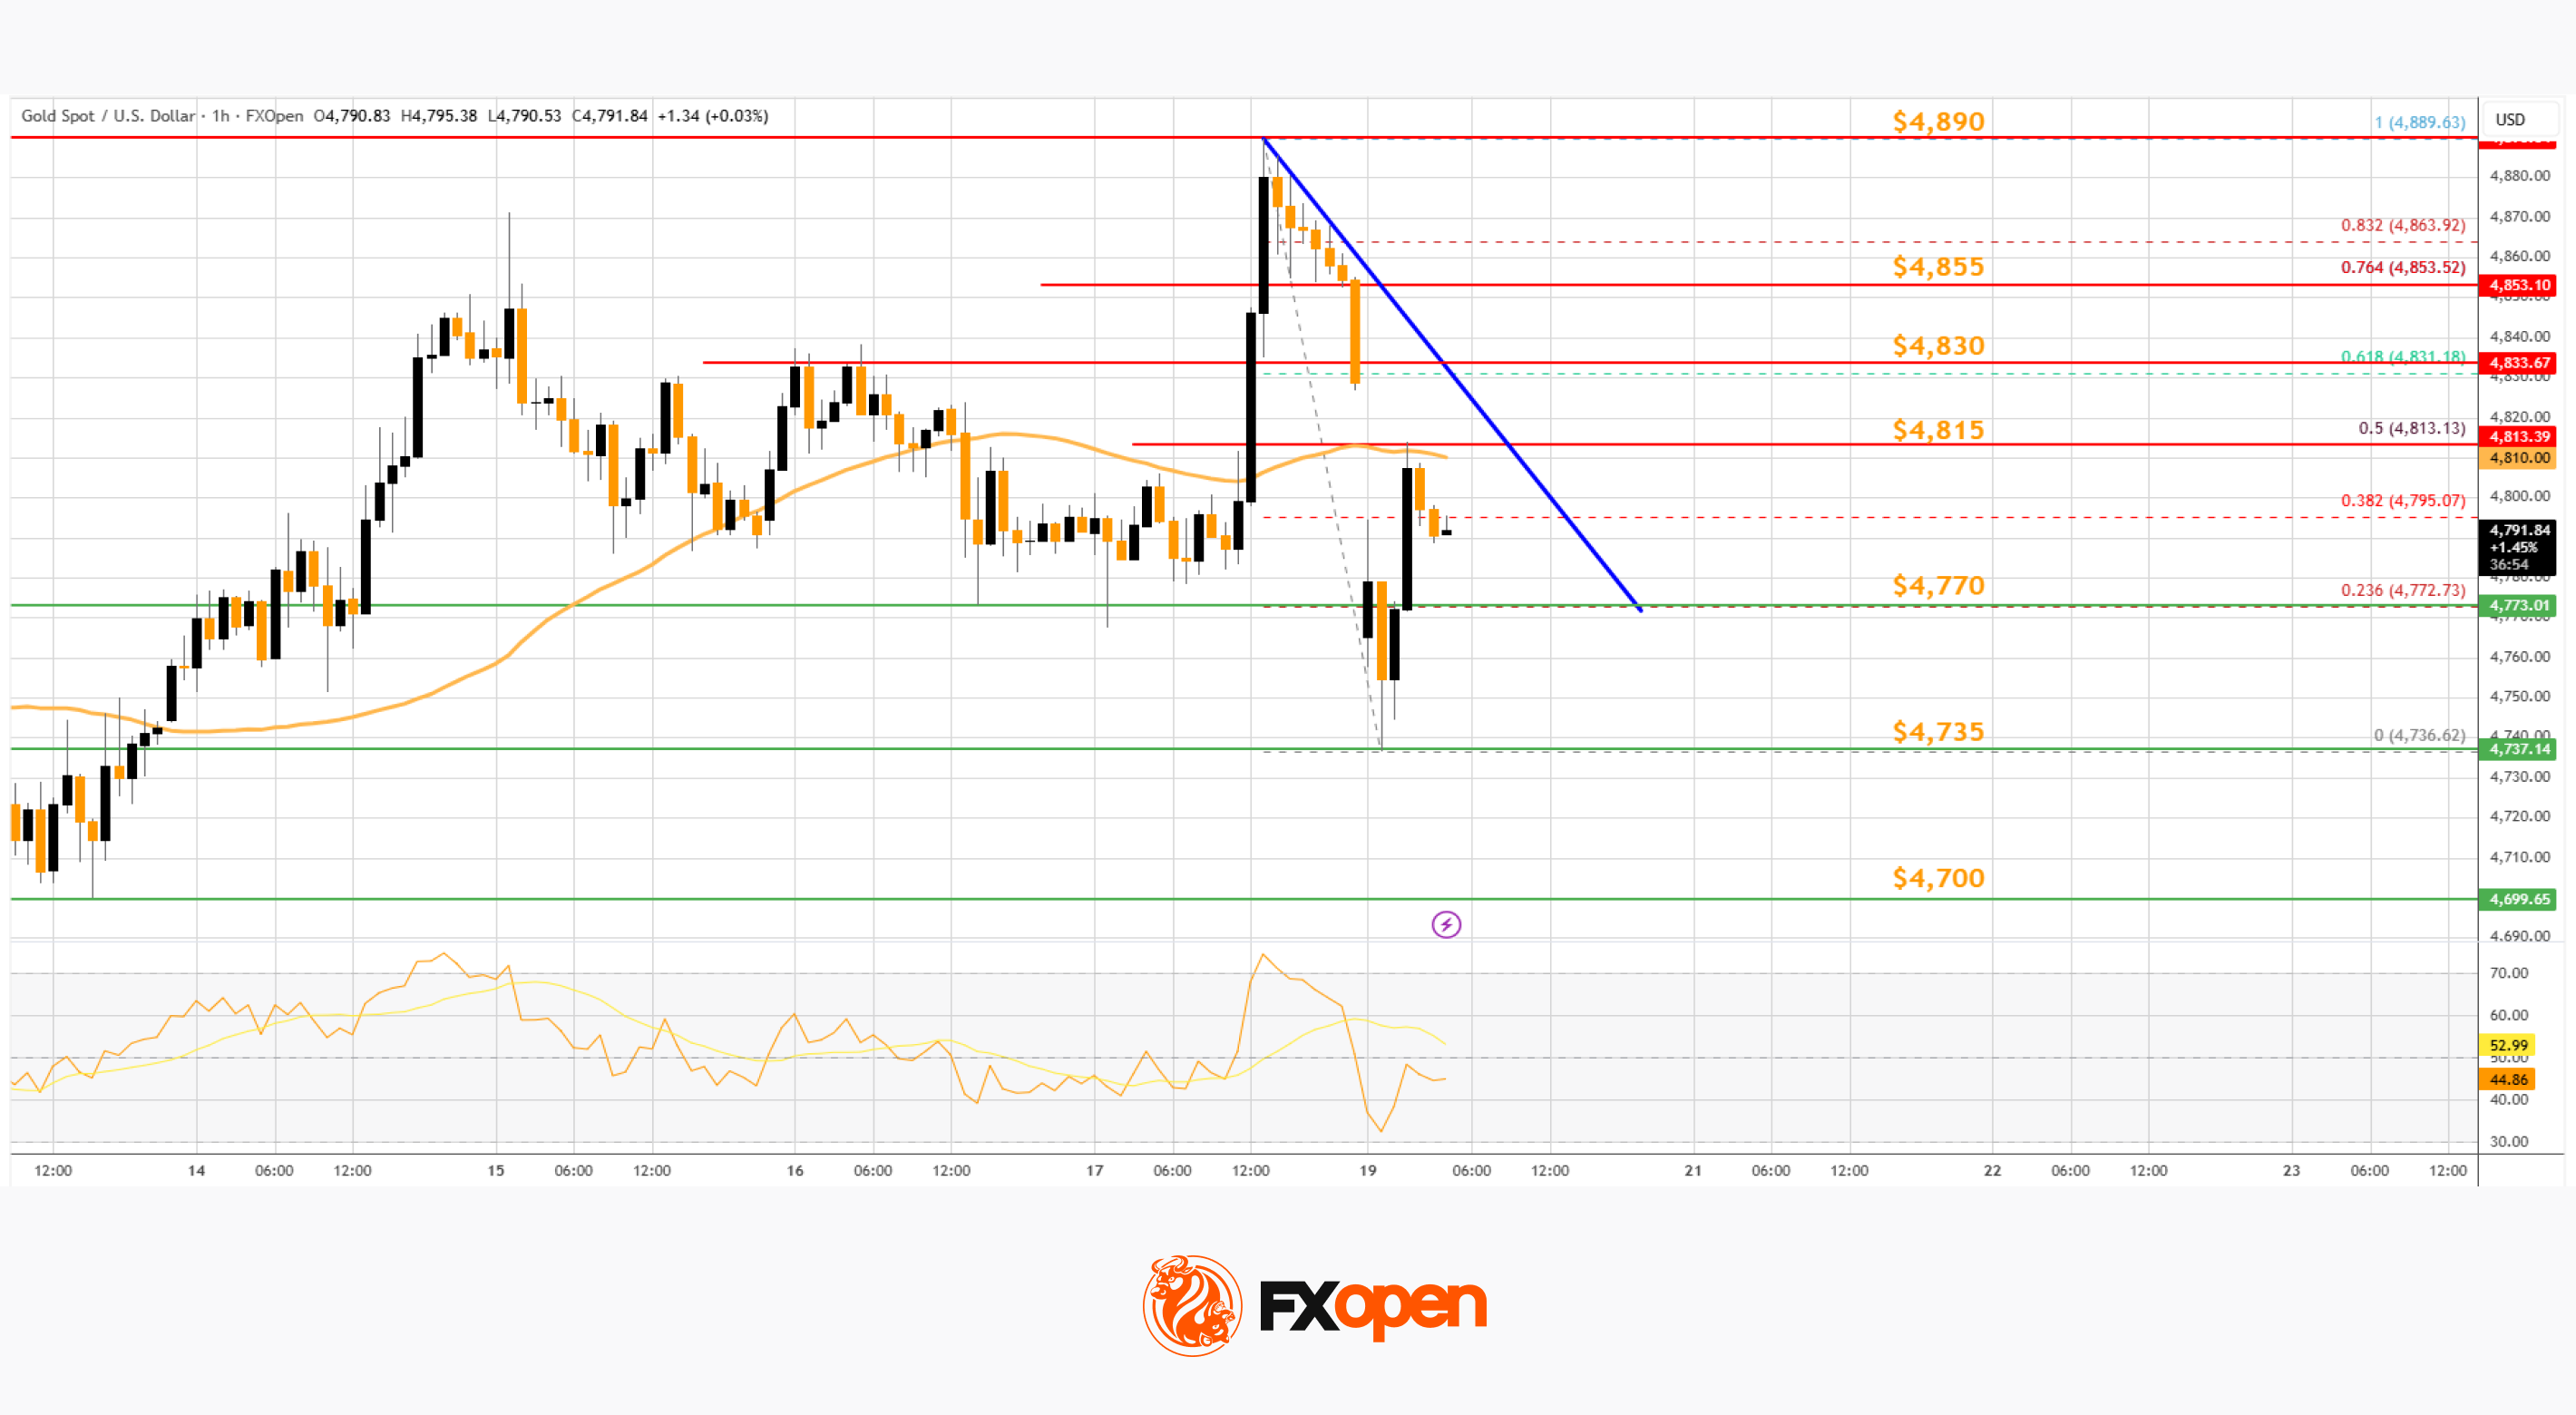
Immediate hurdle on the upside is $4,815 or the 50% Fib retracement level of the downward move from the $4,889 swing high to the $4,699 low. There is also a key bearish trend line forming with resistance at $4,815.
The first major barrier for the bulls could be $4,830 and the 61.8% Fib retracement. A close above $4,830 could initiate a recovery wave to $4,855. An upside break above $4,855 could send Gold price toward $4,890. Any more gains may perhaps set the pace for an increase toward $5,000.
If there is no fresh increase, the price could continue to move down. Initial support on the downside is near the $4,770 level. The first key area of interest might be $4,700. If there is a downside break below $4,700, the price might decline further. In the stated case, the price might drop to $4,500.
WTI Crude Oil Price Technical Analysis
On the hourly chart of WTI Crude Oil at FXOpen, the price started a fresh increase from $79.00 against the US Dollar. The price gained bullish momentum after it broke $84.00.
There was a sustained upward movement above $84.50 and $85.00. The bulls pushed the price above the 50-hour simple moving average, and the RSI climbed toward 60. A high was formed near $89.08 before there was a minor pullback. The price declined below the 23.6% Fib retracement level of the upward move from the $78.96 swing low to the $89.08 high.
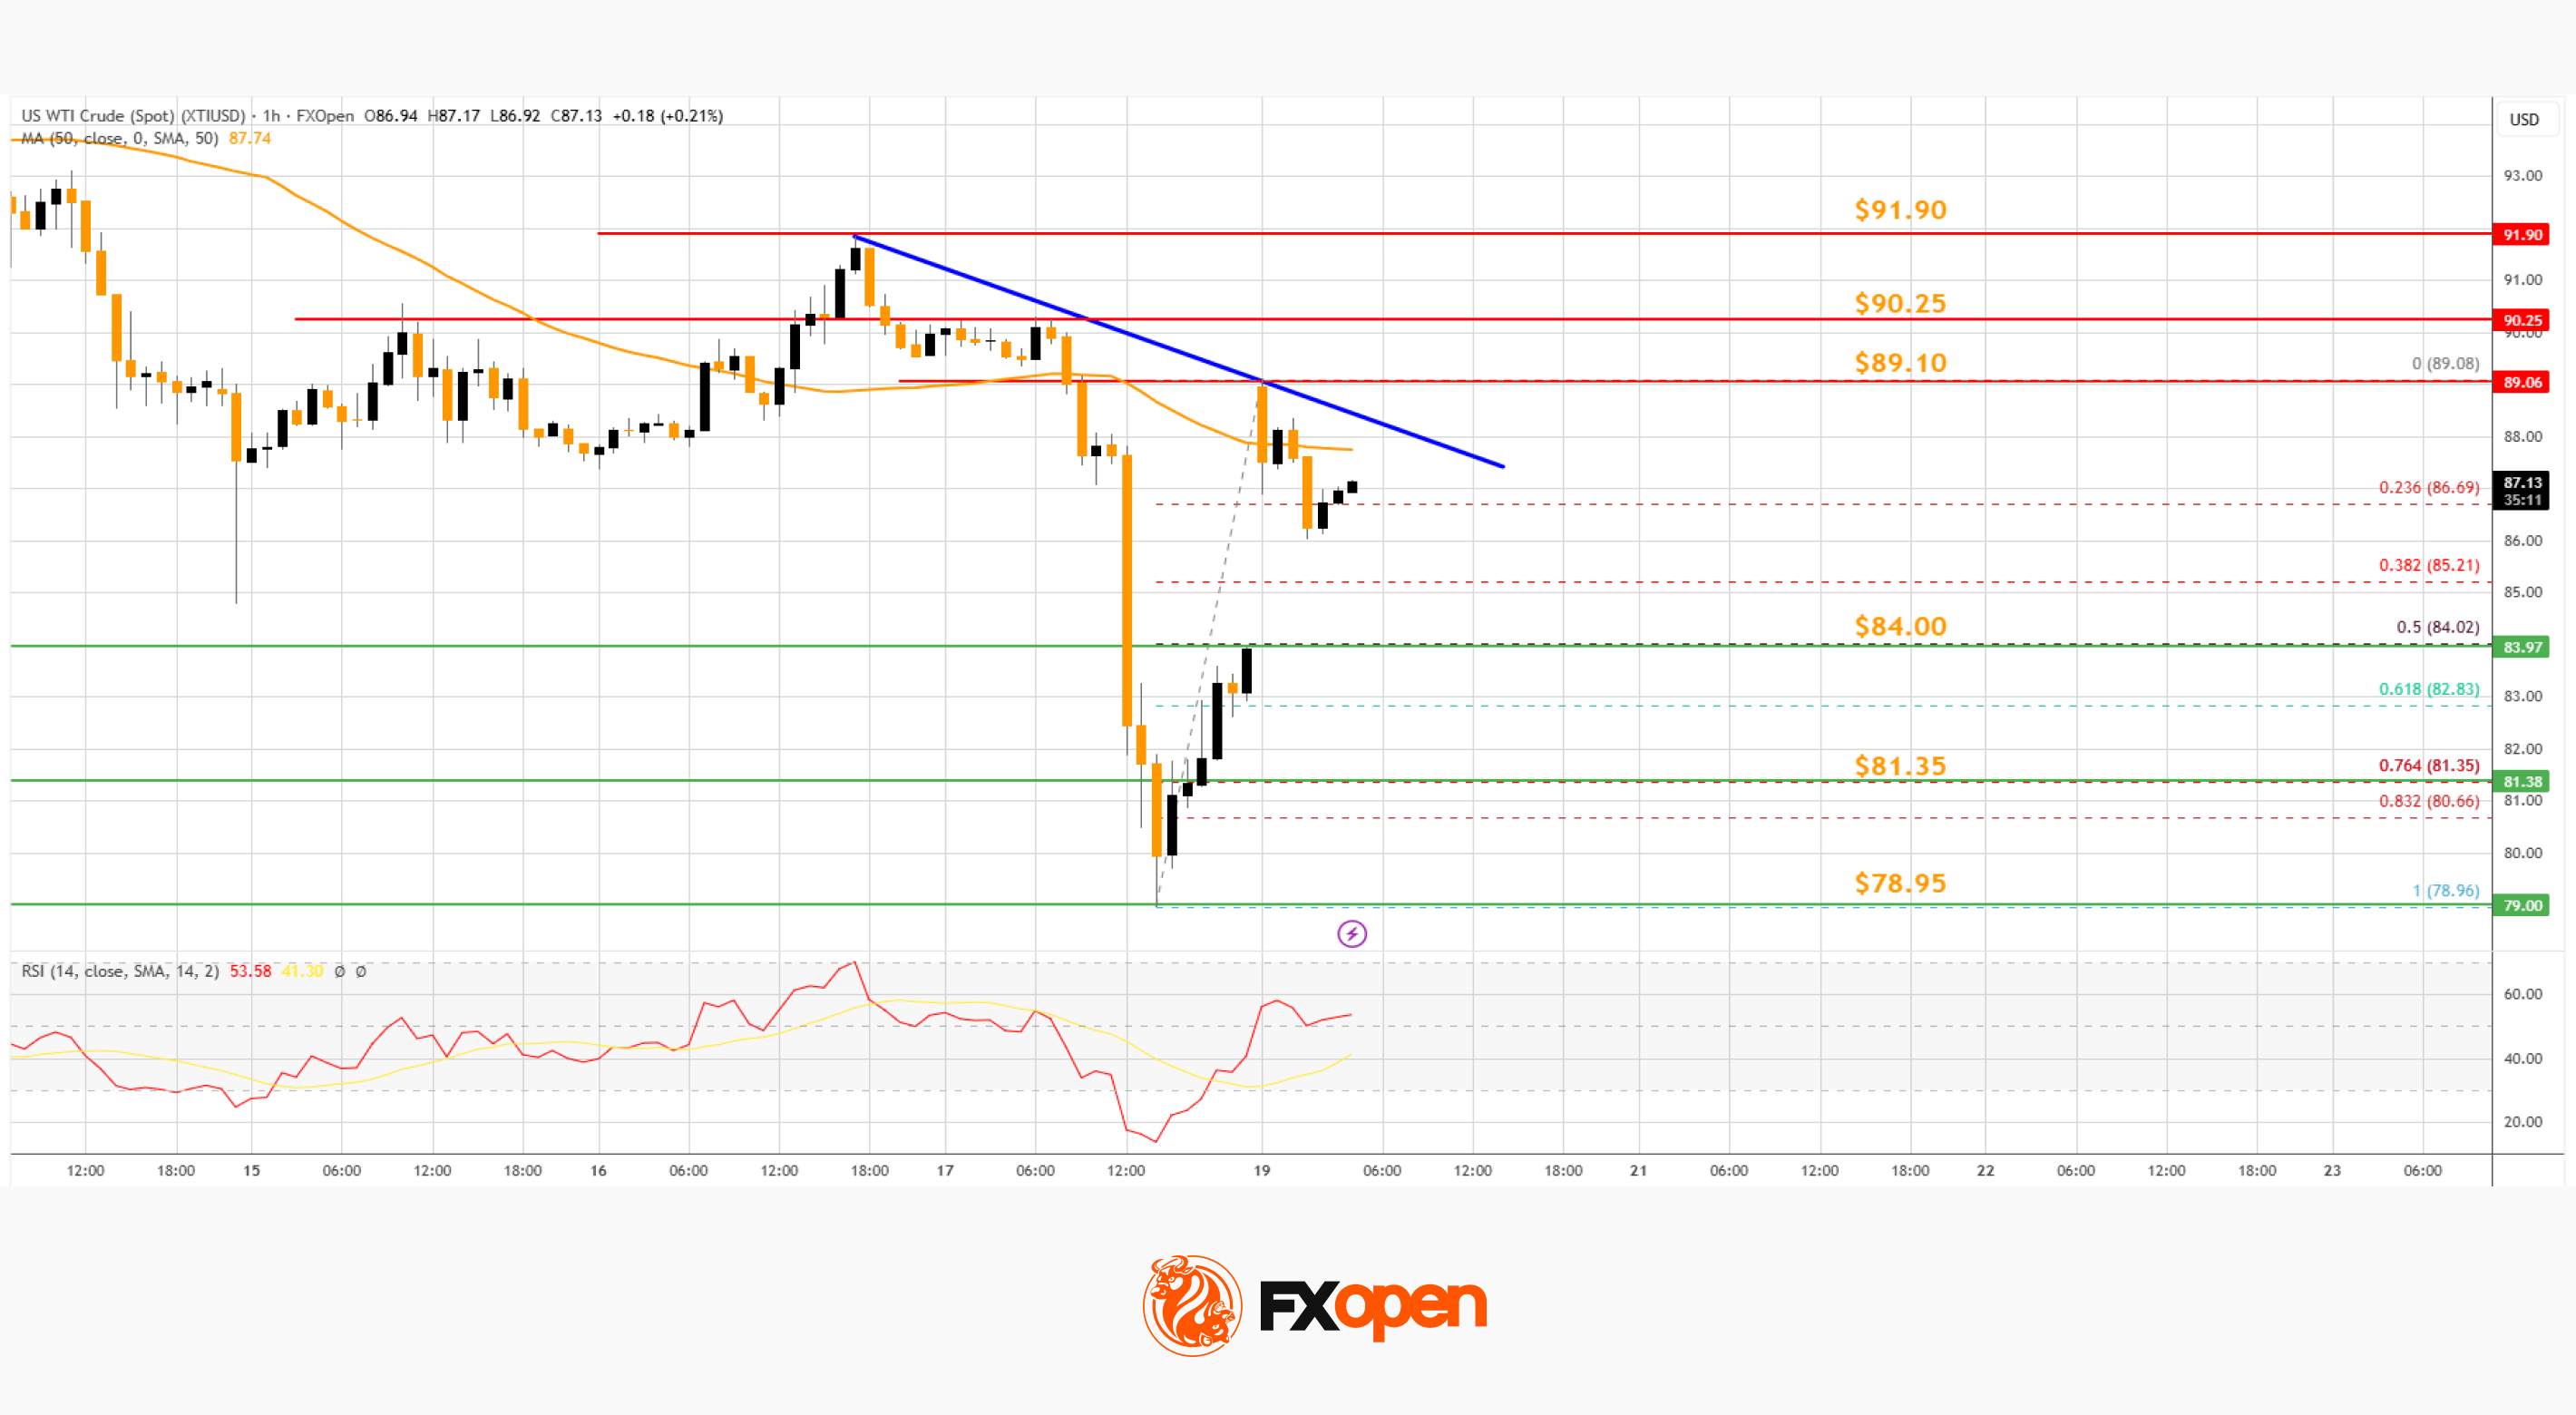
However, the bulls are active above $85.00. Immediate resistance is near a connecting bearish trend line at $89.10. If the price climbs further, it could face hurdles near $90.25.
The next major stop for the bulls might be $91.90. Any more gain might send the price toward $95.00. Conversely, the price might correct gains and test the 50% Fib retracement at $84.00. The next area of interest on the WTI crude oil chart could be $81.35.
If there is a downside break, the price might decline to $80.00. Any more losses may perhaps open the doors for a move toward $75.00.
Start trading commodity CFDs with tight spreads (additional fees may apply). Open your trading account now or learn more about trading commodity CFDs with FXOpen.
This article represents the opinion of the Companies operating under the FXOpen brand only. It is not to be construed as an offer, solicitation, or recommendation with respect to products and services provided by the Companies operating under the FXOpen brand, nor is it to be considered financial advice.

Cryptocurrency investment products logged another week of strong inflows on ceasefire optimism and a Bitcoin price breakout driving investor sentiment.
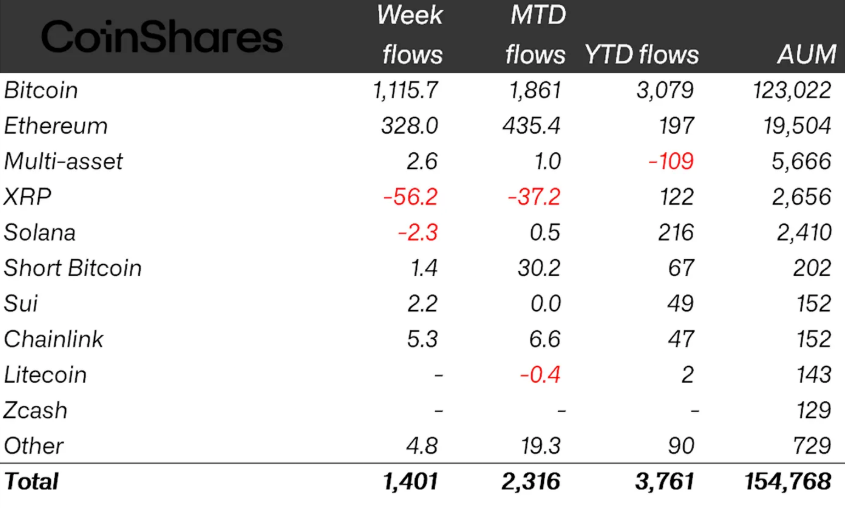
Crypto exchange-traded products (ETPs) posted $1.4 billion in inflows last week, beating the prior week’s $1.1 billion and marking the second-largest weekly inflows since January, CoinShares reported on Monday.
Following the three-week inflow streak totaling $2.7 billion, crypto ETPs now have net year-to-date inflows of around $3.8 billion, with assets under management (AUM) at $154.8 billion — the highest level since early February after dipping to as low as $128 billion in March.
The uptick in crypto funds has likely been driven by a recovery in risk appetite on US-Iran ceasefire extension talks, CoinShares head of research James Butterfill said.
The sentiment was further reinforced by Bitcoin (BTC) nearly touching $78,000 on Friday, according to CoinGecko.
Ether funds turn positive year to date
Bitcoin led last week’s ETP gains by a significant margin, with inflows totaling $1.12 billion. The gains brought year-to-date inflows to $3 billion, with AUM at $123 billion.
The majority of gains were contributed by US spot Bitcoin exchange-traded funds (ETFs), which posted $1 billion in inflows last week.
Ether (ETH) investment products also picked up with $328 million inflows in its strongest week since January, finally lifting the ETPs into green year-to-date with $197 million inflows.

Still, altcoin ETPs, including XRP (XRP) and Solana (SOL), recorded negative flows, with XRP leading the outflows at $56 million. Solana recorded minor outflows of $2.3 million.
Short-Bitcoin products saw a modest $1.4 million of inflows, suggesting residual but limited hedging demand.
Regionally, the US dominated the surge with $1.5 billion of inflows, while Germany ranked second with just $28 million of inflows. Switzerland saw the largest redemptions last week, with outflows totaling $138 million.
Addressing the implications of recent economic data, CoinShares’ Butterfill suggested that March’s Consumer Price Index (CPI) increase of 3.3% appears to have been largely looked through by markets, with core CPI at 2.6% seen as relatively contained, pointing to inflation pressures that remain more supply-driven than broad-based.
Related: Bitcoin erases weekend gains as US-Iran ceasefire faces pressure
Nomura’s Laser Digital echoed that view, telling Cointelegraph that backward-looking macro indicators currently offer only limited insight while conflicts continue to affect supply chains and spending patterns.
“Delayed indicators like CPI and PMIs mostly reflect past conditions rather than the current situation,” Laser Digital said, adding that the outlook remains “cautiously optimistic.”

Sentiment improvement was also reflected in the Crypto Fear & Greed Index, which moved from “extreme fear” to “fear,” with the score rising above 29 on Monday for the first time since Jan. 29.
Magazine: Bitcoin ‘on track’ for $90K, ETFs pull in nearly $1B: Hodler’s Digest, April 12 – 18

Si vous cherchez un moyen sûr et fiable de télécharger l’application Melbet, vous êtes au bon endroit. Dans cet article, nous allons vous présenter les avantages de l’application Melbet APK Maroc et les moyens de la télécharger de manière sécurisée.
La sécurité est un sujet très important pour les utilisateurs de l’application Melbet. C’est pourquoi nous allons vous donner quelques conseils pour télécharger l’application de manière sécurisée.
La première chose à faire est de télécharger l’application Melbet APK Maroc à partir d’un site web fiable. Il est important de vérifier que le site web est sécurisé et que l’application est téléchargée de manière sécurisée.
Ensuite, il est important de vérifier les permissions demandées par l’application. Vous devez vous assurer que l’application ne demande pas plus de permissions que nécessaire pour fonctionner correctement.
Enfin, il est important de surveiller vos transactions et de vérifier vos comptes régulièrement pour vous assurer que tout est en ordre.
En résumé, la sécurité est un sujet très important pour les utilisateurs de l’application Melbet. Il est important de télécharger l’application de manière sécurisée, de vérifier les permissions demandées et de surveiller vos transactions pour vous assurer que tout est en ordre.
Comment télécharger l’application Melbet APK Maroc ?
Pour télécharger l’application Melbet APK Maroc, vous pouvez suivre les étapes suivantes :
1. Ouvrez votre navigateur web et allez sur le site web de téléchargement de l’application Melbet.
2. Cliquez sur le bouton “Télécharger” pour télécharger l’application.
3. Une fois le téléchargement terminé, installez l’application sur votre appareil.
4. L’application est maintenant prête à être utilisée.
Il est important de noter que l’application Melbet APK Maroc est disponible uniquement pour les utilisateurs résidant dans le Maroc.
Conclusion télécharger melbet
En résumé, l’application Melbet APK Maroc est une application de jeu en ligne qui offre une expérience de jeu sécurisée et fiable. Pour télécharger l’application, vous pouvez suivre les étapes précédemment mentionnées. Il est important de noter que l’application est disponible uniquement pour les utilisateurs résidant dans le Maroc.
Melbet APK Maroc : Sécurité et protection des utilisateurs
Il est essentiel de garantir la sécurité et la protection des utilisateurs lors de la téléchargement et de l’utilisation de l’application Melbet APK Maroc. Pour cela, il est recommandé de télécharger l’application directement de la page officielle de Melbet, plutôt que de la télécharger à partir de sources non officielles.
En téléchargeant l’application Melbet APK Maroc, vous pouvez être sûr que vous obtiendrez une version sécurisée et vérifiée de l’application. De plus, vous pourrez bénéficier d’une protection renforcée contre les virus et les malwares, ce qui vous permettra de vous concentrer sur votre jeu et non sur la sécurité de votre appareil.
Comment télécharger l’application Melbet APK Maroc de manière sécurisée
Pour télécharger l’application Melbet APK Maroc de manière sécurisée, suivez les étapes suivantes :
1. Allez sur le site web officiel de Melbet et cliquez sur le bouton “Télécharger” pour télécharger l’application.
2. Assurez-vous de télécharger l’application directement de la page officielle de Melbet, plutôt que de la télécharger à partir de sources non officielles.
3. Une fois l’application téléchargée, assurez-vous de la vérifier et de la scanner pour détecter les virus et les malwares.
En suivant ces étapes, vous pourrez être sûr de télécharger l’application Melbet APK Maroc de manière sécurisée et de bénéficier d’une protection renforcée contre les virus et les malwares.
Il est important de noter que la sécurité est une priorité pour Melbet, et que l’application est conçue pour offrir une expérience de jeu sécurisée et amusante.
La nécessité d’une application sécurisée
Il est essentiel de télécharger l’application Melbet pour garantir une expérience de jeu sécurisée et protégée. En effet, la sécurité est un aspect crucial pour les joueurs, car elle garantit la confidentialité de leurs informations personnelles et financières.
En téléchargeant l’application Melbet, vous pouvez être sûr de bénéficier d’une protection renforcée contre les cybermenaces. L’application est conçue pour offrir une expérience de jeu sécurisée et protégée, avec des mesures de sécurité robustes pour protéger vos données.
- La sécurité est un aspect essentiel pour les joueurs, car elle garantit la confidentialité de leurs informations personnelles et financières.
- L’application Melbet est conçue pour offrir une expérience de jeu sécurisée et protégée, avec des mesures de sécurité robustes pour protéger vos données.
- En téléchargeant l’application Melbet, vous pouvez être sûr de bénéficier d’une protection renforcée contre les cybermenaces.
Il est important de noter que la sécurité est un aspect essentiel pour les joueurs, car elle garantit la confidentialité de leurs informations personnelles et financières. En téléchargeant l’application Melbet, vous pouvez être sûr de bénéficier d’une protection renforcée contre les cybermenaces.
En résumé, la sécurité est un aspect essentiel pour les joueurs, car elle garantit la confidentialité de leurs informations personnelles et financières. En téléchargeant l’application Melbet, vous pouvez être sûr de bénéficier d’une protection renforcée contre les cybermenaces.
Il est donc essentiel de télécharger l’application Melbet pour garantir une expérience de jeu sécurisée et protégée. En téléchargeant l’application Melbet, vous pouvez être sûr de bénéficier d’une protection renforcée contre les cybermenaces.


The landscape of the Middle East and North Africa changed dramatically when the United States and Israel joined forces and attacked Iran. The whole world then became involved in the conflict. Some tried to be a mediator and tell both sides to calm down. Others chose sides and expressed their support or disapproval.
While countries try to figure out issues associated with oil prices, sanctions, migration, and the threat of nuclear war, ordinary people (the most vulnerable members of any society) are just trying to live their best lives. Some entrepreneurial spirits have even bet on the end of the war on Polymarkets.
These are tough times for the region, but some nations have been tougher for over 8,000 years, and this column will offer a different perspective on the conflict and explore some of the potential scenarios, as well as the role of crypto in the region.
Three Scenarios, One Certainty
Before we get to the money, let’s be honest about the map. We’ve been tracking this conflict closely, and the trajectories that matter most aren’t the dramatic ones, they’re the structural ones.
As we discussed in “From Oil to On-Chain: The Evolution of Technology, Crypto, and RWA Tokenization in the MENA Region,” we outlined three possible scenarios.
The most realistic path is a War of Attrition: the conflict simply grinds on. The US and Israel continue degrading Iran’s military and nuclear infrastructure; Tehran, battered but not broken, keeps firing back with missile barrages, drone swarms, and tanker harassment. Oil stays above $100 not as a spike but as a floor. Diplomatic channels don’t collapse, but they don’t function either. Nobody wins and nobody stops, many countries around the world suffer.
The darker version is Systematic Collapse (and it doesn’t require malice) just one miscalculation. A single strike on civilians, and Iran stops calibrating its response and uses everything at its disposal. The Strait of Hormuz goes from “threatened” to “closed,” cutting off roughly 20% of the world’s oil supply and triggering an energy crisis that hits China, India, Japan, and Europe hardest.
The least likely but not impossible path is a Fragile Pause. Washington is bleeding political casualties, no endgame, Congress demanding answers. Tehran is absorbing infrastructure damage that the state can no longer sustain. What follows is not peace, but a frozen conflict. No bombing, but no reconstruction either. Both sides rearm. It’s the least bad version of all possible outcomes, which makes it grim to call optimistic.
One truth runs through all three: wars end either when participants get what they want, or when the cost in lives exceeds what anyone is willing to justify. We haven’t reached that line yet.
But while diplomats negotiate, businesses still need to move money.
The “New Normal”: Navigating the Fog of War
In the wake of the strikes, a strange “new normal” has emerged. While most Arab nations have issued stern condemnations of the escalation, life in the regional hubs remains a study in calculated calm.
In the UAE, resilience trumps panic. Students go back to school at the end of March, and the digital economy continues to hum despite the erratic swings in oil prices and frequent market-moving tweets from the White House, backed by decentralized cloud infrastructure.
However, the war has left its mark on the physical world. The crypto community felt the sting of reality with the postponement of TOKEN2049 Dubai, as organizers moved the event to 2027 citing safety and logistics. Some of the international events have been called off for safety reasons. For many firms, physical operations have hit “pause,” shifting entirely into the digital ether.
But infrastructure doesn’t cancel. And that distinction matters enormously.
Saudi Arabia moved with uncharacteristic bureaucratic speed. To stabilize trade routes, the Kingdom’s Transport General Authority (TGA) recently suspended all documentation requirements for marine vessels for 30 days. It’s a pragmatic admission that in 2026, the flow of goods is more important than the flow of paperwork.
Meanwhile, Israeli news portals hint at a growing, if silent, alignment between the UAE, Saudi Arabia, and the West against Tehran, the region finds itself at a crossroads. This isn’t just a military conflict; it is a stress test for the future of decentralized finance and regional unity.
On the other hand, the media and the government of Turkey and Qatar are actively promoting the idea of mutual peace and cease the fires from both sides.
The Digital Bridge: Stablecoins as a War-Time Necessity
The Middle East Council on Global Affairs recently published a framework for navigating this “New Normal,” warning GCC states against falling into a “strategic trap” between competing alliances. Their recommendation is a sophisticated form of differentiated hedging: maintaining diplomatic channels with all sides while building a security architecture capable of standing without external life support.
In the streets of Dubai and the boardrooms of Riyadh, this “Strategic Autonomy” is being built not just with hardware, but with code. If the 20th century was defined by the petrodollar and Western security guarantees, 2026 is becoming the era of Digital and Financial Neutrality.
For the regional business community, being “diplomatic with both sides” means using financial tools that don’t take sides. This is why we are seeing a massive surge in On-Chain Settlement. When traditional banking rails become entangled in the sanctions and counter-sanctions of the US-Israel-Iran triangle, crypto provides the “exit ramp.”
While in more stable regions (Europe or South East Asia) crypto is still largely treated as a speculative asset or an innovation layer. In MENA, it is rapidly evolving into something far more practical: a mechanism for continuity.
For many, crypto has become the “last-mile” solution. When traditional credit lines are frozen due to force majeure, a stablecoin transfer settled in seconds on-chain allows a merchant to secure a cargo flight or a rerouted shipment through Saudi Arabia’s newly deregulated maritime routes.
By betting on ceasefire odds, local businesses are essentially hedging their real-world losses. If the war continues, their “win” on-chain helps offset the rising cost of fuel and disrupted trade.
By 2026, the blockchain will evolve beyond a mere ledger, becoming the region’s de facto emergency reserve.
RWA: When “Infrastructure” Becomes Urgent
This isn’t happening in a vacuum. The shift toward on-chain settlement in MENA mirrors a broader structural transformation already underway in global finance. Institutions like BlackRock, Franklin Templeton, and J.P. Morgan tokenizes real-world assets because of its atomic settlement, programmable yield, and the elimination of intermediary layers are simply better infrastructure. Moving from slow T+2 settlement cycles to near-instant on-chain finality is an operational upgrade that the world’s largest financial institutions have already begun executing.
When correspondent banking freezes under sanctions pressure, that “better infrastructure” stops being theoretical. The multi-trillion dollar RWA market has its most urgent real-world stress test right now, in the trading desks of Dubai and Riyadh.
War doesn’t slow the adoption of better financial plumbing, it accelerates it.
Betting on Dubai: Why We Opened Our Office Here Anyway
There is a particular kind of clarity that only comes from turbulence. And in April 2026, the MENA region is offering plenty of it.
Since the outbreak of the conflict, a cascade of high-profile cancellations has followed: TON Gateway Dubai was called off in mid-March and Formula 1 announced the Bahrain and Saudi Arabian Grands Prix would not take place in April. For many observers abroad, these headlines painted a picture of a region in retreat.
At ChangeNOW, we see something different.
The events may have paused, but the infrastructure has not. The regulatory architecture that Dubai spent years building is still standing, and it is precisely this foundation that we bet on when we opened our new office here. In 2026, VARA licensing represents a comprehensive regulatory commitment with crypto businesses expected to treat licensing, governance, and compliance as core operational pillars from the outset.
That kind of seriousness is exactly what the moment demands. When traditional banking rails become entangled in the sanctions and counter-sanctions of a conflict, businesses don’t flee toward chaos, they flee toward clarity. Dubai offers that clarity. While many countries continue to struggle with unclear crypto laws and regulatory uncertainty, Dubai has taken a confident lead by establishing a dedicated legal framework for virtual assets, and in 2026, it has evolved into a global headquarters hub for Web3 companies, blockchain startups, and digital asset businesses.
This is not a blunt optimism. It is the same calculation that merchants, traders, and builders have been making in this region for six thousand years: that geography, infrastructure, and institutional trust matter more than any single crisis. The Silk Road didn’t stop when empires fell. It rerouted.
We opened our Dubai office because we believe the same rerouting is happening now, but in finance, in settlement infrastructure, in the architecture of trust. Stablecoins are becoming the “last-mile” solution for businesses whose traditional credit lines have been frozen.
On-chain settlement is replacing correspondent banking for merchants navigating a world of sanctions and counter-sanctions. And Dubai, with its zero personal income tax, unified VASP register visible federally across emirates, and a stablecoin framework anchored by the dirham-backed AE Coin, is positioned to be the clearing house for all of it.
And we are not naive about the risks, we understand that the path ahead is not smooth (and anyone claiming otherwise is selling something). But the companies that define MENA’s next decade of digital finance will be the ones who showed up when the calculation was still uncomfortable.
We showed up.
The post When Empires Shake, Code Doesn’t: Crypto, Dubai, and the New Financial Silk Road appeared first on BeInCrypto.
The crypto market will welcome tokens worth more than $723 million in the fourth week of April 2025. Major projects, including LayerZero (ZRO), Undeads Games (UDS), and Humanity (H), will release significant new token supplies.
These unlocks could introduce market volatility and influence short-term price movements. So, here’s a breakdown of what to watch.
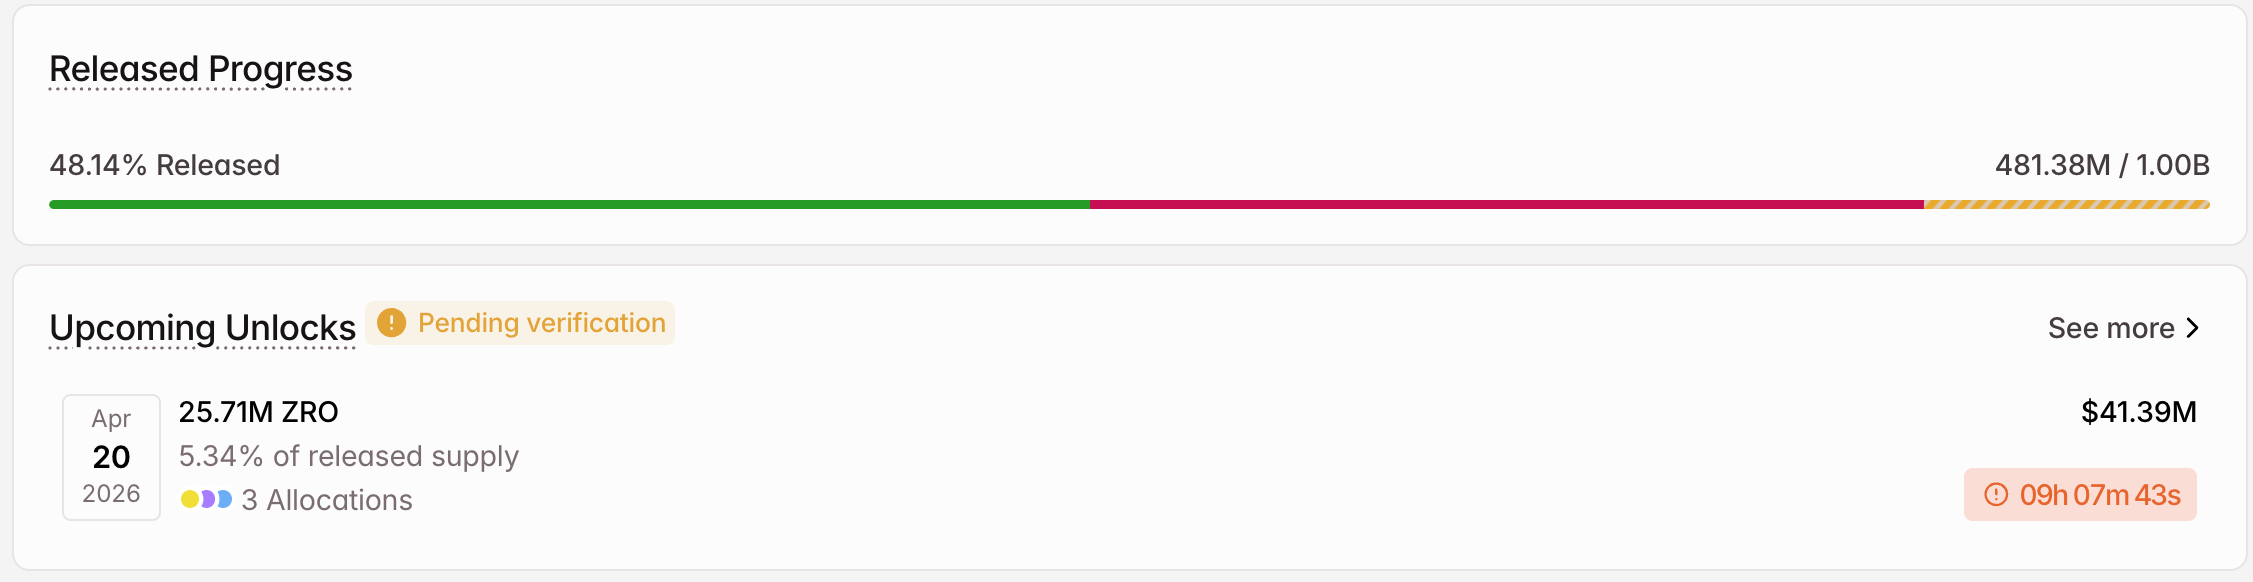
1. LayerZero (ZRO)
- Unlock Date: April 20
- Number of Tokens to be Unlocked: 25.71 million ZRO
- Released Supply: 481.38 million ZRO
- Total Supply: 1 billion ZRO
LayerZero is an interoperability protocol that connects different blockchains. Its primary goal is to facilitate seamless cross-chain communication. Thus, it enables decentralized applications (dApps) to interact across multiple blockchains without relying on traditional bridging models.
The team will unlock 25.71 million tokens on April 20, representing 5.34% of the released supply. Moreover, the supply is worth approximately $41.39 million.
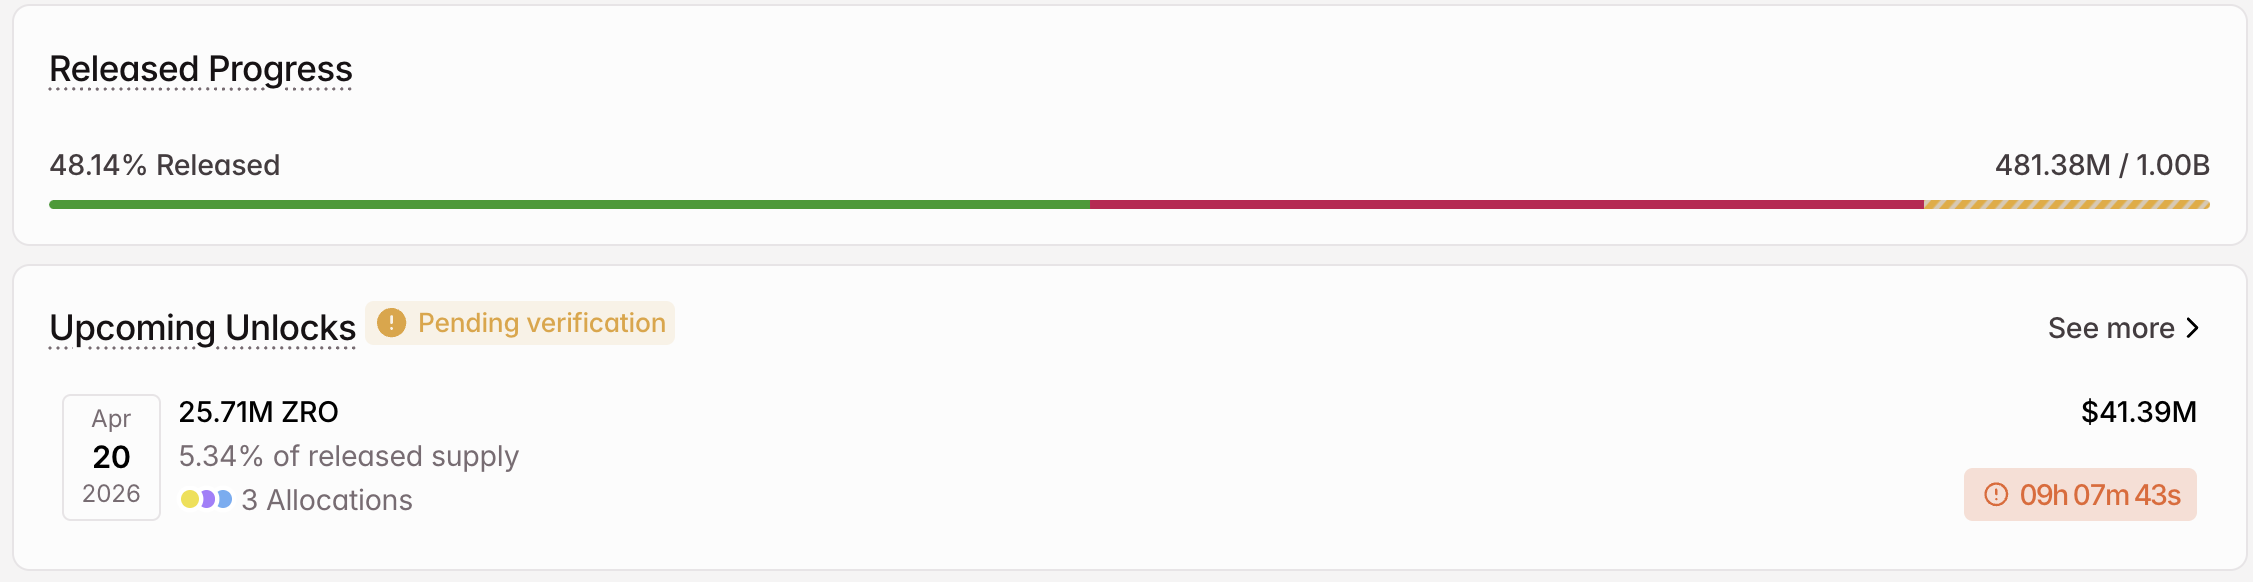
LayerZero will award 13.42 million altcoins to strategic partners. Core contributors will get 10.63 million ZRO. Lastly, 1.67 million ZRO are for tokens repurchased by the team.
2. Undeads Games (UDS)
- Unlock Date: April 22
- Number of Tokens to be Unlocked: 21.94 million UDS
- Released Supply: 162.91 million UDS
- Total Supply: 250 million UDS
Undeads Games is a Web3 gaming studio launched in early 2022, building a post-apocalyptic metaverse where humans battle zombies across titles such as Undeads Rush, Viral, and Fighters. UDS is its ERC-20 utility token on Ethereum, powering in-game trading, NFT transactions, staking rewards, and governance
On April 22, Undeads Games will release 21.94 million tokens, valued at $37.09 million. The tokens represent 13.47% of the unlocked supply.
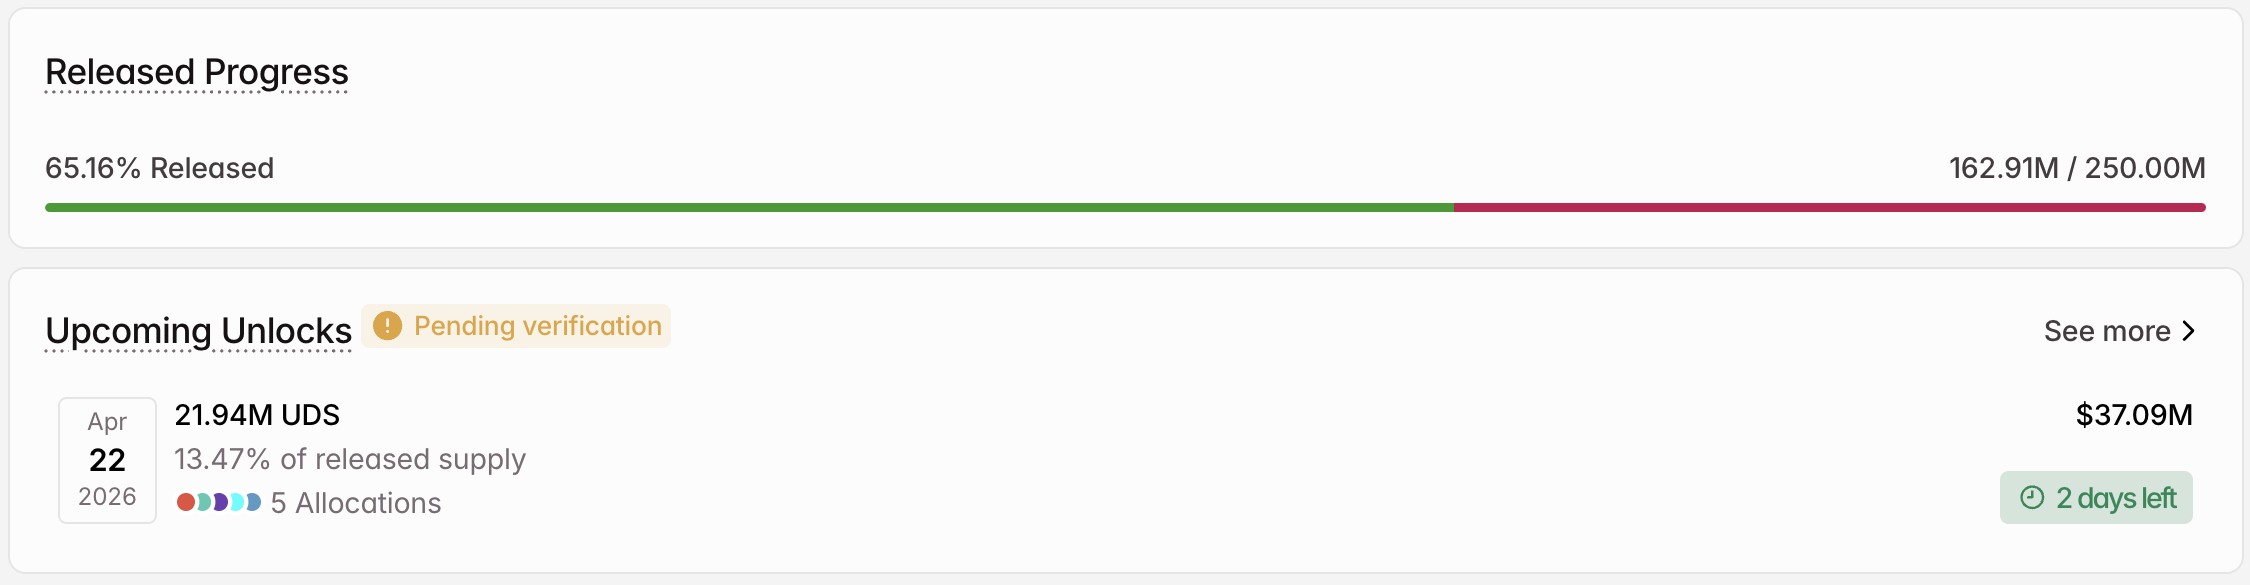
The team fund will receive 9.17 million UDS. Undeads Games will allocate 5.63 million tokens to the seed round and 5 million tokens to airdrop seasons 2-5.
In addition, the ecosystem fund will get 1.74 million tokens. Finally, the marketing fund will gain around 416,670 altcoins.
3. Humanity (H)
- Unlock Date: April 25
- Number of Tokens to be Unlocked: 105.36 million H
- Released Supply: 2.62 billion H
- Total supply: 10 billion H
Humanity (H) is a decentralized identity protocol that utilizes biometric palm recognition, zero-knowledge proofs, and blockchain to verify the authenticity of real human users without exposing their personal data. It features a native Proof of Humanity (PoH) consensus mechanism.
On April 25, the protocol will unlock 105.36 million tokens. The tokens are worth $10.98 million and also account for 4.02% of the released supply.
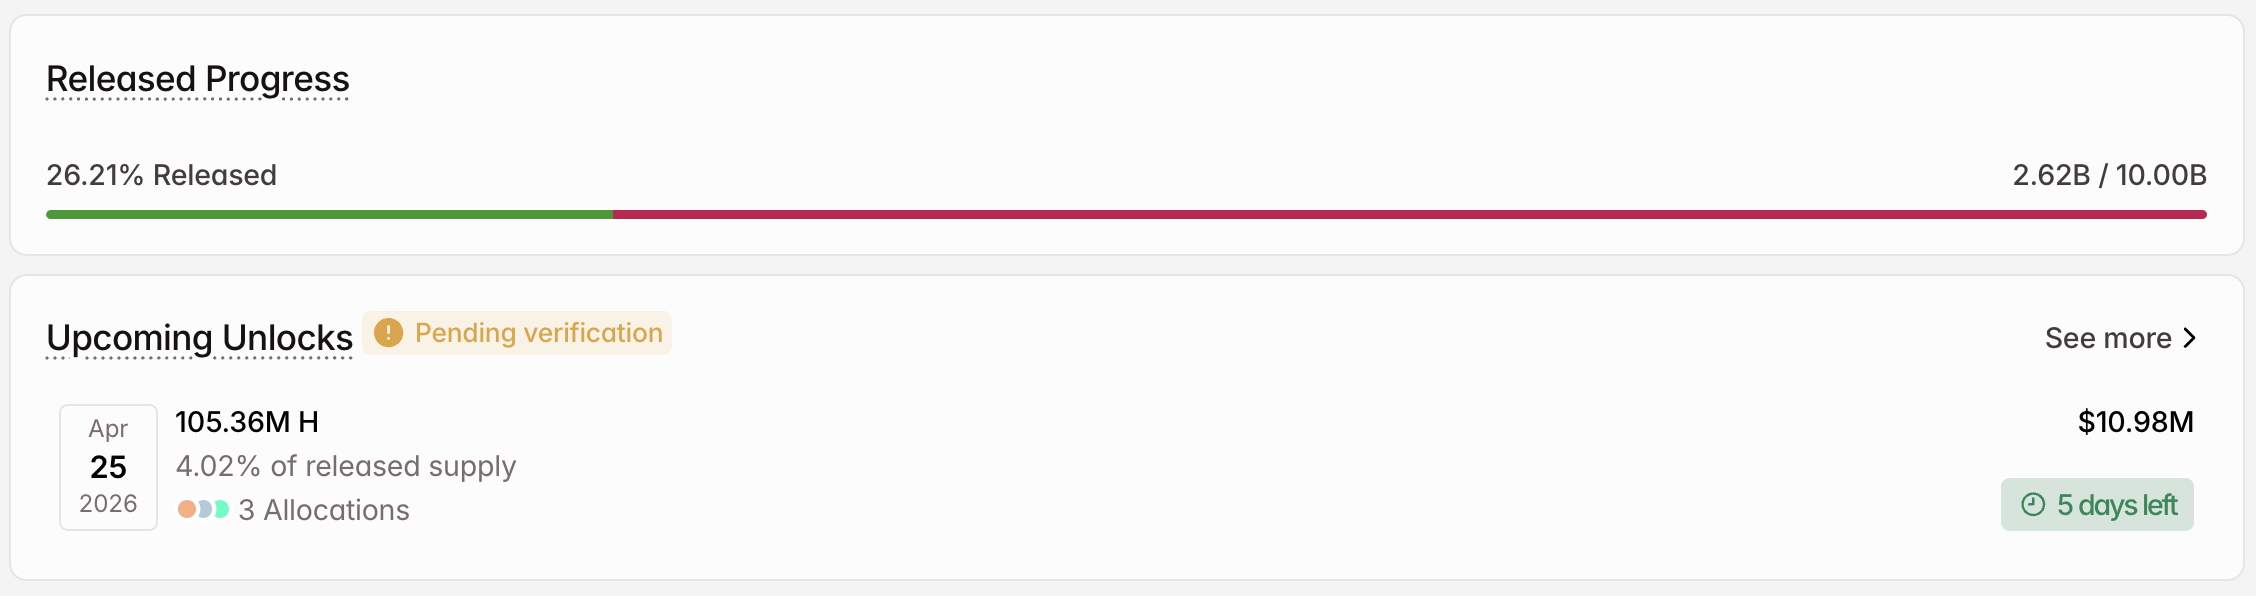
The team will split the released supply three ways. The ecosystem fund will receive 50 million H. Furthermore, Humanity will allocate 42.86 million altcoins to identity verification rewards and 12.50 million to the foundation operations treasury.
In addition to these, other prominent unlocks investors can look out for in the fourth week of April include Plasma (XPL), Kaito (KAITO), Soon (SOON), and more, which will contribute to the total market-wide releases.
The post 3 Token Unlocks to Watch in the Fourth Week of April 2026 appeared first on BeInCrypto.
“Passive income” is one of the most seductive phrases in crypto. It suggests a world where capital works harder than you do—where tokens quietly multiply while you sleep, and DeFi protocols function like automated ATMs for financial freedom.
That story sells well. It just doesn’t fully survive contact with reality.
In practice, most so-called passive income strategies in crypto are closer to low-intensity active management than true set-and-forget investing. The difference matters—because misunderstanding it leads to unrealistic expectations, poor risk management, and often, avoidable losses.
The Illusion of “Set It and Forget It”
At the surface level, decentralized finance (DeFi) offers compelling yield opportunities: liquidity provision, staking rewards, lending interest, and incentive programs. Many platforms market these as passive income streams.
But beneath the branding, these systems are dynamic, reactive environments. Yields shift constantly. Risk profiles change overnight. Incentives migrate between protocols like heat-seeking capital.
What looks passive is often just out-of-sight responsibility.
What “Passive” Actually Requires in Crypto
Even the most conservative DeFi strategies demand ongoing attention. Not occasionally—continuously.
1. Monitoring Liquidity Pools
Liquidity providers must track:
- fee generation vs. impermanent loss
- volume fluctuations
- incentive emissions
A pool that looked attractive yesterday can become inefficient today. Ignoring it doesn’t make it passive—it just delays the consequences.
2. Rebalancing Positions
Yield strategies often rely on shifting allocations between protocols or pools.
That means:
- moving capital when APYs change
- adjusting exposure across chains
- optimizing for gas fees vs. returns
In traditional finance, this would simply be called portfolio management. In crypto, it’s rebranded as “earning passively.”
3. Reacting to Depegs
Stablecoins are only “stable” until they aren’t.
When depegging events occur, users are forced into rapid decisions:
- exit liquidity positions
- unwind leveraged exposure
- assess contagion risk across protocols
Nothing passive about panic management.
4. Chasing Yield Migrations
Incentives in DeFi are rarely static. Capital flows toward higher yields, and protocols respond by:
- launching new reward programs
- ending old liquidity incentives
- shifting emissions schedules
Participants who don’t adapt get diluted. Those who do essentially become active yield hunters.
The Branding Problem: “Passive” as Marketing Language
Calling these strategies “passive income” is less a technical description and more a psychological one.
It lowers the perceived barrier to entry. It frames participation as effortless wealth accumulation. And it encourages users to underestimate both risk and workload.
A more accurate term might be:
Active income with automation and better UX.
That doesn’t make it bad. It just makes it honest.
Why the Myth Persists
There are three main reasons the “passive income” narrative survives:
1. Early-Stage Excitement
In bull markets, yields are high enough that mistakes feel profitable anyway. Attention to detail seems optional—until it isn’t.
2. Interface Simplicity
DeFi platforms abstract complexity into clean dashboards. When everything is one click away, it feels like nothing important is happening under the hood.
3. Incentive Design
Protocols compete for liquidity. Marketing “passive yield” is more effective than “ongoing portfolio management responsibilities.”
The Real Nature of Crypto Yield
Crypto income isn’t passive—it’s conditionally active.
You can reduce effort with automation, diversified strategies, and long-term positioning. But you cannot eliminate decision-making without also accepting higher risk exposure.
Even “lazy” strategies require:
- periodic review
- risk reassessment
- exit planning
In other words, you’re still in the game—you’re just playing at a slower tempo.
Conclusion: Reframing the Expectation
The idea of passive income in crypto isn’t entirely false—it’s just incomplete.
Yes, capital can be productive without constant manual trading. But productivity does not equal absence of responsibility.
A more grounded framing is this:
Crypto doesn’t eliminate work. It redistributes it into monitoring, adaptation, and risk awareness.
Or put less politely:
You’re not escaping effort—you’re outsourcing it to market conditions.
And the market never really stops working.
REQUEST AN ARTICLE

Key Highlights
- Brady Corporation has agreed to acquire Honeywell’s Productivity Solutions and Services (PSS) division for $1.4 billion in an all-cash transaction
- The PSS business recorded approximately $1.1 billion in annual revenue during 2025 and maintains a workforce of about 3,000 employees worldwide
- The transaction values PSS at around 8x its 2025 EBITDA multiple
- This divestiture represents another step in Honeywell’s strategic portfolio restructuring prior to its anticipated Aerospace business separation in the third quarter of 2026
- Brady anticipates the acquisition will deliver double-digit accretion to adjusted diluted earnings per share in year one, alongside $25 million in yearly cost savings achievable within three years
On April 20, 2026, Honeywell (HON) revealed its decision to divest the Productivity Solutions and Services division to Brady Corporation (BRC) through a $1.4 billion all-cash transaction.
The PSS division specializes in manufacturing mobile computing devices, barcode scanning equipment, and industrial printing technologies, primarily serving warehouse operations and logistics customers. The business unit generated approximately $1.1 billion in annual sales throughout 2025.
The acquisition price of $1.4 billion represents approximately 8 times the PSS division’s 2025 EBITDA performance. Transaction completion is anticipated during the latter half of 2026, contingent upon receiving necessary regulatory clearances.
Honeywell International Inc., HON
Vimal Kapur, Honeywell’s Chief Executive Officer, described the divestiture as an important milestone in executing the organization’s “multi-year portfolio transformation” strategy. The corporation continues advancing plans to separate into two distinct publicly traded entities — one concentrating on Aerospace operations, the other on Automation technologies.
The planned Aerospace business separation remains scheduled for the third quarter of 2026.
This transaction marks another in a series of recent divestitures by Honeywell. The corporation previously sold its Personal Protective Equipment division in 2024 and completed the spinoff of its Advanced Materials business as Solstice Advanced Materials (SOLS) during October 2025.
Additionally, Honeywell continues evaluating strategic alternatives for its Warehouse and Workflow Solutions operations, which encompass the Intelligrated and Transnorm product lines.
Strategic Expansion for Brady Corporation
For Brady, this acquisition represents a substantial strategic expansion. The Milwaukee-headquartered producer of identification solutions, signage, and workplace safety products is leveraging the PSS transaction to enter the data capture, mobile computing, and workflow automation markets.
Brady management projects the acquisition will generate double-digit accretion to adjusted diluted earnings per share during the first complete fiscal year following transaction closure. The organization has established a target of achieving at least $25 million in annual cost synergies within a three-year timeframe.
Following transaction financing, the deal is expected to elevate Brady’s pro forma net debt to EBITDA leverage ratio to approximately 2.5x — a metric that investors will monitor closely throughout the integration phase.
Transaction Structure and Expected Timing
The agreement is structured as an all-cash acquisition, with Centerview Partners serving as Honeywell’s financial advisor. Legal representation includes Kirkland & Ellis, Baker McKenzie, and Womble Bond Dickinson.
Transaction closure is projected for the second half of 2026, pending customary regulatory approvals and satisfaction of closing conditions.
PSS currently operates within Honeywell’s Industrial Automation business segment. Following deal completion, the unit will function under Brady’s corporate structure as a component of an expanded industrial productivity and safety platform.
Since 2023, Honeywell has disclosed approximately $14 billion in strategic acquisitions while concurrently divesting non-strategic assets. The PSS divestiture represents the most recent action in this comprehensive portfolio repositioning initiative.
Brady’s PSS acquisition incorporates roughly 3,000 employees and an established customer base spanning warehouse operations, logistics providers, and manufacturing facilities.
The transaction remains subject to regulatory examination, with integration execution and talent retention identified as potential challenges to achieving the forecasted synergy benefits.

Key takeaways
-
Mastercard is integrating stablecoins into its payment infrastructure to modernize the back-end settlement process, allowing banks and issuers to settle card transactions using regulated digital dollars such as SoFiUSD.
-
The partnership with SoFi Technologies enables SoFi Bank to settle Mastercard transactions in SoFiUSD, while Galileo’s platform allows other banks and fintech issuers to adopt stablecoin settlement.
-
Stablecoin settlement focuses on the post-transaction clearing stage, meaning consumers will continue using cards normally while the underlying settlement between banks may occur through blockchain-based digital assets.
-
By leveraging its Multi-Token Network (MTN), Mastercard aims to support multiple forms of tokenized money, including stablecoins, tokenized deposits and digital representations of fiat currencies.
Stablecoins are increasingly moving beyond the crypto niche and into mainstream financial discussions. A prime example is Mastercard’s move to integrate stablecoins into its card payment settlement process. Rather than abandoning the traditional card model, Mastercard is simply upgrading the back-end infrastructure by introducing regulated digital dollars into the mix.
By teaming up with SoFi Technologies, the payments giant is testing how these digital assets can streamline transaction settlements across its massive network. This initiative signals that the world’s largest payment rails are preparing for a future in which traditional banking and digital assets exist side by side.
The SoFiUSD partnership
Mastercard’s recent initiative involves a partnership with SoFi Technologies, which has introduced a dollar-backed stablecoin called SoFiUSD.
Under this arrangement, SoFi Bank, N.A. intends to use SoFiUSD to settle its Mastercard credit and debit card transactions. Meanwhile, SoFi’s payments infrastructure platform, Galileo Financial Technologies, will enable banks and fintech issuers on its network to opt for stablecoin settlement through Mastercard’s system.
SoFiUSD is issued by a nationally chartered US bank and is reported to maintain a 1:1 cash reserve structure, positioning it closer to bank-issued digital money than to a typical crypto-native asset.
Did you know? The first credit card to gain wide acceptance across multiple merchants was launched by Diners Club in 1950. Cardholders originally received paper statements and paid their bills monthly, laying the foundation for today’s global card payment networks.
Understanding card settlement
Mastercard’s approach makes more sense once you understand how card payments usually work. When a consumer taps or swipes their card, the following steps take place:
-
The payment is authorized.
-
The transaction is recorded.
-
The merchant receives confirmation.
-
The issuing and acquiring banks complete settlement at a later stage.
This final settlement phase traditionally occurs through conventional banking channels during designated clearing windows.
Mastercard’s stablecoin strategy targets this back-end settlement process specifically. It does not change how users experience or initiate payments. From the shopper’s perspective, the payment process would remain unchanged.
How stablecoin settlement would work
Through stablecoin settlement, Mastercard’s network would enable participating banks and issuers to meet transaction obligations using a digital dollar rather than relying solely on traditional fiat transfers.
In practice, the process could unfold as follows:
-
A customer initiates a card payment in their local currency.
-
Mastercard determines the settlement obligations between the issuing bank and the acquiring bank.
-
Instead of relying only on conventional banking channels, one or both parties may settle using stablecoins such as SoFiUSD.
Because stablecoins operate on blockchain infrastructure, they offer the potential for 24/7 settlement independent of traditional banking hours.
This method could reduce delays in cross-border payments and streamline liquidity management for financial institutions.
Did you know? The term “stablecoin” became popular around 2014, but the concept of digital dollars backed by real-world assets had been explored even earlier through experimental crypto projects that attempted to maintain price stability using collateral and algorithmic mechanisms.
The role of Mastercard’s multi-token network
The foundation of this initiative is Mastercard’s Multi-Token Network (MTN). It is designed to support multiple forms of tokenized money, including:
By bridging conventional banking systems with blockchain-based tokens, Mastercard seeks to create a versatile settlement ecosystem in which regulated digital assets can operate alongside traditional financial infrastructure.
The network would enable financial institutions to transfer value more efficiently while continuing to comply with established regulatory standards.
Why Mastercard is entering the stablecoin space
Stablecoins have become one of the fastest-growing parts of the digital asset market in recent years. They combine the price stability of fiat currency with the speed and efficiency of blockchain technology. As a result, they can support fast transfers, programmable payments and near-instant settlement across global networks.
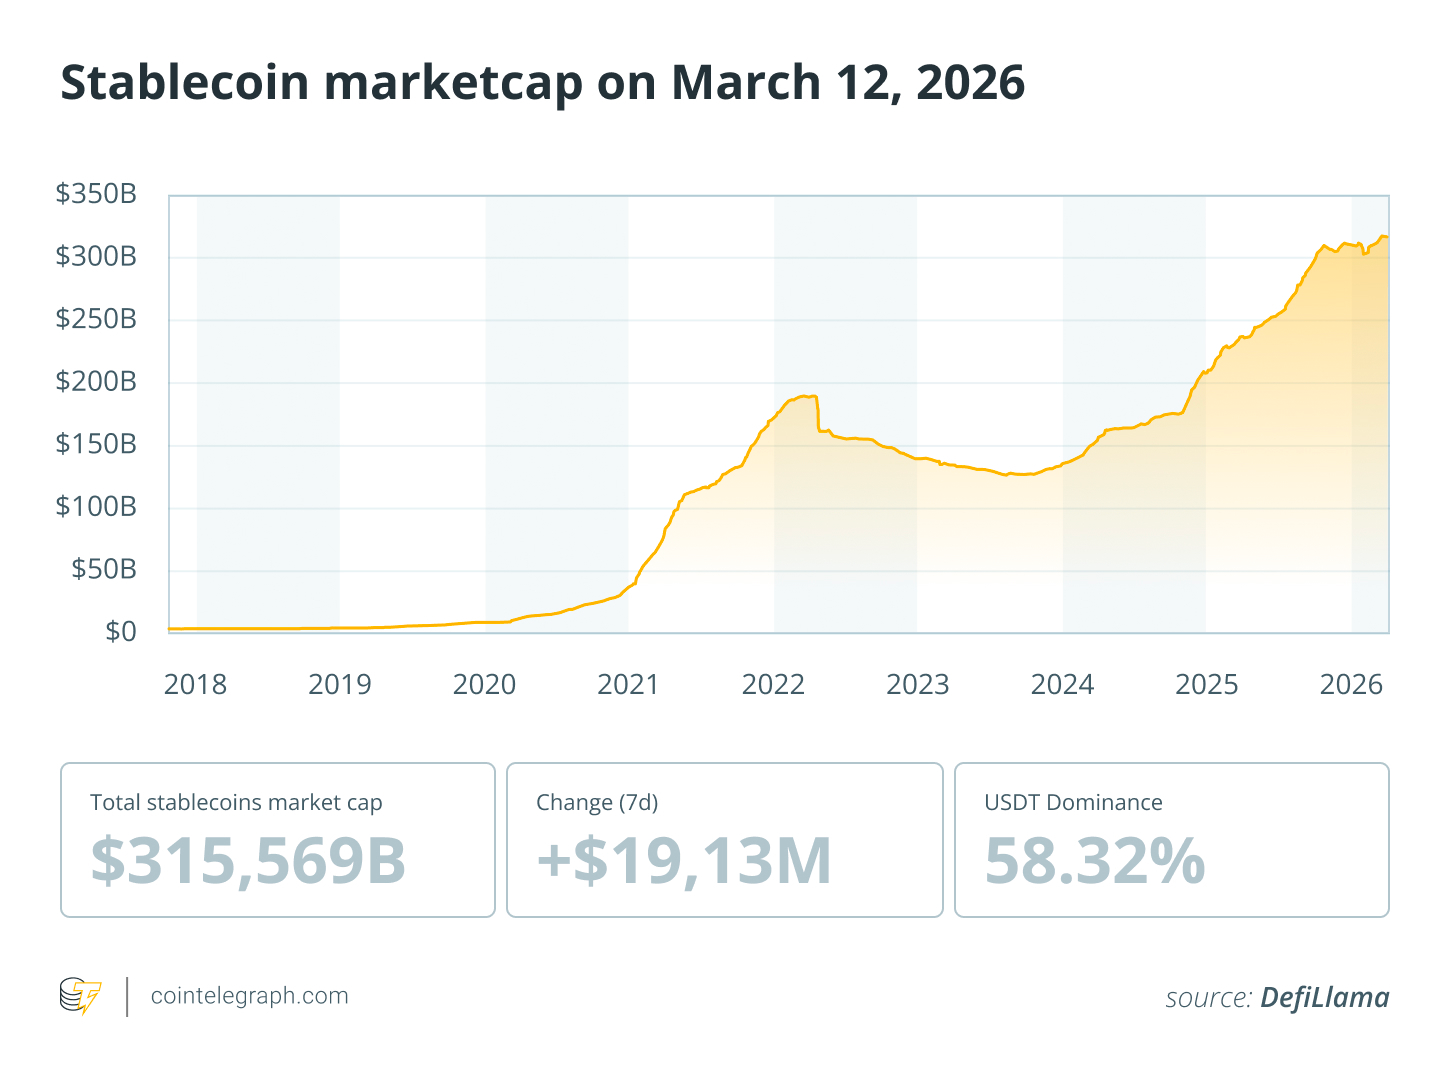
As of March 2026, the stablecoin market had reached a significant milestone, with its total valuation climbing to approximately $314 billion, according to DefiLlama data. This growth followed a breakout year in 2025, during which transaction volumes reached a record $969.9 billion in a single month. Experts now project that monthly volumes are on track to surpass the $1 trillion mark by the end of 2026.

For Mastercard, incorporating stablecoins into its settlement infrastructure helps ensure the company remains central to the changing digital payments ecosystem.
Rather than competing with blockchain systems, Mastercard is positioning itself as a connector between traditional finance and digital asset networks.
Expanding beyond simple payments
The partnership between SoFi and Mastercard also seeks to explore additional financial applications for stablecoins.
Potential uses include:
-
Cross-border remittances
-
Business-to-business payments
-
Treasury management tools
-
Stablecoin-linked card programs
Stablecoins could allow companies to automate complex financial workflows through programmable transactions.
For example, businesses could automatically release payments when contractual conditions are met, reducing manual intervention and operational costs.
Competition from Visa
Mastercard is not alone among global card networks in exploring stablecoin integration. Its main competitor, Visa, has also expanded its use of digital currencies for payment settlement.
Visa has tested cross-border settlement using stablecoins such as USD Coin (USDC), allowing financial institutions to pre-fund international transfers with tokenized dollars. The company has also explored enabling businesses to send payouts directly to stablecoin wallets.
These efforts suggest that stablecoins are becoming a key part of the broader infrastructure competition among leading payment networks.
Why regulation will be crucial
Adoption of stablecoins within mainstream financial systems depends heavily on regulation.
Financial institutions need clear regulatory frameworks that address key concerns, including:
Because SoFiUSD is issued by a regulated US bank, it is likely to inspire greater confidence among regulators and financial institutions than stablecoins that originate in the crypto space.
Payment networks such as Mastercard are therefore prioritizing regulated stablecoins issued by licensed institutions.
Did you know? Global card payment systems process tens of billions of transactions each year, with card networks handling thousands of payments per second during peak shopping periods such as Black Friday and major online retail events.
Challenges to widespread adoption
Despite growing interest, several challenges could limit the wider adoption of stablecoin settlement.
These challenges include:
-
Integration complexity for banks and payment processors
-
Regulatory differences across jurisdictions
-
Liquidity management between fiat and digital assets
-
Interoperability between blockchains and financial networks
Moreover, consumers are unlikely to notice major changes because the technology mainly affects back-end infrastructure rather than the front-end payment experience.
The bigger picture for digital payments
Mastercard’s stablecoin initiative is part of a broader transformation taking place in global finance. Stablecoins were initially used mainly for cryptocurrency trading. Today, they are increasingly viewed as potential tools for payments, remittances and broader financial infrastructure.
If stablecoin settlement proves efficient and reliable, card networks could eventually operate within a hybrid system that combines traditional banking rails with blockchain-based digital assets.
Mastercard is not looking to replace traditional payments. Rather, it is upgrading the under-the-hood infrastructure of global card networks. By integrating regulated stablecoins like SoFiUSD into its Multi-Token Network, the company is preparing its infrastructure for a more digital economy.
The goal is to create a system that is faster, more flexible and available 24/7, while ensuring the average shopper notices no difference at the checkout counter.
Cointelegraph maintains full editorial independence. Guides are produced without influence from advertisers, partners or commercial relationships. Content published in Guides does not constitute financial, legal or investment advice. Readers should conduct their own research and consult qualified professionals where appropriate.
Crypto World
Nearly $1 billion in bitcoin (BTC) ETF inflows power bull case as Kelp hack fuels DeFi jitters: Crypto Daily
Market dynamics continue to paint a bullish picture for bitcoin even as Iran-related developments and DeFi hacks dominate headlines.
U.S.-listed spot ETFs pulled in $663 million on Friday, the most since Jan. 15. Total inflows reached $996 million last week, up from $786 million the week prior, according to data source SoSoValue. This points to strong institutional interest in the largest cryptocurrency.
For a meaningful price rally to emerge, it’s a trend that needs to be sustained.
“ETF flow regimes provide a secondary read: Sustained inflows signal structural demand, while intermittent flows indicate tactical positioning, with consistency mattering more than magnitude,” said Timothy Misir, head of research at BRN, in an email.
Bitcoin is trading just above $75,000 after hitting highs above $78,000 on Friday, according to CoinDesk data. The prices has largely held steady over the past 24 hours. Similar patterns are evident in ether (ETH), XRP (XRP), Solana (SOL) and other major tokens.
DeFi platform Aave’s AAVE token has dropped 1% to $90 as the protocol faces collateral damage from the weekend hack of KelpDAO. The DeFi dominance rate, which measures the share of DeFi coins in the total crypto market value, has held flat at around 3%.
“The pressure on the leading cryptocurrency is linked to negative reactions in stock markets to news about Iran, which has reduced risk appetite. BTC has lagged significantly behind equities in recent days, building potential but not yet moving to realize it,” Alex Kuptsikevich, the chief market analyst at FxPro, said in an email.
According to the latest reports, the U.S. attacked and seized an Iranian cargo ship attempting to bypass restrictions on Iran’s ports.
Meanwhile, traders are actively building short positions, betting against a breakout. This could fuel a “short squeeze” if prices hold steady, forcing traders to cover bearish bets and potentially pushing spot prices higher. Stay alert!
Read more: For analysis of today’s activity in altcoins and derivatives, see Crypto Markets Today . For a comprehensive list of events this week, see CoinDesk’s “Crypto Week Ahead.”
What’s trending
Today’s signal

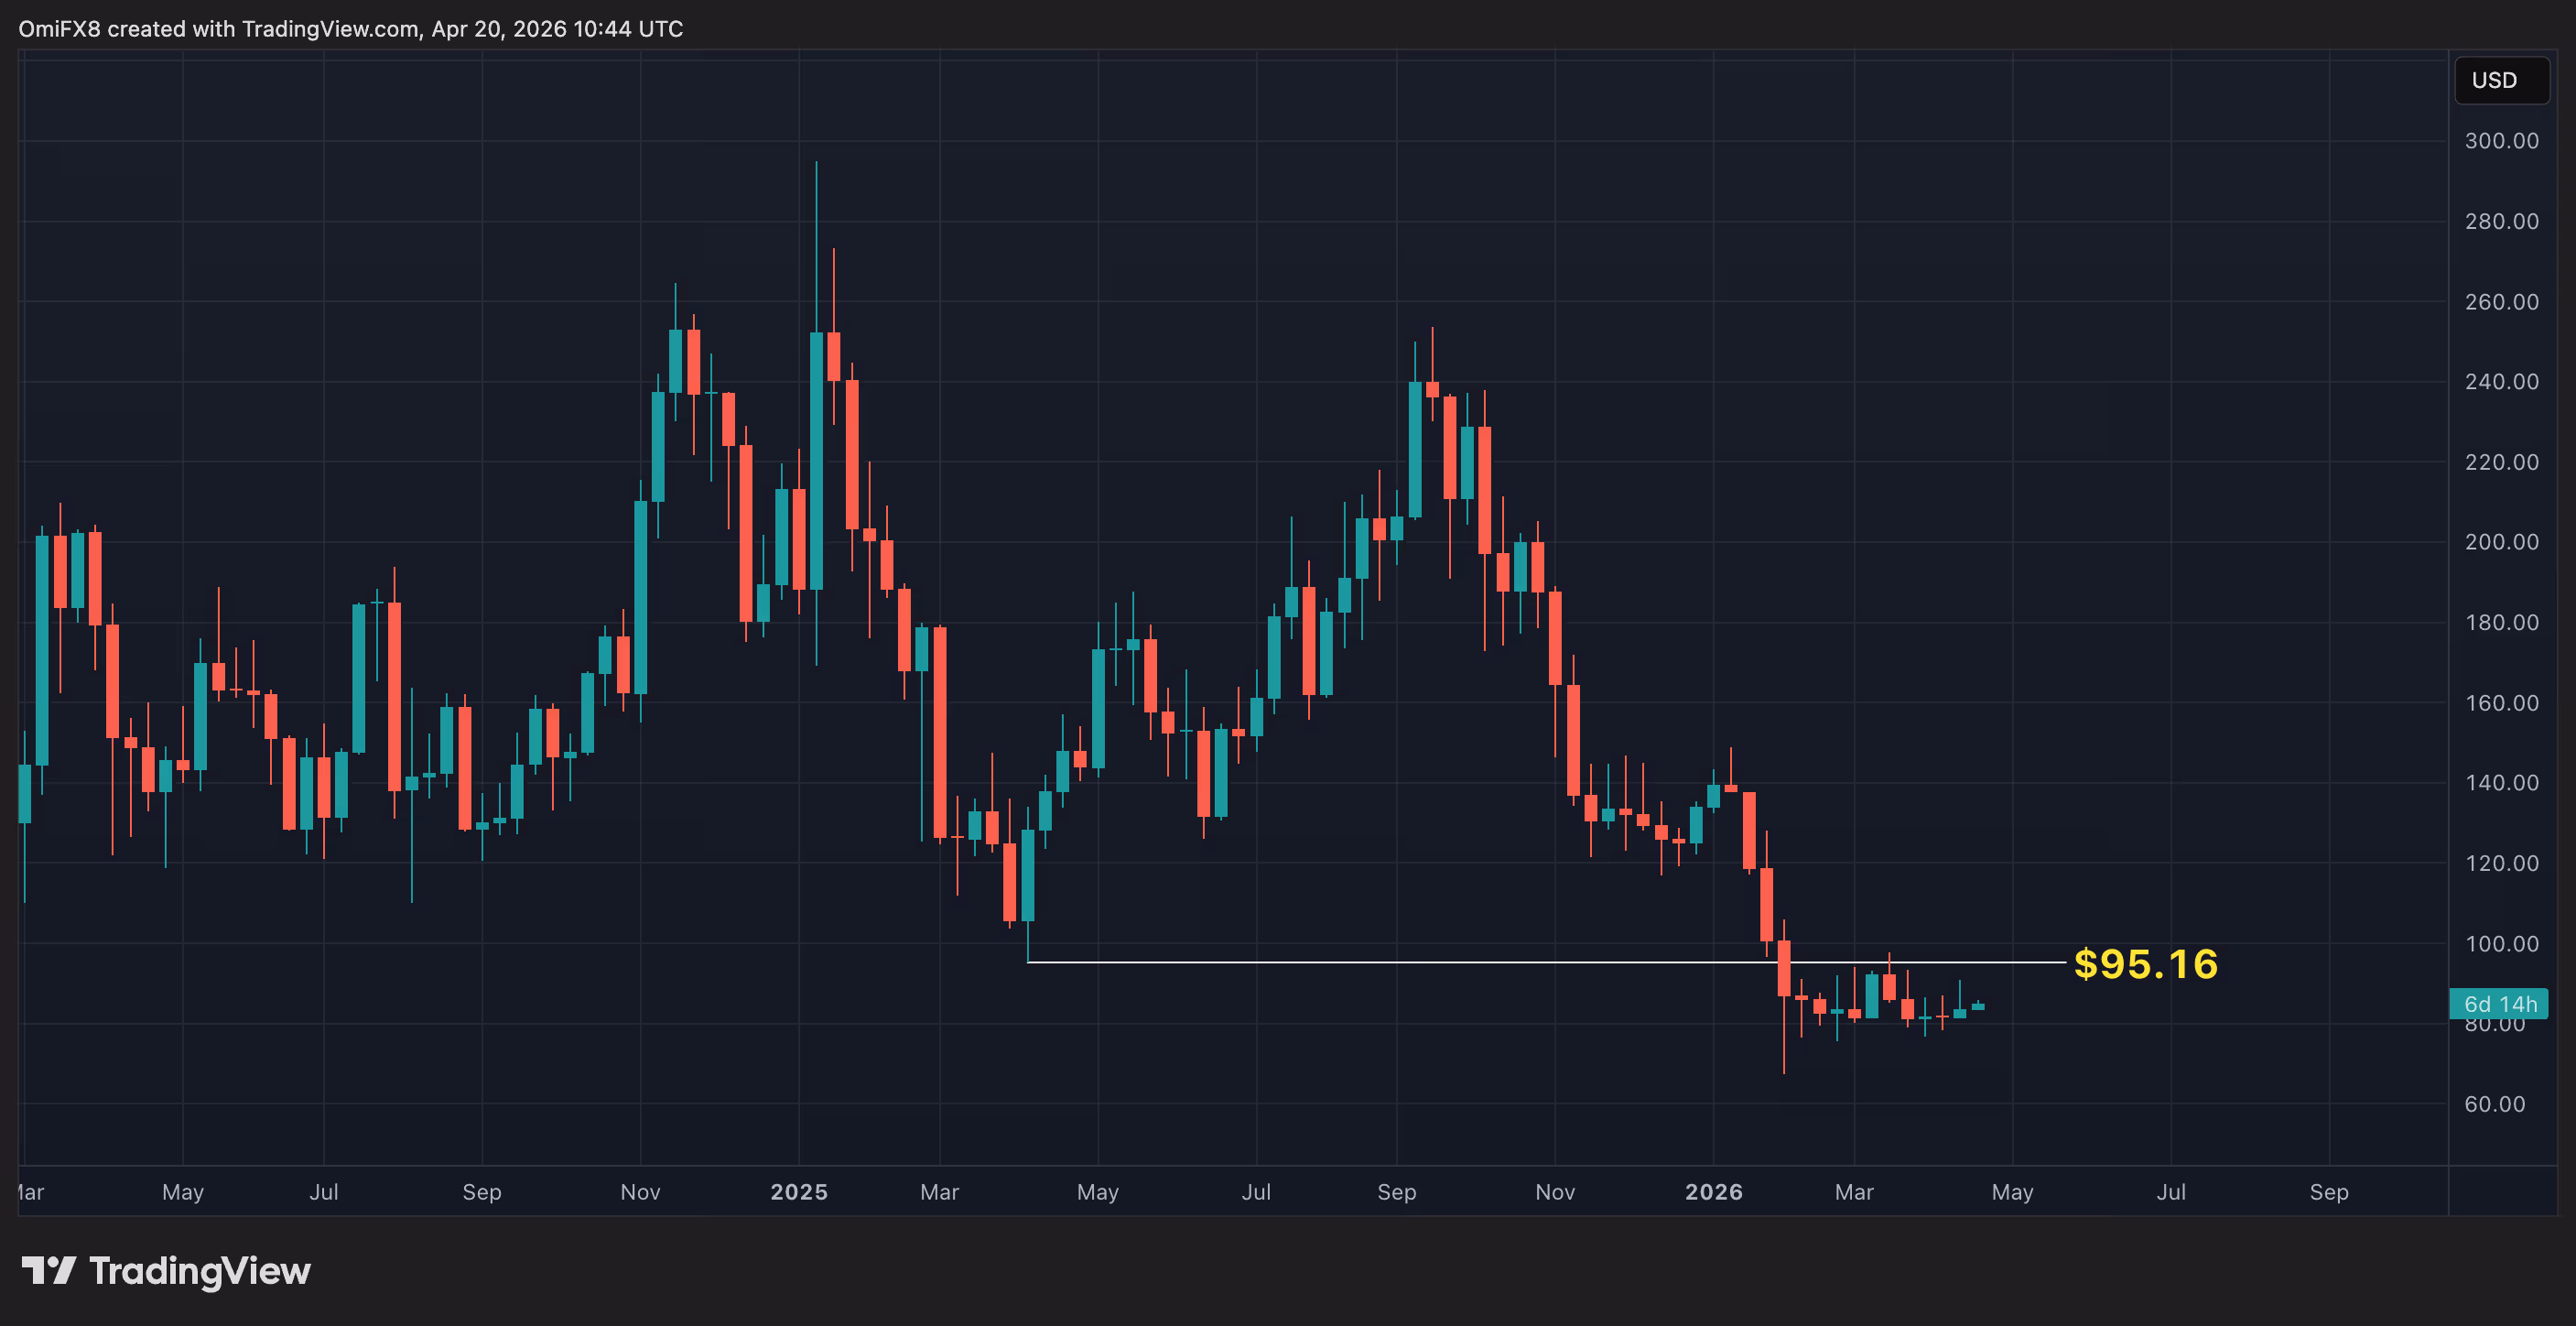
The chart shows weekly price swings in solana (SOL), with each candle showing a full week of trading activity, including the opening, closing, high and low prices.
One level stands out: $95.16, the low registered in April.
SOL has remained below that level for 11 consecutive weeks after dropping below it in early February. In technical analysis, a level that previously acted as “support,” a price floor where buying interest tends to emerge, often becomes “resistance” once it is broken. That means traders who previously bought around that level may now look to sell if prices revisit it, limiting upside momentum.
The fact that SOL has not yet climbed back points to a sustained bearish sentiment and potential for deeper losses. The next major support is seen directly at $50.
A strong move above that level, backed by a surge in trading volumes, is needed to invalidate the bearish outlook.

Mastercard is quietly upgrading its payments back-end by testing the use of regulated stablecoins to settle card transactions. The pilot, conducted in collaboration with SoFi Technologies and its Galileo platform, aims to move settlement between banks off traditional rails and onto digital dollars, while keeping the consumer checkout experience unchanged at the point of sale. The initiative centers on SoFiUSD, a dollar-backed stablecoin issued by SoFi Bank, N.A., and is positioned within Mastercard’s broader Multi-Token Network (MTN) vision for tokenized money.
As the industry watches the evolution of stablecoins from crypto-native instruments to mainstream settlement rails, Mastercard’s approach signals a strategic pivot: the networks that power card payments may increasingly rely on regulated digital assets to clear and settle transactions faster and with greater liquidity efficiency. The company’s plan also places it in a competitive stance with Visa, which has already piloted stablecoin-backed settlement capabilities for cross-border transfers and merchant payouts.
Key takeaways
- Mastercard is testing stablecoin-backed settlement, aiming to streamline the post-transaction clearing process across its global network.
- SoFi Bank, N.A. will use SoFiUSD to settle Mastercard credit and debit transactions; Galileo Financial Technologies will enable other banks and fintech issuers to participate in stablecoin settlement through Mastercard’s system.
- The initiative targets back-end settlement rather than altering the consumer payment experience, preserving the familiar card workflow at checkout.
- Mastercard’s Multi-Token Network is designed to support multiple forms of tokenized money, including stablecoins, tokenized deposits, and digital representations of fiat currencies.
- Regulatory clarity and cross-border liquidity considerations remain pivotal as stablecoins move toward mainstream financial infrastructure; market data in 2026 show a growing stablecoin sector with substantial transaction volumes ahead.
Back-end settlement reimagined
Behind the scenes, Mastercard’s approach reframes how settlement between issuing and acquiring banks could occur. When a consumer initiates a card payment, the traditional flow involves authorization, recording, merchant confirmation, and later settlement through standard banking channels. The new model concentrates settlement on the back-end, potentially using a regulated stablecoin such as SoFiUSD to fulfill the investment obligations between banks, rather than relying solely on fiat transfers.
Under this structure, a typical transaction would proceed as usual at the point of sale, but when the time comes to settle the obligation between the issuer and the acquirer, a stablecoin-based transfer could be executed. Stablecoins operate on blockchain infrastructure, offering the possibility of around-the-clock settlement that is not constrained by conventional banking hours. If successful, this could reduce settlement latency and improve liquidity management for financial institutions involved in card networks.
How stablecoin settlement would operate
In a practical sense, the workflow might look like this: a customer pays with a card in their local currency; Mastercard determines the net settlement obligation between the issuing bank and the acquiring bank; instead of exclusively relying on traditional rails, both parties could settle using a regulated stablecoin like SoFiUSD through the Mastercard system. SoFiUSD is issued by a federally regulated bank and is described as backed by cash reserves on a 1:1 basis, positioning it closer to bank-issued digital money than to a crypto-native asset.
Such a model aligns with a broader trend toward programmable, low-latency settlements that can cross borders and operate outside standard banking hours. While the user experience remains unchanged for the consumer, the underlying transfer of value between institutions could become more fluid and resilient in digital form.
MTN: A multi-token vision for payments
The backbone of this initiative is Mastercard’s Multi-Token Network, which is intended to support multiple forms of tokenized money. By bridging traditional financial rails with tokenized assets, MTN aims to create a versatile settlement ecosystem that can accommodate regulated digital currencies alongside conventional money. In theory, this could enable quicker cross-border movements, enhanced liquidity management, and greater interoperability between banks, card networks, and digital-asset infrastructure—without sacrificing regulatory compliance.
Why this matters for regulators, issuers, and users
Stablecoins have moved from niche crypto tools to a focal point of mainstream payments strategy. The appeal lies in their potential for fast, low-friction transfers and programmable payments, which could transform how businesses manage cash flows and how cross-border settlements operate. SoFi USD’s status as a dollar-backed instrument issued by a regulated bank is intended to help ease regulatory concerns, offering a more familiar framework for financial institutions wary of unbacked crypto exposure.
According to recent data, the stablecoin market has grown substantially. As of March 2026, the market’s total value stood around $314 billion, according to DefiLlama, reflecting growing adoption and increasing scale. The year 2025 also saw record activity, with monthly stablecoin transaction volumes approaching the trillions and market participants projecting that volumes could surpass $1 trillion per month by late 2026. These indicators help explain why payment networks are exploring stablecoin settlement as a means to improve efficiency and resilience in a rapidly digitizing ecosystem.
Competition and regulatory horizons
Mastercard is not alone in pursuing stablecoin-enabled settlement. Visa has already expanded its own stablecoin settlement capabilities, including cross-border transfers and merchant payout scenarios using tokenized dollars. This competitive dynamic underscores a broader shift in how the largest card networks view the future of payments: not as a replacement for traditional rails, but as an augmentation that leverages digital assets under a regulated umbrella.
Regulation remains a central determinant of how quickly and widely these innovations can be adopted. Banks and payment networks require clarity on issues such as reserve security, consumer protections, cross-border compliance, and interoperability with various blockchain ecosystems. SoFiUSD—issued by a chartered US bank—offers a regulatory-inclined path that other institutions may find more palatable as pilots scale.
Challenges on the path to wider adoption
Despite the promise, several barriers could temper the pace of adoption. Integration complexity for banks and payment processors stands out as a practical hurdle, along with regulatory variance across jurisdictions. Liquidity management between fiat and digital assets, and achieving seamless interoperability across different blockchains and legacy financial networks, are additional technical and operational considerations. Importantly, for most consumers, the transition will be invisible at the point of sale; the benefit will be measured in faster, more predictable settlement behind the scenes.
Broader implications for the payments landscape
Mastercard’s move fits into a wider evolution in digital payments. Stablecoins are increasingly seen as infrastructure components for remittances, business-to-business payments, treasury operations, and even stablecoin-linked card programs. If the current testing proves robust, card networks could evolve into hybrid ecosystems that blend traditional rails with blockchain-enabled settlement, delivering speed and efficiency without disrupting the familiar checkout experience.
Ultimately, the timing and scale of this transition will hinge on regulatory clarity, cross-border cooperation, and the ability of banks and issuers to integrate stablecoin settlement into complex, high-volume networks. The coming quarters are likely to reveal pilots, partner churns, and potentially early live deployments that will indicate how far such a back-end upgrade can take mainstream payments.
For investors and builders, the key takeaway is that stablecoins are moving from theory to execution within major payment rails. The attention now shifts to how regulators respond, how smoothly banks can onboard into MTN-enabled workflows, and how quickly other issuers and networks adopt similar back-end settlement architectures.
Watch closely for updates on pilot outcomes, regulatory milestones, and any additional partnerships that broaden the set of stablecoins approved for settlement across major networks. The next phase will reveal whether this is a scalable blueprint for faster, more resilient payments or a pilot with limited reach.


Digital asset investment products recorded $1.4 billion in net inflows last week, marking the strongest weekly total since January, according to CoinShares.
Summary
- Crypto investment products recorded $1.4 billion in inflows, the strongest weekly total since January this year.
- Bitcoin led with $1.116 billion, while Ethereum posted $328 million in weekly inflows globally.
- Total assets under management reached $155 billion as US-based products drove most fund demand.
Meanwhile, the latest reading also extended the streak of positive flows to three consecutive weeks. CoinShares said total assets under management rose to $155 billion during the period.
Weekly flows accounted for 0.91% of total assets under management, which the report described as the highest weekly intensity seen so far this year.
Bitcoin investment products attracted the largest share of the new money. CoinShares reported that Bitcoin funds recorded $1.116 billion in inflows last week, lifting year-to-date inflows to $3.1 billion.
The report said Bitcoin’s move above $76,000 during the week helped support market sentiment. CoinShares linked the stronger flows to improving risk appetite as ceasefire extension talks between the US and Iran continued. It also said March CPI data appeared to have had limited effect on investor positioning.
Additionally, Ethereum investment products posted $328 million in inflows, their strongest weekly result since January. That lifted Ethereum’s year-to-date inflows to $197 million and added to signs of improved demand for the asset.
At the same time, short-Bitcoin products saw just $1.4 million in inflows. This showed that some hedging demand remained in the market, but the scale stayed limited compared with the flows going into long digital asset products.
Regional flows show broad demand with one exception
The United States accounted for most of the weekly inflows. CoinShares said US-based products brought in $1.5 billion during the week, making the country the clear driver of global fund activity.
Germany also recorded positive flows, with $28 million in inflows. Switzerland moved in the opposite direction, posting $138 million in outflows. CoinShares said this was the largest outflow from Switzerland since November and stood out against the broader risk-on trend in digital asset markets.
Other assets posted weaker results than Bitcoin and Ethereum. The report said XRP and Solana products recorded outflows of $56 million and $2.3 million, respectively. Even so, the broader market picture remained positive as total weekly inflows reached their highest level in months.
Jen Psaki slams fellow Democrats for spending so much time thinking about 25th Amendment: ‘It’s not going to happen’

Car recall warning: could yours be at risk of fire?

Crypto Funds Post $1.4B Inflows as BTC Almost Touches $78K


-

 Crypto World7 days ago
The SEC Conditionalises DeFi Platforms to Be Avoided for Broker Registration
-

 NewsBeat6 days ago
Trump and Pope Leo: Behind their disagreement over Iran war
-

 Fashion3 days ago
Weekend Open Thread: Theodora Dress
-

 Crypto World7 days ago
SEC Signals Exemption for Crypto Interfaces From Broker Registration
-

 News Videos5 days ago
Secure crypto trading starts with an FIU-registered
-

 Sports3 days ago
NWFL Suspends Two Players Over Post-Match Clash in Ado-Ekiti
-

 Crypto World6 days ago
SEC Proposes Certain Crypto Interfaces Don’t Need to Register as Brokers
-

 Business21 hours ago
Powerball Result April 18, 2026: No Jackpot Winner in Powerball Draw: $75 Million Rolls Over
-

 Crypto World3 days ago
Russia Pushes Bill to Criminalize Unregistered Crypto Services
-

 Politics3 days ago
Palestine barred from entering Canada for FIFA Congress
-
 Business4 days ago
Creo Medical agree sale of its manufacturing operation
-

 Politics1 day ago
Zack Polanski demands ‘council homes not luxury flats for foreign investors’
-
 Entertainment6 days ago
Brand New Day’ Footage Reveals the Devastating Impact of ‘Now Way Home’
-
 Tech5 days ago
Microsoft adds Windows protections for malicious Remote Desktop files
-
 Entertainment6 days ago
Karol G’s ‘Ultra Raunchy’ Coachella Set Gave ‘Satanic Vibes’
-

 Crypto World3 days ago
Russia Introduces Bill To Criminalize Unregistered Crypto Services
-

 Sports7 days ago
Aaron Judge says Yankees need to ‘simplify’ approach amid offensive slump
-

 Entertainment7 days ago
How Babylon 5 Turned Brief Side Story Into Emotional Masterpiece
-
 Tech6 days ago
What was the first ransomware attack to demand payment in Bitcoin?
-

 Tech4 days ago
‘Avatar: Aang, The Last Airbender’ Leaked Online. Some Fans Say Paramount Deserves the Fallout
You must be logged in to post a comment Login