

Crypto World
SUI Drops 10% From Sunday’s High: What’s Behind the Pullback?
Sui (SUI) has slipped nearly 10% from Sunday’s high, raising questions about whether the altcoin’s recent rally is beginning to lose momentum.
The decline follows a sharp breakout that saw SUI surge almost 40% over the past week, making it one of the market’s top-performing altcoins.
SUI Staking Powered the Rally
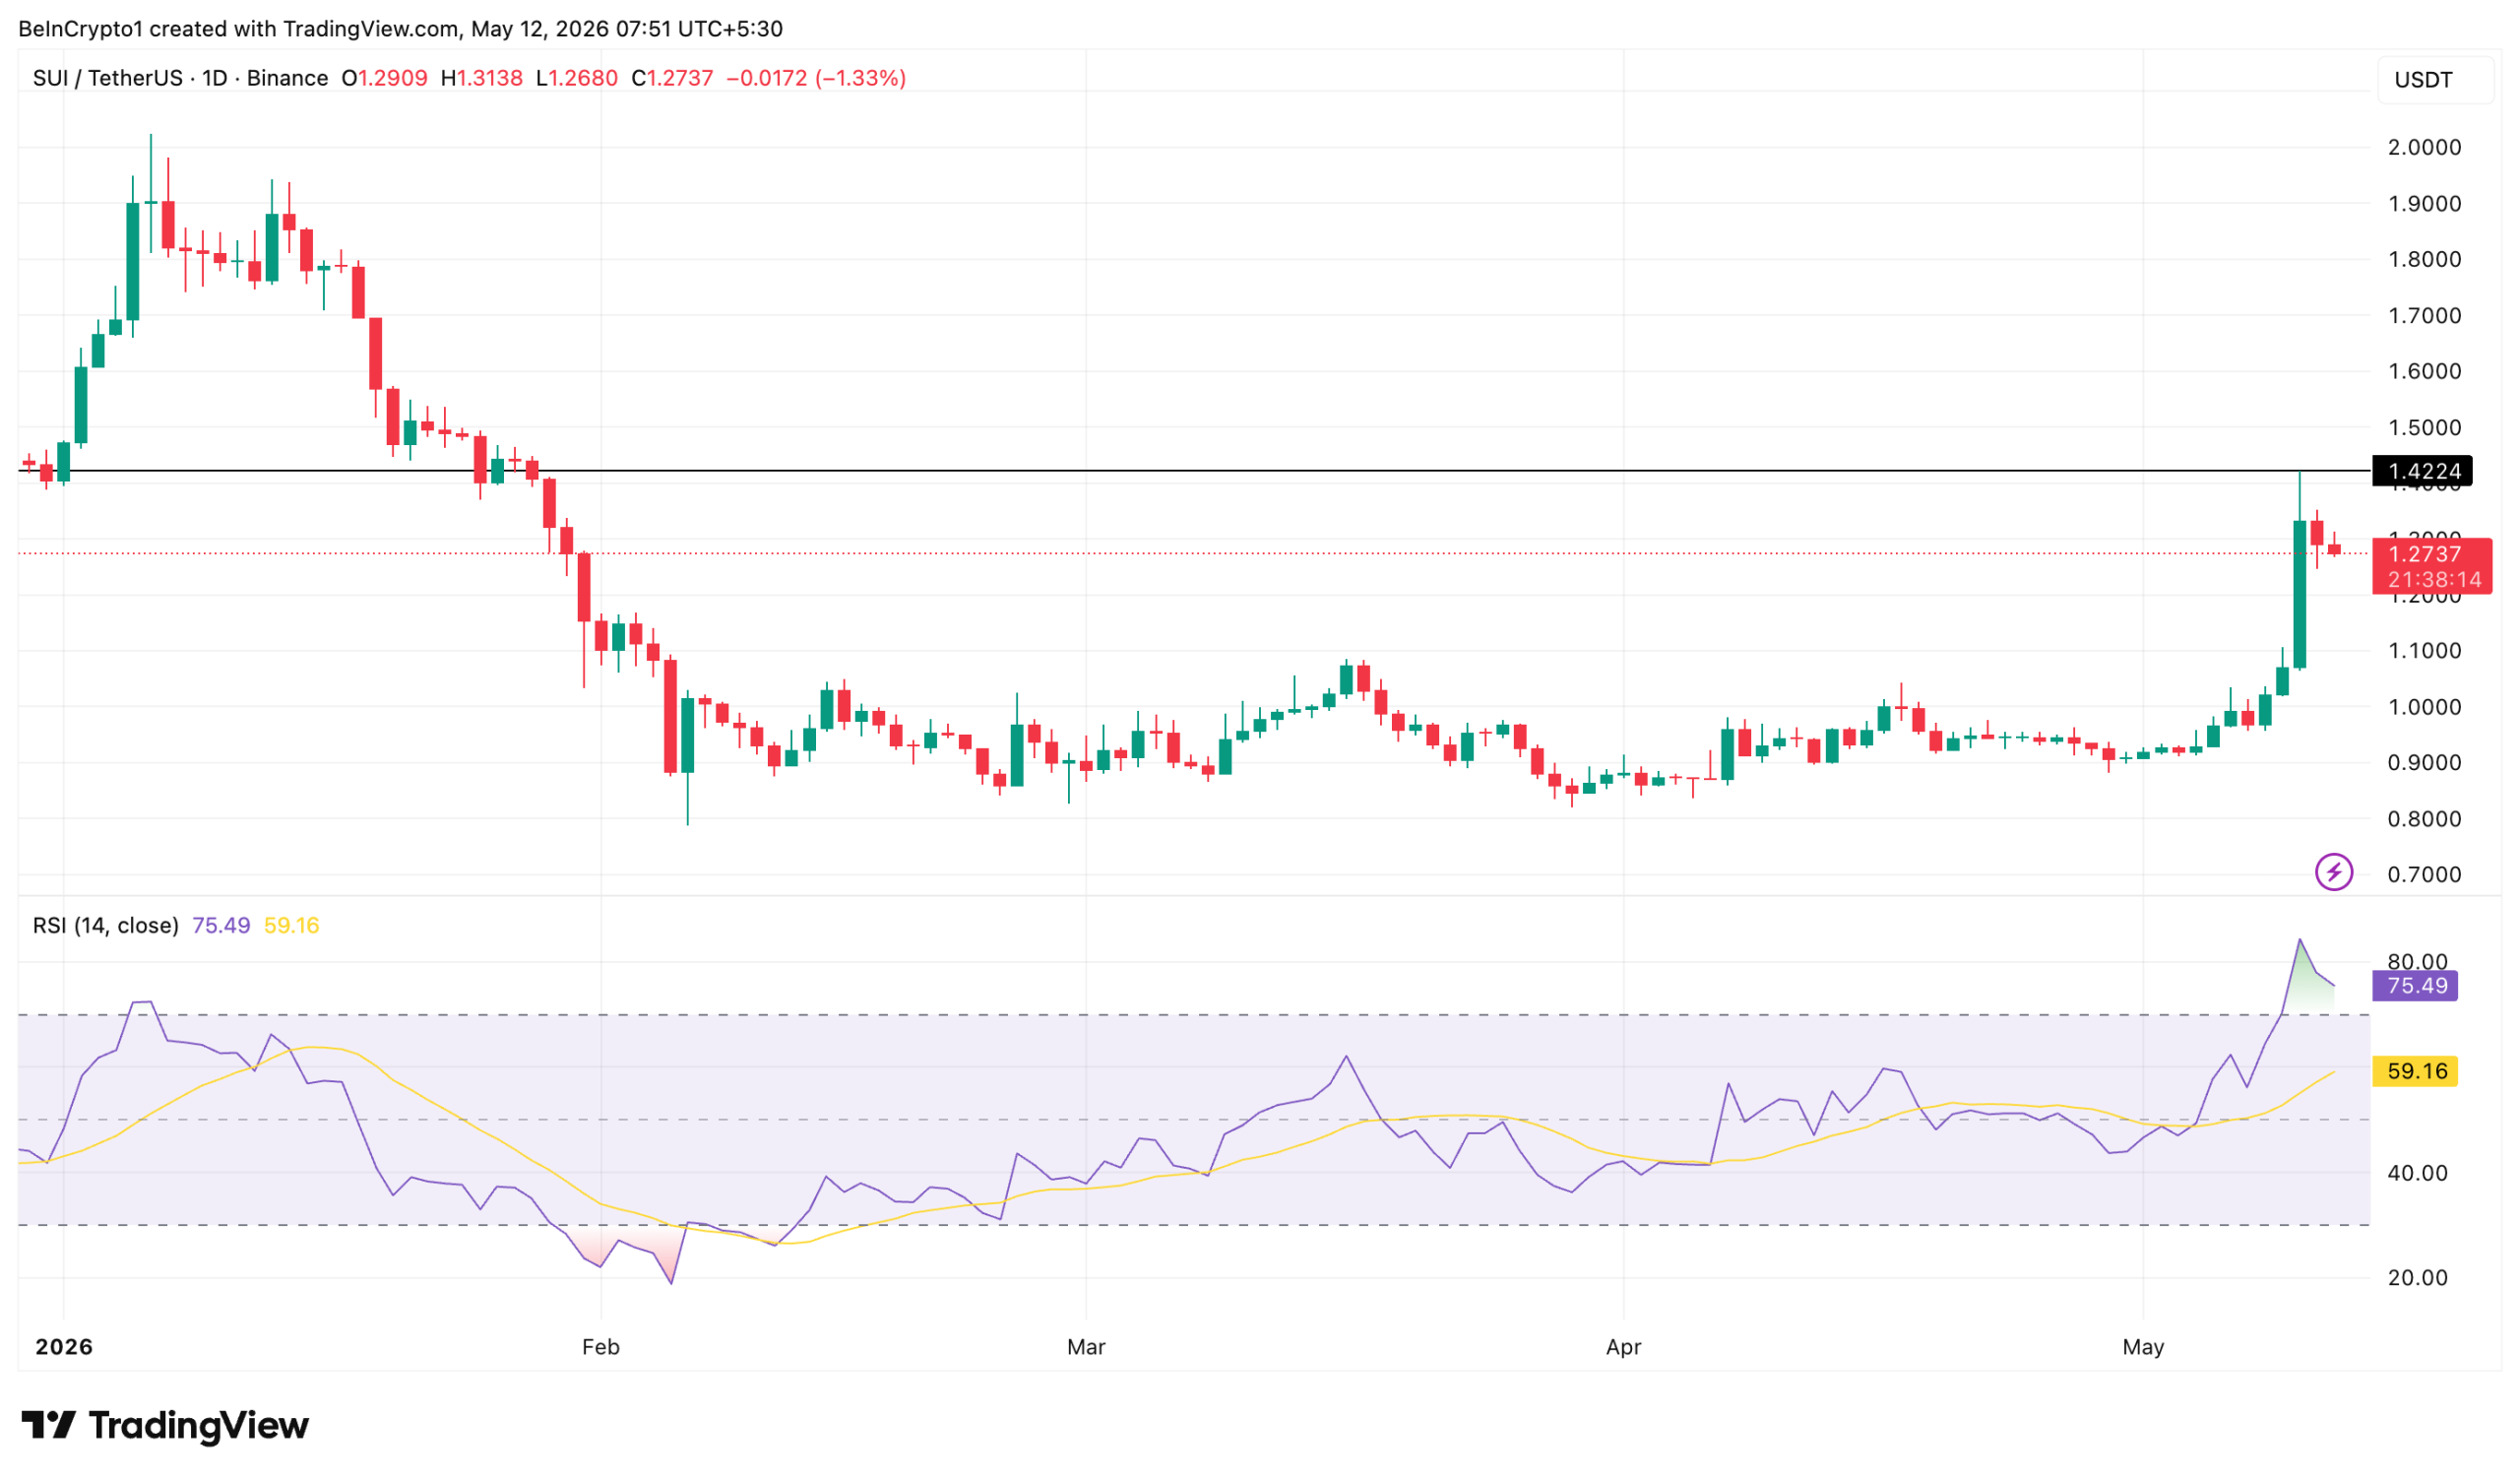
Market data revealed that SUI climbed to an intraday high of $1.42 on Sunday, its highest level since late January, before retreating. A key catalyst came from SUI Group Holdings.
The firm revealed that it had expanded its treasury holdings to 108,728,129 SUI. It added that “substantially all” of those holdings are now staked at an estimated 1.8% yield. The shift pulled another 2.7% of supply off the liquid market.
“Two more catalysts compounding: CME Group SUI futures launching May 29 (only the fifth L1 with regulated derivatives access), and Paga partnership for cross-border African payments,” Santiment said.
Follow us on X to get the latest news as it happens
What’s Behind SUI’s 10% Price Drop
Despite the strong rise, SUI pulled back. At press time, the altcoin traded at $1.273, down 4% over the past 24 hours and nearly 10% below Sunday’s peak.
The correction came after SUI’s Relative Strength Index (RSI) surged into heavily overbought territory at 84.4 before cooling to 75.94, suggesting the pullback may reflect a natural market reset following rapid gains.

The broader crypto market also weakened, with total market capitalization slipping 0.33% over the past day amid losses across several altcoins.
“RSI hit 84 yesterday. That’s deeply overbought. A cooldown was inevitable. The broader market also shifted risk-off today. $680M in outflows from BTC and ETH into stablecoins. SUI didn’t dump alone — the whole market did,” an analyst wrote.
Network Activity Continues to Strengthen
Meanwhile, on-chain activity within the Sui Network ecosystem remains strong. DefiLlama data showed that the total value locked (TVL) climbed to around $653 million, up from roughly $541.9 million at the start of May.
Stablecoin supply on the network also rose 4.5% over the past week, while decentralized exchange volumes jumped over 200%.
Santiment further noted that SUI’s social dominance during the rally ranged between 0.13% and 0.15%, still below the 0.38% spike recorded on May 6.
“The conversation isn’t outrunning the price. Institutional supply locks driving a rally look different on-chain than retail FOMO,” the post added.
Nonetheless, SUI remains roughly 76% below its all-time high and continues to trade below its early-2026 peaks, keeping the token in negative year-to-date territory.
Therefore, whether SUI reclaims its January peak depends on investor demand and corporate treasury inflows outpacing monthly token unlocks. Continued network growth and sustained buying pressure could determine the strength of the next move higher.
Subscribe to our YouTube channel to watch leaders and journalists provide expert insights
The post SUI Drops 10% From Sunday’s High: What’s Behind the Pullback? appeared first on BeInCrypto.


Ark Invest bought $5.5 million worth of shares in Circle Internet (CRCL) on Monday as the stablecoin developer’s stock pumped following its first-quarter earnings report.
The St. Petersburg, Florida-based investment manager added 41,904 shares across three of its exchange-traded funds (ETFs): Innovation (ARKK), Next Generation Internet (ARKW) and Blockchain and Fintech Innovation (ARKF).
CRCL shares rose 16% to $131.76, the highest closing price since March 18, after the company posted estimate-beating earnings per share (EPS) of 21 cents.
Circle, whose USDC is the second-largest stablecoin, also revealed a $222 million raise for its Arc blockchain in a presale of the ARC token.
The purchase is Ark’s first of Circle stock since March 24, when it bought $16.3 million worth as the shares slumped 20%. It last sold CRCL on April 17, dumping $1.2 million worth on a day the stock closed at around $106.
The Cathie Wood-led company frequently buys into weakness in equities to capture greater value and rebalance the weighting of its ETFs. It is less common to see sizeable purchases that coincide with large share-price gains.


Galaxy Digital (GLXY) and Sharplink (SBET) are teaming up to put part of the latter’s staked ETH treasury into decentralized finance (DeFi) strategies.
The Galaxy Sharplink Onchain Yield Fund would receive $100 million from Sharplink’s staked ETH treasury and $25 million from Galaxy, the companies said.
Galaxy is set to manage the investment, which is expected to commence in the coming weeks under a non-binding memorandum of understanding.
The strategy will see capital deployed across DeFi liquidity protocols and other onchain yield strategies. The structure is designed to keep Sharplink’s core ETH exposure intact while adding an active yield strategy to its balance sheet.
Sharplink holds 872,984 ETH, according to separate first-quarter results. The company has generated 18,800 ETH in staking rewards since launching its ether treasury strategy in June 2025, the firm said.
The allocation is small relative to Sharplink’s ETH stack but large enough to mark a shift in the treasury model. At recent prices, $100 million equals roughly 43,000 ETH.
Bitcoin price slipped back toward the $81,000 region on Monday as weakening U.S. institutional demand and renewed geopolitical uncertainty triggered another wave of profit-taking across the crypto market.
Summary
- Bitcoin price fell back toward the $81,000 region after another rejection near the $82,000 resistance zone amid rising geopolitical uncertainty.
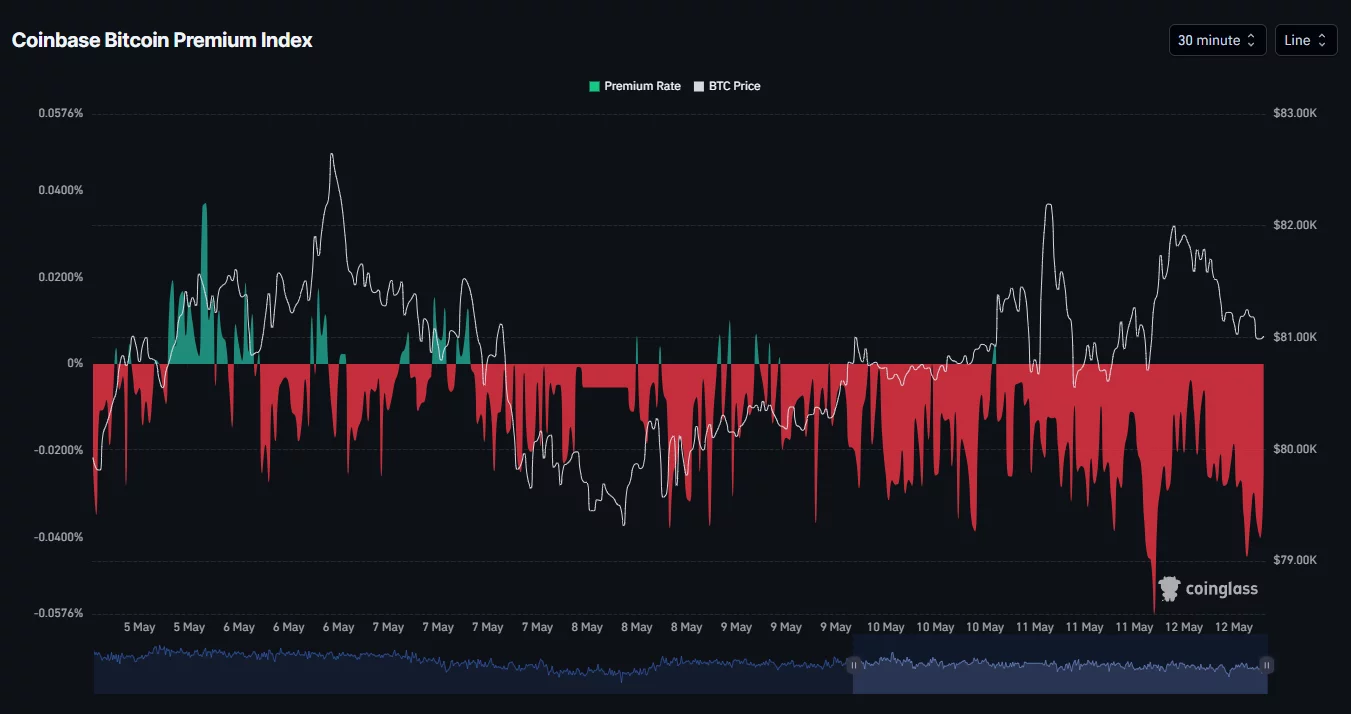
- The Coinbase Bitcoin Premium Index remained negative, signaling weaker buying demand from U.S. institutional investors in recent sessions.
- Technical indicators showed BTC still trading inside an ascending channel, though weakening MACD momentum raised risks of a retest below the $80,000 support level.
According to data from crypto.news, Bitcoin (BTC) traded around $80,900 at press time on May 12 after briefly falling toward an intraday low near $80,700. The pullback followed another failed breakout attempt above the key $82,000 resistance zone, where sellers continued aggressively defending upside momentum.
One of the biggest bearish signals came from the Coinbase Bitcoin Premium Index, which remained deeply negative throughout the past several trading sessions. The metric measures the price difference between Bitcoin on Coinbase and offshore exchanges such as Binance and is commonly used as a proxy for U.S. institutional demand.

The persistent negative reading suggests that buying activity from U.S.-based investors has weakened considerably, even as Bitcoin attempted to stabilize above major support levels.
Market sentiment also deteriorated after reports indicated that U.S. President Donald Trump rejected a recent peace proposal from Iran, calling the offer “totally unacceptable.” The development renewed concerns that tensions between the two nations could escalate further, pushing investors away from risk assets like cryptocurrencies.
The geopolitical uncertainty triggered another rise in risk-off sentiment across global markets while oil prices remained volatile following the latest developments surrounding the conflict.
At the same time, traders continued locking in profits after Bitcoin’s recent rally toward the $82,700 region. Some analysts have also started warning that the latest rebound could potentially resemble a dead cat bounce following Bitcoin’s strong recovery from February lows.
Institutional flows have additionally shown signs of cooling in recent sessions. Spot Bitcoin ETFs reportedly recorded roughly $350 million in outflows during a recent 48-hour period, weakening short-term bullish momentum as markets repositioned around the weekly CME gap.
Bitcoin price analysis
On the daily chart, Bitcoin price continues trading inside a broader ascending parallel channel structure that has remained intact since late March. The bellwether recently touched the upper boundary of the channel before facing rejection near the $82,000 resistance region.
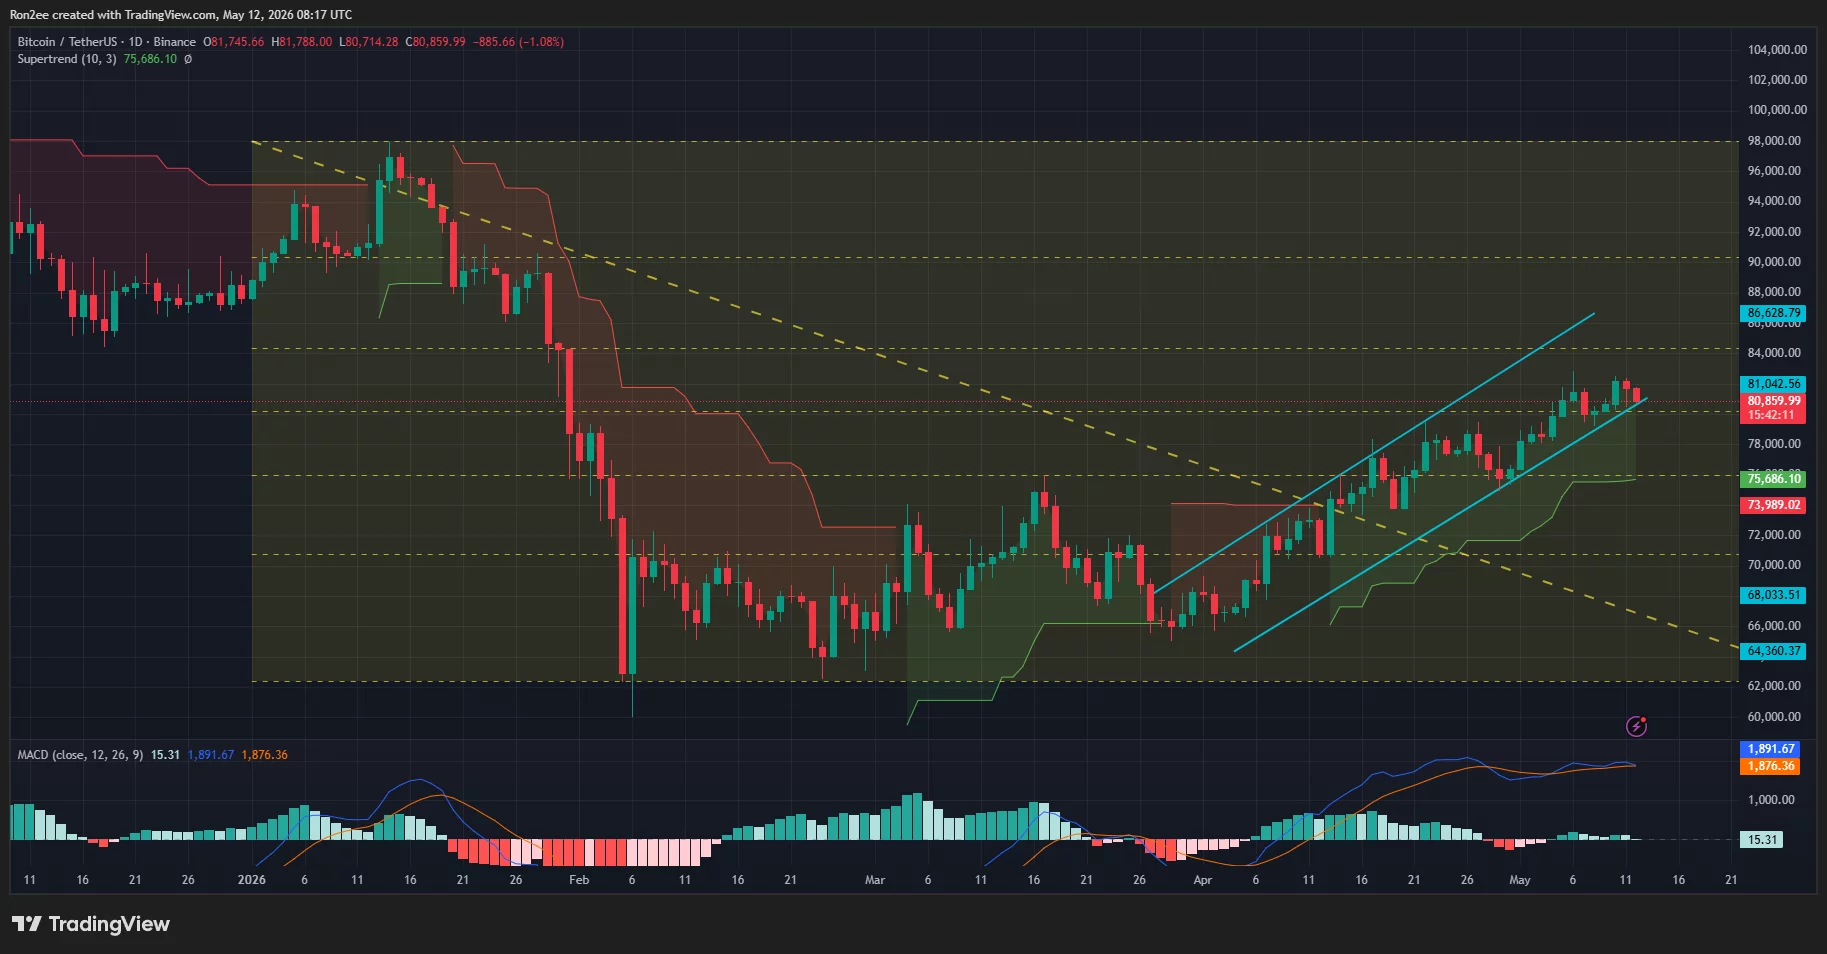
The chart also shows BTC struggling to sustain momentum above the key 0.786 Fibonacci retracement level near $80,000, a zone that continues acting as an important psychological battleground between bulls and bears.
Despite the recent pullback, Bitcoin still remains above the Supertrend support level near $75,600, indicating that the broader bullish trend structure has not yet fully broken down.
Meanwhile, the MACD remains in positive territory, although the histogram has started flattening considerably over recent sessions, suggesting bullish momentum may be weakening as buyers lose short-term control.
If selling pressure intensifies further, Bitcoin could retest the lower boundary of the ascending channel near the $80,000 psychological support zone. A decisive breakdown below that level could expose BTC to deeper downside toward the $76,000–$77,000 region.
On the upside, bulls would need to reclaim the $82,000 resistance area to restore bullish momentum and potentially reopen the path toward the next major resistance near $84,000.
Disclosure: This article does not represent investment advice. The content and materials featured on this page are for educational purposes only.
Crypto World
Anthropic warns against unauthorized stock exposure as token markets imply trillion-dollar valuation


Anthropic, the AI company behind Claude, is warning investors that tokenized products claiming to offer access to its private shares may be invalid, escalating a fight over whether restricted pre-IPO stock can be repackaged for retail traders.
In an updated investor-warning page first published in February, Anthropic said any unapproved sale or transfer of its stock, or any interest in its stock, is void and will not be recognized on its books.
“We do not permit special purpose vehicles (SPVs) to acquire Anthropic stock and any transfer of shares to an SPV are void under our transfer restrictions. Offers to invest in Anthropic’s past or future financing rounds through an SPV are prohibited,” the company wrote on an updated warning page. “This means that if someone purports to sell Anthropic shares without proper board approval, that transaction is invalid.”
It added that any third party claiming to sell Anthropic shares to the general public through direct sales, forward contracts, “tokenized securities,” or other mechanisms is likely either engaged in fraud or offering an investment that may have no value due to our transfer restrictions.
Over the past year, several crypto exchanges have set up offerings for pre-IPO exposure to some of the hottest tech companies on the planet, such as Anthropic, SpaceX, and Polymarket. However, not all offerings are the same.
Some are synthetic pre-IPO perpetuals, where no underlying shares are necessarily held, and traders are simply betting on a reference price tied to a private company’s implied valuation. Those instruments may not directly violate a company’s stock-transfer restrictions because no shares move, but they leave users with a derivative claim rather than equity exposure.
By contrast, products offering private market exposure through special purpose vehicles (SPVs) or secondary-market holdings, such as PreStocks’ tokenized single-asset offerings or the Robinhood Ventures Fund I, are closer to tokenized private-share exposure.
PreStocks’ terms of service state that buyers receive no equity or shareholder rights in the underlying company, only economic exposure tied to reserve backing, However, it does not specify whether this exposure is delivered through a special purpose vehicle, leaving uncertainty around the exact structure behind its Anthropic-linked tokens, which the company says may be invalid.
That model may be more intuitive to investors, but it also runs more directly into the restrictions private companies place on who can buy, sell or hold interests in their stock.
John Montague, a Florida-based crypto lawyer, previously told CoinDesk that private companies may challenge these structures.
“I think private companies may also initiate lawsuits alleging that this violates their governance documents, shareholders’ agreements, investor rights agreements, or bylaws,” he told CoinDesk last year. “I view it as the issuer’s right to control the terms of transfer.”
Aside from unauthorized stock transfers, another headache these markets create for companies is valuation. Tokenized markets can generate eye-popping implied price tags that appear to be legitimate public price discovery, even when the underlying liquidity is relatively small.
PreStocks’ dashboard recently showed that Anthropic had an implied valuation above $1.5 trillion and a market valuation of around $1.37 trillion, despite the platform holding roughly $23 million in total assets.
For private companies that raise capital through negotiated funding rounds rather than public markets, this creates a real narrative risk. Speculative token prices can begin to shape investor expectations and headlines about valuations beyond the company’s control.
Crypto exchange Binance says its artificial intelligence-based security tools have helped prevent the loss of more than $10 billion worth of user funds from scams and fraud between 2025 to March 2026.
Binance said in a blog post on Monday that it had protected more than 5.4 million users from fraud between the first quarter of 2025 and the first quarter of 2026 after rolling out over 24 AI-driven initiatives and more than 100 models.
“AI-powered scams and exploits are accelerating,” Binance said. “The barrier to entry for scam perpetrators is falling fast, with AI accelerating the drop. What once required technical expertise can now be executed for next to nothing and at scale.”
Scams and exploits have plagued crypto as highly organized threat actors have adopted AI to create more sophisticated attacks. The FBI reported in April that US citizens lost $11 billion worth of crypto to scams, with the impersonation of government officials or crypto companies being a key avenue used to dupe victims.
“AI is amplifying social engineering at an unprecedented level, powering deepfakes, phishing bots, fake platforms, voice cloning and impersonation across chat applications, exploiting trust and urgency,” Binance said.
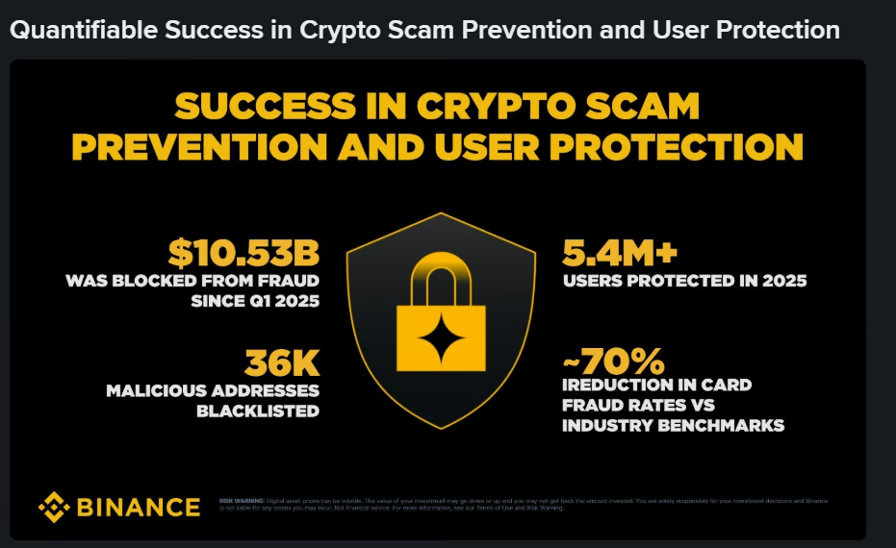
Binance said that over the 15 months to March, it prevented $10.53 billion worth of user funds and blacklisted 36,000 malicious addresses via the integration of AI with its security protocols.
Related: DeFi can freeze stolen funds, but not everyone agrees it should
In the first quarter of 2026 alone, the exchange said it “intercepted 22.9 million scam and phishing attempts,” saving $1.98 billion worth of user funds.

Binance’s efforts to stop AI scams. Source: Binance
Binance said it has implemented computer vision to detect fake payment proofs and real-time language analysis to detect scam patterns, while also integrating the technology on the identity verification side to counter “increasingly sophisticated deepfakes and synthetic identities.”
“AI-driven decisioning now powers 57% of fraud controls, contributing to a 60-70% reduction in card fraud rates compared to industry benchmarks,” Binance said.
Magazine: AI-driven hacks could kill DeFi — unless projects act now
Credit spreads are among the most popular strategies for generating consistent income with defined risk. The challenge is rarely understanding how they work. It is finding good candidates in a market with thousands of tickers and constantly shifting volatility. An option scanner built for multi-leg strategies changes this process entirely, replacing hours of manual searching with structured, repeatable workflows.
This guide explains how traders can use an options screener to identify credit spread opportunities that align with their outlook, risk tolerance, and income goals.
Why Credit Spreads Deserve a Screening Workflow
A credit spread involves selling one option and buying another at a different strike price, both on the same underlying and with the same expiration. The seller collects a net premium upfront and profits when the underlying stays within a defined range. The two most common types are the bull put spread, used when the outlook is neutral to bullish, and the bear call spread, used when the outlook is neutral to bearish.
The concept is straightforward, but execution depends heavily on the quality of the underlying stock, the pricing of the options, and how volatility is behaving at the time. A good-looking spread on a weak company or during a period of compressed volatility can quickly become a losing trade, even if the direction is right.
This is where using an easy to use options scanner adds value. Rather than browsing individual tickers and checking each one manually, an options screener filters the entire market based on the conditions that matter most for credit spread success: probability of profit, annualized return, spread width, volatility levels, and company quality.
What to Look for When Screening Credit Spreads
Probability of profit is often the first filter traders apply. A high probability of profit means the short strike is positioned far enough from the current price to give the trade room to work. Most options screeners allow filtering by delta or probability, letting traders set a minimum threshold before any results appear.
Annualized return matters because it normalizes the income across different expirations. A spread that returns 2% in 10 days looks different from one that returns 3% in 45 days when both are annualized. Filtering by annualized return helps compare setups on a level playing field.
Implied volatility context is equally important. Credit spreads are premium-selling strategies, and selling premium works best when implied volatility is elevated relative to its own history. Using IV Rank or IV Percentile as a filter ensures the premiums being collected are above average, not near the bottom of their range.
Liquidity and spread width round out the picture. Tight bid-ask spreads reduce slippage, and wider strike distances increase the credit received but also raise the maximum loss. An option scanner that includes these filters gives traders the ability to balance income against risk before placing any trade.
How Option Samurai Screens for Credit Spreads
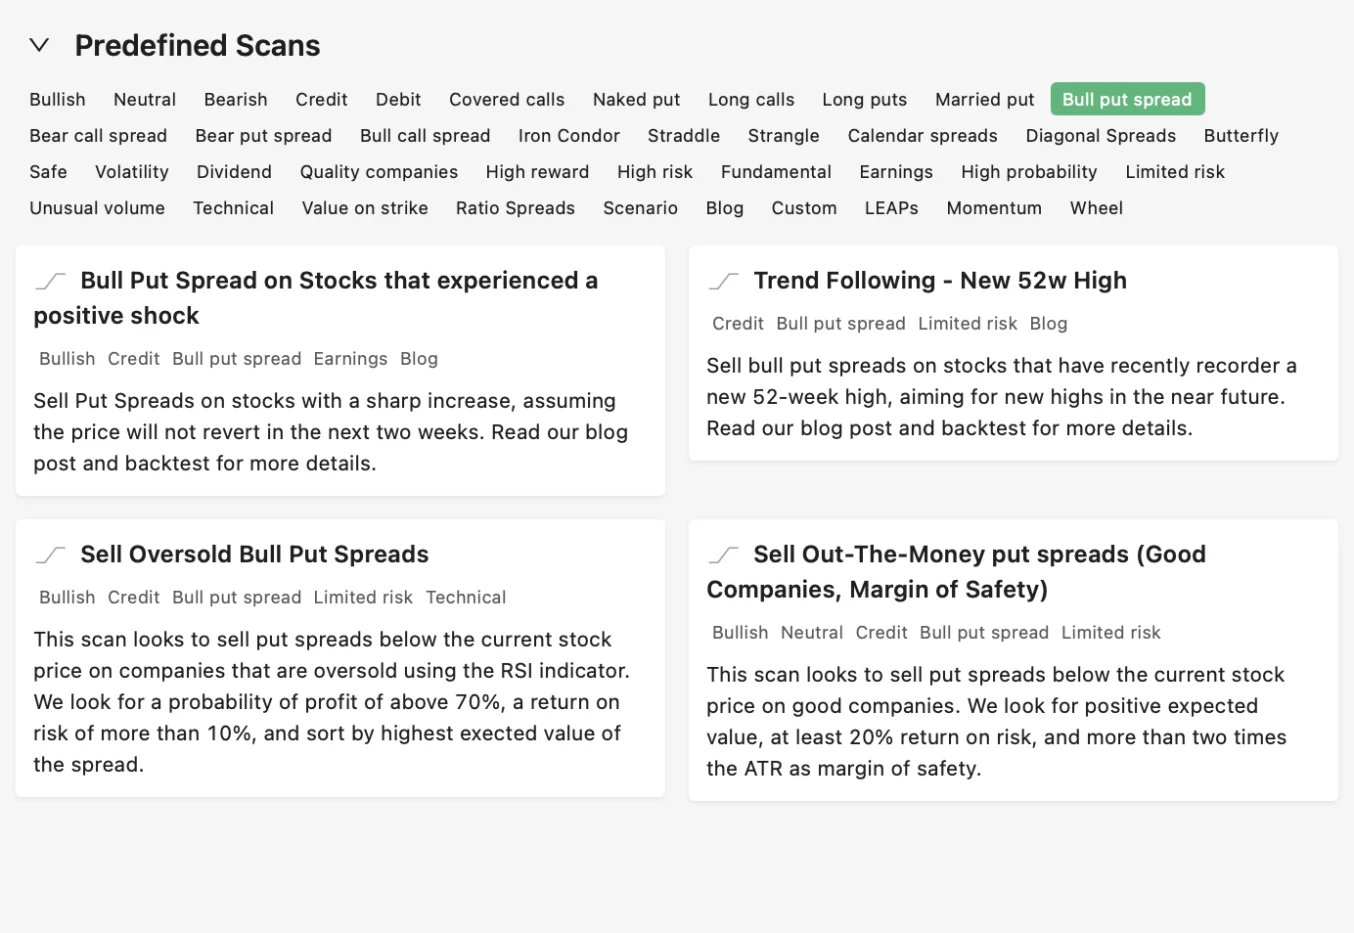
Option Samurai includes predefined scans specifically designed for credit spread strategies. These scans are pre-built with filters that target high-probability setups on quality companies, making it easy to get started without configuring dozens of parameters manually.
The Bull Put Spread scans focus on neutral to bullish setups. They filter for companies with stable fundamentals, elevated implied volatility, and puts that offer attractive premiums relative to the risk. Results are sorted by probability of profit and annualized return, giving traders a clear view of the best available opportunities.
Here are some of the available bull put spread scans on Option Samurai:
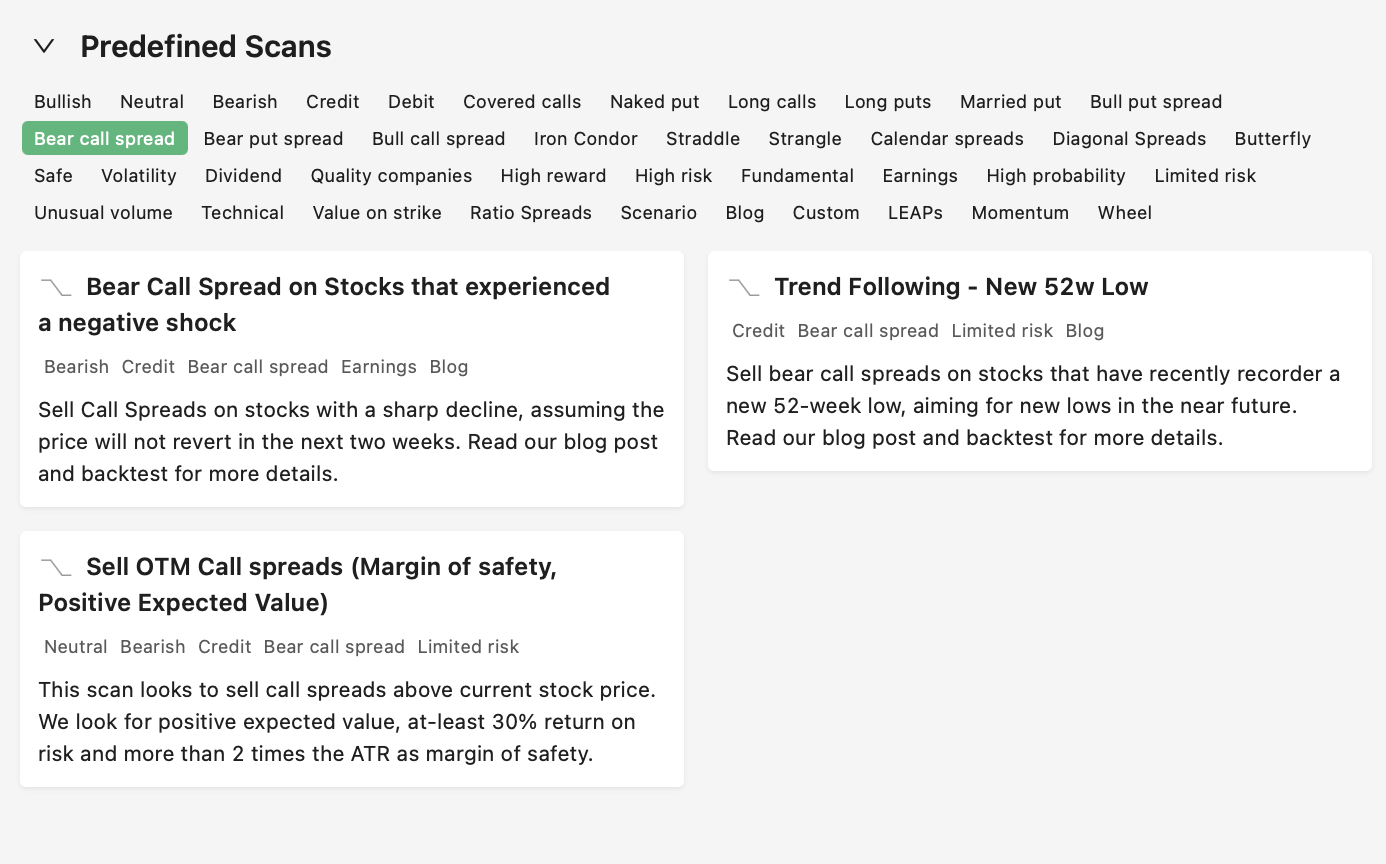
The Bear Call Spread scans apply the same logic in reverse, targeting stocks where the outlook is neutral to bearish and call premiums are rich enough to justify the trade. These scans are useful during periods of market strength when certain sectors or names appear overextended.
Again, this is a quick view of the scans users will find in Option Samurai:
Both scan types benefit from the underlying quality filters built into Samurai’s options screener. Rather than surfacing credit spreads on low-quality or thinly traded stocks, the results are limited to names with sufficient liquidity, reasonable fundamentals, and option chains that support clean execution.
Refining Results with Volatility and Fundamentals
Once a set of credit spread candidates appears, traders can refine further by layering on volatility and fundamental filters. IV Rank is particularly useful here. A credit spread on a stock with an IV Rank above 50 means the options are priced above their median level for the past year, which generally favors premium sellers.
Comparing implied volatility to realized volatility adds another layer of insight. When IV is significantly higher than what the stock has actually been delivering in terms of movement, the market may be overpricing the risk. This creates a natural edge for credit spread sellers who are collecting premiums inflated by fear rather than by actual volatility.
Fundamental filters help avoid names that might look attractive on a volatility basis but carry hidden risks. A stock with elevated IV because of deteriorating earnings or a looming debt issue is not the same as a strong company experiencing a temporary spike in uncertainty. Filtering for quality, whether through predefined tags or custom criteria, keeps the focus on setups where assignment or adverse moves are manageable.
Managing Credit Spreads After Entry
Screening is only the first step. Once a credit spread is placed, ongoing monitoring determines whether the trade reaches its full potential or needs adjustment. The options screener can help here as well, since the same volatility and probability data used to find the trade can be used to evaluate whether conditions have changed.
If implied volatility drops after entry, the spread may reach its profit target faster than expected. If the underlying moves toward the short strike, the probability of profit decreases and a decision about rolling or closing becomes necessary. Tracking these metrics inside a structured platform avoids the common trap of holding spreads too long or exiting too early based on emotion rather than data.
Final Thoughts
Credit spreads are a core income strategy, but their effectiveness depends on finding the right setups at the right time. Screening the entire options market with structured filters removes the guesswork and ensures that each trade is backed by favorable probabilities, appropriate volatility conditions, and quality underlying companies.
An option scanner built for multi-leg strategies brings this process together in a single workflow, making it easier to identify, compare, and execute credit spreads with consistency and discipline.
Start your free trial today (no credit card required) and see how Option Samurai helps traders screen for credit spreads with greater clarity, structure, and confidence.


Key Highlights
- Susquehanna’s Mehdi Hosseini increased SNDK’s price target to $2,000 from $1,000, suggesting approximately 30% upside potential
- The stock has surged 3,685% in the past year and 554% in 2024 alone
- Multiple Wall Street firms issued upgrades following impressive Q3 results, with price targets between $1,000 and $1,800
- The company’s commitment to allocate 50% of free cash flow to stock repurchases may boost earnings by approximately 10%
- An insider transaction saw a director offload $870,300 in shares on May 8, close to the $1,600 peak
SanDisk (SNDK) shares experienced a modest decline on Monday, yet the stock continues to rank among the market’s top performers, having climbed 3,685% over a 12-month period and 554% since the start of the year.
Trading around $1,543, the stock sits just beneath its 52-week peak of $1,600.
Mehdi Hosseini from Susquehanna doubled his price objective for SNDK to $2,000 — up from his prior $1,000 forecast — while maintaining a Buy recommendation. This updated target represents approximately 29.62% potential appreciation from present price levels.
Hosseini’s adjustment followed SanDisk’s impressive fiscal third-quarter financial results, which led Susquehanna to revise its projections higher “across the board.”
Wall Street Piles On Bullish Calls
Susquehanna isn’t alone in its optimistic stance. Multiple prominent investment banks issued their own positive revisions following the earnings announcement.
BofA Securities increased its price objective to $1,550 from $1,080 with a Buy rating, noting that SanDisk exceeded both top-line and bottom-line forecasts. Cantor Fitzgerald pushed even higher to $1,800, pointing to a revised business model structure encompassing five clients that account for more than 33% of SanDisk’s projected NAND bits in 2027.
Bernstein SocGen Group established a $1,700 target, emphasizing robust earnings, forward guidance, and an advantageous pricing landscape. Jefferies adjusted its target to $1,400, emphasizing long-term customer contracts stretching past 2030. RBC Capital increased its forecast to $1,000, highlighting exceptional NAND results and gross margins nearing 80%.
Across 13 analysts surveyed, the consensus Wall Street recommendation stands at Strong Buy, with three Hold ratings. The mean price target registers at $1,409.06.
Analysts have taken particular notice of SanDisk’s strategy to allocate 50% of free cash flow toward share repurchases over the coming two years. Hosseini projects this initiative alone could generate approximately 10% earnings enhancement.
Hosseini further observed that roughly one-third of SanDisk’s fiscal 2027 revenue stream is already secured through contracts, with comparable revenue visibility anticipated for fiscal 2028.
Insider Transaction at Peak Levels
Not all stakeholders are maintaining full positions. Director Necip Sayiner disposed of 579 SNDK stock on May 8 at $1,503.11 per share, generating $870,300 in proceeds. Following this sale, he retains direct ownership of 2,900 shares, according to a Form 4 filing submitted to the SEC on May 11.
InvestingPro characterizes the stock as overvalued at present prices, noting a P/E ratio of 52.88.
Monday’s trading volume reached 7.31 million shares, falling short of the three-month daily average of 17.78 million.
The third-quarter earnings release that ignited the series of analyst upgrades demonstrated SanDisk surpassing both revenue and earnings per share projections, while its fourth-quarter outlook also exceeded Wall Street consensus — despite a sequential decline in bit shipments.
Cantor Fitzgerald drew attention to $42 billion in NAND bit commitments and $11 billion in financial assurances connected to the revised customer arrangements as additional confirmation of sustained long-term revenue streams.


Bridgewater Associates founder Ray Dalio said Bitcoin has not acted as the safe-haven asset many investors expected.
Summary
- Ray Dalio said Bitcoin lacks privacy because transactions can be monitored and possibly controlled.
- Dalio argued investors often sell Bitcoin during market stress to raise liquidity elsewhere.
- Michael Saylor pushed back, calling gold analog capital and Bitcoin digital capital for collateral.
In a May 11 post, he said Bitcoin gets heavy attention but has fallen short when compared with gold during market stress.
Dalio pointed to three issues. He said Bitcoin lacks privacy, trades with a strong link to tech stocks, and remains small compared with gold. He also said gold has a deeper role in the global financial system.
Privacy remains a key concern
Dalio wrote, “First, Bitcoin lacks privacy.” He added that transactions can be monitored and potentially controlled. In his view, that makes Bitcoin less attractive to central banks as a reserve asset.
Bitcoin’s public ledger is part of its design. All confirmed transactions are recorded on a shared blockchain, allowing the network to verify ownership and spending without a central authority. That structure supports transparency, but it also creates the privacy concern Dalio raised.
Moreover, Dalio also said Bitcoin has not behaved like gold during stress periods. He said investors often sell Bitcoin when they need cash to cover pressure elsewhere in their portfolios. He added that Bitcoin’s link to tech stocks weakens its safe-haven case.
He contrasted that with gold, which he said remains widely held and deeply established. Earlier related coverage on crypto.news noted that Bitwise analysis found gold offered stronger downside protection during market drawdowns, while Bitcoin delivered stronger gains during recovery periods.
Saylor defends Bitcoin
Strategy executive chairman Michael Saylor pushed back against Dalio’s view. He said gold is “analog capital” while Bitcoin is “digital capital.” He also said Bitcoin’s transparency is a feature, not a flaw, because it supports its use as global collateral.
Saylor added that Bitcoin has outperformed gold since Strategy adopted its Bitcoin standard in August 2020. His response showed the split between investors who see Bitcoin as a risk asset and those who view it as a long-term monetary asset.
Dalio has not fully rejected crypto. Earlier crypto.news coverage noted that he has held some cryptocurrency, but prefers gold because of Bitcoin’s volatility, traceability, and uncertain reserve role.
Ethereum (ETH) price has lost 3.6% since May 10, dipping significantly inside a falling channel that has held since April 17. Whales used the dip to load up on $832 million in ETH.
Derivatives positioning shows the rally that preceded the breakdown was short-covering, not new longs piling in. That hands whales a low-leverage entry. The catch sits with long-term hodlers, who have cut accumulation by nearly 80% since late April.
Whales Bought $832 Million as the Price Slid
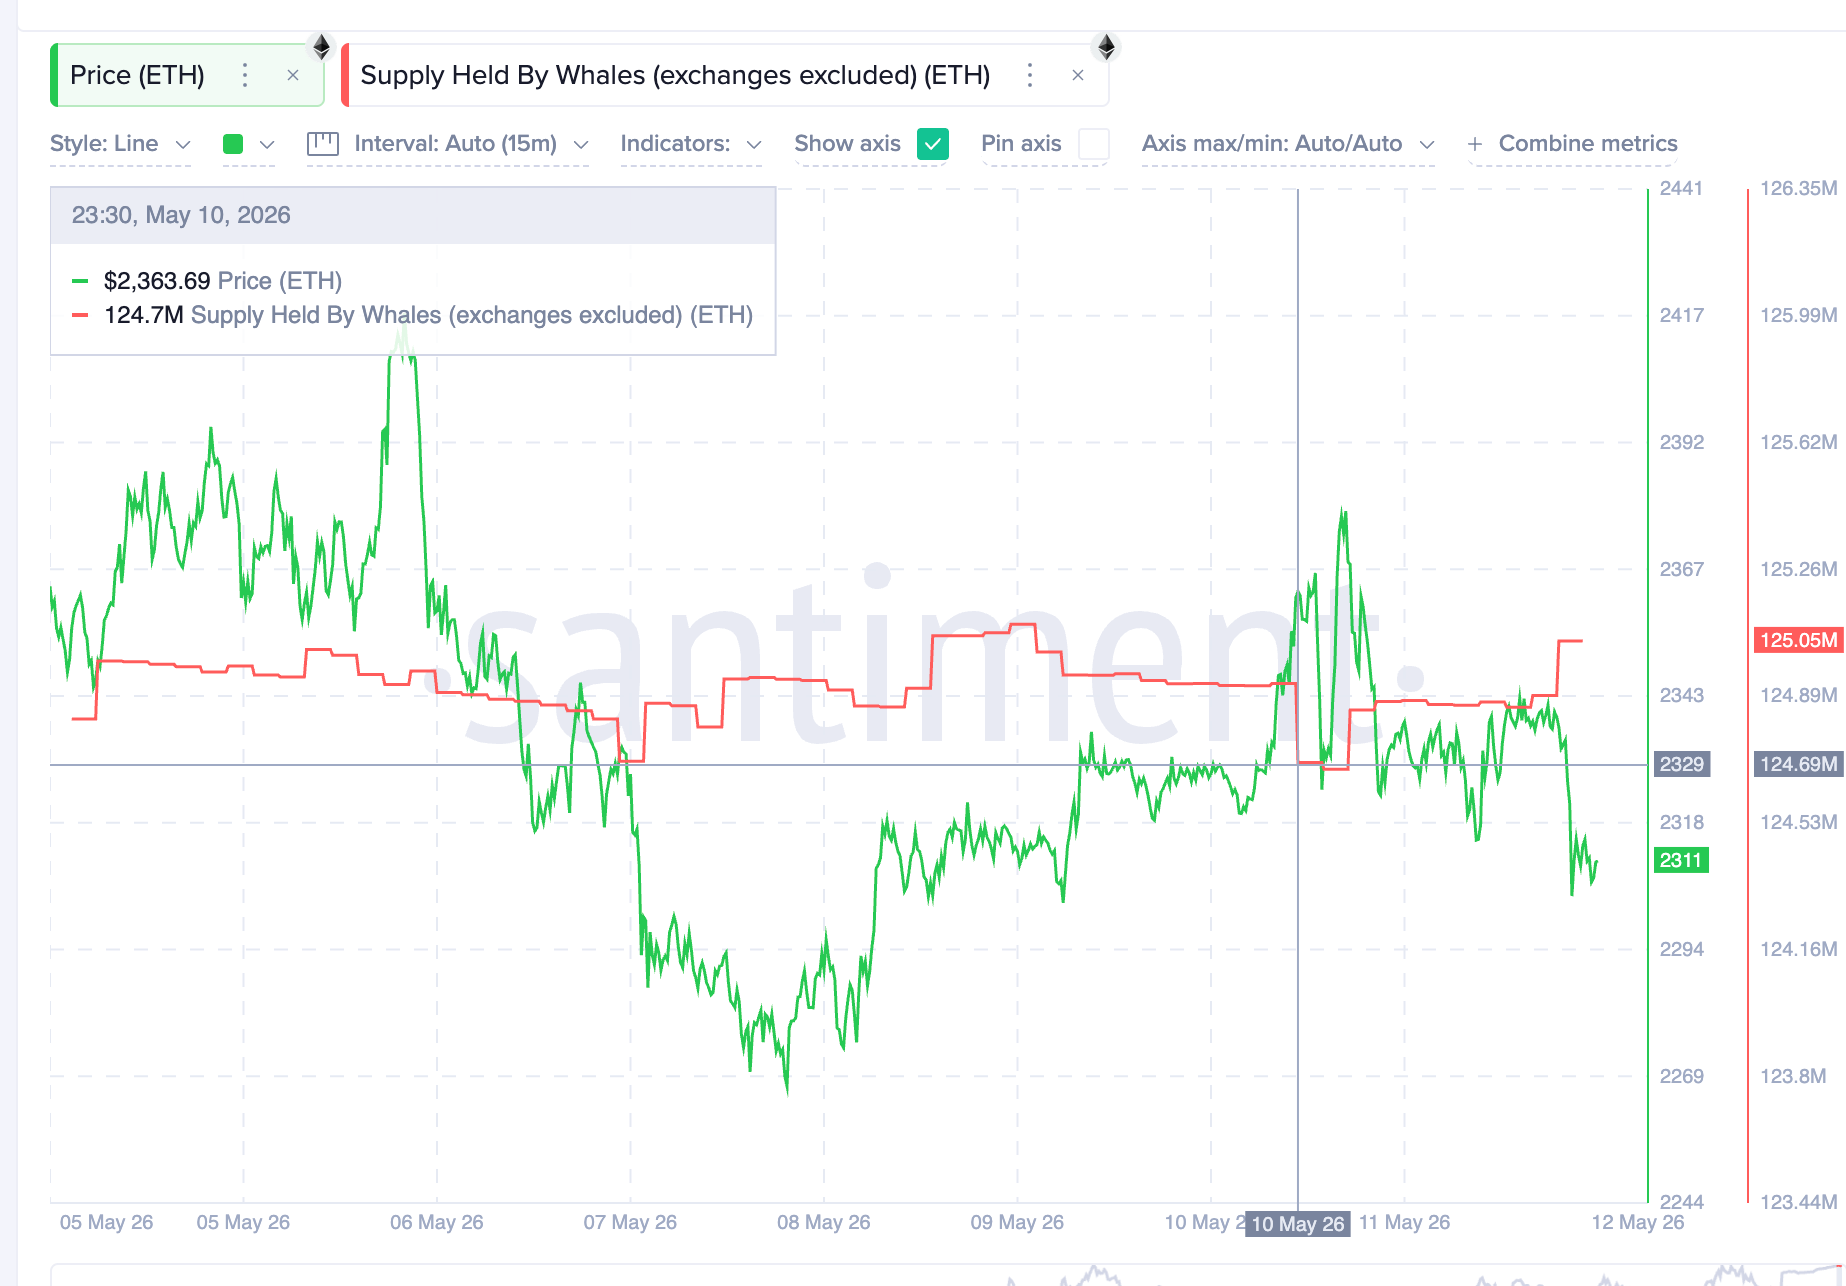
The Ethereum whale supply, excluding exchanges, tells a story the price chart misses. Whale wallets have steadily added ETH through the recent breakdown. The metric climbed from 124.69 million ETH to roughly 125.05 million across the period, an increase of 360,000 ETH.
Want more token insights like this? Sign up for Editor Harsh Notariya’s Daily Crypto Newsletter here.
At an current ETH price, those 360,000 tokens carry a market value of about $832 million.

The timing matters. The breakdown that started May 10 took ETH down 3.6% in two days. Whales added to their positions through that dip rather than reducing exposure. This kind of behavior usually signals confidence that the chart’s bearish pattern will not resolve to the downside. Whales rarely accumulate into a setup they expect to break lower.

The bigger question is why they are so confident. The answer sits in the derivatives data.
Ethereum Derivatives Confirm the Optimism Is Not Over-Leveraged
The derivatives side explains why whales are willing to accumulate into the breakdown. Ethereum open interest in perpetual futures dropped from $12.46 billion on May 7 to $11.98 billion on May 12. That is a decline of roughly $480 million.
Ethereum funding rate, the periodic payment between perpetual swap longs and shorts, has stayed elevated at around 0.012%. The rate was 0.010% on May 7.

The combination is telling. Falling open interest with elevated funding suggests shorts closed positions, not new longs adding leverage.
In other words, the optimism is real but conservative. There is no large stack of fresh long bets sitting on top of the market, waiting to be liquidated.
That is exactly the kind of backdrop whales prefer. The leverage stack is thin enough that an external shock will not trigger a cascading flush. But not every on-chain group agrees with the whale read.
Ethereum Hodlers Cut Accumulation by Nearly 80% Since Late April
The Ethereum hodler net position change tracks the daily change in ETH held by long-term wallets. The metric typically captures wallets that have held the token for over 155 days.
The reading peaked at 383,128 ETH on April 27. By May 11, that figure dropped to 77,675 ETH, a decline of roughly 80%.
Long-term holders have not stopped accumulating outright. They are still net buying, just at a sharply slower pace. The pace of spot buying from this cohort has thinned to roughly a fifth of the late-April rate.

The likely explanation is the same elevated funding rate that signals optimism on the derivatives side. Hodlers see funding above 0.01% as a warning that the market is leaning too long. They pull back from chasing the rally. That sets up the conflict. Whales see the falling open interest and call the optimism healthy. Hodlers see the elevated funding rate and call it overheated.
Whoever is right shapes the next leg, and the chart is the decider.
Ethereum Price Holds the Floor With $2,269 as the Trapdoor
Ethereum trades at $2,311 on the daily chart, down 1.2% on the day. The structure remains contained inside a descending channel that has held since the April 17 high.
Whale support has kept the price above $2,298, the 0.5 Fibonacci retracement of the broader pullback.
A clean daily close below $2,298 exposes $2,269, the 0.618 Fibonacci, as the next floor. That is just a 2% drop on the day.

Beneath $2,269, $2,227 and $2,174 come into the picture. A break below $2,174 exposes the lower trendline of the descending channel and risks a decisive draw lower.
On the upside, a reclaim of $2,327 puts the chart back toward neutral. A move above $2,363 shifts the structure to neutral-bullish. The target then becomes $2,422 in the short term.
Ethereum price is locked between whale buying at the floor and hodler caution above. $2,298 separates a slow recovery setup from a 2% slide that exposes $2,269 next.
The post Whales Just Bet $832 Million on the Ethereum Price Dip, Here’s Why appeared first on BeInCrypto.


A federal grand jury has indicted three Tennessee men over an alleged crypto robbery spree, including one incident where a victim was forced at gunpoint to surrender $6.5 million in digital assets.
Elijah Armstrong, Nino Chindavanh, and Jayden Rucker face conspiracy and kidnapping charges.
Tennessee Trio Hunted Crypto Holders
According to the press release, the defendants traveled from Tennessee and posed as delivery workers to enter victims’ homes. Investigators say the crew used guns, zip ties, and duct tape to restrain occupants.
“Armstrong, 21, of Tennessee; Chindavanh, 21, of Tennessee; and Rucker, 25, of Tennessee, are alleged to have conspired to kidnap and rob individuals in San Francisco, San Jose, Sunnyvale, and Los Angeles in efforts to steal cryptocurrency from the victims,” the press release read.
Follow us on X to get the latest news as it happens
Prosecutors detailed one incident where the alleged attackers forced one victim to log into his cryptocurrency accounts at gunpoint. A co-conspirator then transferred roughly $6.5 million from those wallets to addresses controlled by the group.
Armstrong and Rucker were arrested in Los Angeles on December 31. Chindavanh was detained earlier that month in Sunnyvale. All three remain in federal custody.
US Attorney Craig H. Missakian commented in the indictment announcement.
“These individuals, as alleged, terrorized their victims in the hopes of stealing vast sums of cryptocurrency. The scheme was not only sophisticated, it was brazen, violent, and dangerous,” he said.
If convicted, the defendants could face up to 20 years in prison and $250,000 in fines for charges including Conspiracy to Commit Hobbs Act Robbery, Attempted Hobbs Act Robbery, and Attempted Kidnapping. The Conspiracy to Commit Kidnapping charge carries a potential life sentence.
The development comes amid a sharp rise in physical crimes targeting cryptocurrency holders. Blockchain security firm CertiK documented 34 verified physical attacks on cryptocurrency holders between January and April 2026, a 41% rise year-over-year. CertiK projects that 2026 will close with around 130 wrench attacks if the current pace holds.
Subscribe to our YouTube channel to watch leaders and journalists provide expert insights
The post Three Tennessee Men Indicted Over $6.5 Million Crypto Robbery Spree appeared first on BeInCrypto.

Iran war drives shipping fuel shortage for global maritime industry

Cathie Wood’s Ark Invest chases Circle (CRC) stock as it hits a two-month high
Savannah Guthrie announces new hosting gig from Jimmy Fallon and NBC: 'This is something that's full of joy'
Manchester United reach agreement with Casemiro over contract clause amid transfer speculation

US brings back mandatory military draft registration

Steven Gerrard disagrees with Gary Neville over ‘shock’ Chelsea and Arsenal claim | Football


-
 Crypto World4 days ago
HarrisX Poll Found 52% of Registered Voters Support the CLARITY Act
-

 Fashion4 days ago
Weekend Open Thread: Marianne Dress
-

 Crypto World5 days ago
Upbit adds B3 Korean won pair as Base token gains Korea access
-
 NewsBeat5 days ago
NCP car park operator enters administration putting 340 UK sites at risk of closure
-

 Fashion16 hours ago
Coffee Break: Travel Steam Iron
-

 Tech2 days ago
Auto Enthusiast Carves Functional Two-Stroke Engine from Solid Metal
-

 Fashion1 day ago
What to Know Before Buying a Curling Wand or Curling Iron
-

 Politics11 hours ago
What to expect when you’re expecting a budget
-

 Politics3 days ago
Politics Home Article | Starmer Enters The Danger Zone
-
 Business3 days ago
Ignore market noise, India’s long-term story intact, say D-Street bulls Ramesh Damani and Sunil Singhania
-

 Crypto World7 days ago
UAE Free Zone Deploys Blockchain IDs to Verify Registered Firms
-

 Tech1 day ago
GM Agrees To Pay $12.75 Million To Settle California Lawsuit Over Misuse Of Customers’ Driving Data
-

 Crypto World6 days ago
BlackRock CEO Larry Fink Discusses a New Asset Class
-

 Entertainment5 days ago
Sarah Paulson Called Out For Met Gala ‘Hypocrisy’
-

 Crypto World5 days ago
Robinhood says Wall Street is building onchain
-
 Sports6 days ago
NBA playoff winners and losers: Austin Reaves is not loving Lakers vs. Thunder matchup, but Chet Holmgren is
-

 Entertainment5 days ago
General Hospital: Ric & Ava Bombshell – Ric’s Massive Secret Exposed!
-

 Entertainment6 days ago
Bold and Beautiful Early Spoilers May 11-15: Steffy Revolted & Liam Overjoyed!
-

 Tech6 days ago
Apple and Samsung are dominating smartphone sales so thoroughly that only one other company makes the top 10
-

 Fashion5 days ago
The Best Work Pants for Women in 2026
You must be logged in to post a comment Login