

Crypto World
Can BNB price break above $750 as double bottom pattern forms?
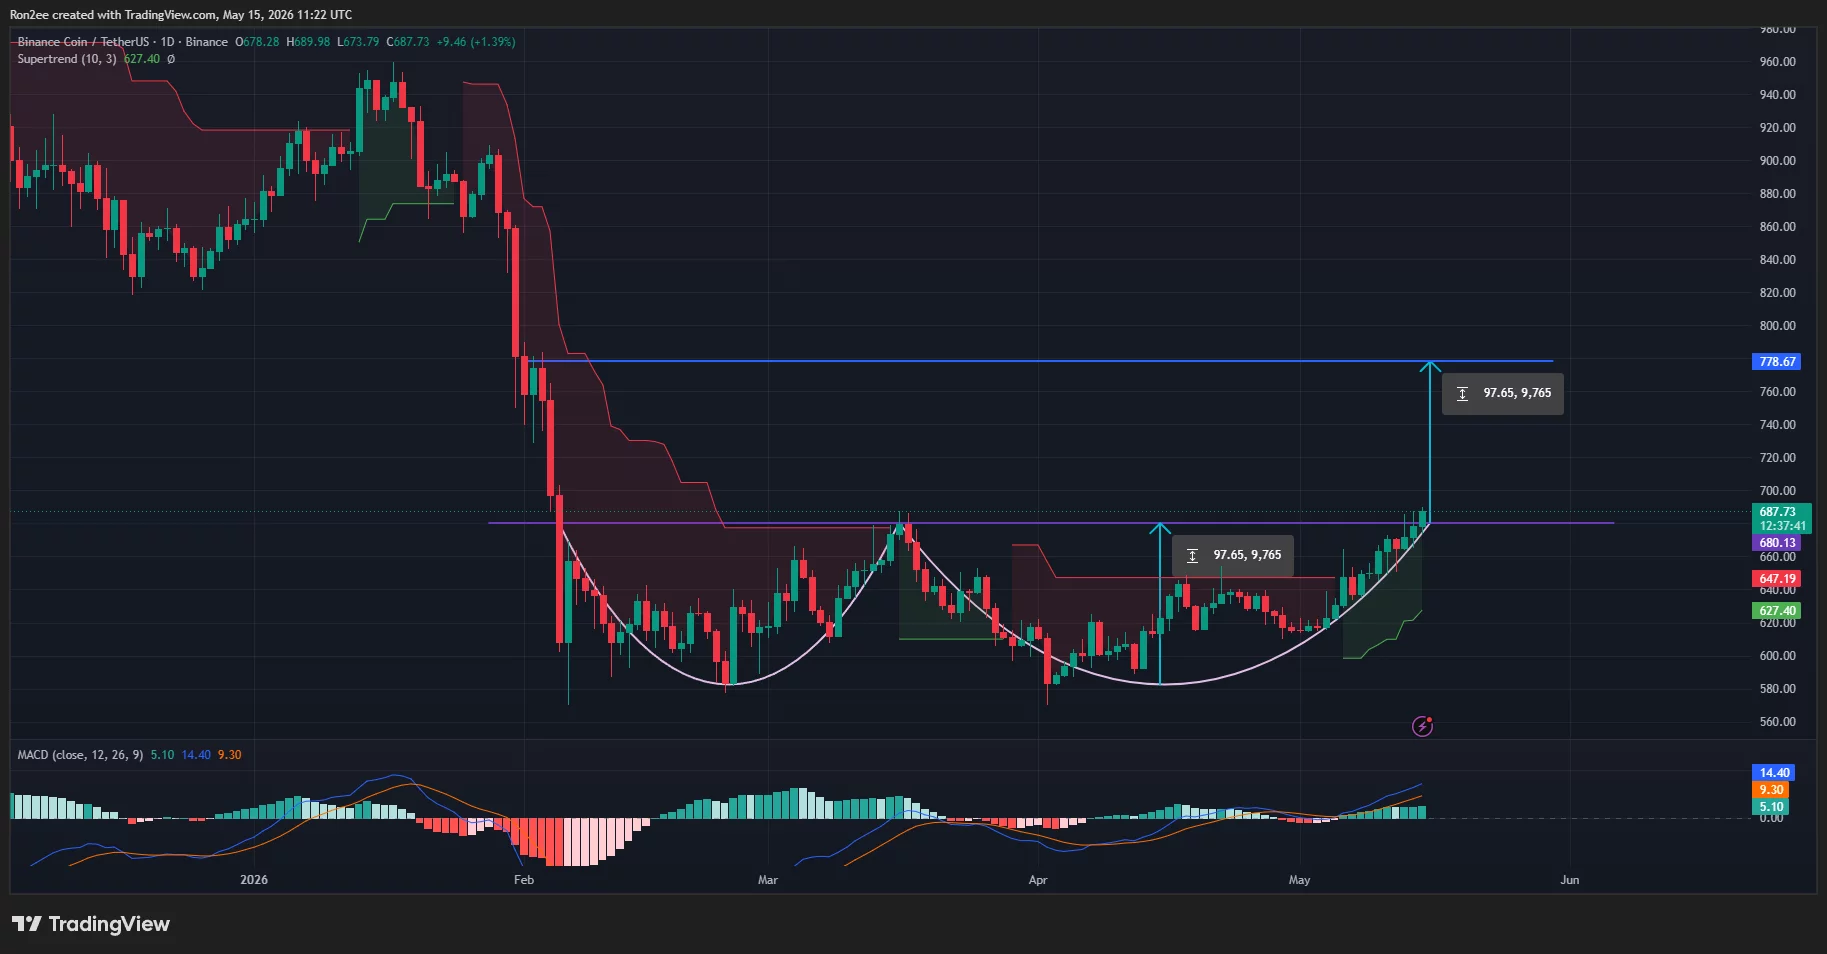
BNB price continued climbing this week as bulls attempted to confirm a breakout above a key neckline resistance zone, with a bullish double bottom structure on the daily chart signaling the potential for a larger upside move toward the $750 region.
Summary
- BNB price climbed toward the key $680–$690 neckline resistance as a bullish double bottom pattern signaled potential upside toward $750–$780.
- Growing optimism around spot BNB ETF proposals and rising institutional activity on BNB Chain helped strengthen investor sentiment.
- CoinGlass data showed rising open interest and positive funding rates, signaling that traders continue building bullish positions on BNB.
According to data from crypto.news, BNB (BNB) price traded around $687 at press time on May 15 after briefly rallying above $690 earlier in the session. The token has now recovered nearly 18% from its April lows near $580 as sentiment surrounding the Binance ecosystem continued improving.
BNB’s latest rally appears to have been fueled by a combination of institutional, ecosystem, and regulatory catalysts unique to the token.
One of the biggest drivers remains growing market optimism surrounding pending spot BNB ETF proposals tied to asset managers seeking broader institutional exposure to the token. Investor sentiment also strengthened after the recently launched leveraged Teucrium 2x Long Daily BNB ETF continued attracting attention from traditional market participants looking for amplified exposure to Binance Coin.
At the same time, BNB Chain has continued expanding its role within the tokenized real-world asset sector. Recent integrations involving institutional tokenization initiatives and stablecoin infrastructure on the network have reinforced expectations that BNB Chain could become a larger player in blockchain-based financial settlement systems.
The network has also benefited from improving on-chain activity in recent weeks. Decentralized exchange volumes, stablecoin transfers, and BNB Chain ecosystem participation have all shown signs of recovery alongside the broader crypto market rebound.
Meanwhile, investor sentiment toward Binance itself has improved modestly after months of pressure tied to U.S. regulatory and compliance scrutiny earlier this year. The fading intensity of those concerns appears to have helped reduce bearish pressure on BNB during the latest recovery phase.
Derivatives positioning has additionally turned increasingly bullish. CoinGlass data showed rising open interest and positive funding rates over recent sessions, signaling that traders continue building long exposure as momentum strengthens.
BNB price analysis
On the daily chart, BNB appears to be forming a bullish double bottom pattern with two major lows established near the $580 support region over the past several months.

The neckline of the pattern sits near the $680–$690 resistance zone, which bulls are currently attempting to reclaim decisively. A confirmed breakout above the neckline would validate the pattern and could potentially trigger a measured move toward the $780 region by adding the height of the formation to the breakout level.
The current setup also shows BNB gradually reclaiming higher lows while continuing to trade firmly above the Supertrend indicator near the $627 region, signaling that buyers currently maintain broader trend control.
Momentum indicators continue to support the bullish outlook. The MACD recently completed a bullish crossover while the histogram continues printing expanding green bars, suggesting upside momentum remains intact despite short-term consolidation below resistance.
Meanwhile, the broader recovery structure remains constructive as long as BNB holds above the key $650 support zone. A successful breakout above the neckline resistance could strengthen momentum toward the psychological $700 level, followed by the $750–$780 region.
However, failure to hold above current support levels could weaken the bullish setup and potentially trigger a pullback toward the $627 and $600 support zones, where buyers previously reentered aggressively.
Disclosure: This article does not represent investment advice. The content and materials featured on this page are for educational purposes only.

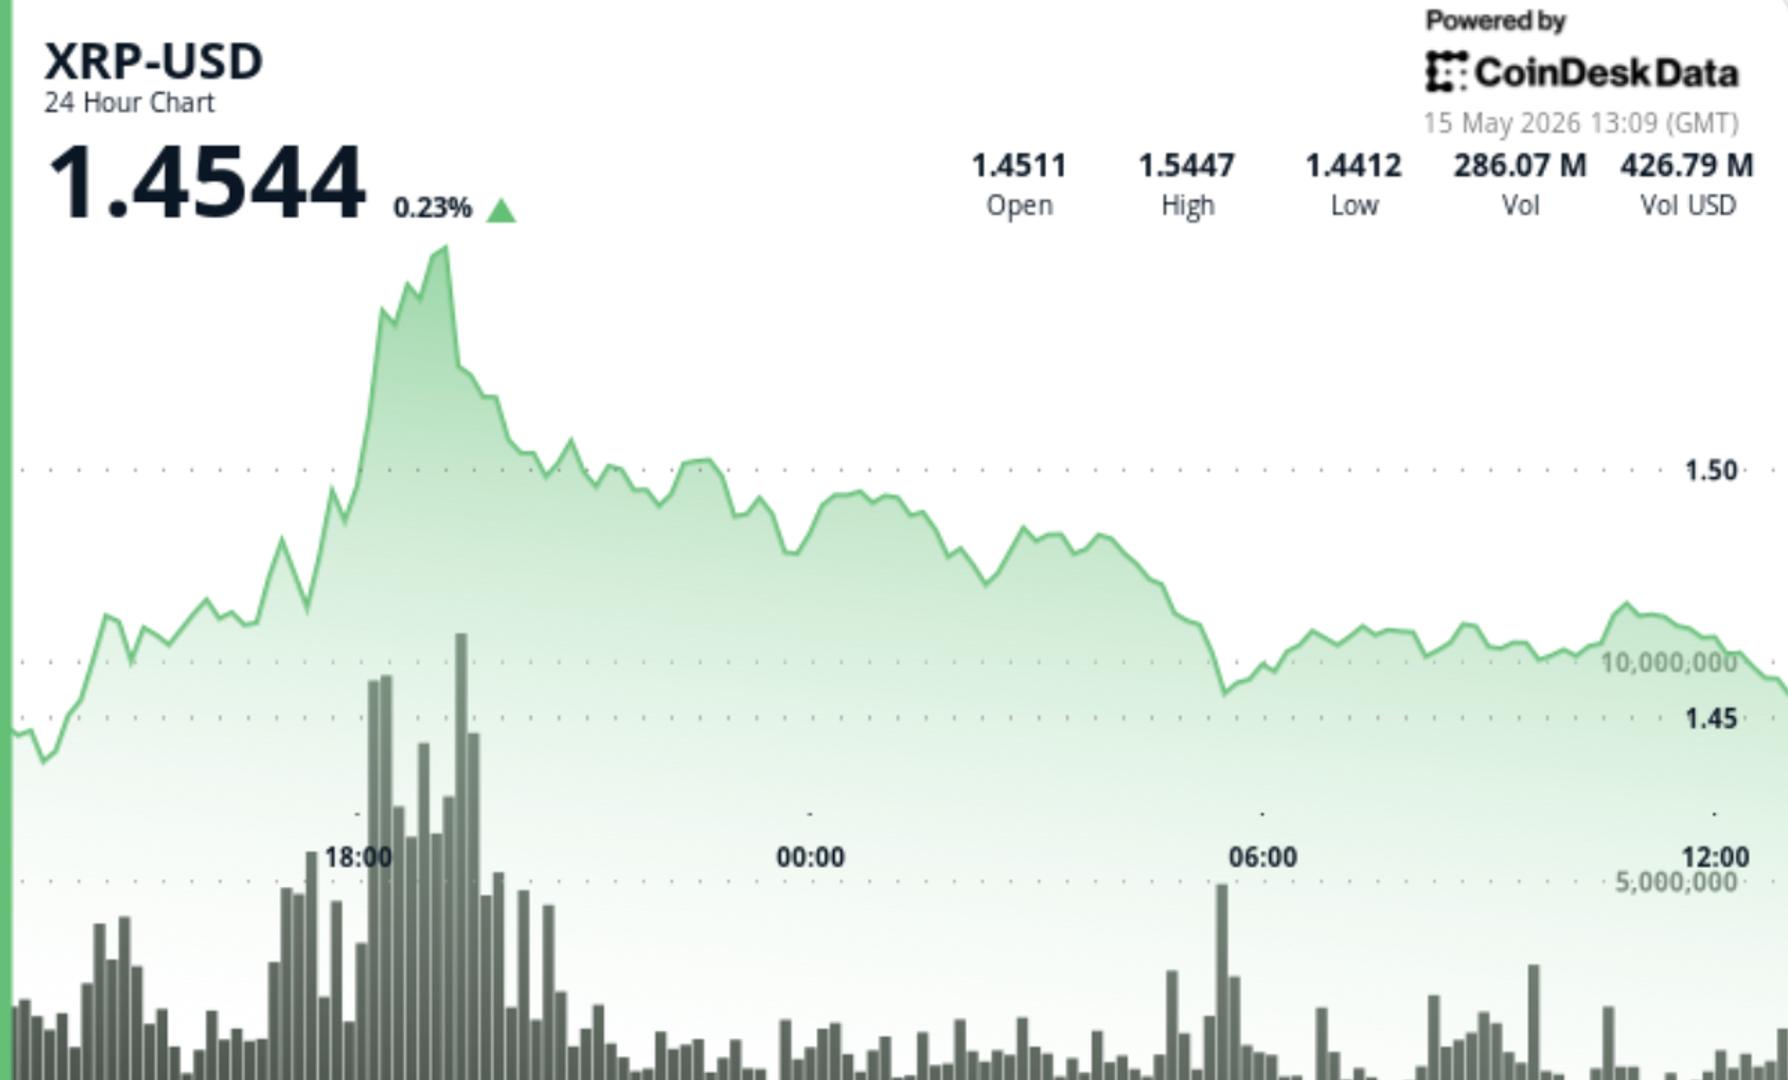

XRP stayed pinned below resistance even as derivatives activity surged ahead of a key Senate vote that could formally reinforce the token’s commodity status.
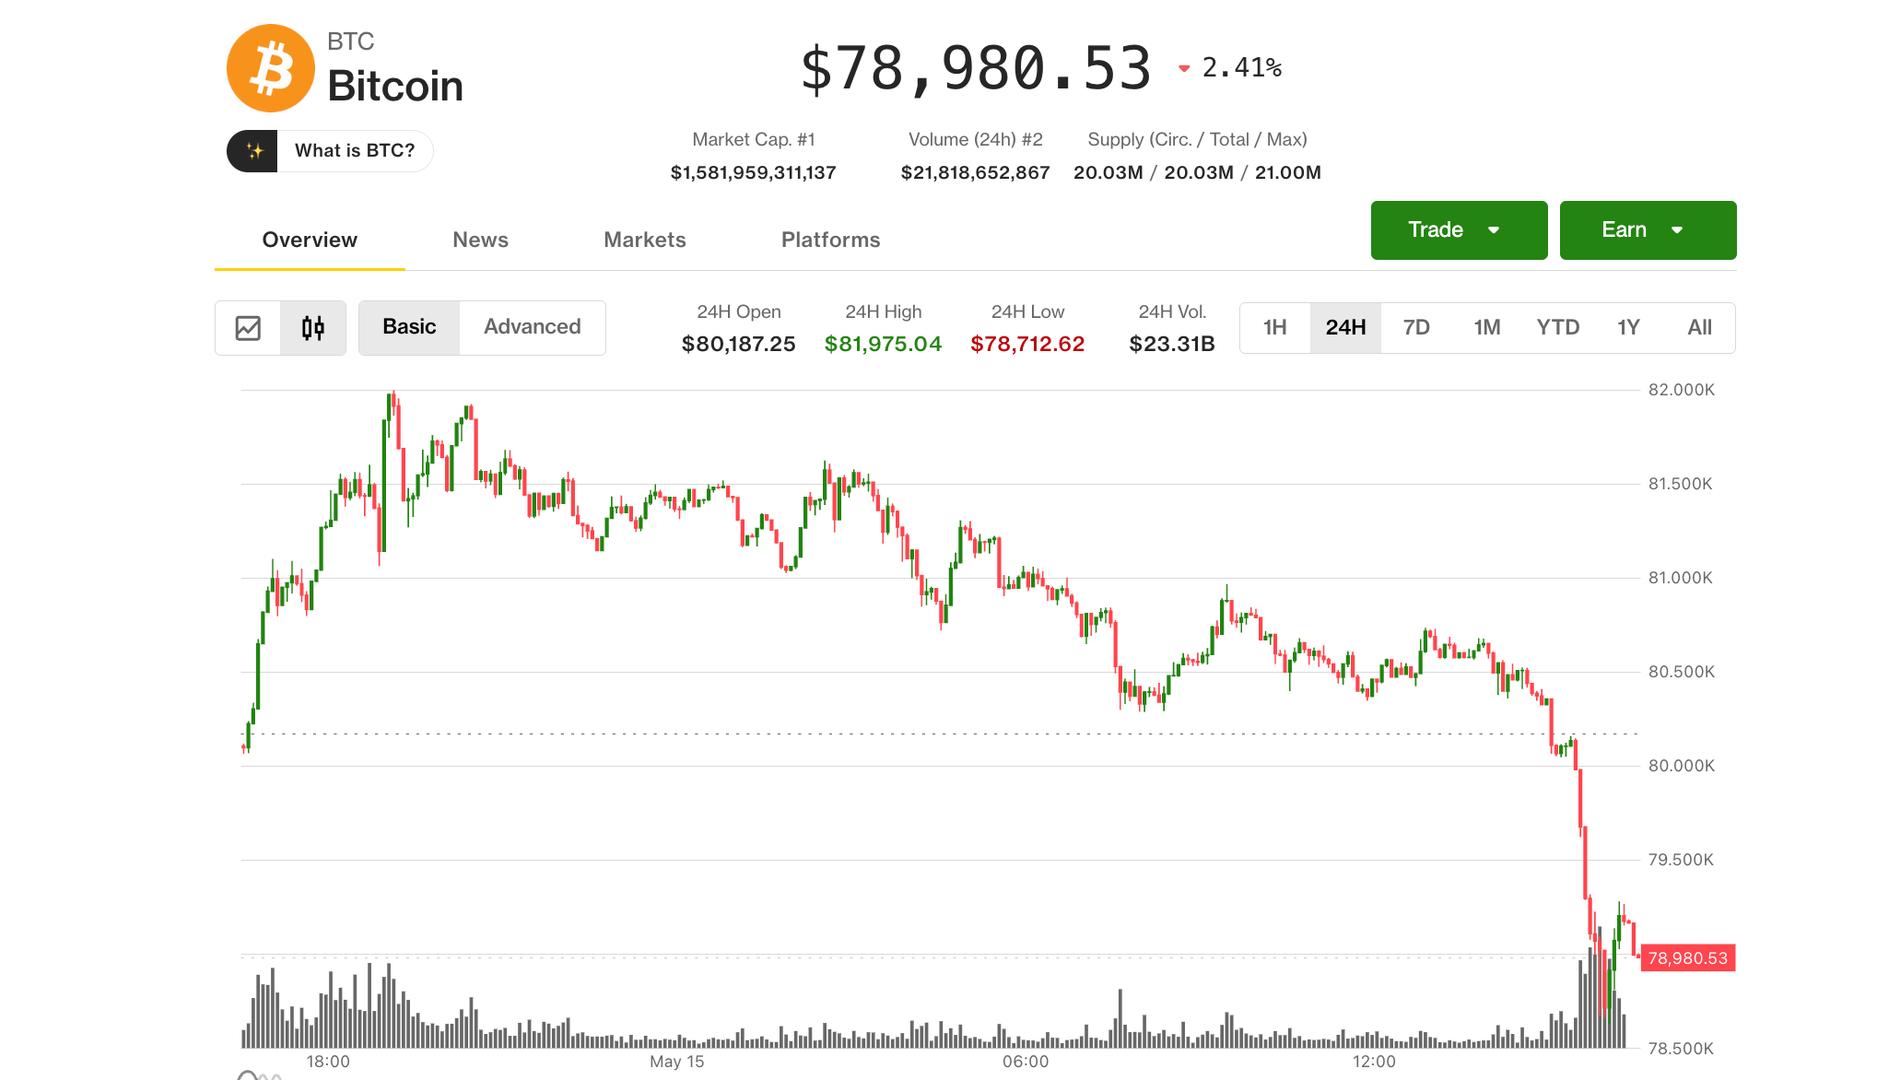

Stocks, gold and crypto slide while crude oil tops $100 and traders rapidly reprice Fed expectations for rate hikes.

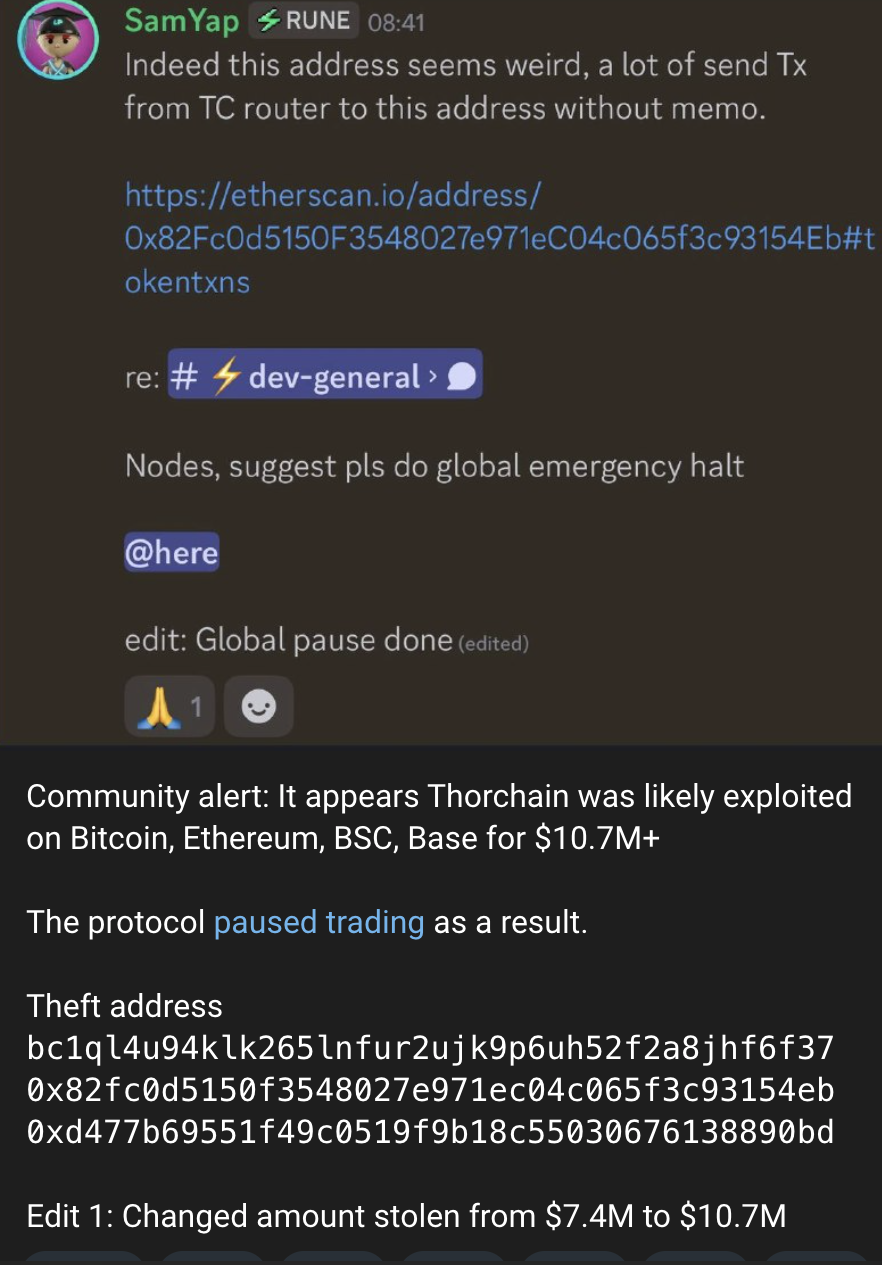
Cross-chain liquidity protocol THORChain has reportedly been exploited for $10 million worth of crypto.
That’s according to investigator ZachXBT, who revealed in his Telegram channel that the fund movements suggest the protocol was likely exploited.
As a result, THORChain has paused its trading activity. THORChain’s X account and the account of its founder, John-Paul Thorbjornsen, have yet to comment on the exploit.
ZachXBT listed three theft addresses as part of his findings:
- bc1ql4u94klk265lnfur2ujk9p6uh52f2a8jhf6f37
- 0x82fc0d5150f3548027e971ec04c065f3c93154eb
- 0xd477b69551f49c0519f9b18c55030676138890bd
Read more: THORChain pauses lending, savings but $200M restructure ‘no big deal’
The sleuth initially posted that around $7 million was exploited, but later updated it to $10 million.
While ZachXBT noted that it was a “likely” exploit, various crypto security firms have since confirmed it. Crypto security analysts PeckShieldAlert claimed that the attacker was able to steal $3 million worth of bitcoin and roughly $7 million of crypto assets from BNBChain, Ethereum, and Base.
Another self-proclaimed crypto investigator who goes by the username “tanuki42” claimed that the exploiter’s gas funds were supplied by bridging protocol Wagyu xyz.
It’s unclear exactly what caused the exploit.
THORChain has a love-hate relationship with North Korea
Earlier this week, crypto researcher “meow mfer” claimed that THORSwap hired a suspected North Korean IT worker.
THORChain describes THORSwap as the “leading multi-chain decentralized exchange aggregator and flagship interface for all THORChain features.”
Meow mfer claims the individual “had at least three pull requests MERGED into the official swapkit/SwapKit repository — the core SDK powering ThorSwap’s cross-chain swap infrastructure.”
They note that this individual was building wallet integration code for THORSwap, and that they also built “MEV extraction tools” and possessed concealment software used by North Korea.
Last year, THORSwap offered a bounty after Thorbjornsen’s personal wallet was drained of $1.2 million worth of crypto assets.
ZachXBT attributed the hack to North Korea and noted that “JP is one of the people whose has greatly benefited financially from the laundering of DPRK hacks/exploits.”
Read more: Vultisig founder says DPRK-linked Bybit transactions are ‘legitimate’
Indeed, funds stolen in North Korea are often moved through THORChain and its founders’ affiliated services in transactions that have resulted in significant profits for THORChain.
Protos has reached out to ZachXBT for comment and will update this piece should we hear anything back.
Got a tip? Send us an email securely via Protos Leaks. For more informed news and investigations, follow us on X, Bluesky, and Google News, or subscribe to our YouTube channel.

South Korea’s Financial Services Commission (FSC) plans to release detailed tokenized securities rules in July as the country prepares to bring blockchain-based securities under its capital markets framework in 2027.
The measures are expected to include a roadmap for tokenizing stocks, bonds and money market funds, possible changes to over-the-counter trading limits and rules allowing some fractional investment products to pool similar underlying assets, the FSC announced on Friday at the second meeting of its public-private tokenized securities council, which was launched in March to design issuance, trading, infrastructure and settlement rules before the framework takes effect in 2027.
“The goal is to make an announcement in July,” said FSC Vice Chairman Kwon Dae-young, adding that the new rules will serve for the “institutionalization” of tokenized securities.
The July package will be an important test of how far South Korea is willing to open regulated capital markets to distributed ledger infrastructure while keeping tokenized securities inside existing investor-protection rules.
The announcement followed the new Bank of Korea Governor, Hyun-Song Shin, who voiced support for tokenized deposits in his first public address, as Cointelegraph reported on April 21.
A week earlier, on April 16, South Korea’s Ministry of Economy and Finance announced a pilot project that will use tokenized deposits to execute government operational spending, with a full rollout set for the fourth quarter of 2026.
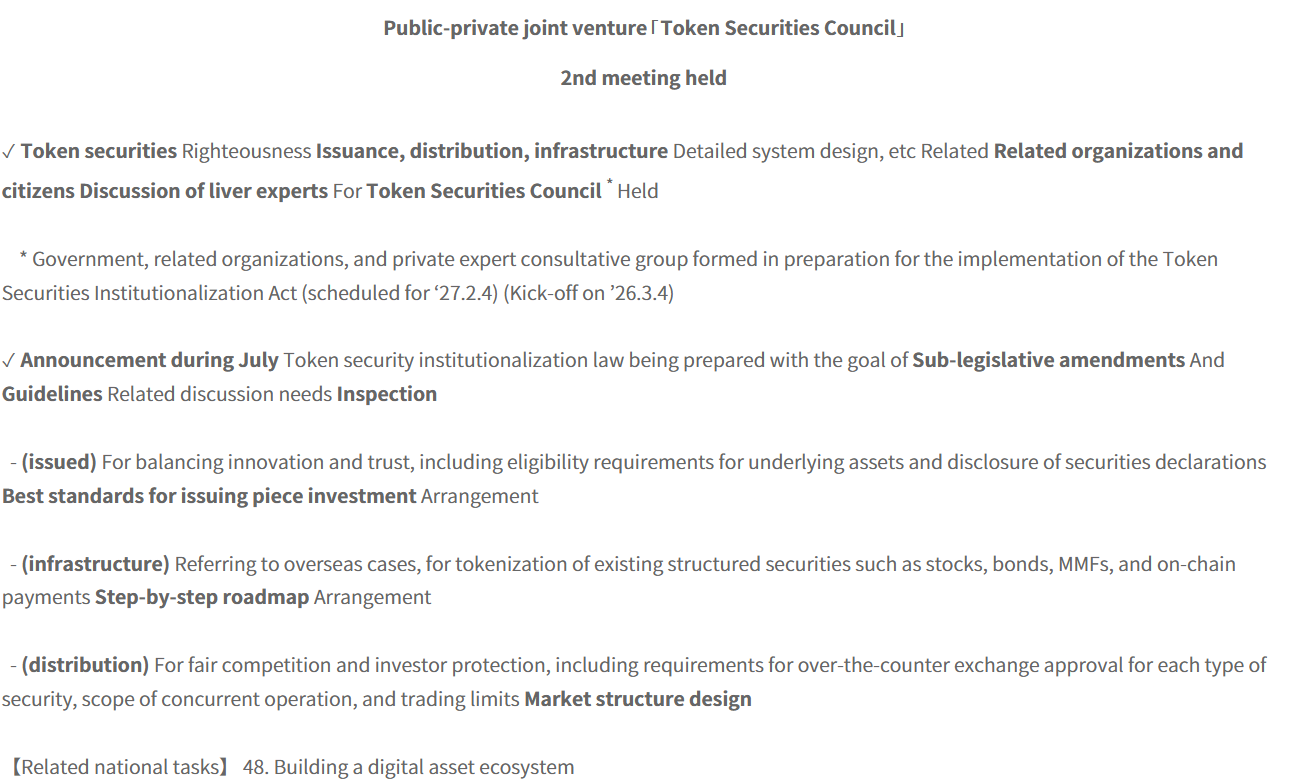
The Second Public-Private Joint Tokenized Securities Council. Source: FSC.go.kr
FSC accelerates tokenized regulation efforts ahead of 2027 rollout
The news comes amid the planned implementation of the amended Capital Markets Act and Electronic Securities Act, the country’s first tokenized securities framework, which is scheduled to take full effect on Feb. 4, 2027.
The implementation will mark the launch of South Korea’s first regulated environment for issuing, distributing and trading tokenized securities on distributed blockchain ledgers.
Related: South Korea’s Shinhan Card taps Solana to test real-world stablecoin payments
The framework will legally recognize blockchain-ledgers as valid securities registries, bringing tokenized assets under the FSC’s jurisdiction out of their current experimental stage.
The FSC first announced the incoming amendments to the legislation on Jan. 15, 2026, setting a one-year preparatory period for lawmakers.
Magazine: Singapore isn’t a ‘crypto hub’ — it’s something better: StraitsX CEO


TON’s new Agentic Wallets standard lets Telegram AI bots hold user‑funded wallets on TON, spending within tight limits as semi‑autonomous financial actors inside chat.
Summary
- TON Tech has launched “Agentic Wallets,” an open, self‑custodial standard that lets AI agents on Telegram hold funds and execute on‑chain transactions on the TON blockchain without per‑action user approval.
- Each agent gets a dedicated wallet funded and owned by the user, with hard spending limits and revocable access, effectively turning bots into bounded financial actors that can trade, pay subscriptions, and interact with DeFi inside Telegram’s roughly 1 billion‑user ecosystem.
- The move is being pitched by TON Tech’s Andrew Grekov as the shift from “assistants to actors,” but it also opens a new attack and governance surface around agent misbehavior, prompt‑injection, and blurred liability between users, developers, Telegram, and the TON network.
TON Tech — the infrastructure team behind The Open Network — rolled out Agentic Wallets on April 28, 2026, describing them as “self‑custody wallets designed for autonomous AI agents on TON” that finally give Telegram bots a native way to move money. According to TON’s docs and supporting announcements, each AI agent can spin up its own on‑chain wallet, funded directly by the user; the agent then manages that balance autonomously, while ownership remains anchored to the user’s main wallet and can be revoked at any time.
TON’s AI agents get real wallets, not just UX gloss
Crucially, this is not a custodial layer or a centralized key‑escrow hack. TON Tech stresses that “no intermediary holds funds at any point” and that existing TON wallets require “no upgrades” to plug into the scheme, which is implemented as a standard contract pattern rather than a new app silo. The design uses a split‑control architecture: users keep the master keys; agents get narrow, contract‑level permissions to initiate transfers, swaps, and DeFi interactions within a predefined budget, with the ability for users to pull funds or kill the agent’s access at will.
From a product perspective, the key move is that Telegram itself becomes the UI and distribution layer. Telegram’s bot infrastructure and bot‑to‑bot messaging already run across a reported 1 billion‑plus users; Agentic Wallets plug into that fabric so that a user can literally ask a bot in chat to “create a wallet,” fund it, and then let it pay for services, exchange tokens, or execute transactions from inside the same interface. As Grekov puts it, “Agentic Wallets turn AI agents from assistants into actors — agents on Telegram can not only communicate, but transact,” collapsing the distance between conversation and settlement into a single app.
Programmable capital with a will — and a bigger attack surface
The concrete use cases TON Tech and third‑party write‑ups are pushing are exactly the ones you’d expect: trading bots with predefined budgets, DeFi agents that handle staking and portfolio rotations, and automation for subscription payments, API usage and micro‑transactions, all without routing through custodians. Blockster’s analysis is blunt: this “pushes Telegram‑based AI agents beyond simple assistants and into something closer to autonomous financial actors,” meaning that once budgets and rules are set, the agent can hold balances, make payments, and interact with on‑chain applications without a human clicking “confirm” on every transaction.
For crypto, that is the actual “AI + blockchain” crossover that matters: not vaporous “AI tokens,” but agent frameworks that can maintain positions, roll perps funding, dollar‑cost average into a basket, or run a Polymarket/Kalshi‑style prediction‑market book 24/7 inside a chat app. In practice, it means your next trading strategy, recurring remittance flow, or cross‑border bill‑pay could be delegated to scripts with persistent identity and direct on‑chain reach, turning capital into something closer to a semi‑autonomous process than a pile of passive balances.
The flip side is that the governance and security surface just exploded. None of the launch materials resolve what happens when an “agent” griefs a protocol, front‑runs retail flow, or becomes part of a cartel coordinating MEV‑style behavior across DeFi inside Telegram. The attack vectors are obvious: prompt‑injection or jailbreaks that subvert an agent’s policy layer, Telegram account takeovers that let an attacker reconfigure or drain agent wallets, or poorly written agent logic that autocompounds bad positions and nukes user balances while formally staying “within budget.”
Legally and politically, the liability chain is completely undefined: when an agent running in Telegram uses an Agentic Wallet to launder funds or exploit a DeFi contract, the blame can be projected onto the user, the bot developer, TON Tech’s standard, or Telegram’s distribution layer, with no clear doctrine yet to apportion responsibility. That ambiguity is exactly why this launch is bigger than another “AI wallet” gimmick — it’s the first serious attempt to normalize autonomous agents as on‑chain actors inside a mainstream consumer app, with all the upside and all the systemic risk that implies.

TLDR:
- Hyperliquid briefly pushed near $44 after reports tied CME and NYSE to regulatory pressure
- Critics questioned Hyperliquid’s HLP vault structure and trader loss-linked protocol revenue
- CoinGecko data showed $HYPE trading near $43.61 with nearly $887 million daily volume
- ZachXBT raised questions after NYSE-linked criticism targeted Hyperliquid instead of Polymarket
Hyperliquid entered fresh regulatory discussions after reports linked CME Group and NYSE to concerns around the platform’s operations. Claims spread across crypto markets after social accounts highlighted alleged pressure on US regulators to review Hyperliquid.
The debate centered on market manipulation risks, sanctions evasion concerns, and Hyperliquid’s internal liquidity structure. Meanwhile, Hyperliquid’s native token $HYPE briefly approached $44 before stabilizing near $43.61.
Hyperliquid Faces Regulatory Debate Over Market Structure
Posts shared by Zoomer on X pointed to Bloomberg reporting that CME and NYSE want closer oversight of Hyperliquid. The focus remains on the platform’s decentralized perpetual futures trading model.
Hyperliquid has grown rapidly during the past year. The protocol now reportedly handles billions in daily trading volume across crypto and tokenized asset markets.
The exchange also reportedly holds more than $1.5 billion in locked value. Its round-the-clock trading model has attracted traders searching for lower fees and faster execution.
The discussion intensified because Hyperliquid continues attracting users from jurisdictions with trading restrictions. Some market participants claimed users still access the platform despite geoblocking efforts.
CoinGecko data showed Hyperliquid traded at $43.61 during publication. The token also recorded nearly $887 million in daily trading volume.
The market reaction remained relatively controlled despite the headlines. $HYPE rose nearly 5% during the past 24 hours and added 2.78% weekly gains.
Hyperliquid HLP Model Draws Criticism From Crypto Traders
A separate discussion emerged after X user Sweep criticized Hyperliquid’s revenue structure. The post argued that Hyperliquid operates differently from traditional exchanges like CME and NYSE.
According to the thread, Hyperliquid’s internal vault, called HLP, actively takes trading positions. The vault also performs liquidations, market making, and liquidity provision functions.
Sweep claimed the protocol profits when traders lose positions. The thread also described HLP revenue as directly tied to trader losses and liquidation activity.
The same post estimated Hyperliquid generates roughly $65 million in monthly fee revenue. Sweep further claimed most protocol revenue routes toward $HYPE token buybacks through the Assistance Fund.
Critics argued that structure differs from traditional exchange models. CME and NYSE primarily generate fees from transaction flow instead of directional exposure.
The debate expanded after blockchain investigator ZachXBT referenced NYSE-linked concerns around Hyperliquid. His X post questioned why similar criticism had not targeted prediction market platform Polymarket.
Neither CME nor NYSE publicly released detailed statements in the shared posts. However, the online debate fueled broader discussion around DeFi regulation, perpetual futures trading, and token-linked revenue systems.
The latest developments arrive as regulators globally increase attention on decentralized trading venues. Hyperliquid now sits at the center of a growing conversation around crypto market structure and compliance standards.


Polish lawmakers approved a government-backed bill Friday to bring the country’s crypto market under the European Union’s Markets in Crypto-Assets Regulation (MiCA) framework, after President Karol Nawrocki twice vetoed earlier versions.
The vote took place on Friday during the 57th sitting of the Sejm in Warsaw, where lawmakers adopted the legislation in a 241–200 decision, according to official parliamentary records.
Backed by the Ministry of Finance, the approved bill (No. 2529) designates the Polish Financial Supervision Authority (KNF) powers to oversee market participants, impose administrative sanctions and temporarily block accounts and transactions.
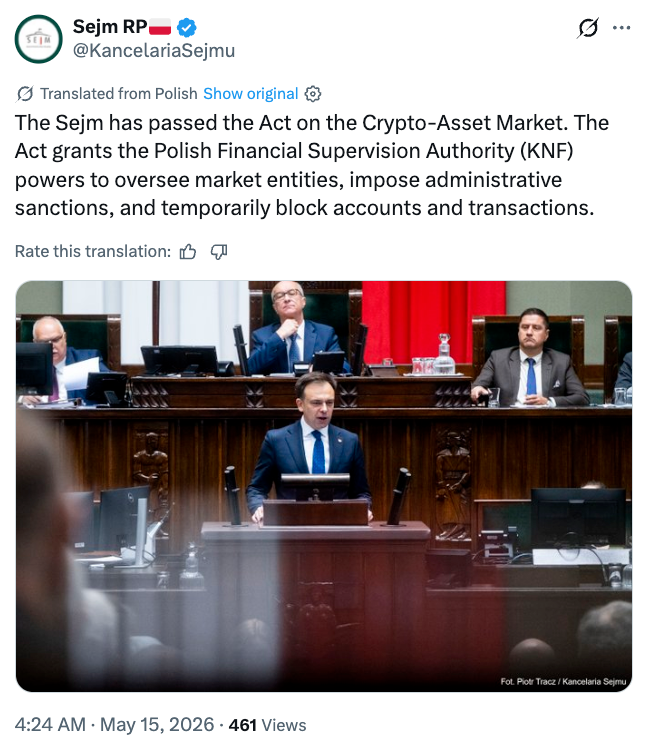
Source: Sejm RP
The vote marks the third attempt by the government to pass a crypto bill following two earlier presidential vetoes, with lawmakers favoring the state-backed approach over three competing draft bills.
Poland’s crypto regulation split: Four competing bills amid rising tensions
After Nawrocki vetoed two earlier government-backed crypto bills, lawmakers returned this week to a debate over four competing proposals.
Parliament’s latest vote was based on a consolidated committee text incorporating government bill 2529 alongside competing proposals from the president (No. 2528), Confederation (No. 2530), and a parliamentary draft (No. 2363), according to official records.
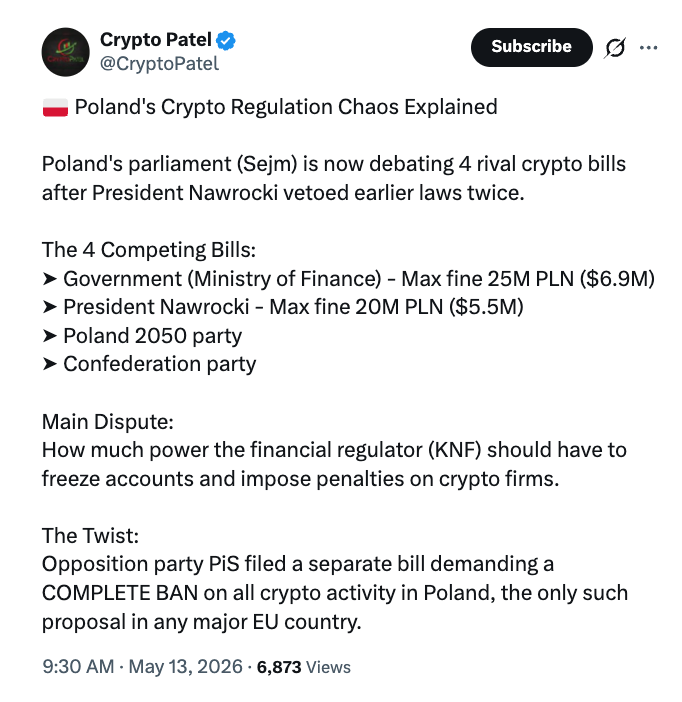
Source: Crypto Patel
The opposition Law and Justice party (PiS) also submitted a separate draft bill proposing a complete ban on all crypto-asset activity in Poland, according to local media.
Community expects another veto despite Zonda controversy
Market participants and crypto commentators reacted critically to the latest Sejm vote, with some expecting the president to veto the legislation again, as repeated parliamentary approvals have not resolved key disputes over supervisory powers and enforcement under KNF.
Critics highlighted ongoing concerns over account and domain blocking provisions, which they say remain largely unchanged despite earlier presidential objections, while proposed safeguards such as stronger judicial oversight were not included in the final text.
They warned that continued deadlock could prolong regulatory uncertainty as Poland aligns with the EU’s MiCA framework ahead of upcoming implementation deadlines in July.
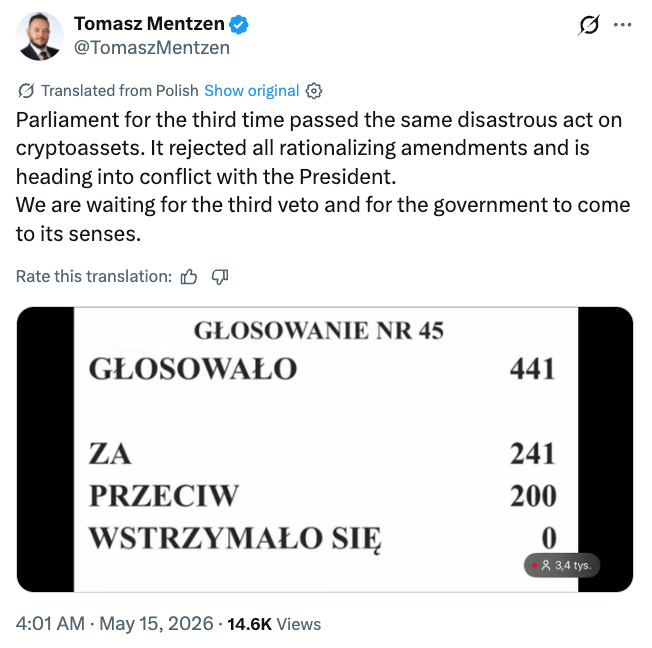
Source: Tomasz Mentzen
The latest debate has also been shaped by a deepening scandal around Zondacrypto, after prosecutors launched a fraud probe and thousands of users were reportedly unable to withdraw funds.
Related: Estonia’s FSA issues investor warning about Zondacrypto
The issue has entered Polish politics, with Prime Minister Donald Tusk alleging links between Zondacrypto and Russian capital and influence, citing its early history and later development under new ownership. Tusk also argued that the lack of a full investor protection framework delayed regulatory action, pointing to Poland’s repeated delays in aligning with the EU’s MiCA rules.
Magazine: How crypto laws changed in 2025 — and how they’ll change in 2026


- Zcash price fell to intraday lows of $532 after surging above $570.
- Over $5.1 million in Zcash futures positions were liquidated in the last 24 hours.
- Bullish case remains if buyers hold $500, but a breakdown could push ZEC toward $370.
Zcash (ZEC) fell back below the $550 level on Friday morning, trading near $530 as profit-taking emerged across the broader cryptocurrency market.
The pullback has coincided with elevated activity in derivatives markets, which analysts say suggests traders are still adjusting leverage and positioning following the token’s recent rally.
Zcash price drops below $550
Market data shows Zcash (ZEC) has declined over the past 24 hours, falling to intraday lows near $532.
The pullback follows a strong rally that pushed the token above $570 on Thursday, May 14.
The earlier gains came after The Wall Street Journal published an article comparing Bitcoin and Zcash, a development that Grayscale said “feels like one of those moments” that often precedes a surge in broader investor interest.
For $BTC, many early adopters trace their conviction to a single @WIRED piece in Nov 2011.
Today’s WSJ article on @Zcash $ZEC feels like one of those moments.
Grayscale Zcash Trust (Ticker: $ZCSH) is the only pure-play and publicly traded @Zcash $ZEC fund in the world.
Read…
— Grayscale (@Grayscale) May 14, 2026
While daily volume profiles show a modest decline, spot trading volume for Zcash (ZEC) remained near $256 million, while futures volume exceeded $2.7 billion.
The figures suggest speculative activity remains elevated. Data from CoinGlass shows that more than $5.1 million in Zcash futures positions were liquidated over the past 24 hours.
Despite the liquidations, open interest stands at about $978 million, although this is significantly lower than the $1.52 billion recorded on May 9.
Analysts say the decline points to traders continuing to reassess leverage and overall risk exposure.
Zcash price forecast
Price action over recent weeks saw ZEC climb to a high of $642, extending Zcash’s dramatic recovery from lows of $317 reached on April 29.
That relief rally followed deeper losses earlier in the year, when the privacy-focused token tested support near $185 as the crypto market sell-off intensified on Feb 5.
Thursday’s intraday dynamics illustrated the token’s sensitivity to momentum: a nearly 10% surge above $570 was later pared by a 4% decline from those intraday highs, culminating in the pullback under $550.

Despite the short-term pullback, the technical and fundamental picture remains bullish.
The recovery from April’s low and the subsequent climb toward the $640 area suggest investor interest in privacy coins.
Zcash’s recent progress on Quantum Recoverability is contributing to renewed attention.
If bulls defend the $500 level and broader market momentum persists, ZEC has a plausible path to revisit previous resistance above $700. Buyers may look to accumulate on dips.
However, failure to hold $500 could expose ZEC to a deeper correction.
A break below that pivot would likely open targets near $450, with a further decline toward $370 possible.
The sizable reduction in open interest from early May reduces the immediacy of a leveraged squeeze higher. But this leaves room for renewed volatility should traders re-enter with elevated positions.


The crypto exchange is also seeking fresh funding at a $20 billion valuation as it ramps up acquisitions and prepares for a public listing.
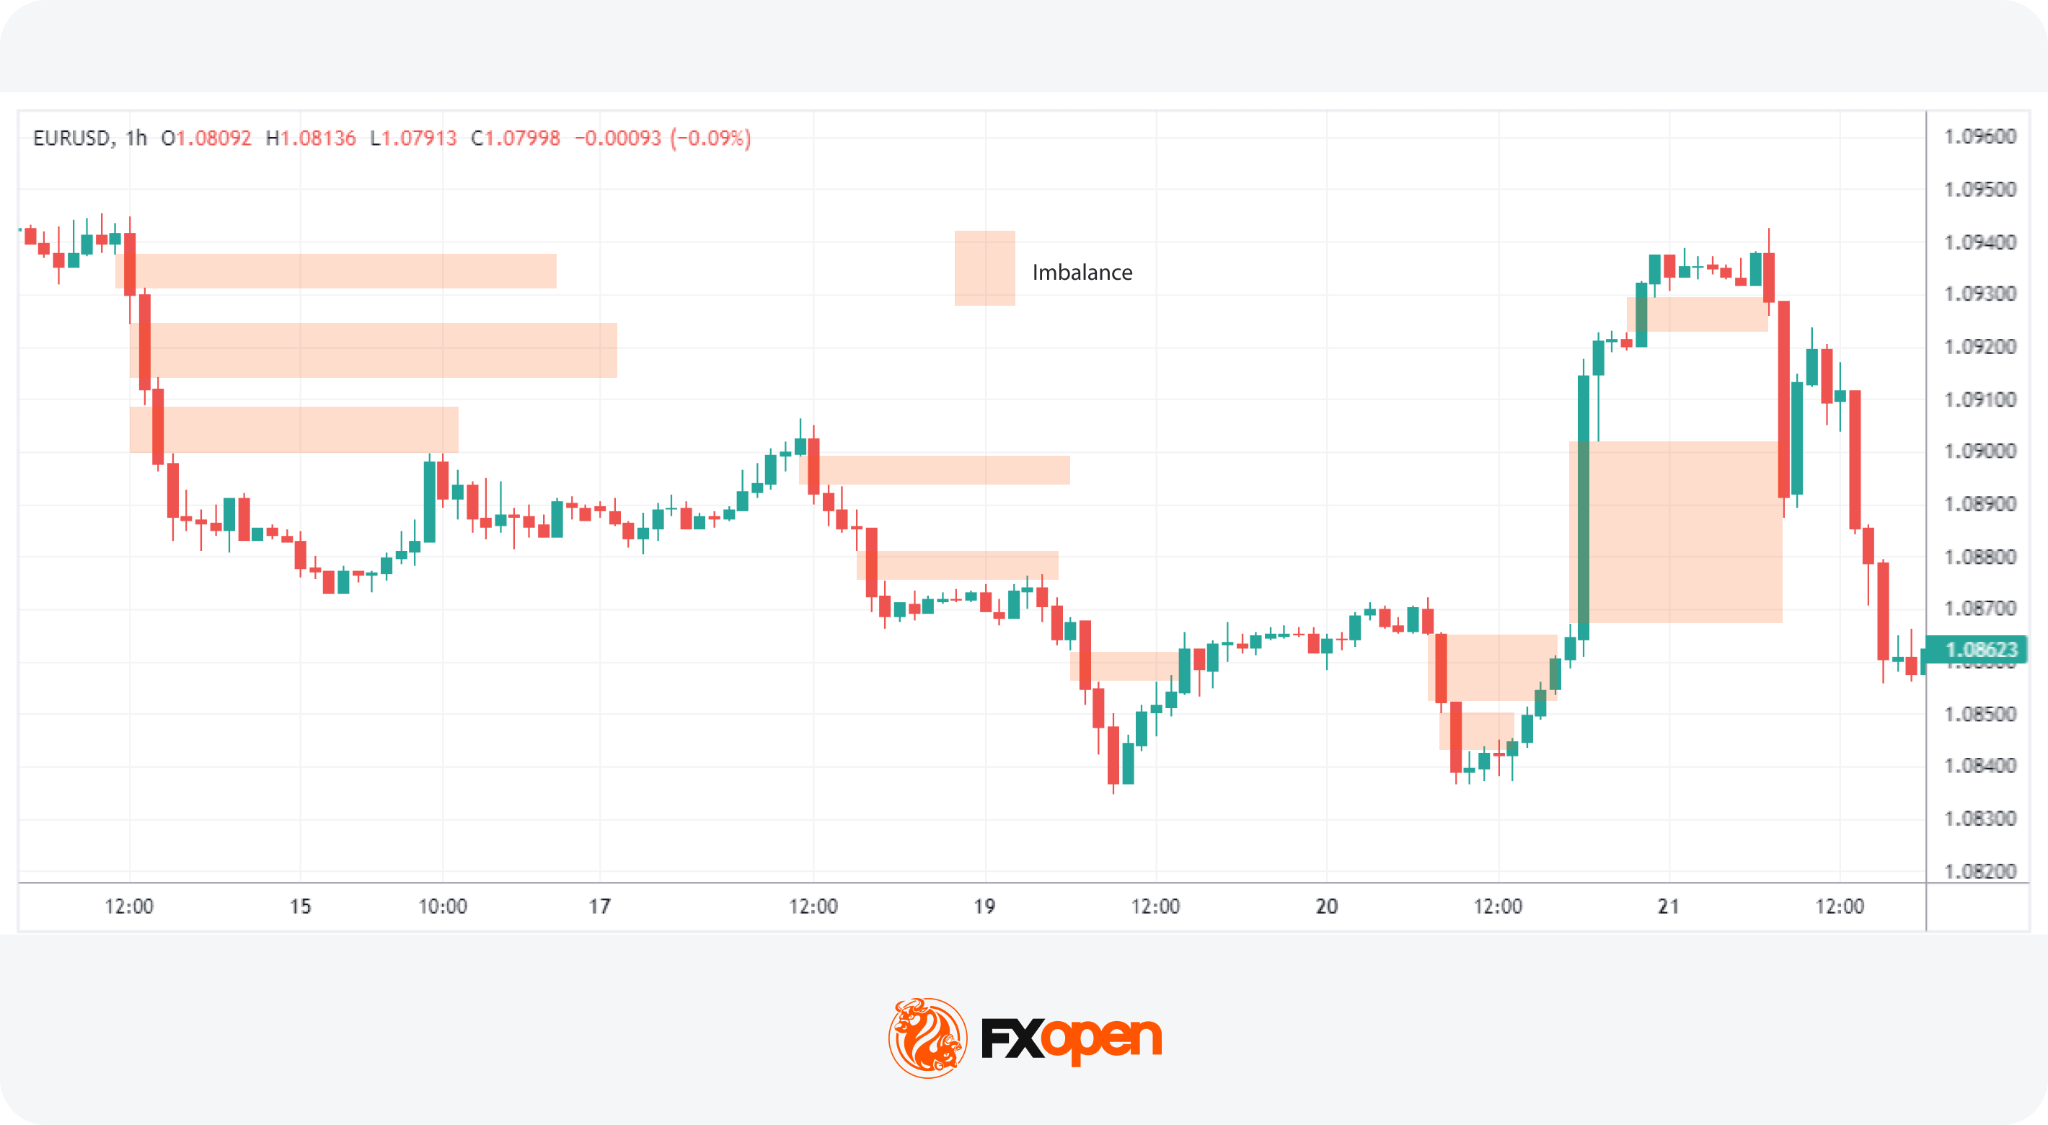
An imbalance in trading is a price zone where supply or demand heavily outweighs the opposite side, causing a sharp directional move with little trading in between. These zones sit at the heart of Smart Money Concept analysis. They shape how traders read momentum, structure, and entry points across forex and CFDs.
This article covers what drives imbalance in forex and CFDs and how it shows up on a chart. It walks through how an imbalance trading strategy may be built around price action, the link between an order flow imbalance and liquidity, and the difference between imbalance zones, fair value gaps, and order blocks.
What Is Imbalance in Trading?
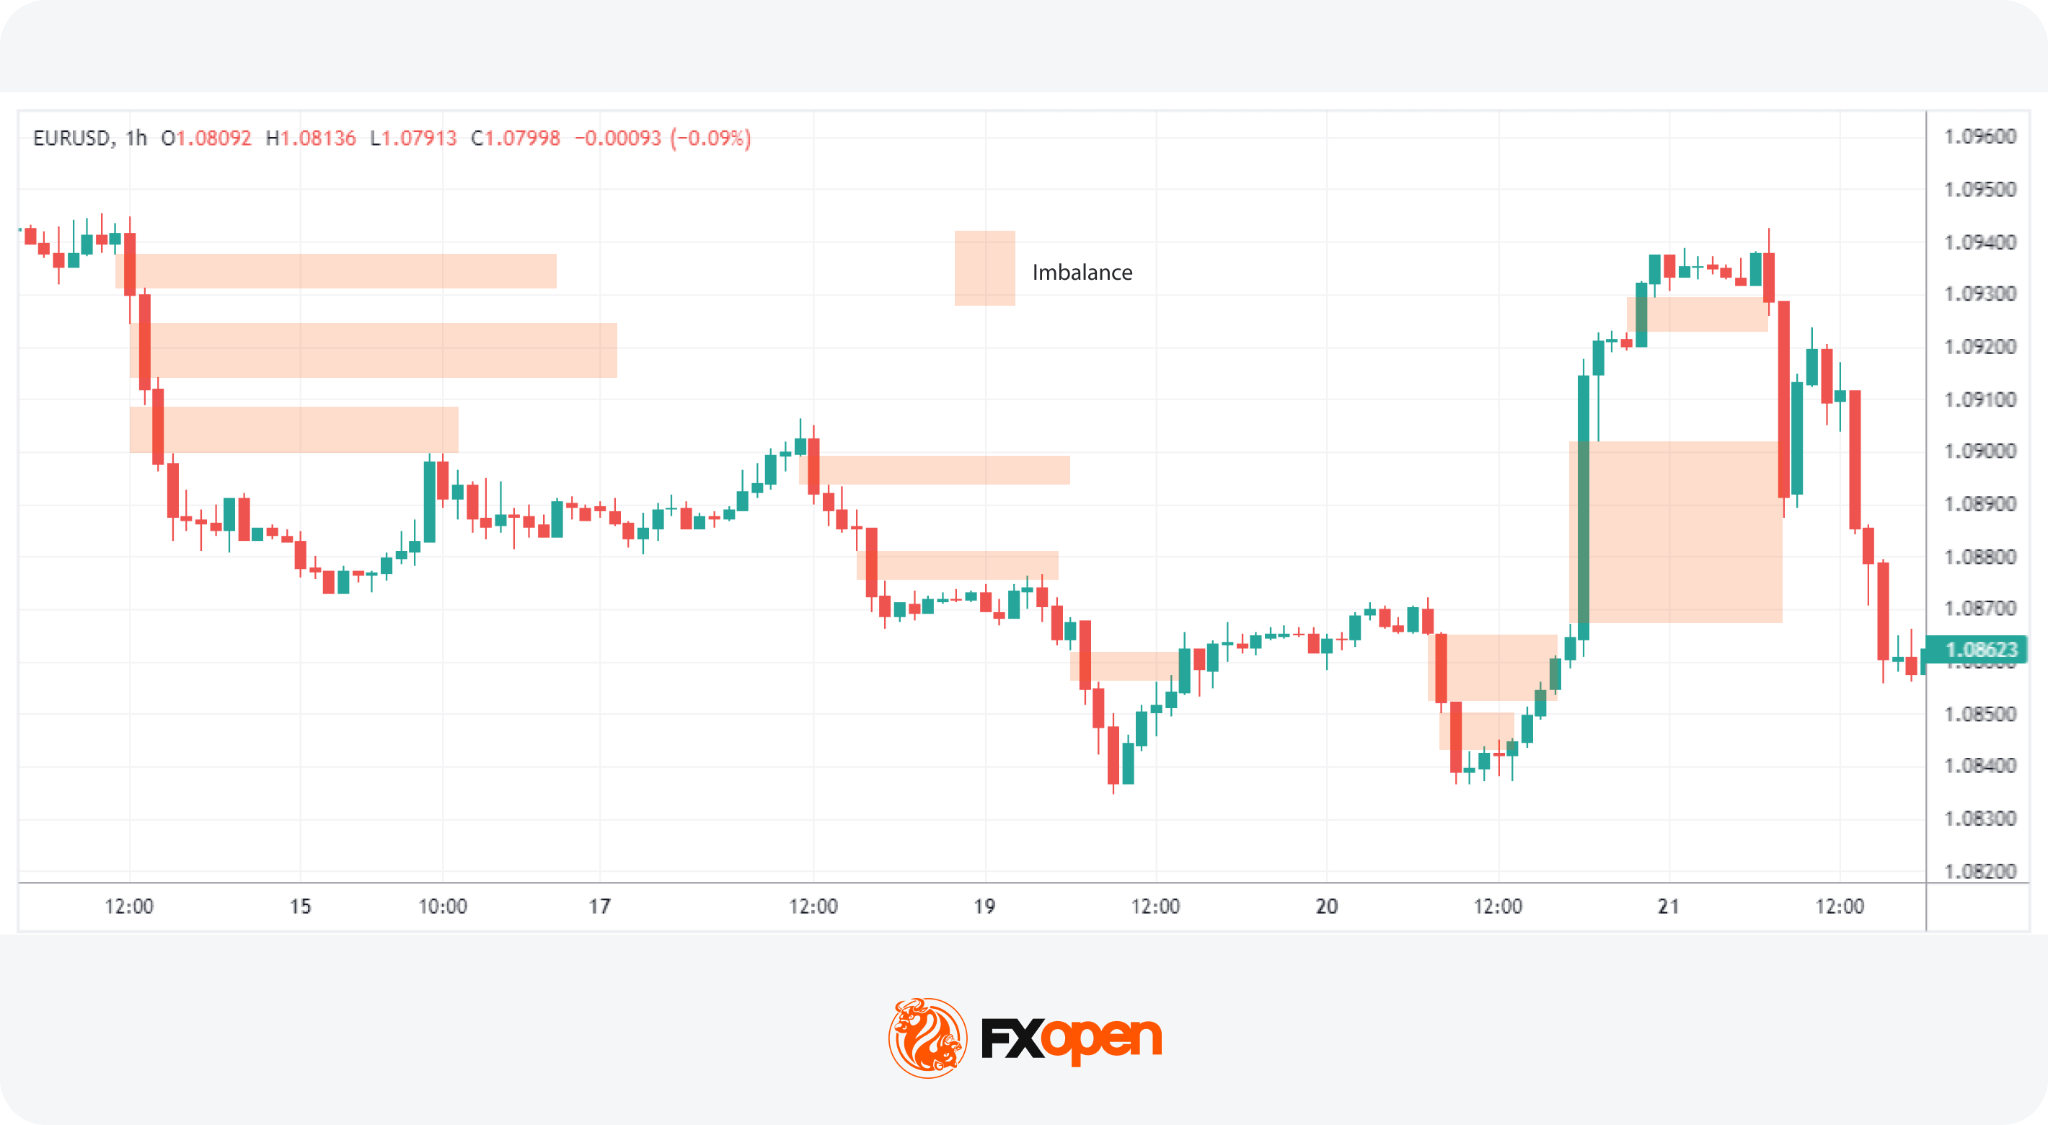
Imbalance in trading is a price zone where buy or sell orders heavily outweigh the opposite side, causing a sharp directional move with little trading in between. This imbalance of orders can significantly influence asset prices, pushing them up or down. It’s a fundamental concept in forex, crypto*, commodity, and stock markets.
Three related terms appear often:
- Imbalance: any zone where one side of the order flow dominates and price displaces sharply.
- Fair value gap (FVG): a three-candle pattern where wicks of the outer candles fail to overlap.
- Liquidity void: a wider displacement zone, often spanning several candles, that may contain multiple FVGs.
A market imbalance occurs when there’s an overwhelming interest from buyers (buy-side imbalance) or sellers (sell-side imbalance) without enough opposite-side orders to match. These zones are read by retail traders as visible footprints of large activity. Institutional desks often cause the imbalance themselves through size-driven execution the order book cannot absorb on one side.
Imbalance zones in trading are critical components of the Smart Money Concept (SMC), a framework that focuses on understanding the actions of institutional investors. SMC proponents argue that by analysing where and how these imbalances occur, traders can align their strategies with those of the market’s most influential players. The rationale is that institutional movements, often the cause behind significant imbalances, have the power to drive market trends.
Types of Imbalance in Trading
Order imbalances in trading come in different forms depending on direction, structure, and timeframe. Knowing which type is in front of you may shape how the zone is read and what reaction is expected.
- Buy-side vs sell-side imbalance: a buy-side imbalance is a sharp upward move where aggressive buy orders overwhelm available supply, leaving a thin zone below that price may revisit. A sell-side imbalance is a sharp downward move, where heavy selling pressure creates an unfilled gap above as price drops quickly.
- Fair value gap vs volume imbalance: a fair value gap is a structural three-candle pattern, while a volume imbalance focuses on disparity in traded volume between bid and offer at a level. Both highlight inefficiency but rely on different inputs.
- Micro vs macro imbalance: micro imbalances appear on 1-minute and 5-minute charts and may resolve within a session. Macro imbalances sit on the daily or weekly chart and may take weeks or months to fill.
Higher-timeframe imbalances usually carry more weight than lower-timeframe ones. For deeper context on the wider zones, the FXOpen article on liquidity zones and liquidity voids covers the mechanics in more detail.
Fair Value Gaps vs Imbalance vs Order Blocks
Imbalances, fair value gaps (FVGs), and order blocks are related but not identical. They sit on a spectrum of the same idea: a market inefficiency that price may return to.
An imbalance is the broad category. A fair value gap in forex is one specific imbalance pattern. An order block is the cause behind many imbalances, not the imbalance itself. Traders often combine the three: a fair value gap that forms just after an order block, in line with the prevailing trend, may carry stronger confluence than any single element alone.
Why Imbalances Matter in Trading
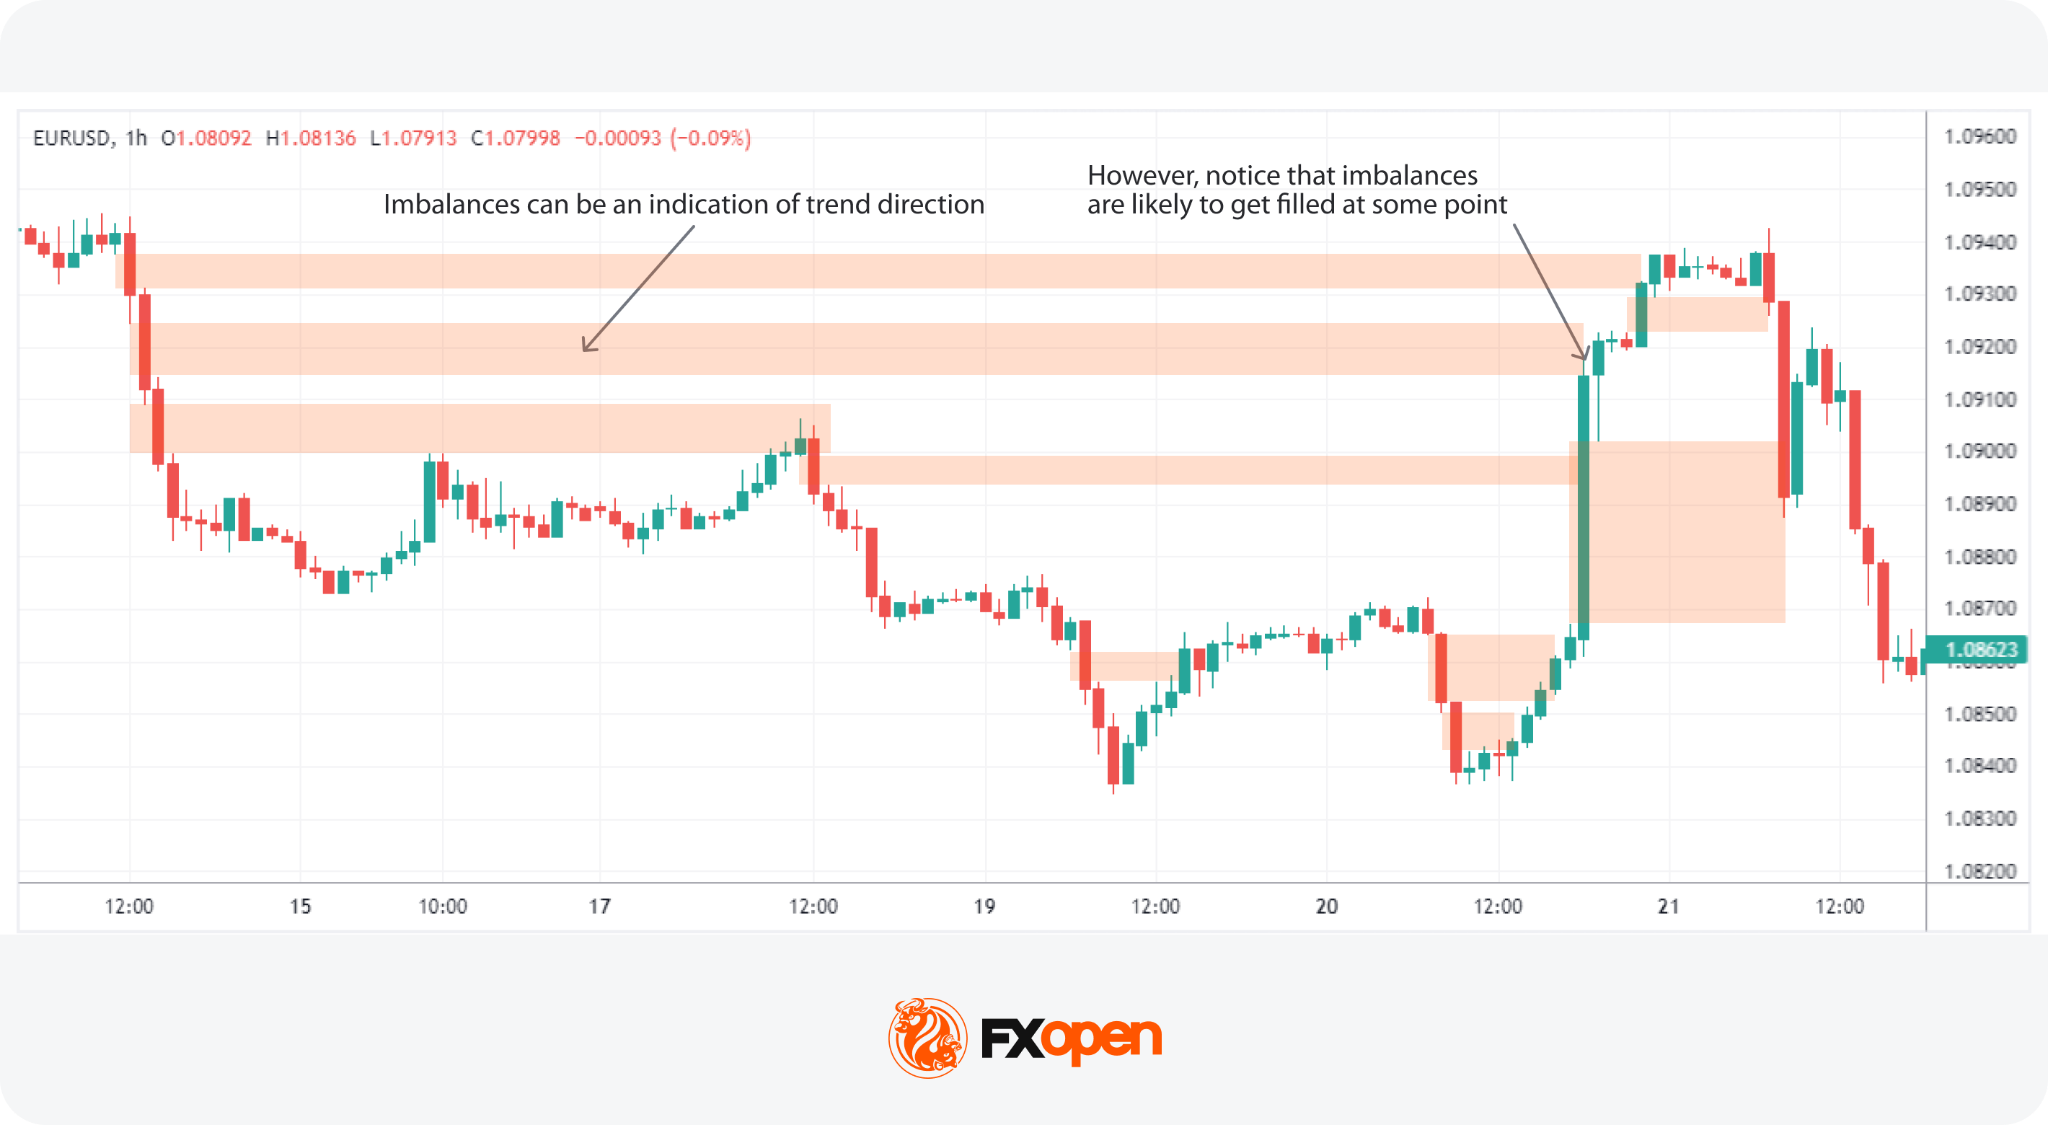
Traders often use imbalances to gauge market sentiment and direction. Large imbalances indicate a pronounced market preference for either buying or selling, suggesting that the trend in the direction of the imbalance is likely to persist. This directional insight is particularly potent with substantial imbalances (also known as liquidity voids), whereas smaller ones may be less useful for market analysis.
Markets tend to “fill” imbalance gaps, created by a lack of trading volume in a price range. This phenomenon hinges on the idea that prices gravitate towards areas of minimal resistance.
Price often returns to fill them, but some remain unfilled for weeks, months, or indefinitely, especially when tied to fundamental repricing events.
Three main reasons traders track imbalances:
- Trend continuation: an imbalance that forms with the higher-timeframe trend may act as a continuation signal.
- Mean reversion: price often retraces back into an imbalance before resuming, offering a reference point for entries.
- Liquidity targeting: large participants may push price through imbalances to access resting orders on the other side. Order flow analysis is a complementary concept here.
Imbalances offer probability, not certainty.
Identifying Imbalances on a Chart
How to identify imbalance in forex and CFD charts? In imbalance trading, traders look for areas where price moved rapidly with limited opposing activity. These conditions often reflect aggressive order flow entering the market while available liquidity on the opposite side remains limited. Fair value gaps (FVGs) are among the most common visual representations of imbalance on a forex or CFD chart.
A fair value gap is typically identified through a three-candle pattern. The central candle represents a strong impulsive move, while the candles before and after it create the boundaries of the imbalance zone. Once the third candle closes, the pattern may indicate that price moved through the area too quickly to establish balanced trading activity.
Strong displacement candles are often associated with meaningful imbalances. Common visual characteristics include:
- large candle bodies
- limited or no wick rejection
- breakout from consolidation
- expansion in volume
- rapid directional movement
The stronger the displacement, the more significant the imbalance is often considered.
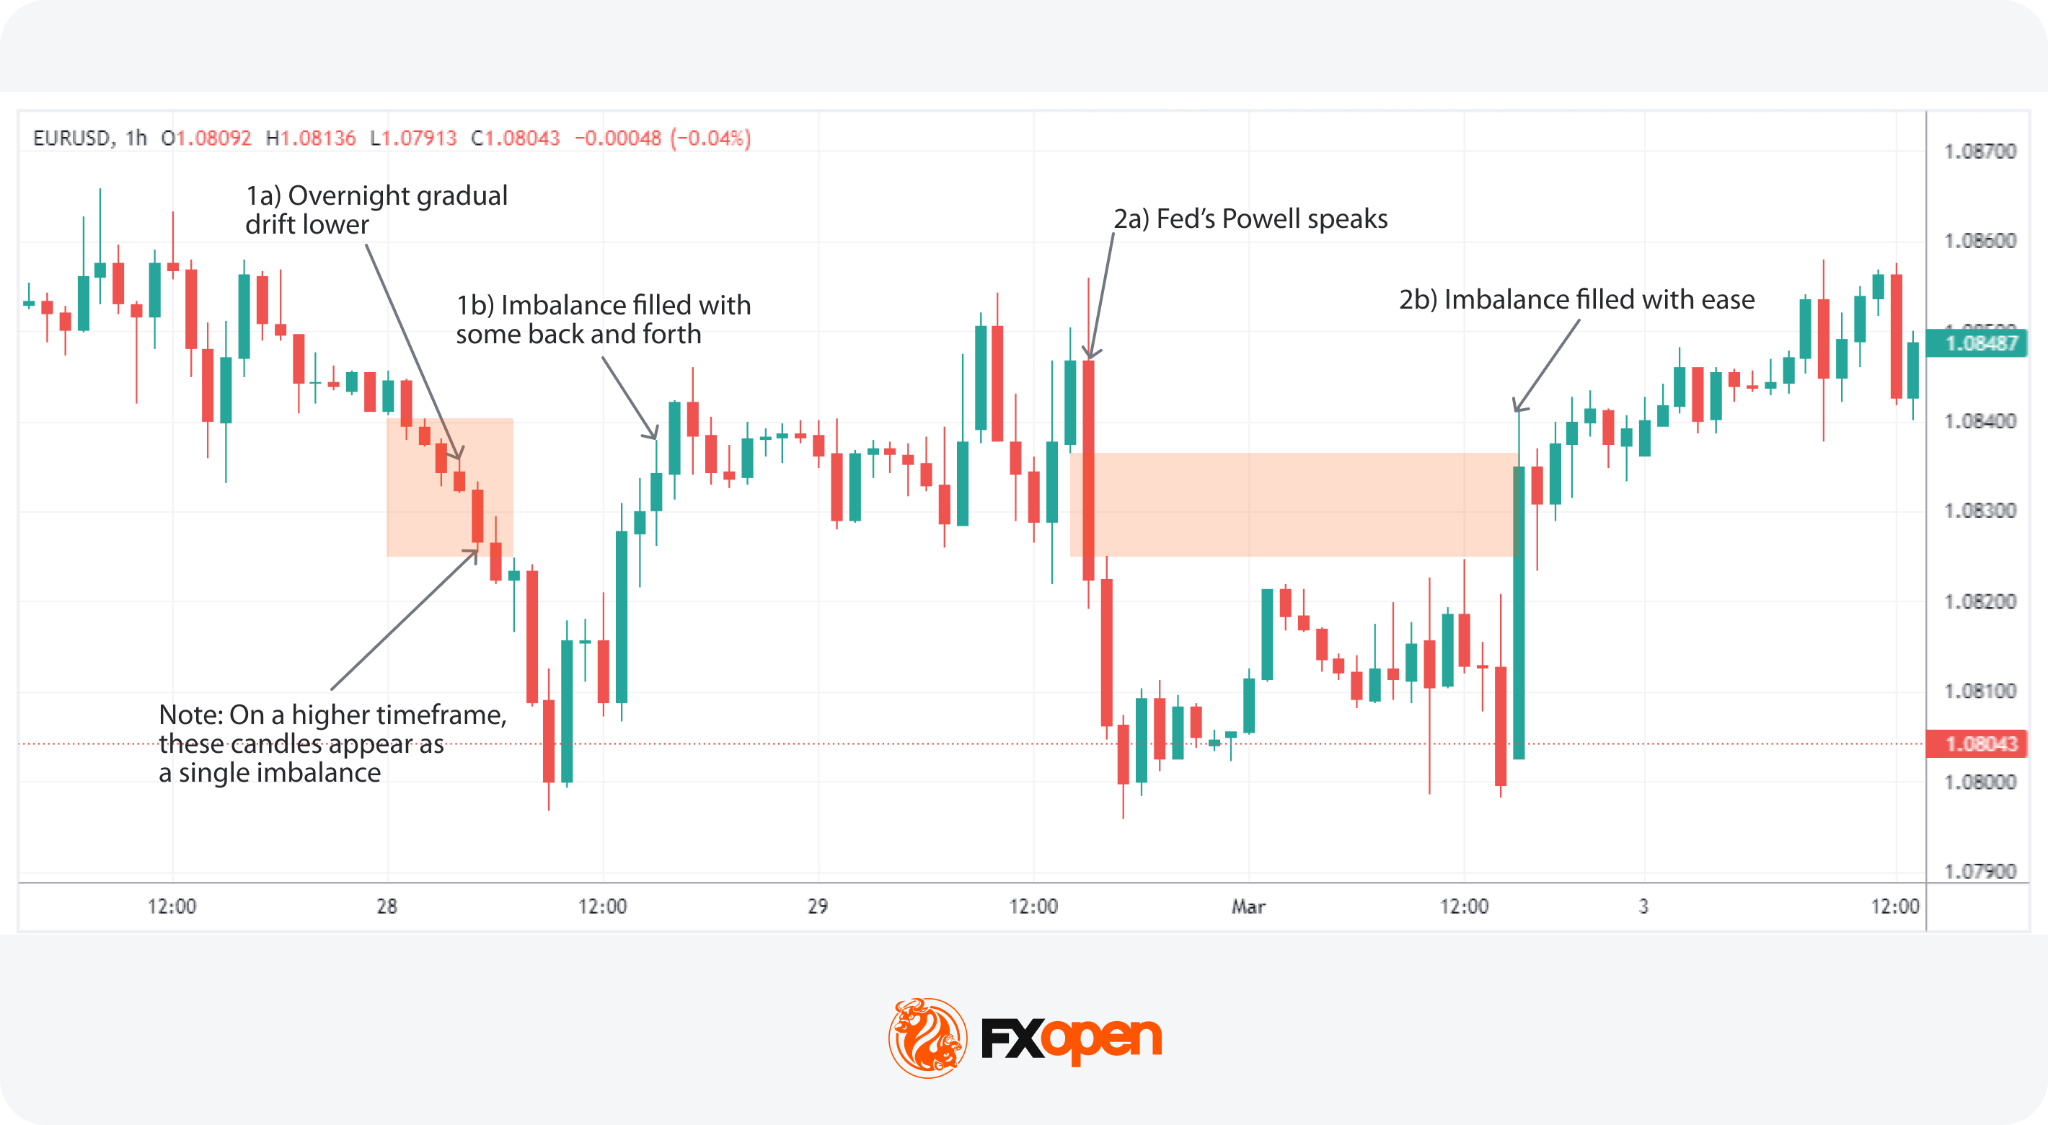
Imbalances may also appear as thin trading or low-interaction zones rather than textbook FVG structures. These areas often show limited candle overlap and minimal back-and-forth price action, indicating that the market moved rapidly through the zone.
A common process for identifying imbalance includes:
- identifying a strong impulsive move
- checking for limited candle overlap
- defining the imbalance boundaries
- comparing the setup with higher-timeframe structure
Timeframe hierarchy also matters. Imbalances that remain visible across both higher and lower timeframes are often considered more significant than those appearing only on lower charts. A daily imbalance may therefore carry more weight than a similar formation on a 5-minute chart. Higher-timeframe imbalance zones are often used as the primary reference area, while lower-timeframe imbalances may help refine entries.
Imbalance Trading Strategy Explained
An imbalance trading strategy combines trend direction, structure, and zone identification into a repeatable framework. According to theory, in an imbalance trading strategy, traders stick with the prevailing market trend. By combining trend analysis with imbalance identification, traders can align themselves with the market’s momentum and identify valuable setups.
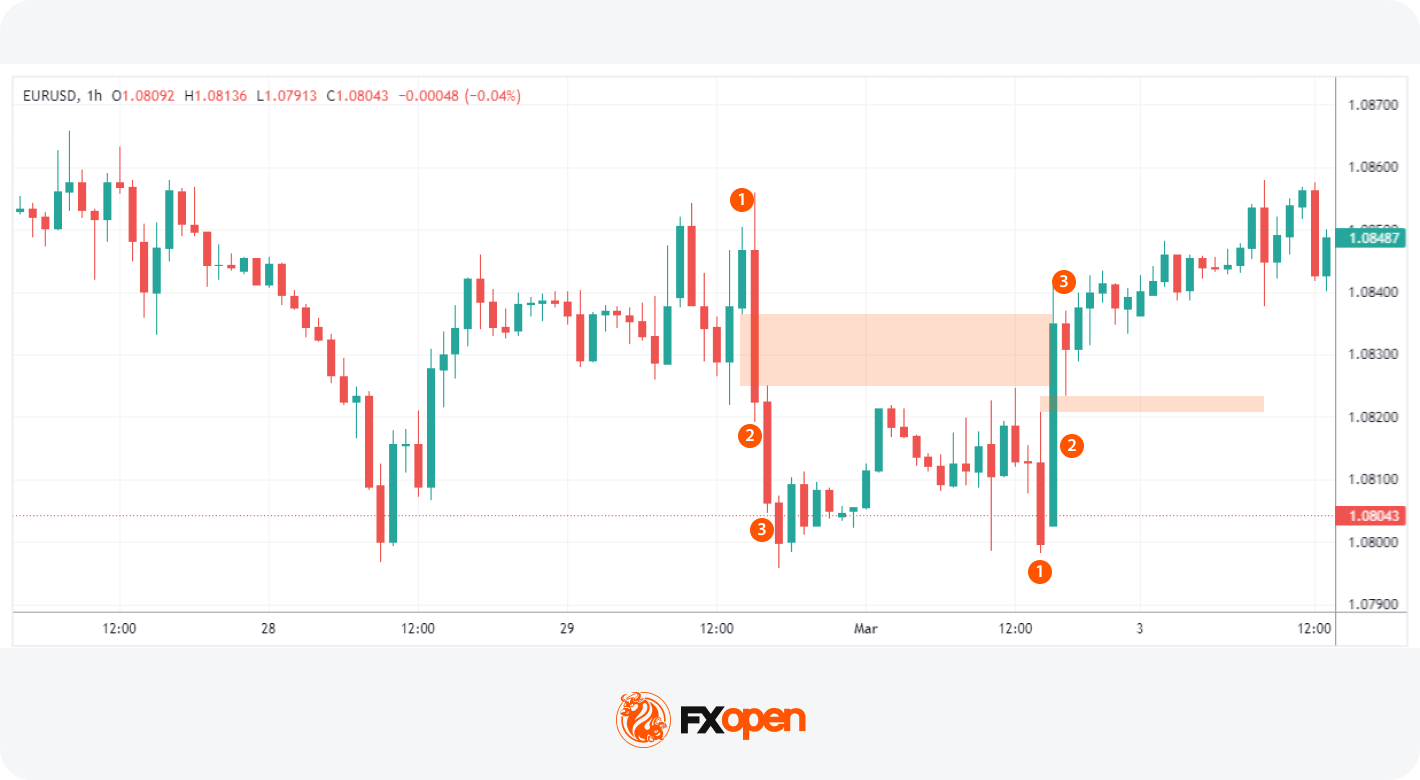
The Smart Money imbalance framework runs in four steps:
- Trend identification. In SMC, traders usually identify trends by examining market structure: higher highs and higher lows for bullish conditions, lower highs and lower lows for bearish. An Exponential Moving Average (EMA) may be applied as a simpler proxy. A downward-sloping EMA typically indicates a bearish trend, while an upward slope reflects bullish conditions.
- Imbalance formation. A strong displacement move may create an imbalance or fair value gap. Traders often monitor whether price later revisits this area before continuing in the direction of the prevailing trend.
- Order block identification. Traders then identify the last significant countertrend movement before a strong impulsive move. In Smart Money Concepts (SMC), this area is commonly referred to as an order block and may represent a zone where institutional activity previously entered the market.
- Entry point. Some traders wait for price to retrace back into the imbalance or order block after the impulsive move to enter the market in the trend direction. In bullish conditions, attention is usually placed on retracements into bullish imbalance zones; in bearish conditions, traders typically focus on retracements into bearish imbalance zones.
- Risk and exit planning. Stop-loss placement, position sizing, and exit logic are all defined before entry.
Consider following along on live charts in FXOpen’s TickTrader platform for the deepest understanding.
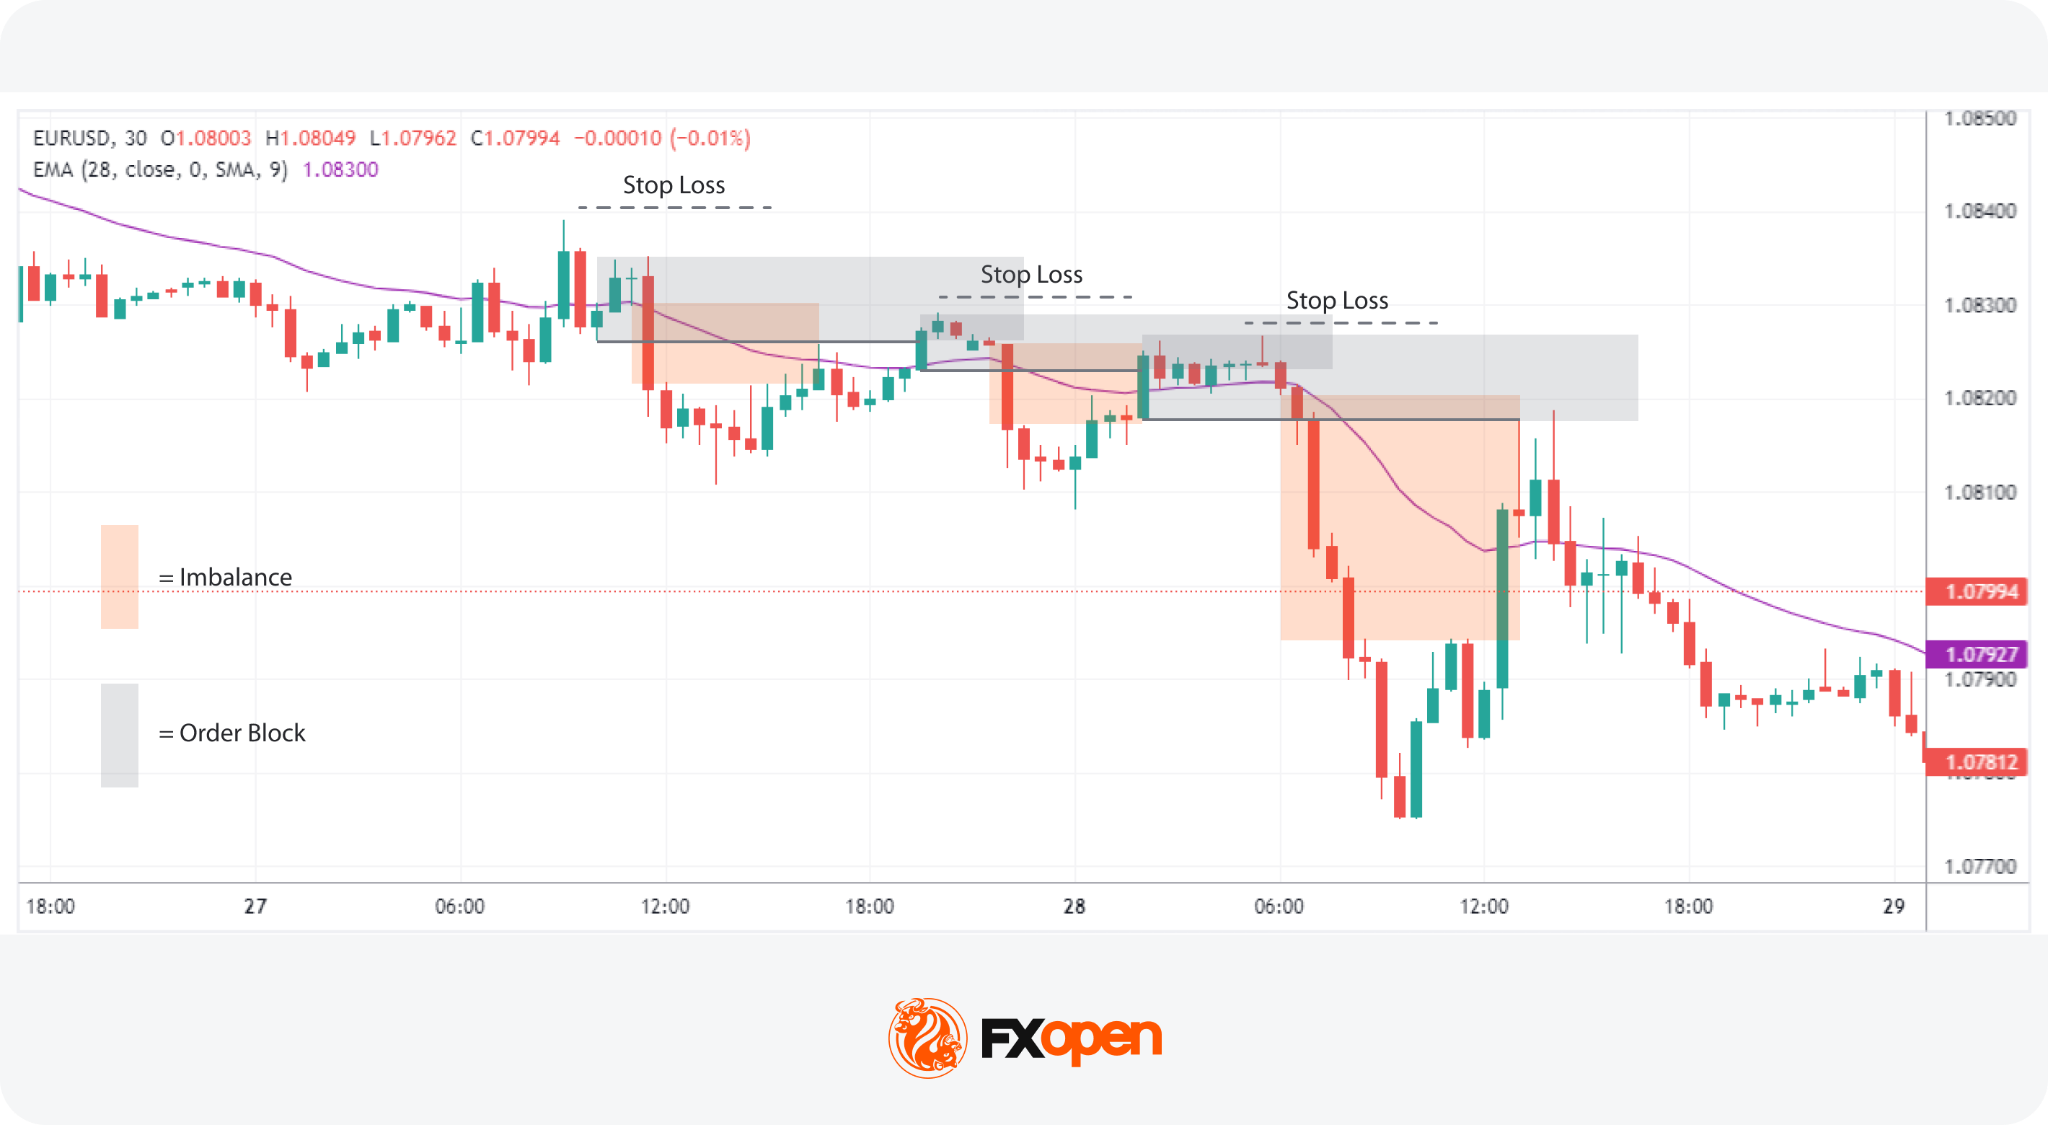
Entry
- Traders identify the market trend using the slope of an EMA.
- They look for an imbalance that results in a new high or low in line with the identified trend.
- The entry point in the trend direction may be set at the high (bullish trend) or low (bearish trend) of the last strong counter-trend candle before the imbalance.
Stop Loss
- A stop loss may be set just beyond the order block. This anchors risk to the structure that triggered the trade rather than an arbitrary pip distance.
Take Profit
- Profit-taking strategies may involve waiting for the price to fill another imbalance or reaching a predetermined technical level.
- To make the most of the trend, traders could employ trailing stops above or below new swing points or follow a longer-term moving average as a dynamic exit radar.
When Not to Trade
Some conditions reduce the reliability of imbalance trading setups:
- Just before major news releases, where volatility may spike and stops may be filled on noise rather than direction.
- When the imbalance forms against the higher-timeframe trend.
- In choppy, range-bound markets where directional bias is unclear.
- When multiple imbalances stack with no clean retracement, making entries harder to define.
Risk Considerations in Imbalance Trading
Imbalance setups offer structure, but they carry the same downsides as any pattern-based approach. Three areas warrant particular attention.
- False signals. Not every imbalance fills. Some price moves continue without retracement, especially during strong trends or trend reversals. A retracement into the zone is not guaranteed.
- News volatility. High-impact data releases can create imbalances that look textbook but resolve in unexpected ways. Slippage and widened spreads during these windows mean stop-losses may be filled at worse prices than expected.
- Overfitting and confirmation bias. Traders sometimes draw imbalances after the fact, marking only the patterns that worked. Without rules defined before the move, the strategy drifts into hindsight pattern-matching rather than systematic trading.
Defining clear entry, stop, and invalidation rules before the trade may support consistency. Risk management may potentially reduce reliance on any single signal when combined with broader structural analysis
Imbalance vs Liquidity
Imbalances and liquidity are linked mechanically. An imbalance forms precisely because liquidity on one side of the order book runs thin, allowing aggressive buying or selling to push price through several levels without resistance.
When aggressive buying or selling outpaces available counterparties at a price level, rapid repricing follows. This is the order flow imbalance in action, and it leaves the visible footprint traders mark as a fair value gap or liquidity void.
What Causes Imbalance in Trading?
Imbalances in forex and CFDs are driven by four main forces: news shocks, institutional flow, sentiment shifts, and technical triggers. Each one shifts the order book in a distinct way, and the order flow impact behind each helps explain why the visible gap forms on the chart. Academic work on market microstructure, including the Bank for International Settlements paper on market liquidity, examines how these forces interact at the deepest level.
High-impact news releases and economic events can quickly skew the balance as traders react en masse to new information, either flooding the market with buy orders or triggering a sell-off. Central bank decisions, inflation prints, and employment data are among the most common triggers. The order flow impact is immediate: liquidity providers widen spreads or pull resting orders, and price gaps to a new level.
Due to their sheer volume, large institutional orders create imbalances by outpacing the market’s ability to absorb them, sharply moving prices in one direction. The order flow impact here is more deliberate. A fund executing a sizable trade may break the order across price levels, but the cumulative pressure still consumes resting liquidity and leaves a visible imbalance behind.
Shifts in market sentiment, driven by broader economic indicators or trending market narratives, can collectively tilt trading activity towards buying or selling, further contributing to order flow imbalance. The shift is often gradual rather than sudden, but the cumulative result still drives one side of the book to dominate.
Technical factors, like prices reaching critical support or resistance levels, can activate automated trading algorithms that rapidly buy or sell, exacerbating the imbalance as these systems execute large-scale trades based on pre-set conditions. The order flow impact tends to be self-reinforcing: a breakout triggers more algorithmic activity, which extends the move and deepens the imbalance.
The Bottom Line
Order imbalances can serve as an indicator of market sentiment, helping traders recognise when supply and demand are not synchronised. By learning how to identify these situations and incorporating them into a structured trading approach, traders may spot potential price moves before they unfold. As with any strategy, combining order imbalance analysis with risk management and other technical tools can support traders when making trading decisions and provide a more balanced view of the market.
If you seek to apply these concepts in real-world scenarios, you can consider opening an FXOpen account, which offers trading with tight spreads and low commissions.
FAQs
What Is Imbalance in Trading?
In trading, an imbalance refers to a situation where buy orders significantly outnumber sell orders, or vice versa, leading to potential shifts in asset prices. This disproportion indicates strong market sentiment towards either buying or selling, impacting price movement direction.
What Causes Imbalance in Forex Markets?
Trade imbalances are primarily caused by significant news releases, large institutional orders, shifts in market sentiment, and technical triggers. These factors can lead to a sudden surge in buying or selling activity, creating an imbalance between supply and demand.
What Is an Imbalance Zone?
An imbalance zone is a specific area on a trading chart where the price has moved sharply, creating a gap known as a fair value gap. This gap signifies a period during which trading volume was minimal, suggesting a potential area for price to return to in the future.
What Is the Order Imbalance-Based Strategy?
The order imbalance-based strategy involves identifying moments when buy or sell orders dominate and using this information to anticipate future price movements. Traders use these imbalances to inform their entry and exit points.
What Is the Difference Between a Fair Value Gap and a Volume Imbalance?
A fair value gap refers to a price area skipped over during rapid market movement, indicating a potential return point for the price. Volume imbalance, however, specifically relates to the difference in volume between buy and sell orders, impacting price direction without necessarily creating a visual gap on the chart.
What Is a Fair Value Gap?
A fair value gap (FVG) is a three-candle pattern where the wicks of the outer two candles fail to overlap, leaving a gap between them. It is one specific form of imbalance and often appears during sharp directional moves. Traders watch FVGs as zones may be revisited before continuing the prevailing trend.
Does Price Always Return to an Imbalance?
No, price does not always return to an imbalance. Many imbalances are filled within hours, days, or weeks, but some remain open indefinitely, particularly those tied to fundamental repricing events such as central bank decisions or major economic shifts. Traders treat imbalance fills as probable rather than guaranteed and combine them with broader structural analysis.
What Is the Difference Between Imbalance and Order Block?
An imbalance is the visible gap or thin zone left after a strong directional move. An order block is the last opposing candle before that move, where institutional orders are thought to have been placed. The order block is the cause, the imbalance is the effect. Traders often look for both elements to align before entering.
How Is Imbalance Identified on a Chart?
Imbalance is commonly identified through strong displacement candles, fair value gaps, or areas with limited candle overlap. Traders often look for rapid directional movement, breakout conditions, and low-interaction price zones that suggest the market moved too quickly to establish balanced trading activity.
What Timeframes Are Used for Imbalance Trading?
Imbalance trading is applied across all timeframes, from 1-minute charts up to the weekly. Higher timeframes such as 4-hour, daily, and weekly tend to produce stronger imbalances. Lower timeframes are typically used for entry refinement once a higher-timeframe imbalance has been located. Multi-timeframe analysis sits at the core of the approach.
*Important: At FXOpen UK, Cryptocurrency trading via CFDs is only available to our Professional clients. They are not available for trading by Retail clients. To find out more information about how this may affect you, please get in touch with our team.
This article represents the opinion of the Companies operating under the FXOpen brand only. It is not to be construed as an offer, solicitation, or recommendation with respect to products and services provided by the Companies operating under the FXOpen brand, nor is it to be considered financial advice.
Earnings call transcript: Tupy S.A. reports Q1 2026 loss, revenue beats

XRP gives back gains after Senate crypto bill sparks 5% rally

Pressure mounts for Toronto FC in wake of poor homestand
Manchester United reach agreement with Casemiro over contract clause amid transfer speculation

US brings back mandatory military draft registration

Steven Gerrard disagrees with Gary Neville over ‘shock’ Chelsea and Arsenal claim | Football

XRP JUST GOT SUPERCHARGED!!! ”XRP Going Much Higher”?!

Buy or Rent in 2026? Complete Guide to Making the Smart Financial Decision

Forensic Audit – Why 2026 Financial Crisis Could Trigger World War 3 (Financial History Explained)
-

 Fashion7 days ago
Weekend Open Thread: Marianne Dress
-

 Fashion4 days ago
Coffee Break: Travel Steam Iron
-

 Fashion5 days ago
What to Know Before Buying a Curling Wand or Curling Iron
-

 Politics4 days ago
What to expect when you’re expecting a budget
-

 Tech5 days ago
Auto Enthusiast Carves Functional Two-Stroke Engine from Solid Metal
-

 Politics6 days ago
Politics Home Article | Starmer Enters The Danger Zone
-
 Business6 days ago
Ignore market noise, India’s long-term story intact, say D-Street bulls Ramesh Damani and Sunil Singhania
-

 Tech4 days ago
GM Agrees To Pay $12.75 Million To Settle California Lawsuit Over Misuse Of Customers’ Driving Data
-

 Crypto World6 days ago
PROS explodes 48% as Upbit and Bithumb listings ignite demand
-

 Crypto World5 days ago
CZ says US crypto rivals tried to block Trump pardon
-

 Tech4 days ago
GM agrees to $12.75M California settlement over sale of drivers’ data
-

 Entertainment7 days ago
YNW Melly Denied Bond Again Ahead Of Double Murder Retrial
-

 Crypto World7 days ago
Kraken Parent Seeks OCC Charter, Signaling Regulated Banking Access
-
Crypto World7 days ago
The Hantavirus Danger: Can a Potential Outbreak Spark a New Meme Coin Frenzy?
-
Crypto World2 days ago
Bitcoin Suisse expands with Digital Asset License and Investment Business Act Registration Approval in Bermuda
-

 Sports7 days ago
Why Nathan Mackinnon Remains the Hart Trophy Favourite over Connor McDavid and Nikita Kucherov | NHL
-

 Sports7 days ago
After Waka Waka, Shakira now drops first teaser for FIFA WC 2026 song | FIFA World Cup 2022
-
 Crypto World7 days ago
Solana UFO Meme Coins Surge After Pentagon Reveals Alien Files
-

 Entertainment7 days ago
Bethenny Frankel Says She Loves ‘Torturing’ Men
-

 Politics3 days ago
Pakistan to enter Chinese capital market as war inflation bites
You must be logged in to post a comment Login