

Crypto World
Imbalance Trading in Forex and CFDs
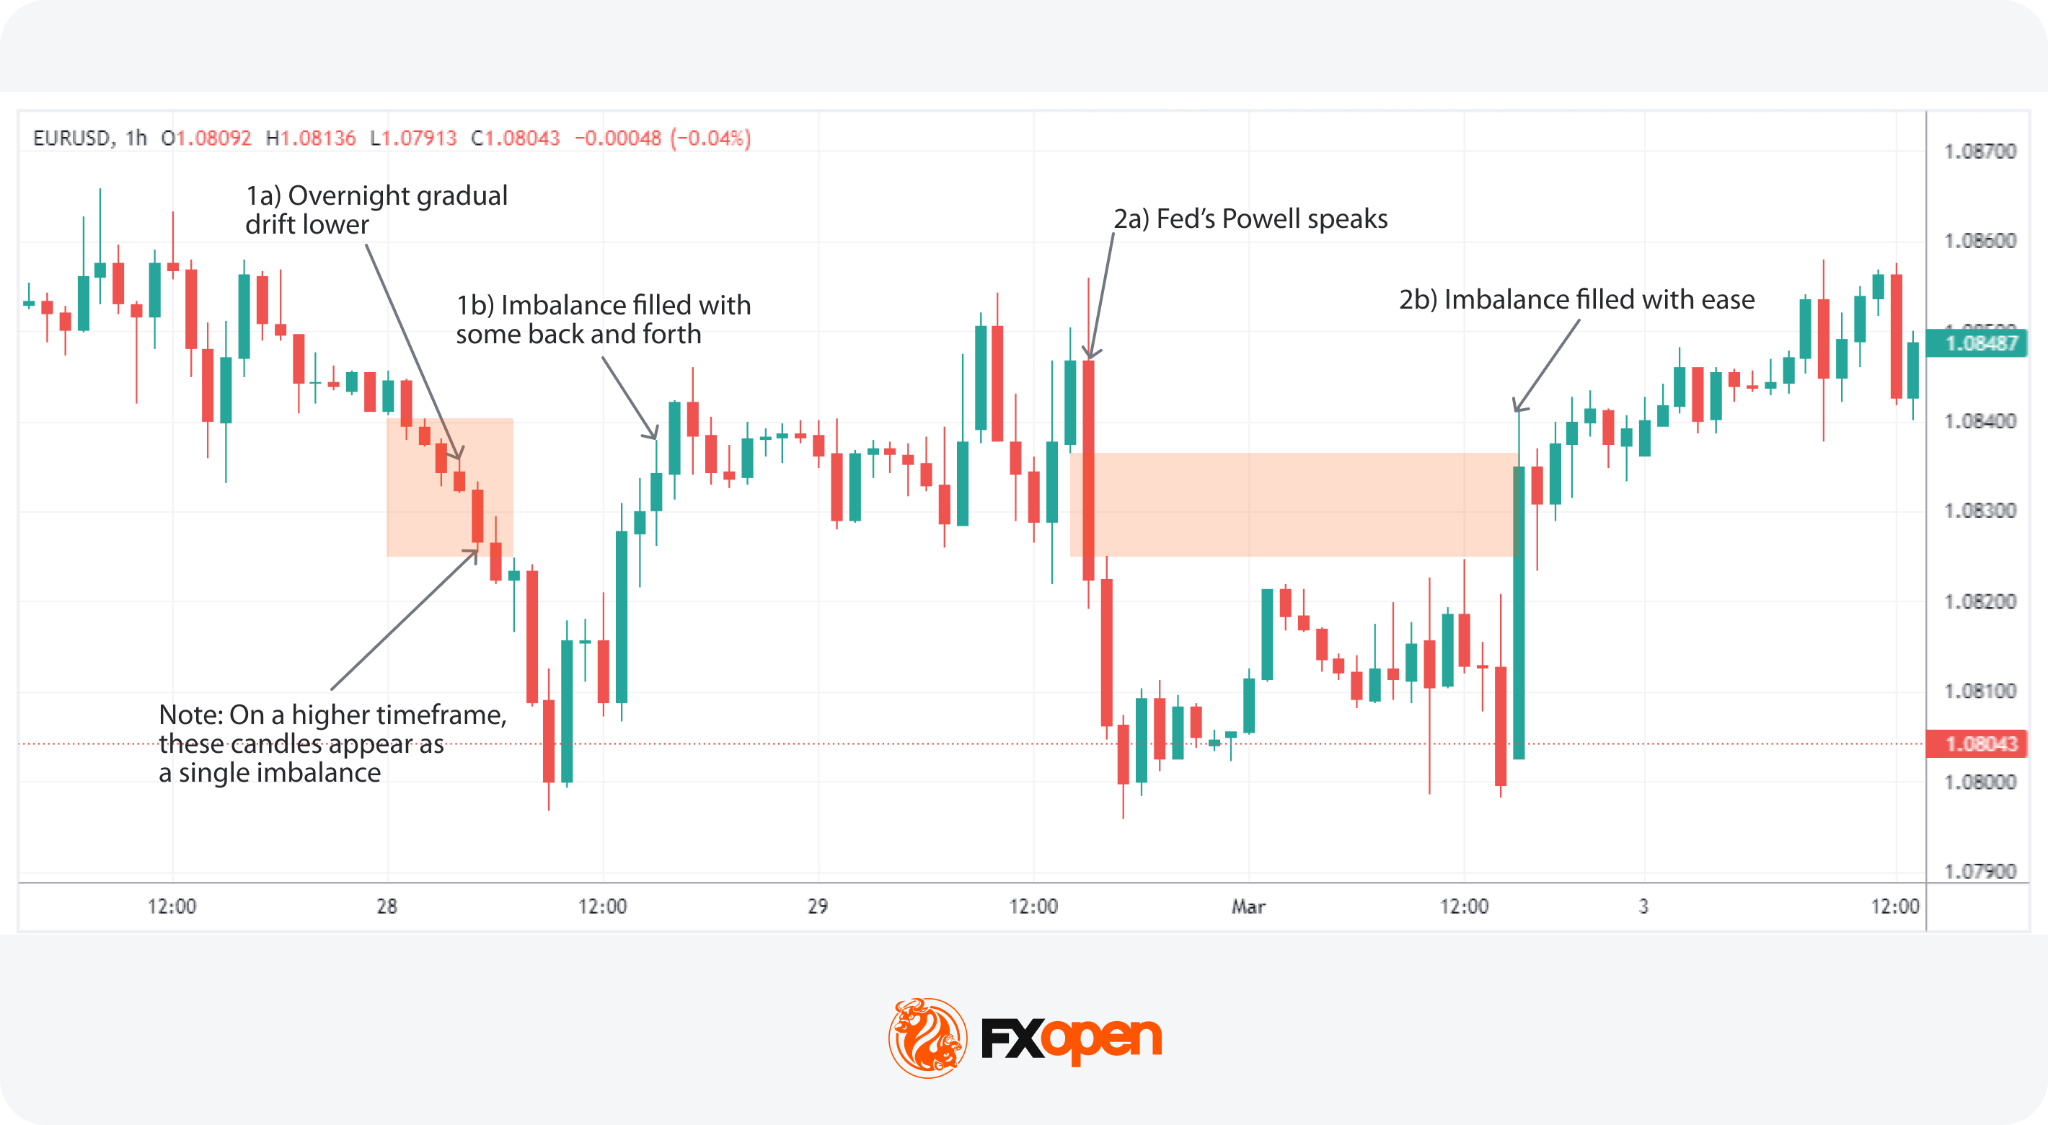
An imbalance in trading is a price zone where supply or demand heavily outweighs the opposite side, causing a sharp directional move with little trading in between. These zones sit at the heart of Smart Money Concept analysis. They shape how traders read momentum, structure, and entry points across forex and CFDs.
This article covers what drives imbalance in forex and CFDs and how it shows up on a chart. It walks through how an imbalance trading strategy may be built around price action, the link between an order flow imbalance and liquidity, and the difference between imbalance zones, fair value gaps, and order blocks.
What Is Imbalance in Trading?
Imbalance in trading is a price zone where buy or sell orders heavily outweigh the opposite side, causing a sharp directional move with little trading in between. This imbalance of orders can significantly influence asset prices, pushing them up or down. It’s a fundamental concept in forex, crypto*, commodity, and stock markets.
Three related terms appear often:
- Imbalance: any zone where one side of the order flow dominates and price displaces sharply.
- Fair value gap (FVG): a three-candle pattern where wicks of the outer candles fail to overlap.
- Liquidity void: a wider displacement zone, often spanning several candles, that may contain multiple FVGs.
A market imbalance occurs when there’s an overwhelming interest from buyers (buy-side imbalance) or sellers (sell-side imbalance) without enough opposite-side orders to match. These zones are read by retail traders as visible footprints of large activity. Institutional desks often cause the imbalance themselves through size-driven execution the order book cannot absorb on one side.
Imbalance zones in trading are critical components of the Smart Money Concept (SMC), a framework that focuses on understanding the actions of institutional investors. SMC proponents argue that by analysing where and how these imbalances occur, traders can align their strategies with those of the market’s most influential players. The rationale is that institutional movements, often the cause behind significant imbalances, have the power to drive market trends.
Types of Imbalance in Trading
Order imbalances in trading come in different forms depending on direction, structure, and timeframe. Knowing which type is in front of you may shape how the zone is read and what reaction is expected.
- Buy-side vs sell-side imbalance: a buy-side imbalance is a sharp upward move where aggressive buy orders overwhelm available supply, leaving a thin zone below that price may revisit. A sell-side imbalance is a sharp downward move, where heavy selling pressure creates an unfilled gap above as price drops quickly.
- Fair value gap vs volume imbalance: a fair value gap is a structural three-candle pattern, while a volume imbalance focuses on disparity in traded volume between bid and offer at a level. Both highlight inefficiency but rely on different inputs.
- Micro vs macro imbalance: micro imbalances appear on 1-minute and 5-minute charts and may resolve within a session. Macro imbalances sit on the daily or weekly chart and may take weeks or months to fill.
Higher-timeframe imbalances usually carry more weight than lower-timeframe ones. For deeper context on the wider zones, the FXOpen article on liquidity zones and liquidity voids covers the mechanics in more detail.
Fair Value Gaps vs Imbalance vs Order Blocks
Imbalances, fair value gaps (FVGs), and order blocks are related but not identical. They sit on a spectrum of the same idea: a market inefficiency that price may return to.
An imbalance is the broad category. A fair value gap in forex is one specific imbalance pattern. An order block is the cause behind many imbalances, not the imbalance itself. Traders often combine the three: a fair value gap that forms just after an order block, in line with the prevailing trend, may carry stronger confluence than any single element alone.
Why Imbalances Matter in Trading
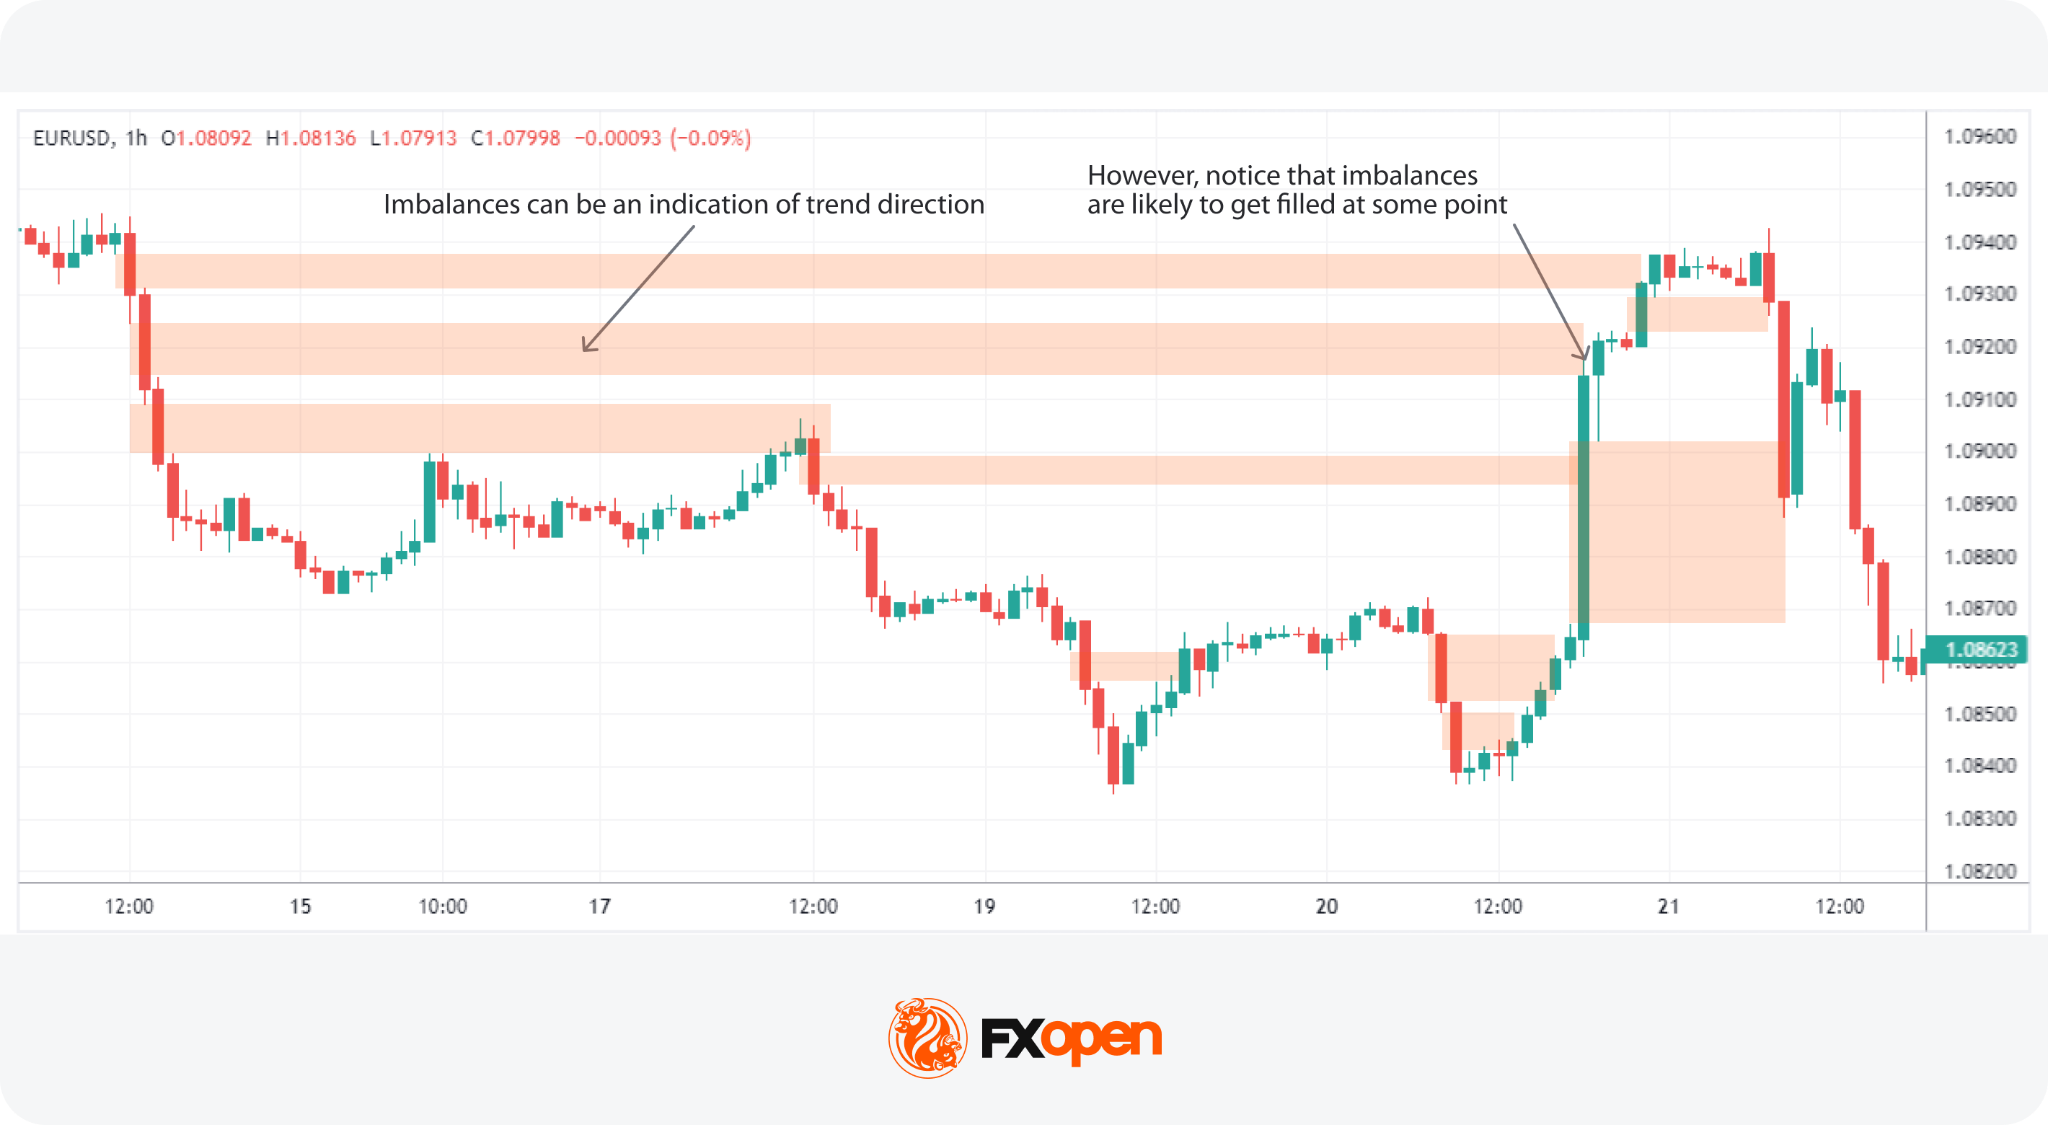
Traders often use imbalances to gauge market sentiment and direction. Large imbalances indicate a pronounced market preference for either buying or selling, suggesting that the trend in the direction of the imbalance is likely to persist. This directional insight is particularly potent with substantial imbalances (also known as liquidity voids), whereas smaller ones may be less useful for market analysis.
Markets tend to “fill” imbalance gaps, created by a lack of trading volume in a price range. This phenomenon hinges on the idea that prices gravitate towards areas of minimal resistance.
Price often returns to fill them, but some remain unfilled for weeks, months, or indefinitely, especially when tied to fundamental repricing events.
Three main reasons traders track imbalances:
- Trend continuation: an imbalance that forms with the higher-timeframe trend may act as a continuation signal.
- Mean reversion: price often retraces back into an imbalance before resuming, offering a reference point for entries.
- Liquidity targeting: large participants may push price through imbalances to access resting orders on the other side. Order flow analysis is a complementary concept here.
Imbalances offer probability, not certainty.
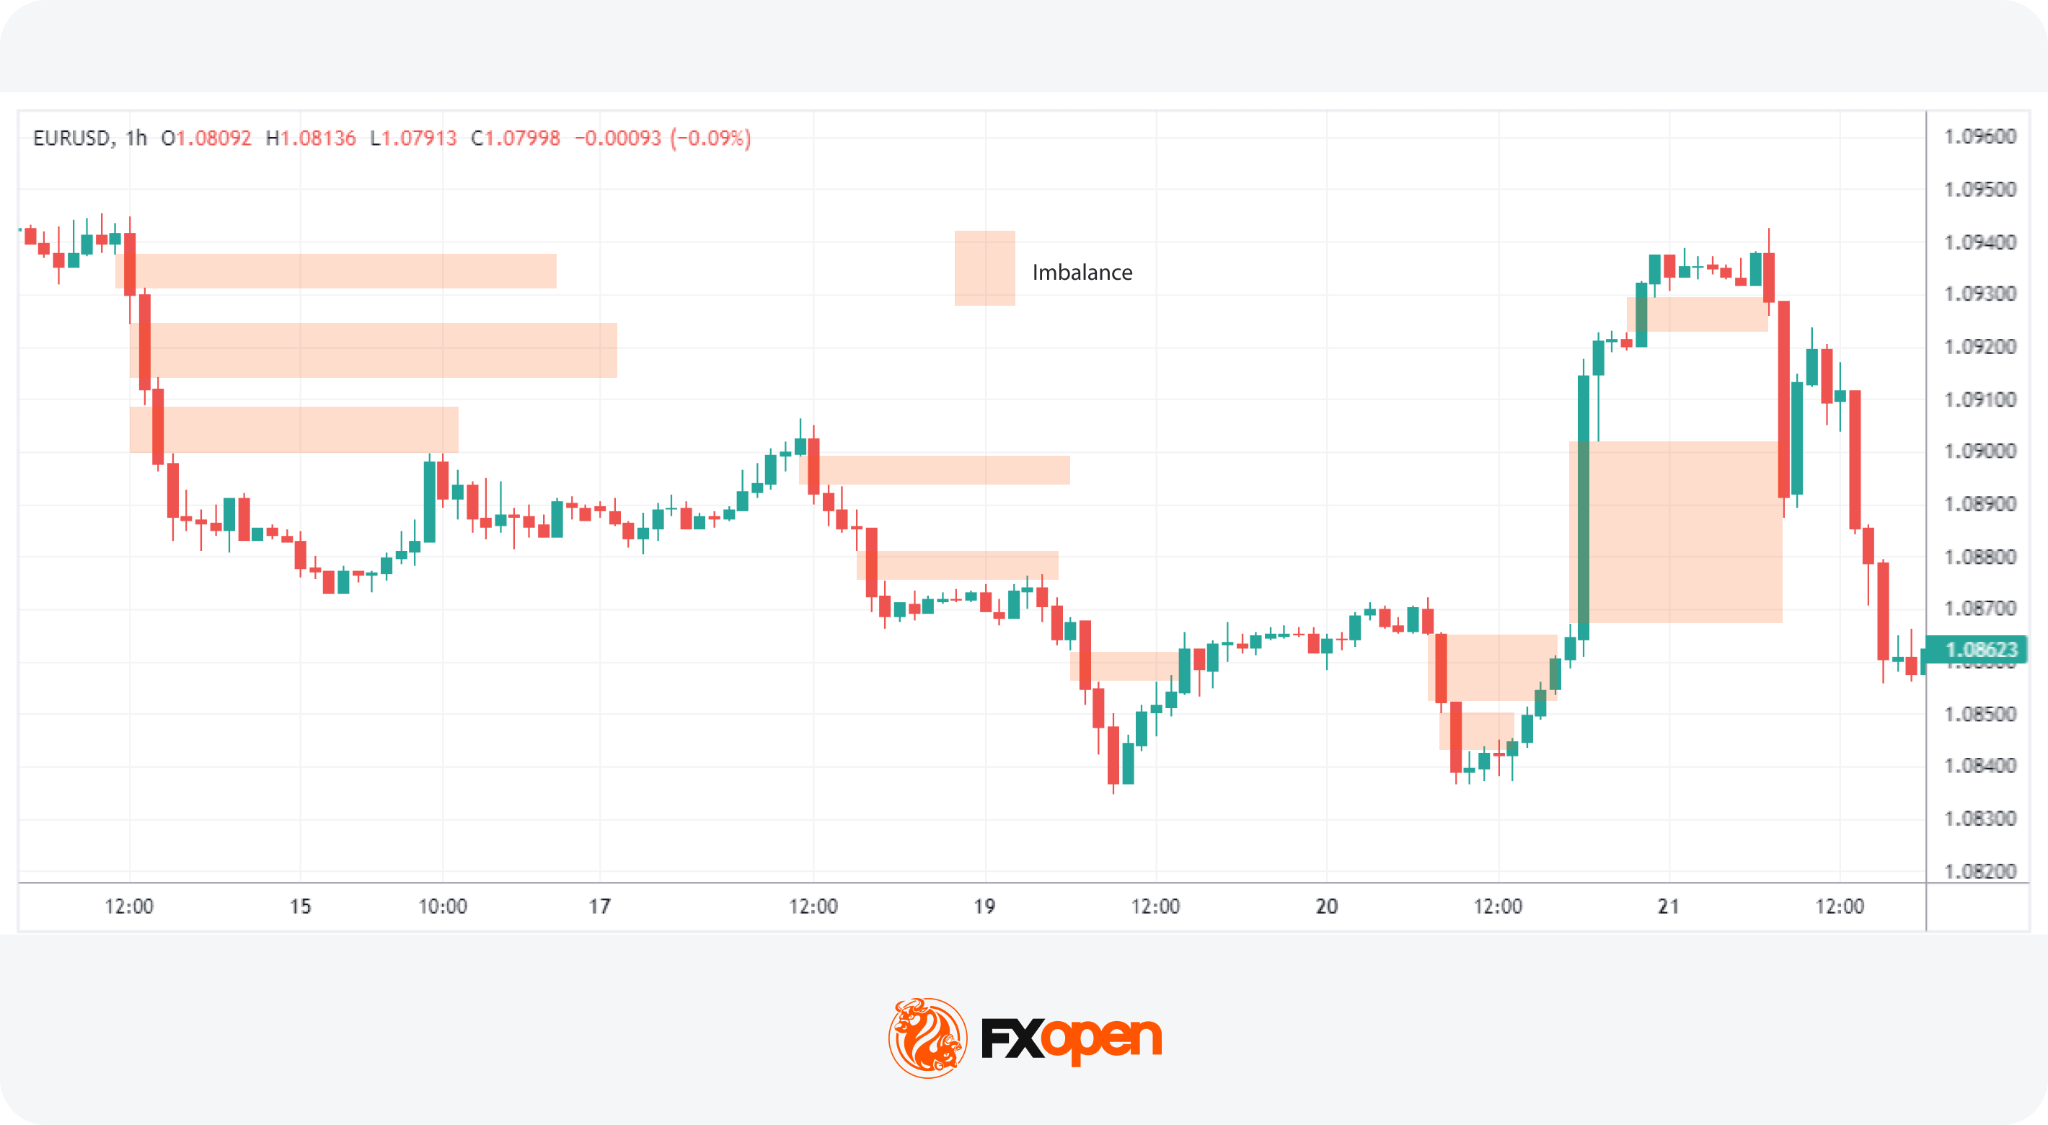
Identifying Imbalances on a Chart
How to identify imbalance in forex and CFD charts? In imbalance trading, traders look for areas where price moved rapidly with limited opposing activity. These conditions often reflect aggressive order flow entering the market while available liquidity on the opposite side remains limited. Fair value gaps (FVGs) are among the most common visual representations of imbalance on a forex or CFD chart.
A fair value gap is typically identified through a three-candle pattern. The central candle represents a strong impulsive move, while the candles before and after it create the boundaries of the imbalance zone. Once the third candle closes, the pattern may indicate that price moved through the area too quickly to establish balanced trading activity.
Strong displacement candles are often associated with meaningful imbalances. Common visual characteristics include:
- large candle bodies
- limited or no wick rejection
- breakout from consolidation
- expansion in volume
- rapid directional movement
The stronger the displacement, the more significant the imbalance is often considered.
Imbalances may also appear as thin trading or low-interaction zones rather than textbook FVG structures. These areas often show limited candle overlap and minimal back-and-forth price action, indicating that the market moved rapidly through the zone.
A common process for identifying imbalance includes:
- identifying a strong impulsive move
- checking for limited candle overlap
- defining the imbalance boundaries
- comparing the setup with higher-timeframe structure
Timeframe hierarchy also matters. Imbalances that remain visible across both higher and lower timeframes are often considered more significant than those appearing only on lower charts. A daily imbalance may therefore carry more weight than a similar formation on a 5-minute chart. Higher-timeframe imbalance zones are often used as the primary reference area, while lower-timeframe imbalances may help refine entries.
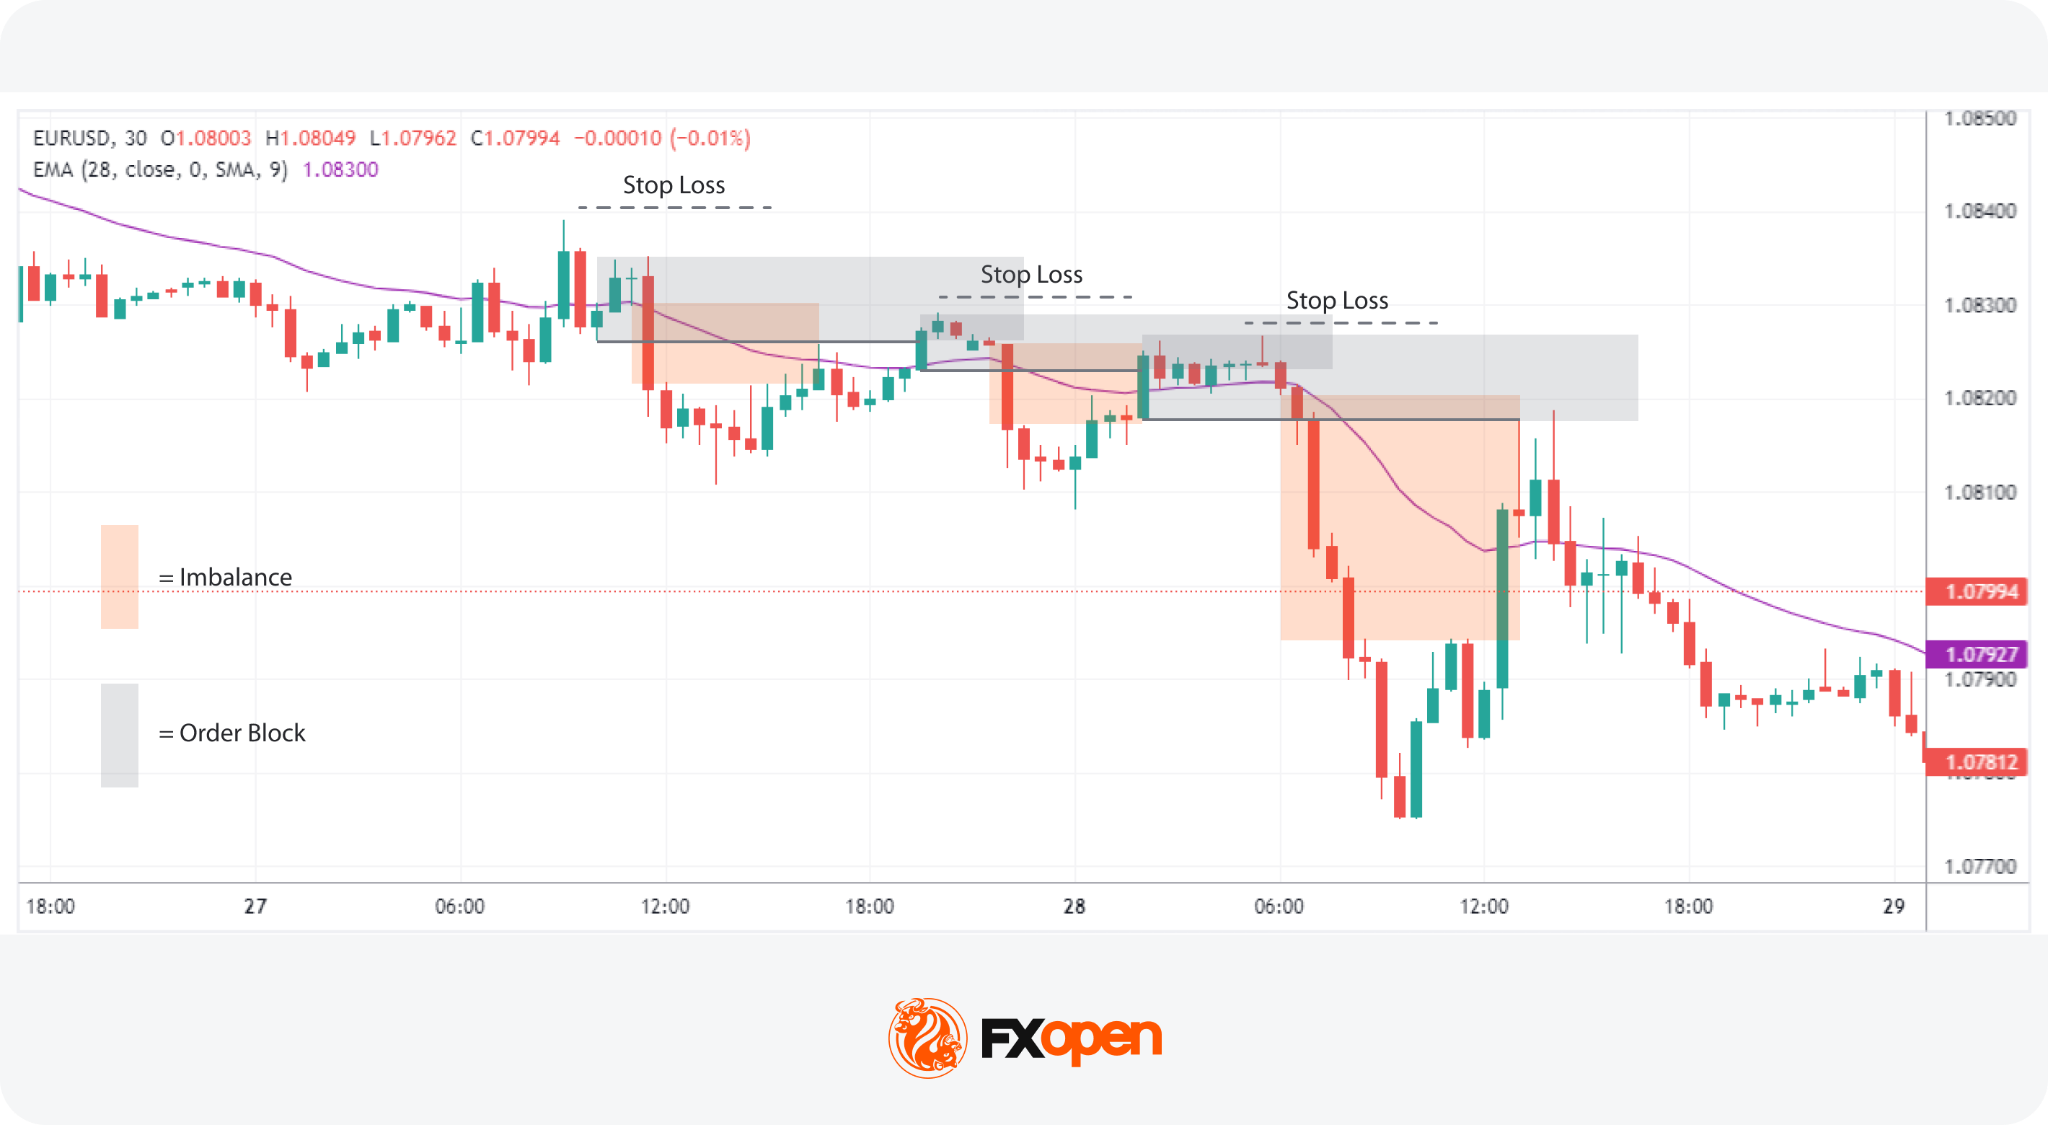
Imbalance Trading Strategy Explained
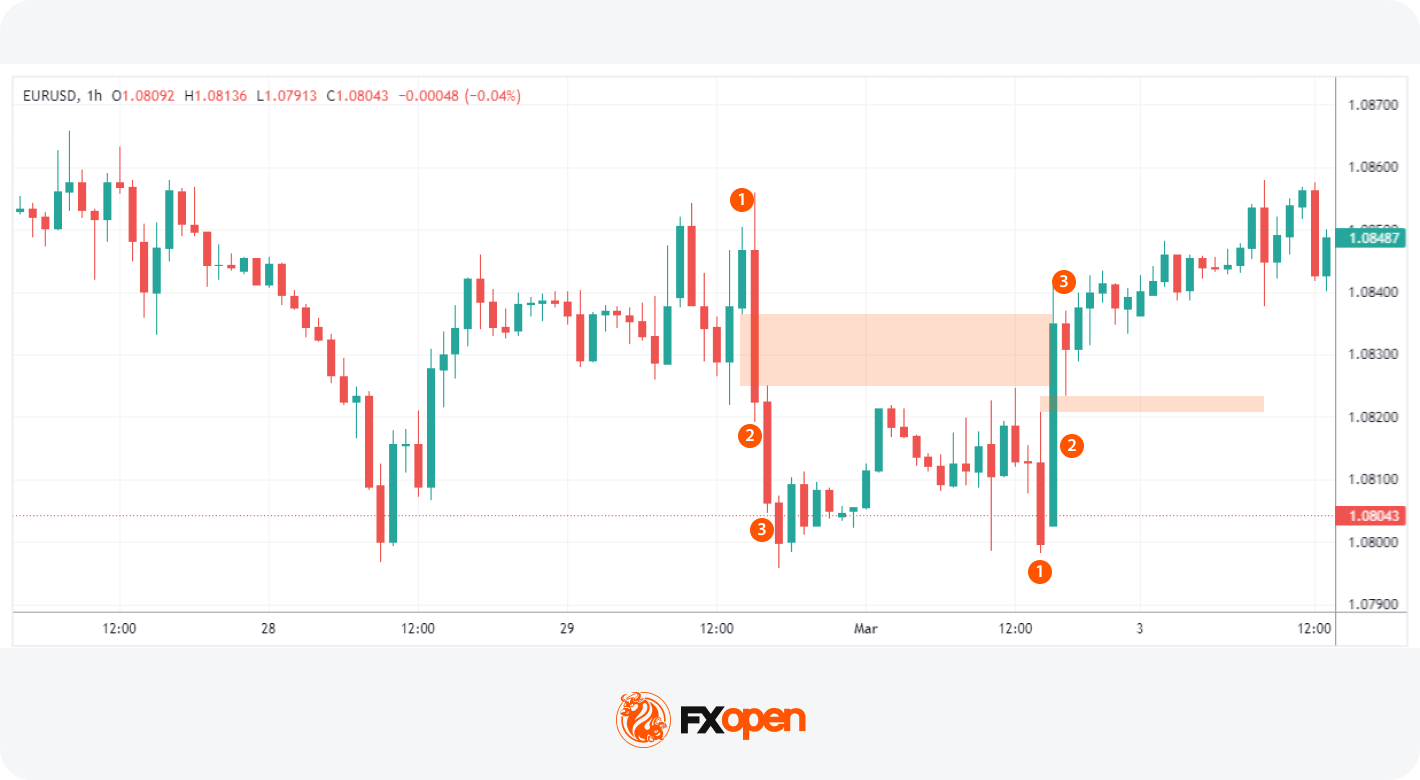
An imbalance trading strategy combines trend direction, structure, and zone identification into a repeatable framework. According to theory, in an imbalance trading strategy, traders stick with the prevailing market trend. By combining trend analysis with imbalance identification, traders can align themselves with the market’s momentum and identify valuable setups.
The Smart Money imbalance framework runs in four steps:
- Trend identification. In SMC, traders usually identify trends by examining market structure: higher highs and higher lows for bullish conditions, lower highs and lower lows for bearish. An Exponential Moving Average (EMA) may be applied as a simpler proxy. A downward-sloping EMA typically indicates a bearish trend, while an upward slope reflects bullish conditions.
- Imbalance formation. A strong displacement move may create an imbalance or fair value gap. Traders often monitor whether price later revisits this area before continuing in the direction of the prevailing trend.
- Order block identification. Traders then identify the last significant countertrend movement before a strong impulsive move. In Smart Money Concepts (SMC), this area is commonly referred to as an order block and may represent a zone where institutional activity previously entered the market.
- Entry point. Some traders wait for price to retrace back into the imbalance or order block after the impulsive move to enter the market in the trend direction. In bullish conditions, attention is usually placed on retracements into bullish imbalance zones; in bearish conditions, traders typically focus on retracements into bearish imbalance zones.
- Risk and exit planning. Stop-loss placement, position sizing, and exit logic are all defined before entry.
Consider following along on live charts in FXOpen’s TickTrader platform for the deepest understanding.
Entry
- Traders identify the market trend using the slope of an EMA.
- They look for an imbalance that results in a new high or low in line with the identified trend.
- The entry point in the trend direction may be set at the high (bullish trend) or low (bearish trend) of the last strong counter-trend candle before the imbalance.
Stop Loss
- A stop loss may be set just beyond the order block. This anchors risk to the structure that triggered the trade rather than an arbitrary pip distance.
Take Profit
- Profit-taking strategies may involve waiting for the price to fill another imbalance or reaching a predetermined technical level.
- To make the most of the trend, traders could employ trailing stops above or below new swing points or follow a longer-term moving average as a dynamic exit radar.
When Not to Trade
Some conditions reduce the reliability of imbalance trading setups:
- Just before major news releases, where volatility may spike and stops may be filled on noise rather than direction.
- When the imbalance forms against the higher-timeframe trend.
- In choppy, range-bound markets where directional bias is unclear.
- When multiple imbalances stack with no clean retracement, making entries harder to define.
Risk Considerations in Imbalance Trading
Imbalance setups offer structure, but they carry the same downsides as any pattern-based approach. Three areas warrant particular attention.
- False signals. Not every imbalance fills. Some price moves continue without retracement, especially during strong trends or trend reversals. A retracement into the zone is not guaranteed.
- News volatility. High-impact data releases can create imbalances that look textbook but resolve in unexpected ways. Slippage and widened spreads during these windows mean stop-losses may be filled at worse prices than expected.
- Overfitting and confirmation bias. Traders sometimes draw imbalances after the fact, marking only the patterns that worked. Without rules defined before the move, the strategy drifts into hindsight pattern-matching rather than systematic trading.
Defining clear entry, stop, and invalidation rules before the trade may support consistency. Risk management may potentially reduce reliance on any single signal when combined with broader structural analysis
Imbalance vs Liquidity
Imbalances and liquidity are linked mechanically. An imbalance forms precisely because liquidity on one side of the order book runs thin, allowing aggressive buying or selling to push price through several levels without resistance.
When aggressive buying or selling outpaces available counterparties at a price level, rapid repricing follows. This is the order flow imbalance in action, and it leaves the visible footprint traders mark as a fair value gap or liquidity void.
What Causes Imbalance in Trading?
Imbalances in forex and CFDs are driven by four main forces: news shocks, institutional flow, sentiment shifts, and technical triggers. Each one shifts the order book in a distinct way, and the order flow impact behind each helps explain why the visible gap forms on the chart. Academic work on market microstructure, including the Bank for International Settlements paper on market liquidity, examines how these forces interact at the deepest level.
High-impact news releases and economic events can quickly skew the balance as traders react en masse to new information, either flooding the market with buy orders or triggering a sell-off. Central bank decisions, inflation prints, and employment data are among the most common triggers. The order flow impact is immediate: liquidity providers widen spreads or pull resting orders, and price gaps to a new level.
Due to their sheer volume, large institutional orders create imbalances by outpacing the market’s ability to absorb them, sharply moving prices in one direction. The order flow impact here is more deliberate. A fund executing a sizable trade may break the order across price levels, but the cumulative pressure still consumes resting liquidity and leaves a visible imbalance behind.
Shifts in market sentiment, driven by broader economic indicators or trending market narratives, can collectively tilt trading activity towards buying or selling, further contributing to order flow imbalance. The shift is often gradual rather than sudden, but the cumulative result still drives one side of the book to dominate.
Technical factors, like prices reaching critical support or resistance levels, can activate automated trading algorithms that rapidly buy or sell, exacerbating the imbalance as these systems execute large-scale trades based on pre-set conditions. The order flow impact tends to be self-reinforcing: a breakout triggers more algorithmic activity, which extends the move and deepens the imbalance.
The Bottom Line
Order imbalances can serve as an indicator of market sentiment, helping traders recognise when supply and demand are not synchronised. By learning how to identify these situations and incorporating them into a structured trading approach, traders may spot potential price moves before they unfold. As with any strategy, combining order imbalance analysis with risk management and other technical tools can support traders when making trading decisions and provide a more balanced view of the market.
If you seek to apply these concepts in real-world scenarios, you can consider opening an FXOpen account, which offers trading with tight spreads and low commissions.
FAQs
What Is Imbalance in Trading?
In trading, an imbalance refers to a situation where buy orders significantly outnumber sell orders, or vice versa, leading to potential shifts in asset prices. This disproportion indicates strong market sentiment towards either buying or selling, impacting price movement direction.
What Causes Imbalance in Forex Markets?
Trade imbalances are primarily caused by significant news releases, large institutional orders, shifts in market sentiment, and technical triggers. These factors can lead to a sudden surge in buying or selling activity, creating an imbalance between supply and demand.
What Is an Imbalance Zone?
An imbalance zone is a specific area on a trading chart where the price has moved sharply, creating a gap known as a fair value gap. This gap signifies a period during which trading volume was minimal, suggesting a potential area for price to return to in the future.
What Is the Order Imbalance-Based Strategy?
The order imbalance-based strategy involves identifying moments when buy or sell orders dominate and using this information to anticipate future price movements. Traders use these imbalances to inform their entry and exit points.
What Is the Difference Between a Fair Value Gap and a Volume Imbalance?
A fair value gap refers to a price area skipped over during rapid market movement, indicating a potential return point for the price. Volume imbalance, however, specifically relates to the difference in volume between buy and sell orders, impacting price direction without necessarily creating a visual gap on the chart.
What Is a Fair Value Gap?
A fair value gap (FVG) is a three-candle pattern where the wicks of the outer two candles fail to overlap, leaving a gap between them. It is one specific form of imbalance and often appears during sharp directional moves. Traders watch FVGs as zones may be revisited before continuing the prevailing trend.
Does Price Always Return to an Imbalance?
No, price does not always return to an imbalance. Many imbalances are filled within hours, days, or weeks, but some remain open indefinitely, particularly those tied to fundamental repricing events such as central bank decisions or major economic shifts. Traders treat imbalance fills as probable rather than guaranteed and combine them with broader structural analysis.
What Is the Difference Between Imbalance and Order Block?
An imbalance is the visible gap or thin zone left after a strong directional move. An order block is the last opposing candle before that move, where institutional orders are thought to have been placed. The order block is the cause, the imbalance is the effect. Traders often look for both elements to align before entering.
How Is Imbalance Identified on a Chart?
Imbalance is commonly identified through strong displacement candles, fair value gaps, or areas with limited candle overlap. Traders often look for rapid directional movement, breakout conditions, and low-interaction price zones that suggest the market moved too quickly to establish balanced trading activity.
What Timeframes Are Used for Imbalance Trading?
Imbalance trading is applied across all timeframes, from 1-minute charts up to the weekly. Higher timeframes such as 4-hour, daily, and weekly tend to produce stronger imbalances. Lower timeframes are typically used for entry refinement once a higher-timeframe imbalance has been located. Multi-timeframe analysis sits at the core of the approach.
*Important: At FXOpen UK, Cryptocurrency trading via CFDs is only available to our Professional clients. They are not available for trading by Retail clients. To find out more information about how this may affect you, please get in touch with our team.
This article represents the opinion of the Companies operating under the FXOpen brand only. It is not to be construed as an offer, solicitation, or recommendation with respect to products and services provided by the Companies operating under the FXOpen brand, nor is it to be considered financial advice.

Prediction market regulators should consider a measured approach to insider trading enforcement as opposed to an outright ban, according to research from an academic at the Stevens Institute of Technology.
In a paper released on June 2, assistant professor of finance Balbinder Singh Gill developed a formal economic model to answer the question of how strictly insider trading in prediction markets should be policed.
A paradox exists in that “the same insider trade that improves the accuracy of the price today can reduce the participation that makes the price informative tomorrow,” he said.
The model showed that prediction market price accuracy is “hump-shaped” in enforcement intensity, with too little enforcement letting insiders crowd out participants, while too much enforcement removes the insider’s genuine informational contribution.
“Tougher enforcement curbs the insider, raising participation, so accuracy is hump-shaped and optimal enforcement is interior, neither laissez-faire nor a ban,” he said.
Insider trading has been a persistent problem for prediction markets, with regulators pushing for crackdowns or banning platforms outright.
The CFTC’s chief enforcement director warned prediction market insider traders in April that violators would face enforcement action. In May, US House lawmakers launched a probe into Kalshi and Polymarket over insider trading.
Different levels of enforcement needed
Singh Gill argued that the level of enforcement should be determined by where the insider information comes from.
Researched information where a trader has worked hard to learn something should have the least, or no enforcement, adding that any crackdown on this level discourages valuable information production.
Related: US House lawmakers launch probe into Kalshi, Polymarket insider trading
Misappropriated information, such as leaked data or classified information, which would be considered insider information, should have a higher level of enforcement.
Meanwhile, cases where the insider can influence the outcome, such as a political candidate betting on their own campaign, should have the most enforcement.
“Trading on a genuine, independently researched edge is the activity society should be most reluctant to punish […] And trading by those who can move the outcome warrants the stiffest enforcement, because their positions invite manipulation.”
Enforcement in a prediction market should be “calibrated rather than maximal,” he concluded.

Balanced enforcement provides optimal welfare. Source: Balbinder Singh Gill
Kalshi to check user employment details
The paper came as Kalshi is introducing new measures to combat insider trading by requiring users in some sensitive markets to disclose employment information.
Users betting in sensitive markets, such as company performance or national security, will need to disclose their employer via an online form. It has also developed a “specific risk score” assigned to markets with heightened insider trading or manipulation risk.
The changes follow an audit committee report recommending better data collection and pressure from lawmakers and regulators.
Two recent high-profile insider trading cases involving competitor Polymarket were flagged and also referenced in Singh Gill’s paper.
A Google employee was charged in May with using insider information about the company’s search trends to make $1.2 million on Polymarket, and a US soldier was charged in April with trading on classified knowledge of a military operation.
Magazine: Vietnam preps crypto pilot, HK pushes tokenization: Asia Express

XRP keeps finding buyers near major support, but it keeps losing support anyway. The latest drop pushed the token back toward the same $1.10 area that several analysts had flagged as a key line in the sand, with selling pressure accelerating once $1.13 gave way.
News Background
• Several analysts pointed to the $1.09 area as a major Fibonacci support level that XRP had been approaching for months.
• XRP remains trapped below its 100-day and 200-day moving averages, underscoring the broader bearish trend despite periodic relief rallies.
• Trading activity surged during the selloff before quickly normalizing, suggesting a large repositioning event rather than a steady increase in bearish conviction.
Price Action Summary
• XRP fell from $1.1505 to $1.1248 during the 24-hour session, losing more than 4%.
• The breakdown accelerated after price lost support near $1.13, with volume surging to 109.9 million XRP, more than double the daily average.
• XRP later tested support near $1.1240 before stabilizing into the close as selling momentum began to fade.
Technical Analysis
• The most important development was the loss of $1.13 support, which now becomes the first resistance level on any recovery attempt.
• Volume confirmed the move. The selloff occurred on some of the strongest activity seen in months, suggesting active liquidation and repositioning rather than passive weakness.
• At the same time, momentum indicators are nearing oversold territory. Daily RSI readings have fallen close to levels that historically preceded at least short-term relief rallies.
• The broader structure remains bearish. XRP continues trading inside a descending channel and below every major trend indicator that longer-term traders monitor.
What traders should watch
• $1.10-$1.12 is now the key support zone. A decisive break lower would increase the risk of a move toward $1.00 and potentially the $0.80-$0.90 region.
• $1.13 is the first level bulls need to reclaim to ease immediate downside pressure.
• Beyond that, attention shifts to $1.20 and then the larger $1.35-$1.40 resistance zone where previous recovery attempts failed.
• The setup is becoming increasingly compressed. Either buyers finally defend the current support area with conviction, or XRP risks turning a difficult correction into a much larger breakdown.

TLDR:
- XRP inflows to Binance from wallets holding over 1M tokens have declined sharply since the 2025 peak.
- On-chain data shows no extraordinary inflow spike, ruling out aggressive whale selling or profit-taking now.
- The current XRP price drop is tied to leverage liquidations and broad market weakness, not whale distribution.
- If Binance inflows stay low and demand holds, XRP could realistically revisit the $1.8 to $2.0 price range.
XRP exchange inflows to Binance have declined notably following the 2025 market peak, and on-chain data now points to reduced selling activity among large holders.
Transfers exceeding one million XRP dominated exchange inflow charts between 2021 and 2025, reflecting consistent participation from whale and institutional-scale addresses.
The recent pullback in these flows, despite a price retreat from the $3 region, suggests that major market participants are becoming less inclined to sell.
Whale Activity Shifts as Large-Scale XRP Transfers to Binance Drop
Historically, sharp spikes in the 100K–1M XRP and 1M+ XRP inflow categories have preceded major market downturns.
These surges typically signal that large holders are moving assets to exchanges ahead of selling. However, no such extraordinary spike currently appears at the far right of the inflow chart. This absence is a meaningful contrast to prior bear market conditions.
CryptoQuant analyst PelinayPA noted that the post-ETF approval period coincides with this drop in whale inflows. The reduced exchange activity suggests whales may be holding positions rather than distributing.
That behavioral shift stands out, especially given XRP’s recent price correction. It points to a market structure that differs from previous cycles.
The current price decline appears linked more to leverage liquidations and broader market weakness than to deliberate whale selling. In past severe downturns, exchange inflows rose aggressively as investors rushed to exit positions.
That pattern is not repeating now. The on-chain picture, therefore, does not support the narrative of widespread profit-taking at this stage.
Between 2021 and 2025, large-scale inflows remained consistently elevated, showing that whales actively used Binance as a distribution venue. The recent reversal of that trend is therefore notable.
It reflects a measurable change in behavior among the market’s largest participants. Whether this shift sustains depends on whether inflows stay suppressed in the weeks ahead.
Subdued Binance Inflows Could Reduce Selling Supply and Support XRP Price
PelinayPA stated in the analysis: “If Binance inflows remain subdued, the available selling supply could continue to decrease. Combined with stronger demand, this would make it easier for XRP to revisit the $1.8–$2.0 range.”
That projection rests on the assumption that the current low-inflow environment holds. Any renewed surge in the 1M+ XRP category would challenge that outlook.
XRP’s price stood at $1.11 at the time of writing, with a 24-hour trading volume of $1,754,706,743. The asset recorded a 5.12% decline over the past 24 hours and an 8.28% drop over the prior seven days. Despite these figures, the on-chain data does not yet reflect panic-driven selling from major holders.
Reduced exchange supply, when paired with sustained or growing demand, typically creates favorable conditions for price recovery.
The $1.8–$2.0 range cited in the analysis represents a plausible near-term target if inflows remain low. However, this structure remains sensitive to any sharp reversal in whale behavior. Traders and analysts will likely continue monitoring inflow trends closely.
As long as no renewed surge emerges in the 1M+ XRP inflow category, the current market structure may remain constructive. The broader market environment will also play a role in whether that structure holds.
For now, the declining inflow trend offers a data-backed case for cautious optimism. The next few weeks will clarify whether whales maintain their current stance.


Humanity Protocol has revealed that a compromised employee laptop enabled attackers to obtain control of bridge administration systems across Ethereum and BNB Smart Chain, resulting in the theft and minting of more than $36 million worth of H tokens.
Summary
- Humanity Protocol says a compromised employee laptop enabled attackers to seize bridge controls and steal more than $36 million in H tokens.
- Attackers allegedly compromised multisig keys on Ethereum and BNB Smart Chain, draining 141.2 million H and minting 200 million additional tokens.
- The project has halted bridge activity, is working with exchanges and police, and plans to release a full post-mortem report.
According to a statement shared with crypto.news by Humanity founder and CEO Terence Kwok, the June 8 incident was a coordinated attack that targeted the project’s bridge infrastructure on multiple networks.
“Last night, June 8, 2026, the Humanity was hit by a coordinated attack across Ethereum and BSC,” Kwok said.
Providing the first detailed explanation of how the breach occurred, Kwok said the attacker gained access after compromising an employee device.
“This was a result of a breach that happened after an employee’s laptop was compromised.”
The founder said three of the six Gnosis Safe owner keys controlling the Hyperlane bridge ProxyAdmin on Ethereum were compromised. Humanity Protocol said the attacker transferred ownership of the ProxyAdmin contract to a wallet under their control, upgraded the bridge contract to a malicious implementation, and moved approximately 141.2 million H tokens in a single transaction.
A similar compromise took place on BNB Smart Chain. According to Humanity Protocol, three of five Safe owner keys were compromised, allowing the attacker to seize control of the bridge’s ProxyAdmin contract, deploy a malicious implementation with an unlimited mint function, and mint 200,000,005 H tokens in two separate transactions.
The project currently estimates that more than $36 million has been stolen and sold across both chains.
Compromised multisig keys enabled bridge takeover
Fresh details from Humanity Protocol expand on earlier disclosures from the team, which had initially confirmed only that private keys linked to a Humanity Foundation member were compromised.
Earlier on June 9, on-chain analyst Specter reported that more than 17 wallets associated with Humanity Protocol had been drained. Initial estimates placed losses near $19 million before later blockchain analysis increased the figure to more than $30 million.
Blockchain data cited by Specter indicated that the attacker sold part of the stolen H tokens and converted a substantial portion of the proceeds into Ethereum. According to the analyst’s Telegram update, roughly $23.7 million had been swapped into ETH, while approximately $7.9 million remained in H tokens.
Separate monitoring from blockchain security firm Blockaid had previously suggested that an attacker obtained proxy administrator rights on BNB Smart Chain and minted additional H tokens.
Humanity Protocol’s latest incident report confirms that administrative control of the bridge infrastructure was seized and used to create new tokens on the network.
Questions about the exploit emerged as H experienced unusual trading activity ahead of a scheduled token unlock later this month.
As reported by crypto.news earlier, blockchain investigator ZachXBT had initially considered whether the reported key compromise could have been used to conceal insider selling. However, after reviewing the movement and laundering of stolen funds, he concluded that the available evidence supported Humanity Protocol’s explanation that the exploit stemmed from a genuine private key compromise rather than an insider theft scheme.
Humanity Protocol is scheduled to unlock additional tokens on June 25 under a revised investor vesting plan. Previous reporting by crypto.news showed that some early investors opted for a discounted immediate unlock instead of a longer vesting schedule.
Exchanges and police are assisting recovery efforts
Response efforts remain ongoing as Humanity Protocol works to contain the fallout from the attack and investigate the breach.
“We’ve now halted all deposits and withdrawals to the affected bridges and are working with all related parties, including exchanges, to minimize the impact,” Kwok said.
The project said it is coordinating with exchanges and security partners while conducting an internal investigation into the incident.
“We’re also working closely with the police to investigate this incident and recover some of the stolen funds,” Kwok added.
Market reaction to the exploit was severe. Trading data cited in previous reports showed H falling from its June 2 all-time high near $0.844 to around $0.123 after the attack, erasing most of the token’s earlier rally as trading volume surged above $605 million.
Despite the losses, Kwok said the team remains focused on recovering assets, identifying those responsible, and strengthening the project’s defenses.
“We’re committed to seeing this through by recovering what we can, holding those responsible accountable, and rebuilding our security from the ground up.”
Humanity Protocol said it plans to release a full post-mortem report once its investigation progresses further.

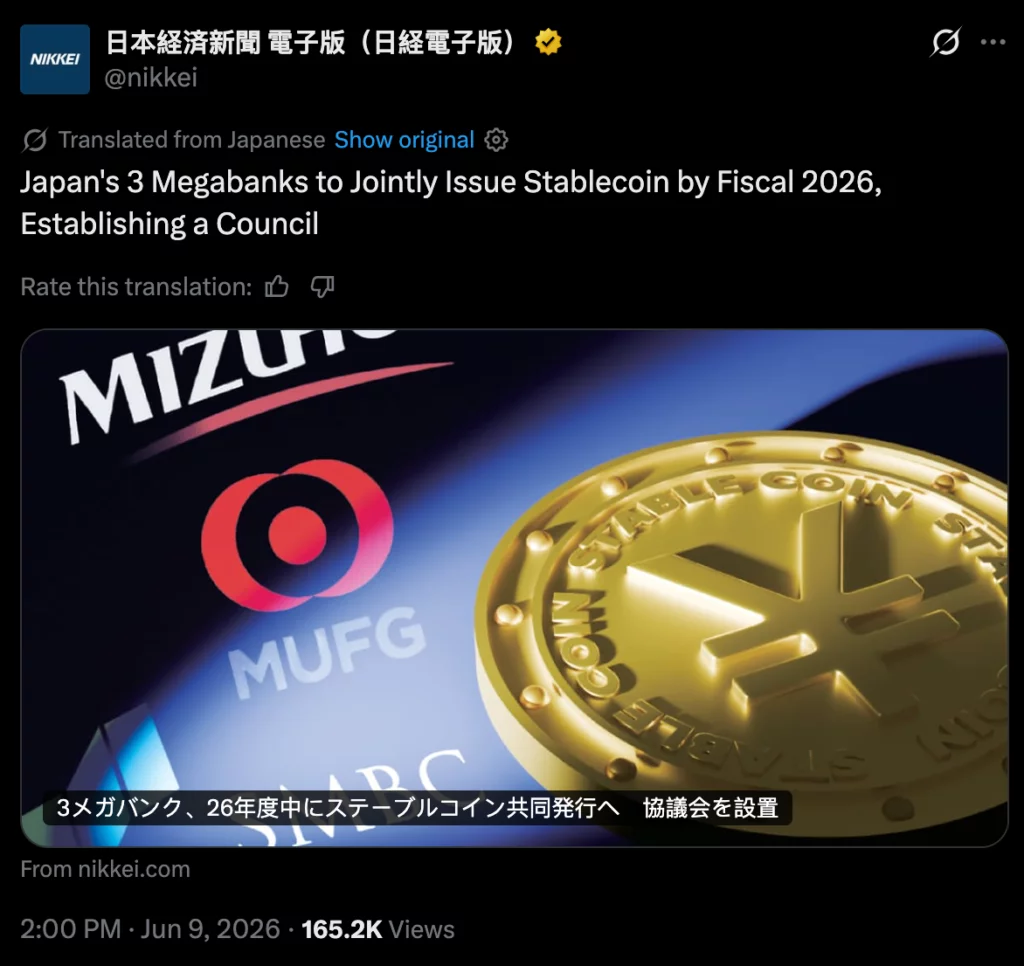
MUFG Bank, Sumitomo Mitsui Banking Corporation and Mizuho Bank plan to start live transactions with a jointly issued stablecoin during fiscal year 2026. Japan’s fiscal year ends in March 2027.
Summary
- Japan’s three megabanks target live stablecoin transactions within fiscal 2026 under a shared banking framework.
- A new council will examine issuance infrastructure, governance, operating rules, systems and future bank participation.
- The FSA-backed pilot tested corporate cross-border payments through a trust structure using Progmat’s blockchain infrastructure.
The banks signed a memorandum to create a voluntary council that will prepare the operating and governance framework. The project follows a regulatory pilot supported by Japan’s Financial Services Agency.
Three banks prepare joint stablecoin transactions
The banks will issue the stablecoin through a trust agreement. They will act as joint settlors, while a trust bank or a similar institution will serve as trustee.
The structure aims to let the banks share one issuance framework instead of developing separate tokens. The official statement did not provide the token’s issue size, blockchain network, retail access terms or precise rollout date.
“The three banks will accelerate their initiatives,” the joint statement said.
In addition, the council will examine issuance infrastructure, system design, governance and operating processes. It will also review Japanese laws and market conditions before live transactions begin.
MUFG, SMBC and Mizuho will establish the council first. The group may later work with other financial institutions and related companies that want to join the stablecoin framework.
The banks aim to support several payment uses rather than one limited test. However, they have not named the first commercial users or confirmed whether initial transactions will focus only on corporate payments.
FSA-backed pilot tested cross-border payments
The FSA supported the proof-of-concept in November 2025. The pilot examined joint stablecoin issuance and cross-border payments involving Mitsubishi Corporation’s Japanese and overseas offices.
Mitsubishi UFJ Trust and Banking Corporation handled the planned trust-based issuance structure. Progmat supplied the blockchain infrastructure, while the three banks developed requirements and assessment standards.
The pilot also reviewed legal compliance and user protection. Japan’s Payment Services Act allows stablecoins to operate as regulated electronic payment instruments when issuers meet the required structure and reserve rules.
Japan expands its yen stablecoin market
The joint bank project enters a market that already includes other regulated yen token plans. JPYC launched a yen-backed stablecoin in October 2025, while SBI Holdings and Startale have also prepared an institutional yen stablecoin.
Japan’s ruling Liberal Democratic Party has called for broader use of yen stablecoins, tokenized deposits and round-the-clock settlement. The plan also supports clearer rules for tax payments, wages and corporate uses.
The three-bank project could add a shared settlement route for major corporate clients. Its progress will depend on the council’s final design, regulatory review and connections with existing payment systems.


Anthropic released Claude Fable 5 on Tuesday, its most capable public model running on Mythos, as it pursues a fall listing it has already filed for confidentially alongside OpenAI, which filed Monday, and SpaceX.
Mythos is Anthropic’s most advanced tier of artificial intelligence models, and Fable is the first publicly released version of this powerful underlying architecture but it comes with strict built-in safety filters.
Bitcoin has spent the past week trading as the high-beta arm of the Nasdaq, sliding with chipmakers and Asian tech as the AI trade unwound. An Anthropic listing, after its $65 billion round at a $965 billion valuation, would hand index funds and retail traders a single AI-lab stock to pile into. Crypto already moves with the AI trade, and giving that trade its own ticker only tightens its grip.
AI-linked tokens caught a modest bid on Fable’s launch while bitcoin barely moved, because model releases are narrative for the sector’s small caps while the majors now trade on what the AI trade does to risk appetite, not on the models themselves.


Ripple has joined Water.org’s Get Blue campaign as its exclusive digital asset and payments partner.
Summary
- Ripple joins Get Blue as exclusive digital asset and payments partner supporting Water.org’s lending model.
- RLUSD will help Water.org move funds faster to microfinance partners serving families across emerging markets.
- Get Blue combines corporate donations with affordable loans for household water and sanitation improvements worldwide.
The blockchain company will provide seed funding and support fund transfers to local finance partners in emerging markets.
Water.org says more than two billion people lack safe water at home. The nonprofit, co-founded by actor Matt Damon and engineer Gary White, uses small loans to help families pay for water and sanitation systems.
Ripple brings RLUSD into the Get Blue campaign
Ripple said Water.org will use its U.S. dollar-backed RLUSD stablecoin to move funds to microfinance partners. Those organizations provide affordable financing for household pipes, pumps, toilets and other basic water systems.
The arrangement builds on Ripple’s existing support for Water.org through Ripple Payments. Water.org says the platform can reduce costs and shorten transfer times when sending capital to partners across different markets.
“We’re proud to join Water.org in support of Get Blue,” Ripple said.
Get Blue named Ripple alongside Amazon, Gap, Starbucks, Ecolab, AccuWeather and TikTok. The campaign first appeared at the World Economic Forum in January and is now moving into a wider consumer rollout.
Ripple-backed WaterCredit turns donations into affordable household loans
Get Blue directs corporate funding and consumer donations into Water.org’s WaterCredit model. Local financial institutions then provide small loans that families use to install safe water or sanitation services at home.
Water.org reports a 98% repayment rate for WaterCredit loans. Repaid funds can support more borrowers, allowing the same pool of capital to finance additional household projects over time.
“When brands join us, they invite their communities into this work,” Water.org CEO Gary White said.
The wider campaign links donations to everyday purchases and services. Gap contributes $5 from each item in its Get Blue collection. Starbucks will donate $0.25 from selected drinks between June 16 and July 7.
RLUSD expands beyond trading and settlement
Ripple launched RLUSD as a stablecoin backed by U.S. dollar deposits, short-term Treasuries and cash equivalents. It operates on the XRP Ledger and Ethereum and supports payments, settlement and other blockchain transactions.
The Water.org partnership adds another humanitarian use for the token. Ripple previously used RLUSD in a drought insurance pilot for pastoral communities in Kenya and committed $25 million to education groups in the U.S.
As crypto.news reported, the education funding supported DonorsChoose and Teach For America. Separate reporting covered RLUSD’s African expansion through Chipper Cash, VALR and Yellow Card for payments and treasury services.
The Get Blue partnership does not disclose how much RLUSD Water.org will receive or which countries will receive the first transfers. Ripple and Water.org have also not published transaction volumes or named the first microfinance recipients.
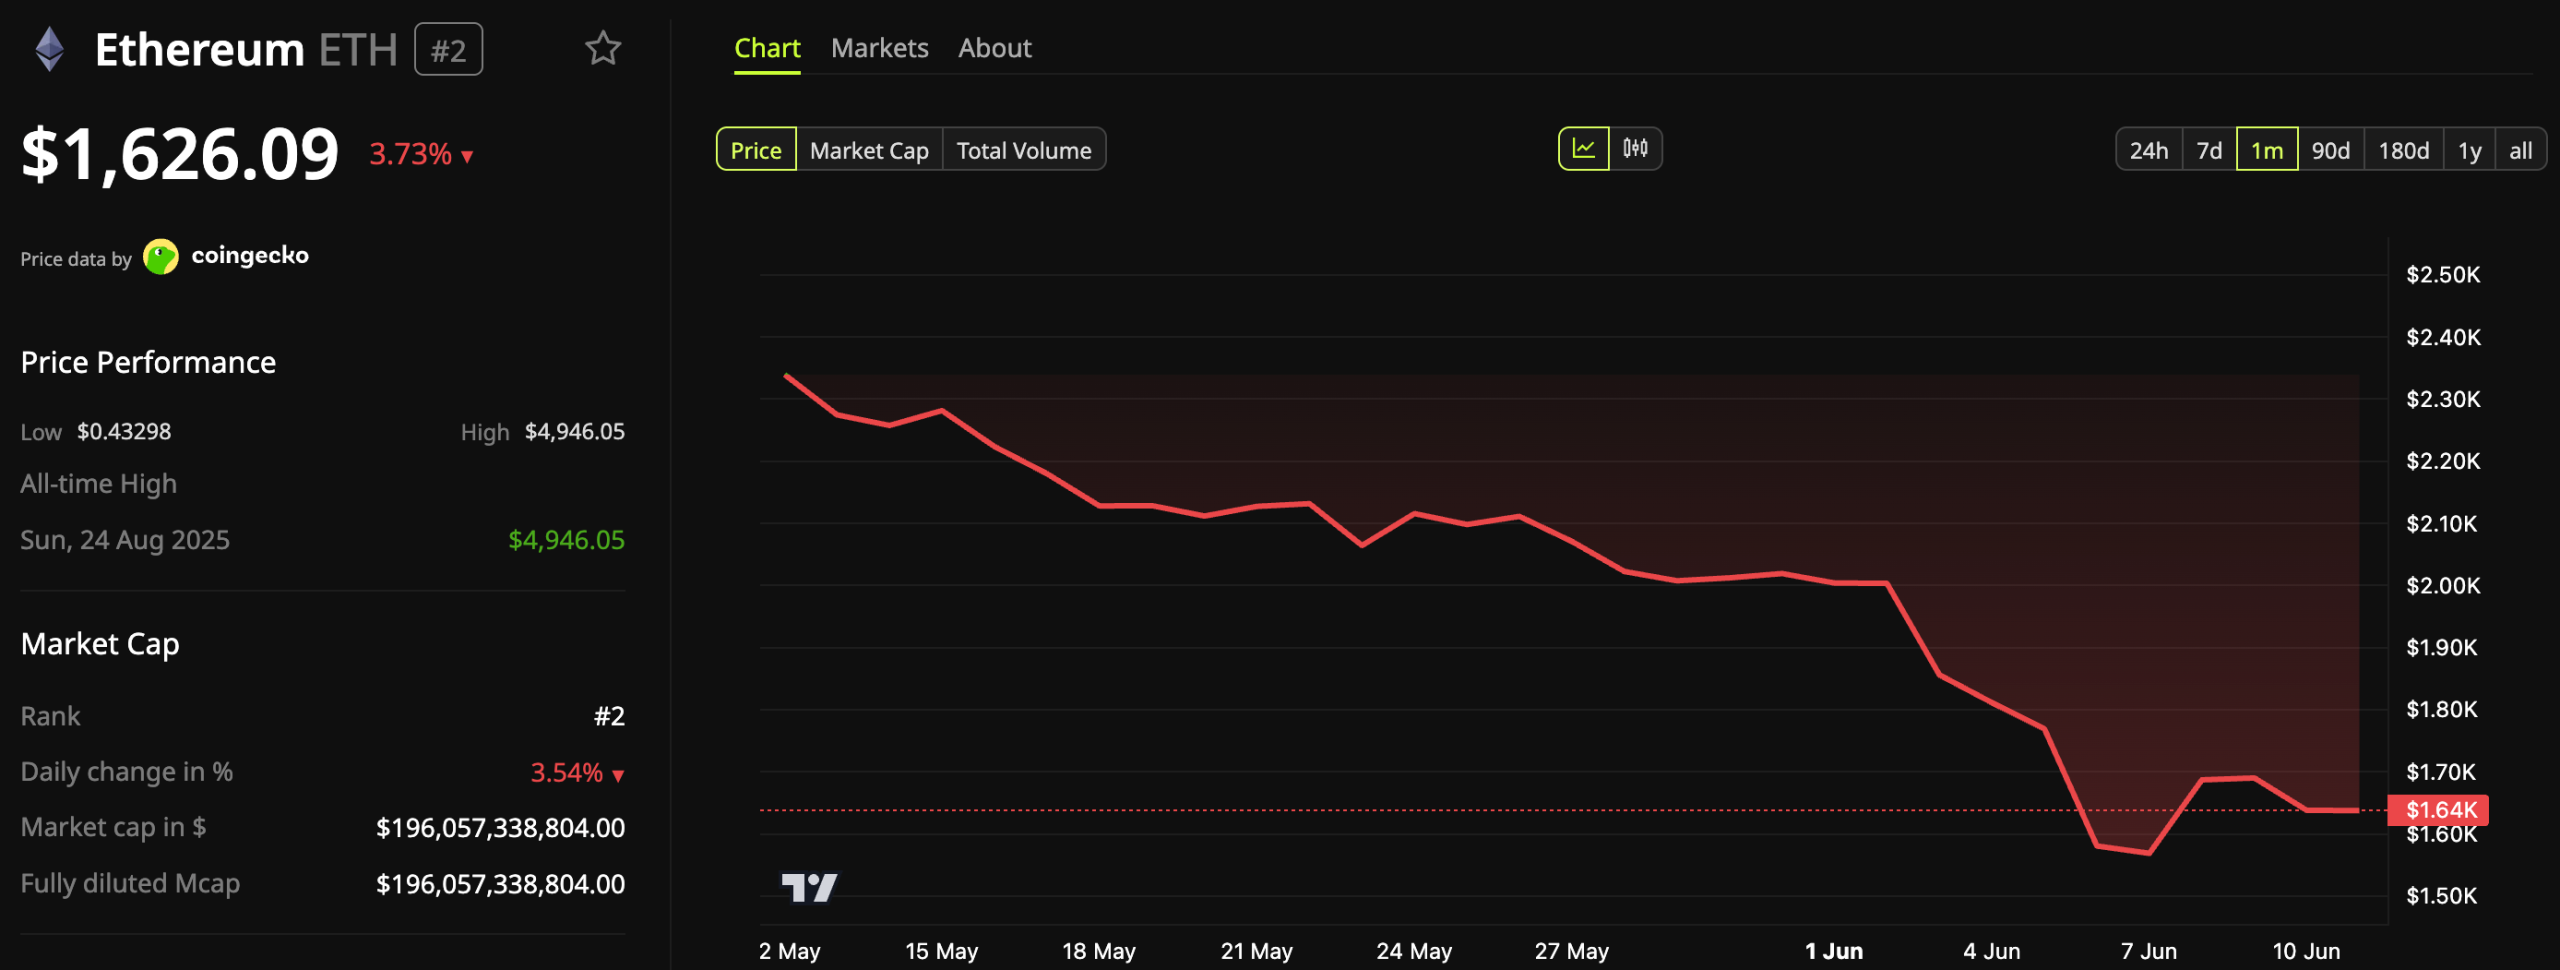
Ethereum (ETH) social sentiment has collapsed into an extreme fear zone as price continues to slip, down 12% over the past week. Bearish posts now dominate social media as the token trades near $1,626.

Santiment data shows the ratio of positive to negative commentary at one of its lowest levels this year. However, the firm suggested this is “where markets become most dangerous for bears.”
Ethereum Fear Reaches the Zone Where Bears Usually Get Trapped
Santiment reported that traders have largely written off Ethereum after months of underperformance against Bitcoin (BTC) and other large-cap assets.
The cryptocurrency re-entered the extreme fear zone on June 9, with the positive-to-negative commentary ratio near 1.09. The firm noted that this zone has historically acted as a buy signal.
Follow us on X to get the latest news as it happens

The contrast with April is stark. On April 22, the crowd flashed extreme greed with Ethereum above $2,400, which Santiment flagged as an ideal sell point. The token has since lost roughly 32% of its value.
“Historically, Ethereum has tended to rebound when social sentiment reaches extreme FUD levels because prices frequently move opposite to the crowd’s expectations. When traders become overwhelmingly convinced that an asset will continue falling, much of the selling pressure has already been exhausted,” the post read.
Sentiment is not the only flag. Trader Ash Crypto also pointed to another key signal. He compared the current breakdown to June 2022, when ETH collapsed before staging a reversal.
“Back in June 2022, ETH broke through every support level and crashed to $880. Everyone gave up on it. That turned out to be the exact bottom of the whole bear market,” he said.
He argued the current drop mirrors June 2022, sharing the same timing, breakdown, and chart structure. After peaking at $4,953 in August 2025, ETH has fallen sharply.
The price has broken below its weekly 200-day moving average at $2,471, leaving $1,500 as the next support to watch.
“Two ways this plays out: If ETH holds $1,500, this could play out exactly like June 2022. The people who bought that bottom made 5x over the next 18 months. If ETH falls below $1,500 on a weekly close, the next support is all the way down near $1,000. Nothing to stop the fall in between,” the analyst added.
ETF Outflows and Oversold Signals Cloud the Rebound Case
Despite these signals, ETH still faces real obstacles. Institutional demand remains weak. SoSoValue data shows ETH spot ETFs have logged outflows for 4 straight weeks, a sign that large investors are still pulling back.
Until those flows turn positive and hold, any rebound risks fade back into the wider downtrend.
Meanwhile, analyst Ardi warned that in prior bear markets, Ethereum bottoms formed after the weekly Relative Strength Index (RSI) broke below 30.
“Each time it spent consecutive weeks there, it marked quite literally the exact bottom of the cycle,” the analyst mentioned.
In 2018, after ETH slipped into the territory, prices dropped 63% from $205 to $75. In 2022, ETH dropped 65% from $2,200 to $750.
Ardi noted that ETH has not yet reached oversold territory, with prices below $1,700. Major macro support sits only 15% lower, leaving little cushion.
“If there is a positive to find, it’s that ETH has spent more time in the lower half of the oscillator this cycle than any prior 4-year period. So there is a small possibility that ETH bottoms without RSI deeply breaking that support in the first place,” Ardi added.
The analyst also noted that ETH never staged a true breakout this cycle. As a result, the chart may not require the same violent correction. Even so, Ardi said ETH typically bottoms only when nobody wants to own it, which, in both prior bear markets, meant oversold conditions.
Subscribe to our YouTube channel to watch leaders and journalists provide expert insights
The post Ethereum Fear Hits 2026 Extreme as History Points to a Rebound appeared first on BeInCrypto.

Kraken has been named the official crypto exchange supporter of the FIFA World Cup 2026, giving the crypto exchange a presence at one of the world’s largest sporting events.
The company said Tuesday that the partnership will include fan activations and product experiences throughout the tournament.
The 2026 World Cup is expected to be the largest in FIFA history, with an expanded field of 48 teams and 104 matches across 16 host cities in the United States, Mexico and Canada. FIFA projects the competition will attract a cumulative global audience of more than 6 billion viewers during its seven-week run.
The partnership places Kraken alongside some of FIFA’s longest-standing corporate sponsors, including Adidas, Coca-Cola, Visa and Hyundai-Kia.
The agreement also expands Kraken’s sports sponsorship efforts, which already include partnerships with Tottenham Hotspur, Atlético de Madrid, RB Leipzig and Atlassian Williams Racing.
The tournament kicks off on June 11 in Mexico City, where Mexico is scheduled to face South Africa at Estadio Azteca.

Source: Kraken
Related: Kraken offers SpaceX IPO access through xStocks
Prediction markets expand their sports presence
The partnership comes four years after the 2022 “Crypto Bowl,” when Coinbase, FTX, Crypto.com and eToro aired advertisements during Super Bowl LVI. Sports marketing activity across the crypto industry slowed following the collapse of FTX later that year and the broader market downturn.
While some digital asset companies have returned to major sporting events, their approach has been more measured. Coinbase aired its first Super Bowl commercial since 2022 during this year’s broadcast, while Crypto.com used the event to launch its AI-focused platform, ai.com.
At the same time, prediction markets, where users buy and sell contracts tied to the likelihood of specific outcomes, have expanded their presence in professional sports.
In November 2025, Polymarket became the official prediction market partner of UFC and Zuffa Boxing under a multiyear agreement that brought prediction market data into live events and broadcasts.

Source: UFC
In January, the company signed a multiyear agreement with Major League Soccer to become the league’s exclusive prediction market partner for MLS and the Leagues Cup. Major League Baseball followed in March, naming Polymarket its official prediction market exchange while signing a separate integrity agreement with the US Commodity Futures Trading Commission.
FIFA’s commercial roster also includes ADI Predict, a blockchain-based prediction market platform backed by Abu Dhabi institutions.
Magazine: Korea probes Polymarket users, crypto PACs sweep primaries: Hodler’s Digest, May 31- June 6
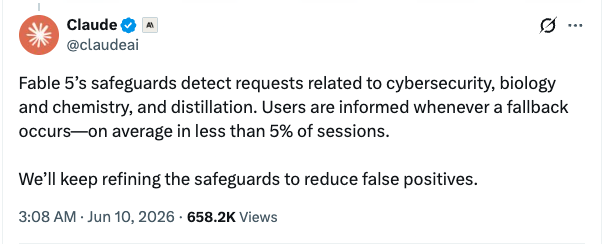
AI company Anthropic on Tuesday released the first public version of its powerful Claude Mythos model, called Fable 5, with some crypto users worried it could be used for malicious purposes, despite embedded guardrails.
Anthropic said last month that its Mythos model uncovered more than 10,000 high or critical-severity vulnerabilities in “systemically important software,” leading many to question if it should be publicly released.
This was despite the company saying on Tuesday that Fable 5 was “made safe for general use,” and has safeguards that reroute some topics, such as cybersecurity, to a different model, Claude Opus 4.8
“Releasing a model this capable comes with risks. Without safeguards, Fable 5’s capabilities in areas like cybersecurity could be misused to cause serious damage,” it said.

Source: Claude
The guardrails have done little to reassure crypto users, with AI increasingly being used to attack crypto platforms. In April, the value of crypto stolen in hacks hit $629.7 million, the highest since February 2025, which analysts linked to the use of the technology.
Mythos release sparks warnings from crypto users
Simon Dedic, founder of the venture firm Moonrock Capital, posted to X on Tuesday that with Fable 5, the “cost and skill required to find exploitable flaws in smart contracts is about to drop to basically zero.”
“For DeFi, this should be a massive wake-up call. Unaudited protocols will become sitting ducks. Known exploits will get replayed on forks around the clock. Even small projects will get targeted simply because trying costs next to nothing now,” he added.
Related: AI agents with crypto could escape and become ‘unstoppable,’ experts warn
Dedic repeated calls online, suggesting that crypto users should protect themselves from the model, including revoking wallet approvals, removing as much value from protocols as possible and moving crypto to fresh hardware wallets.
Curve Finance co-founder Michael Egorov, however, said that the threat Claude Mythos posed to crypto was likely overblown as its success in finding bugs in other software might not translate to funding smart contract vulnerabilities in DeFi.
In May, Anthropic said Claude Mythos found thousands of critical vulnerabilities in important software through Project Glasswing. For open-source projects, which are central to how crypto protocols are managed, Mythos found around 6,200 high or critical-severity vulnerabilities in more than 1,000 projects it investigated.
Egorov argued that the software Mythos found vulnerabilities in had millions of lines of code, while smart contracts have a few thousand, “and both humans and ‘usual’ AI perfectly fit that code in context and can reason well about it.”
“I suspect we might not be having a wave of DeFi code hacks, but we may see a lot of things in OpSec [operational security] getting hacked (looking like multisig keys compromises) and supply chain attacks on frontend dependencies, and those are way less dangerous in true DeFi,” he said.
Meanwhile, Anthropic said a “small group” of cybersecurity and infrastructure providers would get access to Claude Mythos 5, the same model as Fable 5 but with safeguards lifted in some areas.
Magazine: AI-driven hacks could kill DeFi — unless projects act now

Rivian R2 First Drive Reveals Strong Performance and Genuine Off-Road Skills at an Attainable Price
How positive tipping points may be the key to protecting tropical rainforests

Japan’s Asics to spin off popular Onitsuka Tiger sneaker business; shares rise

HarrisX Poll Found 52% of Registered Voters Support the CLARITY Act

BloFin War of Whales 2026 Grand Prix opens registration for $5M trading championship

Blockchain.com files with SEC for U.S. IPO

Elley Duhe – MONEY ON THE DASH | Animated Video

XRP ROBINHOOD CONFIRMS !!! THIS WILL FORCE XRP TO 3 DIGITS !!! BANK OF AMERICA LAUNCHES XRP !!!

Financial Instruments Revision | All Concepts + Imp Ques | CA Final FR Revision | CA Aakash Kandoi
-

 Fashion5 days ago
Weekend Open Thread: Evereve – Corporette.com
-
 Crypto World5 days ago
Jensen Huang Approves Samsung, SK Hynix, and Micron for NVIDIA (NVDA) HBM4 Memory Supply
-

 Crypto World2 days ago
Anatomy of the June crypto crash: Fed, Iran, Saylor
-
 Entertainment3 days ago
The Best Mystery Series of All Time Is Surging on Streaming 30 Years After It Ended
-

 NewsBeat2 days ago
Alexander Zverev wins the French Open to finally earn a 1st Grand Slam title
-
Crypto World3 days ago
Senator Cynthia Lummis Calls CLARITY Act the Most Consequential Financial Legislation of This Generation
-

 Tech4 days ago
Suspicious Polyfill login prompts pop up on Toshiba, Muji websites
-

 Tech5 days ago
Microsoft launches MXC, an OS-level sandbox for AI agents, with OpenAI and Nvidia already on board
-
 Tech3 days ago
Microsoft unveils seven homegrown AI models in new bid for ‘long term self-sufficiency’
-
 Business3 days ago
The Pain Points Taking a Fragile Tech Rally Down a Notch
-
Crypto World5 days ago
LBank Surpasses 25 Million Users Worldwide as AFA Partnership Continues to Drive Global Growth
-

 Business5 days ago
(VIDEO) Justin Bieber Delivers Surprise Happy Birthday Serenade to Diners at Los Angeles Mexican Restaurant
-

 Crypto World3 days ago
Trump’s AI Ownership Plan Could Benefit Anthropic at OpenAI’s Expense
-
 Sports14 hours ago
Bangladesh beat Australia after 20 years in ODIs, register only their second win over six-time world champions | Cricket News
-

 Tech5 days ago
Meta steals a tactic from Tesla and builds data centers in tents
-

 Tech5 days ago
RCS Messages Between iPhone and Android Get End-to-End Encryption With iOS 26.5
-
 Crypto World2 days ago
Eli Lilly (LLY) Stock Surges 4% Following Breakthrough Sleep Apnea Trial Results
-

 Tech4 days ago
Von der Leyen’s AI envoy pick draws conflict-of-interest fire
-

 Tech4 days ago
Hackers now exploit SolarWinds Serv-U flaw to crash servers
-

 Tech2 days ago
Notion restores access to Anthropic after service disruption
You must be logged in to post a comment Login