

Crypto World
Overbought vs Oversold Stocks Explained

An overbought stock has risen sharply and may sit above its underlying value, while an oversold stock has fallen sharply and may sit below it. In technical analysis, these conditions are used to identify markets that may be approaching a pause, slowdown, or potential price reversal.
The oversold stock meaning refers to a market condition where selling pressure has pushed a stock’s price lower than its recent trading range or momentum may justify. Overbought conditions reflect the opposite scenario, where strong buying activity has driven prices rapidly higher.
To identify these market conditions, traders often use technical indicators such as the Relative Strength Index (RSI), Stochastic Oscillator, and MACD. This article explains what overbought and oversold stocks and stock CFDs are, how these indicators work, and the limitations traders should consider when interpreting their signals.
What Is an Oversold Stock?
Oversold stocks are shares that have fallen sharply in price, often below what their fundamentals warrant. The condition typically reflects excessive selling pressure rather than a fair reassessment of value.
Several factors can lead to a stock becoming oversold. For instance, bad news about a company, such as a missed earnings report or legal troubles, can cause investors to sell off shares quickly. Broader market events, like economic downturns or changes in industry regulations, can also drive prices down across the board. Sometimes, even strong stocks get caught up in these waves of negativity.
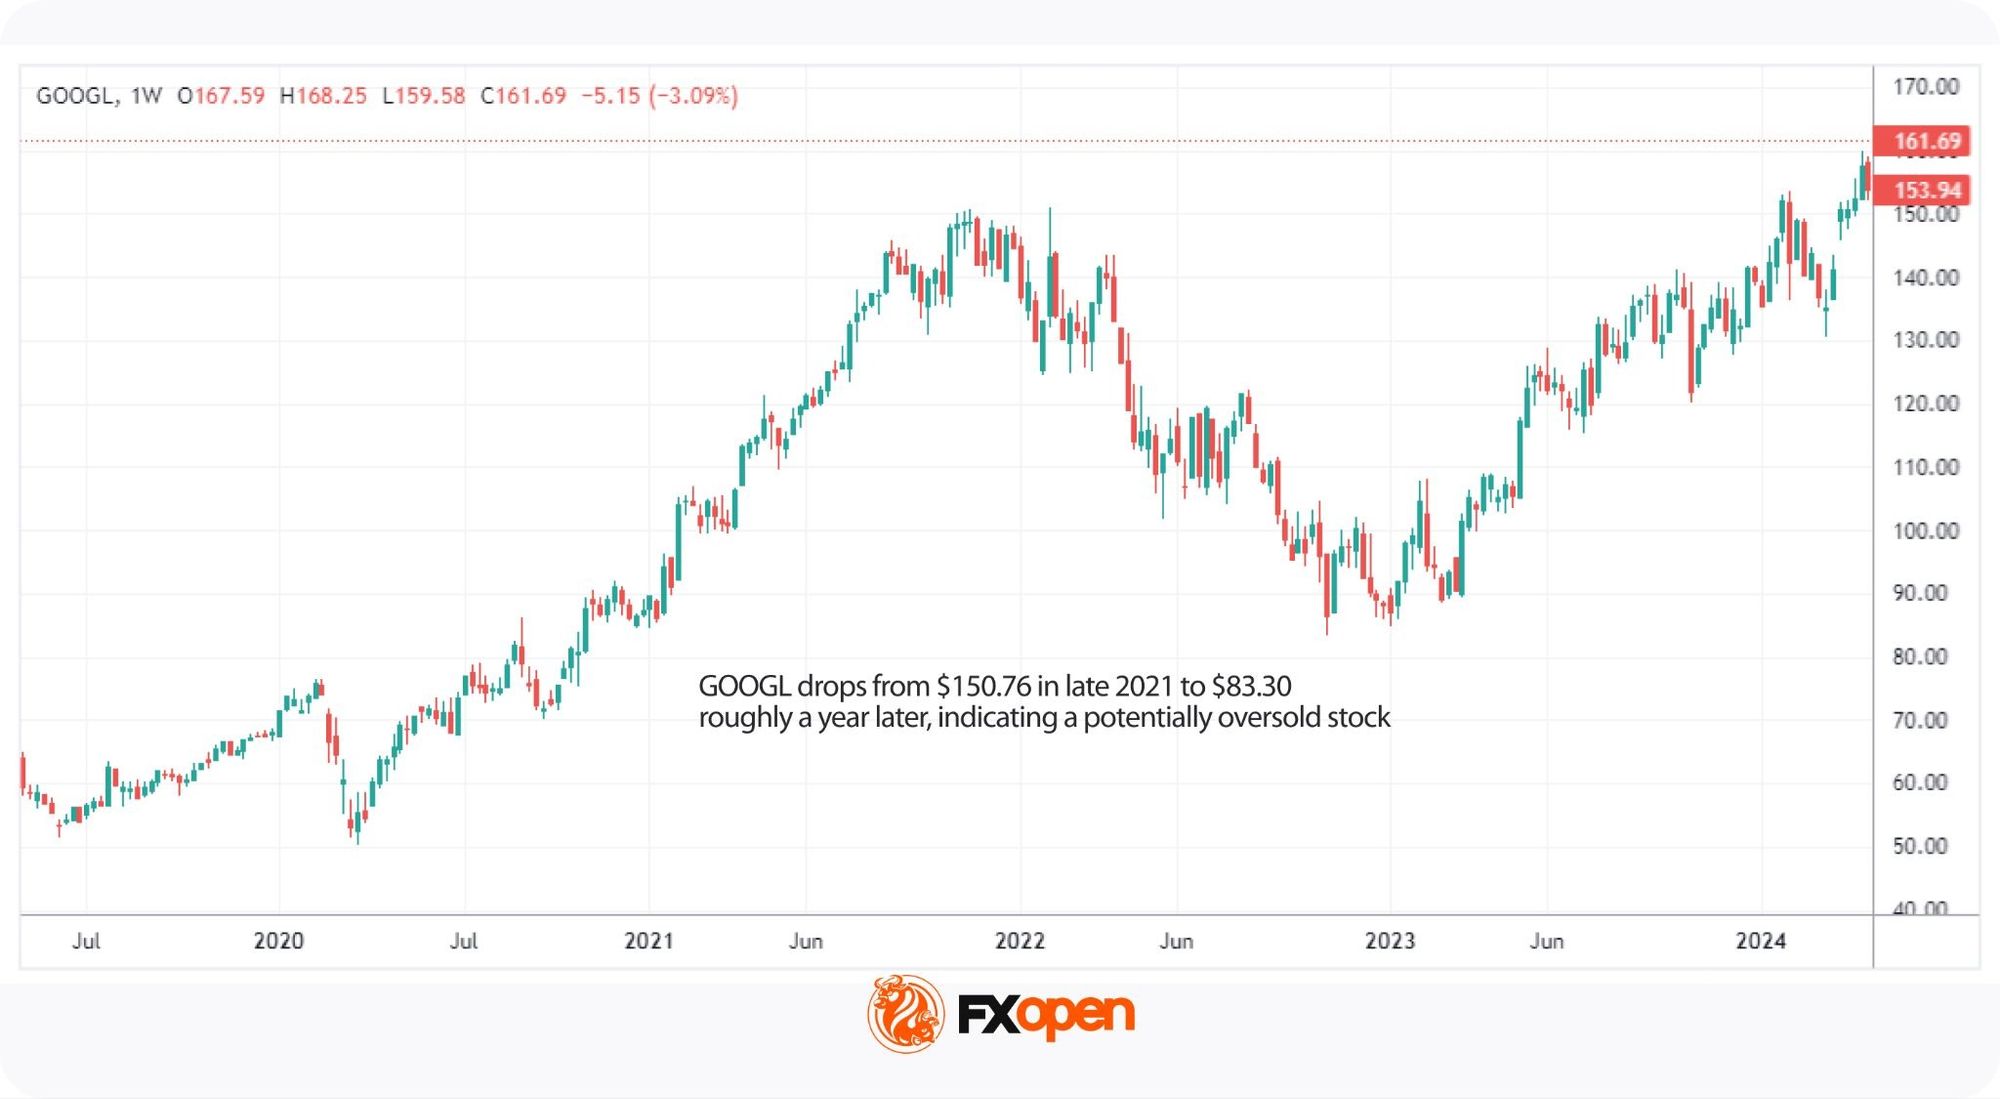
A clear example is the March 2020 market sell-off, when widespread panic during the early stages of the pandemic pushed stocks down across nearly every sector. Many recovered within months as fundamentals held up.
Overselling reflects more than a falling price, though, because it also points to the potential for a reversal once selling pressure fades.
What Is an Overbought Stock?
Overbought stocks are shares that have risen sharply in price, often above what their fundamentals warrant. The overbought condition typically reflects strong buying activity rather than a fair reassessment of value.
Several factors can lead to an overbought market. Sometimes, positive news about a company—such as strong earnings, new product launches, or positive analyst reports—can spark a wave of buying. Market-wide optimism, particularly during bullish phases, can also lead to an overbought stock market. Speculative buying, where traders hope to capitalise on short-term price movements, can further inflate the price.
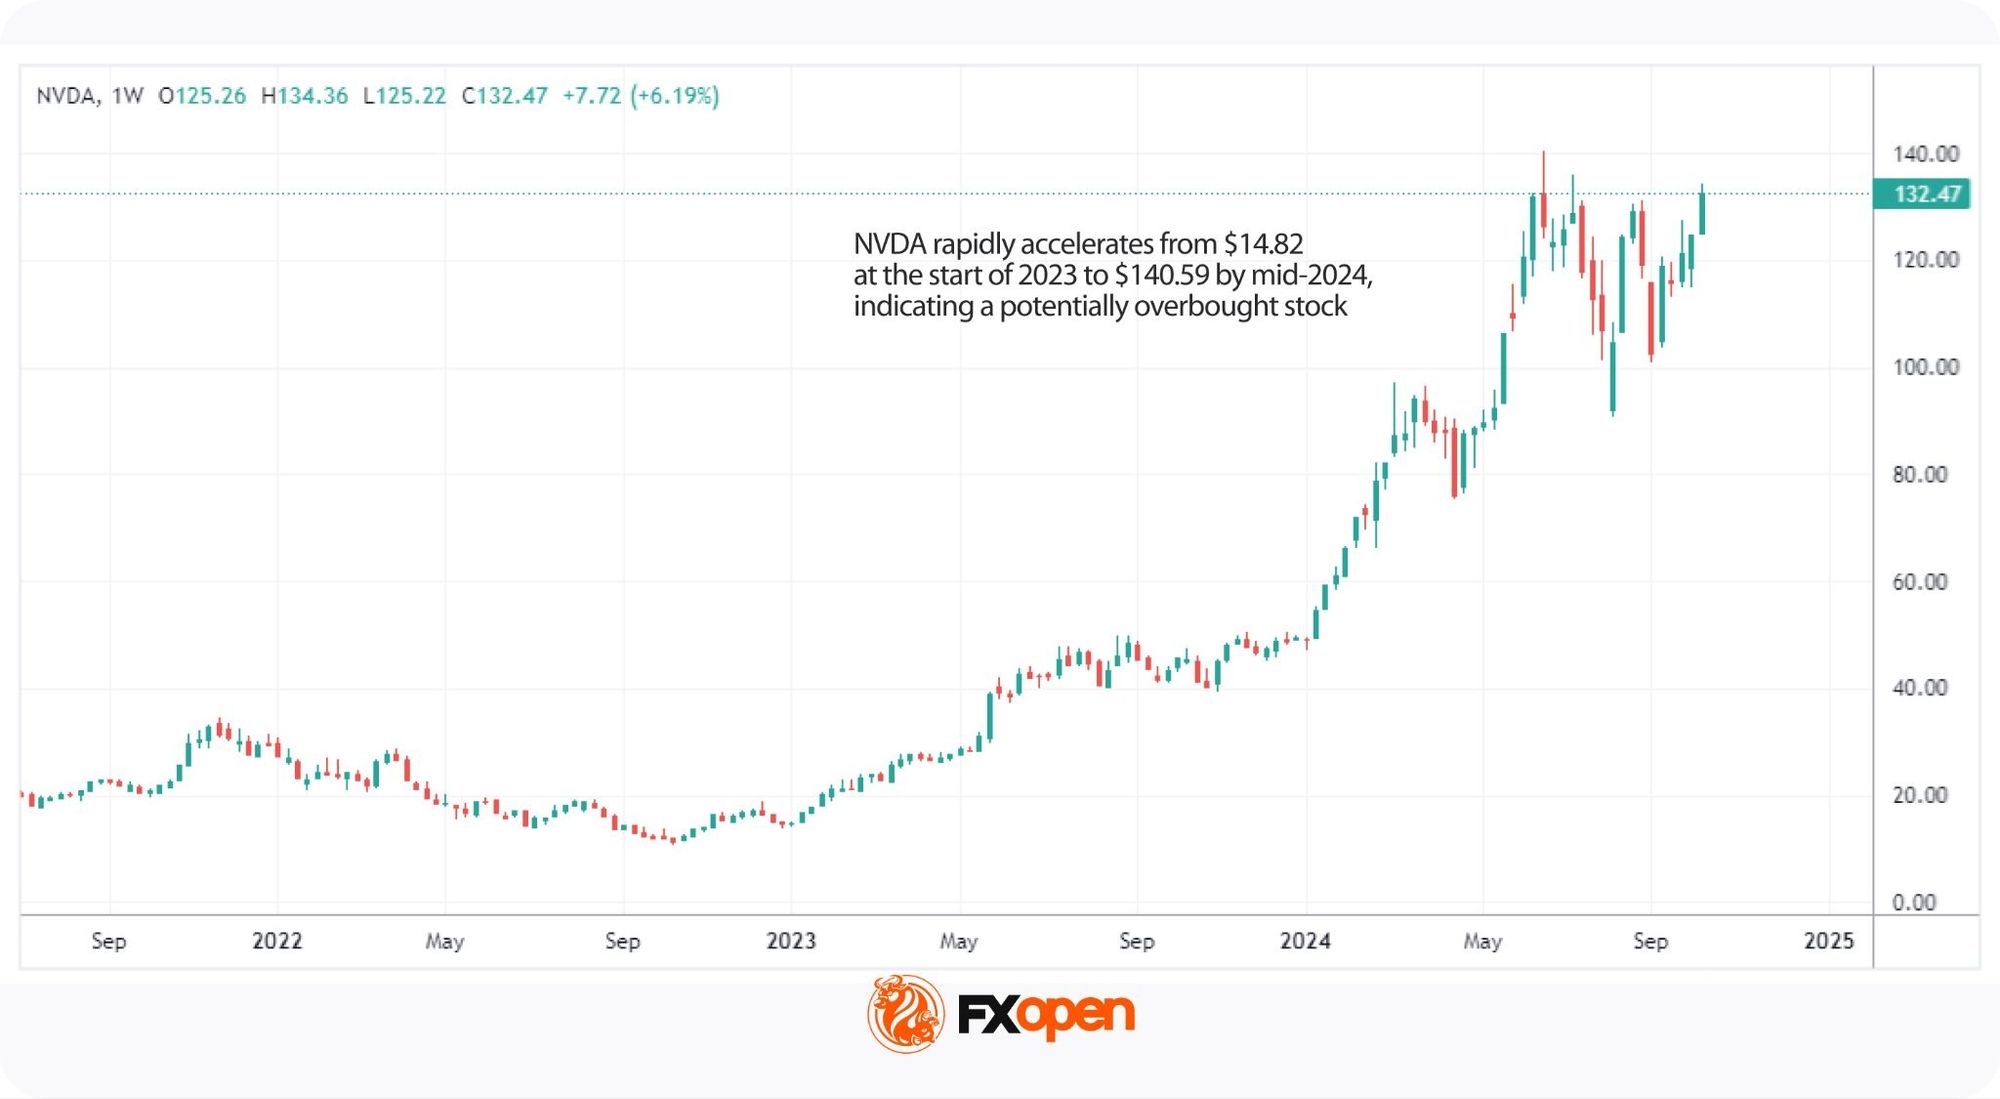
A notable example is the AI-driven rally in mega-cap technology stocks during 2024, when names like Nvidia spent extended periods in overbought territory as enthusiasm around generative AI pushed valuations to record highs.
Being overbought does not guarantee an immediate correction, though it does signal that the price may have moved too high, too quickly.
Overbought vs Oversold: Key Differences
The overbought vs oversold distinction often hinges on sentiment as much as fundamentals. The distinction matters because each condition reflects opposite market behaviour. Overbought signals downside pressure ahead while oversold points to potential upside, so traders position differently for each.
The two conditions compare as follows:
Recognising the difference between overbought stocks and oversold stocks may help traders align analysis with prevailing conditions, though neither signal guarantees a reversal and confirmation from other tools still matters.
Indicators for Oversold and Overbought Stocks
Traders use overbought and oversold indicators to assess whether a stock has moved too far in one direction. Most of these tools are momentum oscillators that measure the speed and magnitude of price changes.
The three most common are:
- Relative Strength Index (RSI)
- Stochastic Oscillator
- MACD (Moving Average Convergence Divergence)
Each oscillator works in a different way, but they share a common purpose: flagging when price action looks stretched relative to recent history. When a stock has moved too far from its typical range, the reading may signal a possible reversal, helping traders identify potential entry or exit points.
Now, let’s break down some of the most popular momentum indicators in trading used for this purpose. To see how they work for yourself, consider following along in FXOpen’s TickTrader trading platform to access a world of stock CFDs.
Relative Strength Index (RSI)
The Relative Strength Index (RSI) is a momentum oscillator that measures the speed and magnitude of recent price changes by comparing the average size of recent gains to recent losses over a set period. The standard look-back is 14 periods, with readings on a scale of 0 to 100.
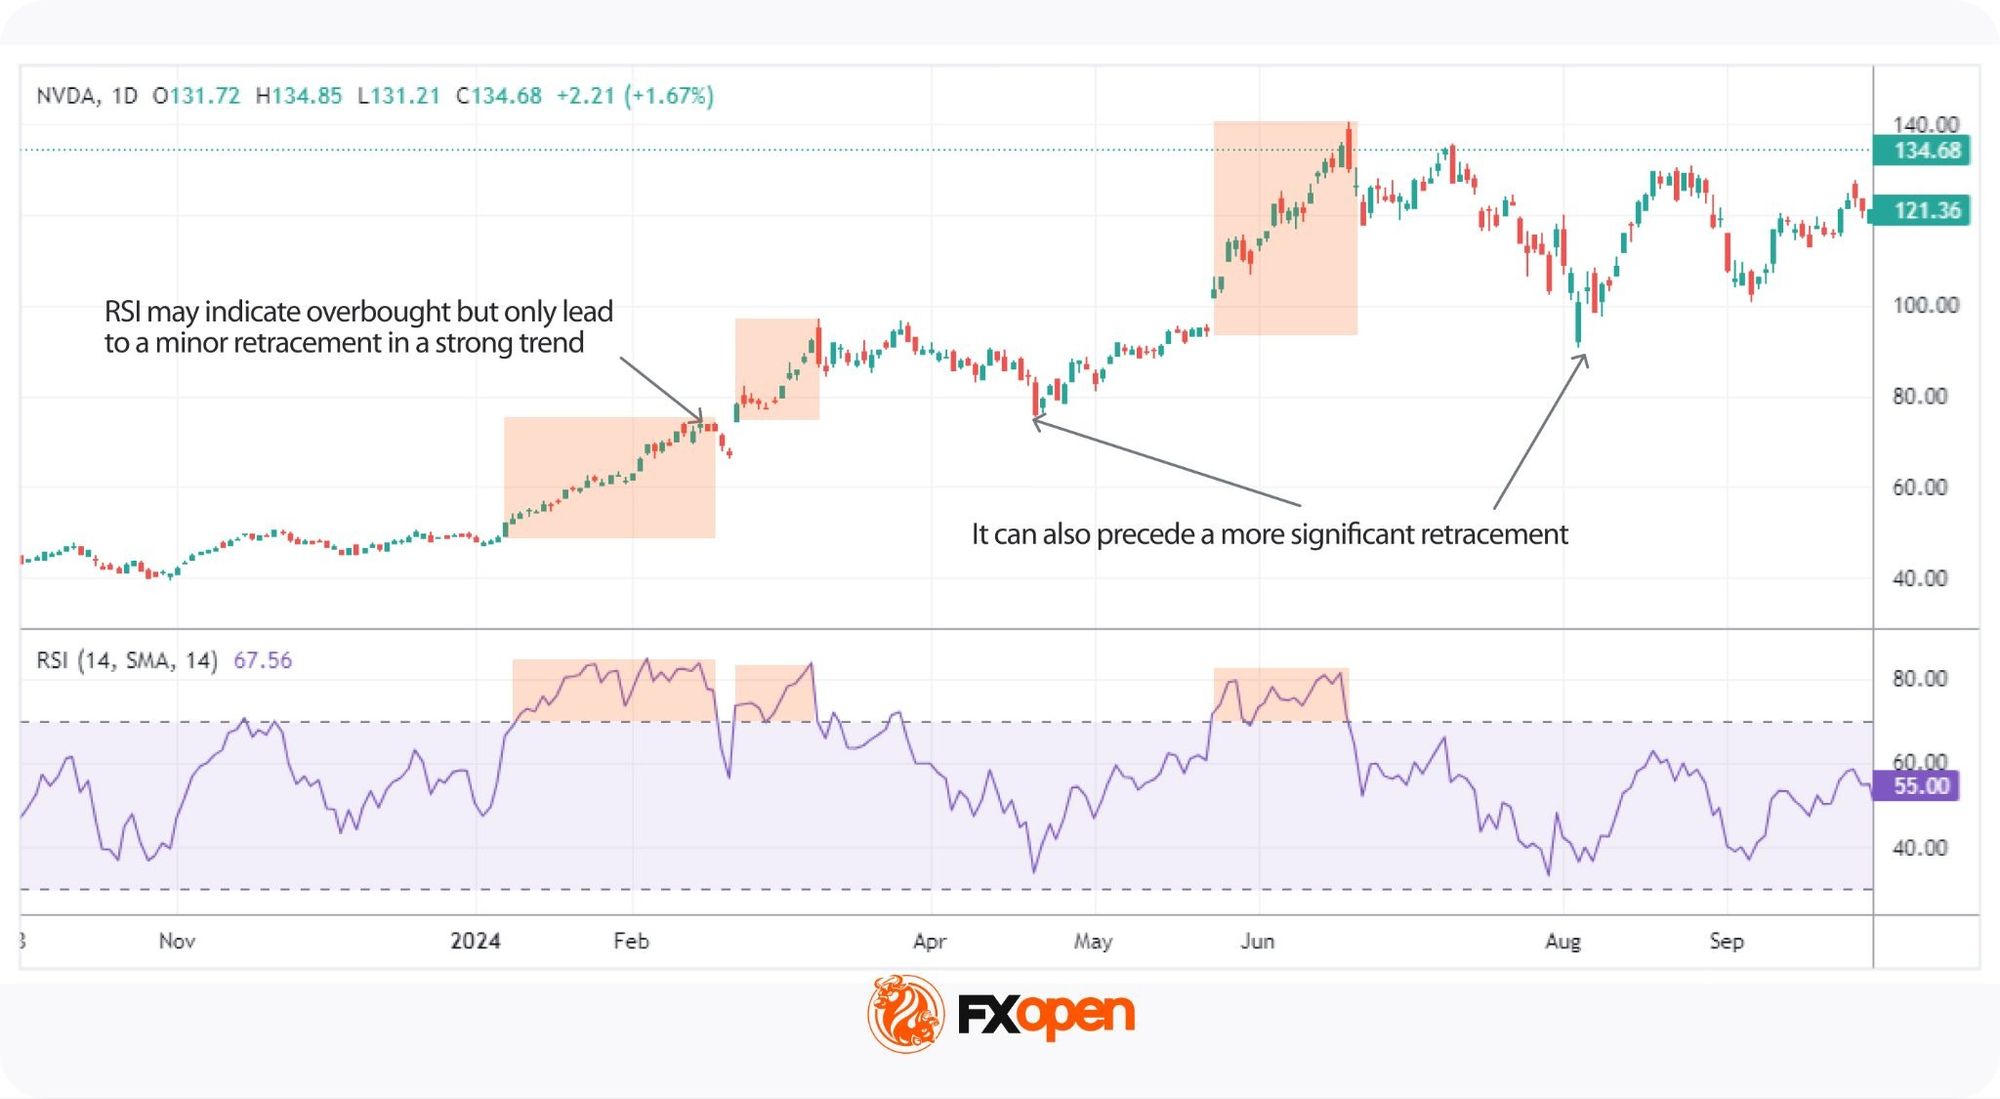
The RSI oversold level is seen as below 30 and indicates the stock may be undervalued and due for a bounce. Meanwhile, the RSI overbought level sits at 70 and above, which often precedes a pullback.
For example, when a stock falls 12% over two weeks and its RSI drops to 25, traders watching for reversals would mark this as a potential setup. The same logic applies in reverse when RSI spikes above 70 after a strong rally.
Context still matters, though. In a strong bull market, a stock may stay overbought for weeks, and during a downturn, stocks can remain oversold longer than many traders expect.
Stochastic Oscillator
The Stochastic Oscillator is a momentum indicator that compares a stock’s closing price to its price range over a defined period.
The main difference from RSI is sensitivity, because the Stochastic focuses on closing price relative to recent range, which makes it react faster to shorter-term reversals.
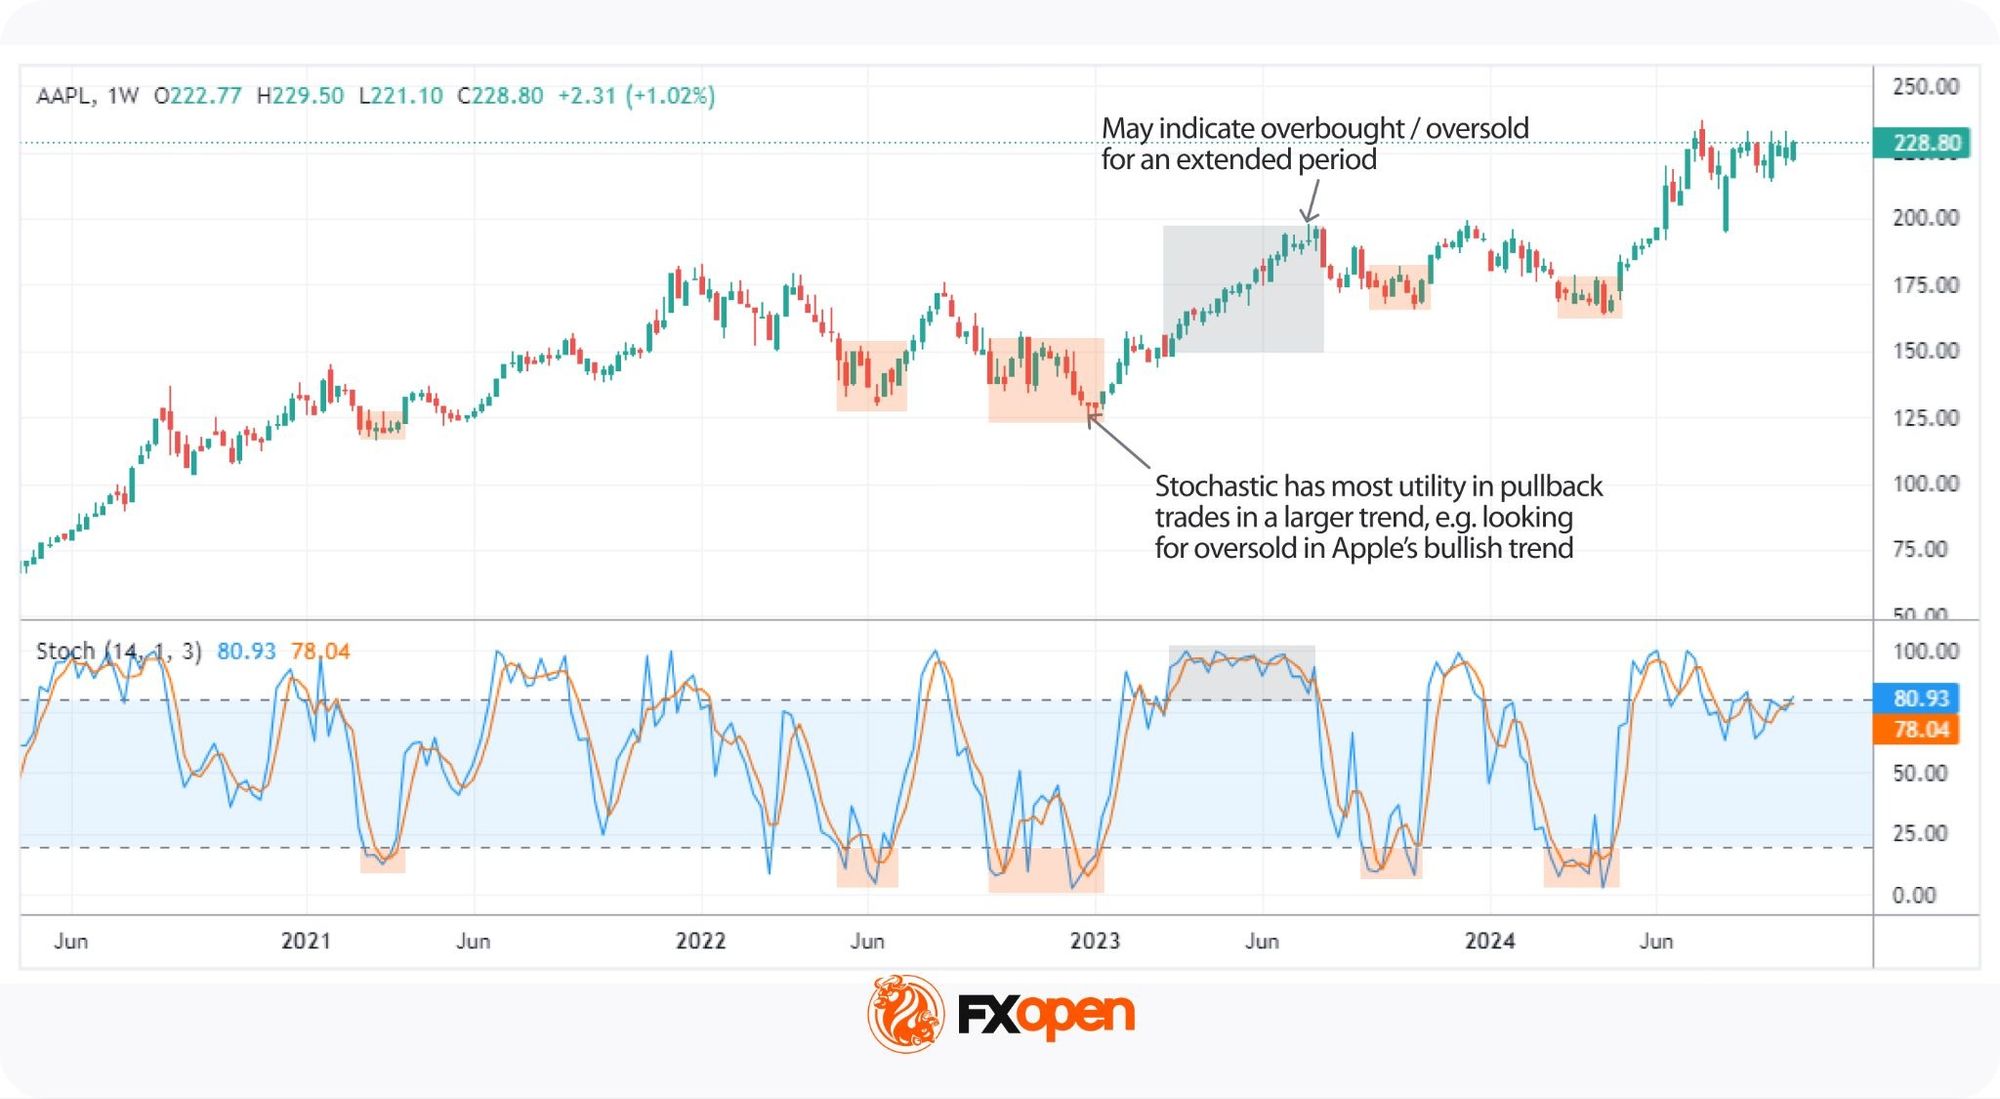
The Stochastic plots two lines: %K reflects the current closing position within the recent range, and %D smooths %K with a short moving average. A reading above 80 marks an overbought zone, while a reading below 20 marks a Stochastic Oscillator oversold zone.
For instance, when a stock closes near its weekly high every day for two weeks, %K typically pushes above 80, and given its sensitivity, the Stochastic can stay extended for long periods during strong trends. This makes it more prone to false signals than the RSI or MACD indicator and typically more useful for trading pullbacks in a broader trend.
MACD (Moving Average Convergence Divergence)
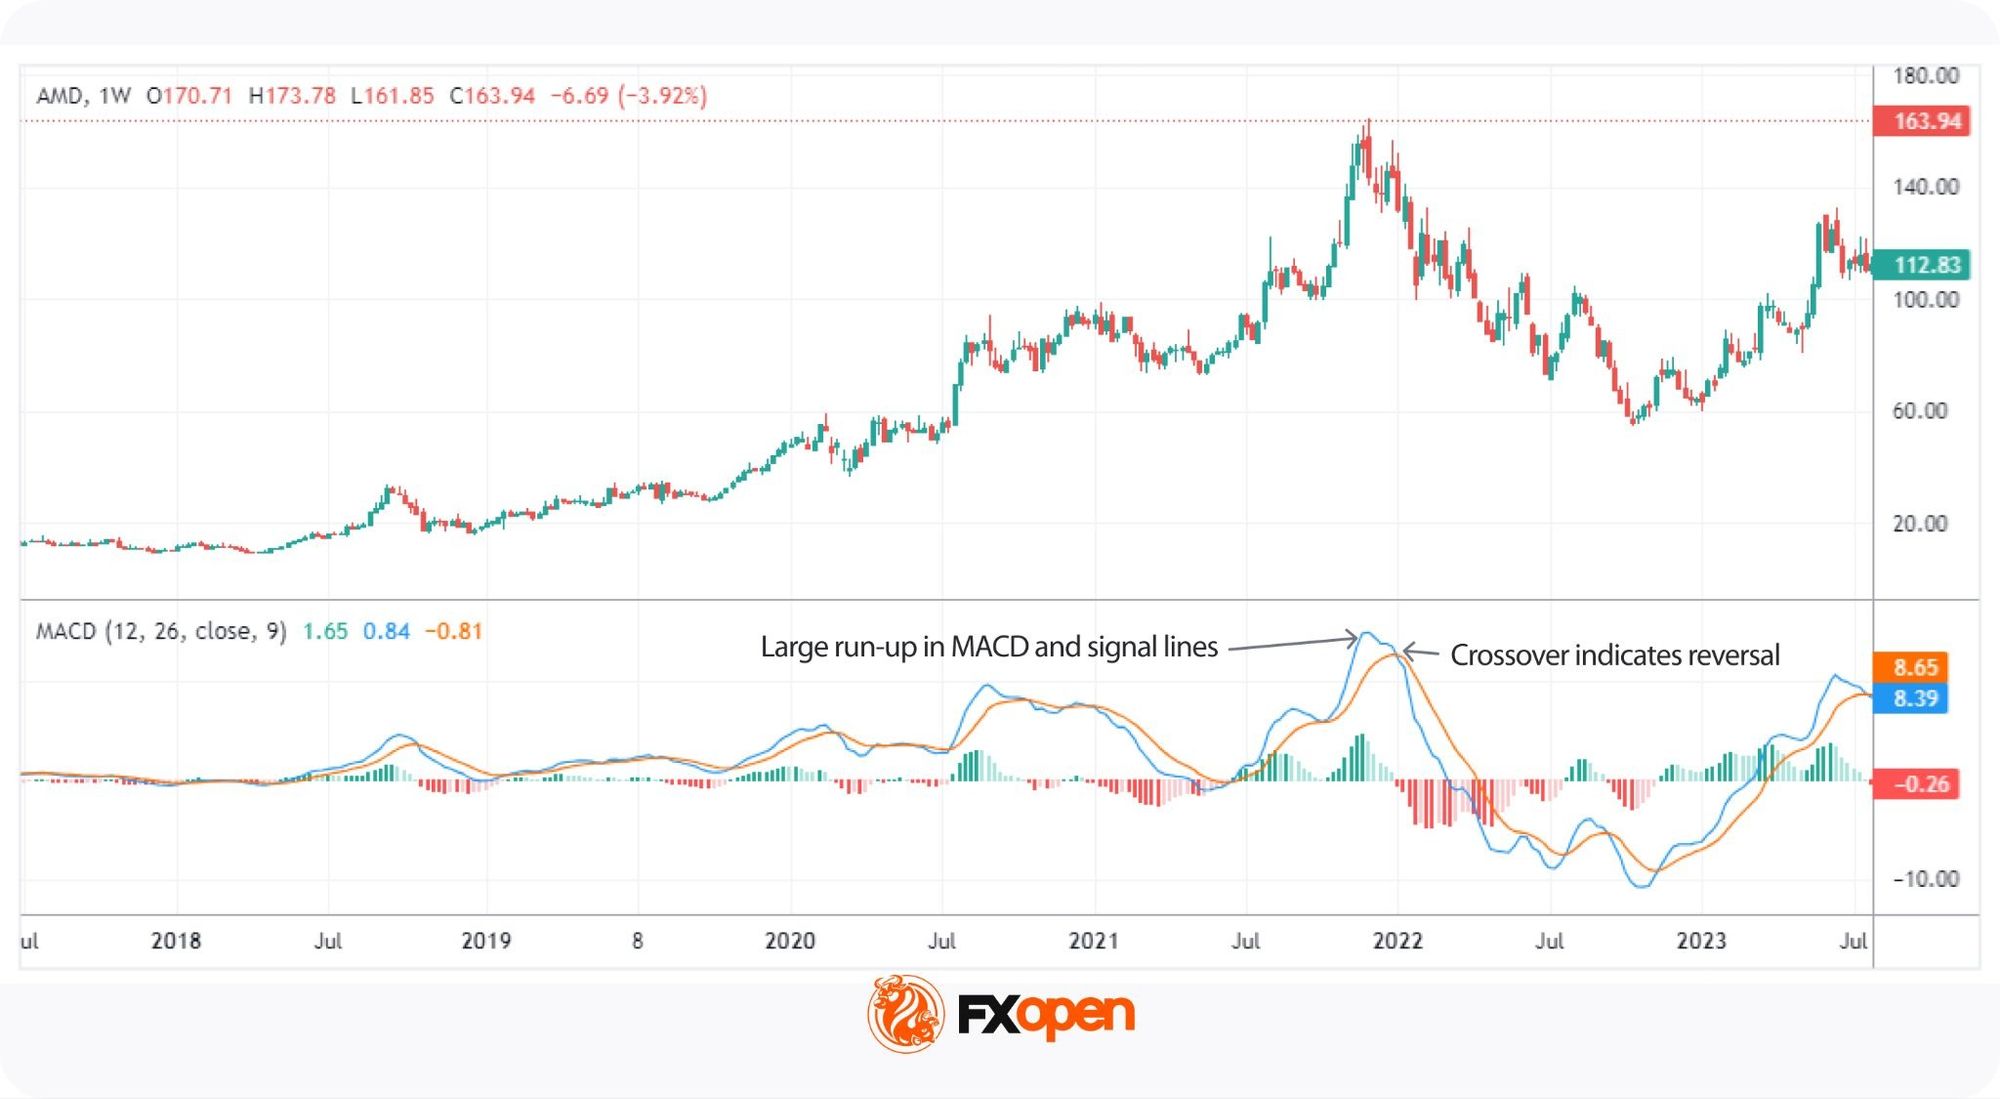
The Moving Average Convergence Divergence (MACD) is a trend-following momentum indicator that compares two moving averages of a stock’s price. Unlike RSI or Stochastic, MACD is not a pure overbought or oversold indicator, since it highlights momentum shift and trend direction instead.
The MACD line tracks the gap between two exponential moving averages, typically the 12-period and 26-period, while a 9-period moving average of the MACD line forms the signal line. When the MACD line crosses above the signal line, it points to a potential bullish reversal, and a cross below points to a bearish reversal.
Traders can still gauge stretched conditions through MACD momentum signals, because when both lines sit far from the 0 midpoint and historical averages, the move may be overextended.
Limitations of Overbought and Oversold Signals
Momentum indicators help traders spot overextended conditions, but they carry limitations. A reading at an extreme tells you the move has been strong, though it does not tell you the move is finished. Traders who treat overbought and oversold levels as automatic triggers tend to fail.
The main limitations include:
- A low oscillator reading does not guarantee a price reversal
- Strong trends can keep readings extended for far longer than expected
- Different timeframes produce different signals on the same stock
- Single indicators offer no confirmation, raising the risk of poor entries
False signals in stocks are the most common pitfall. Two practical filters reduce this risk: divergence analysis and multi-timeframe confirmation.
Divergences
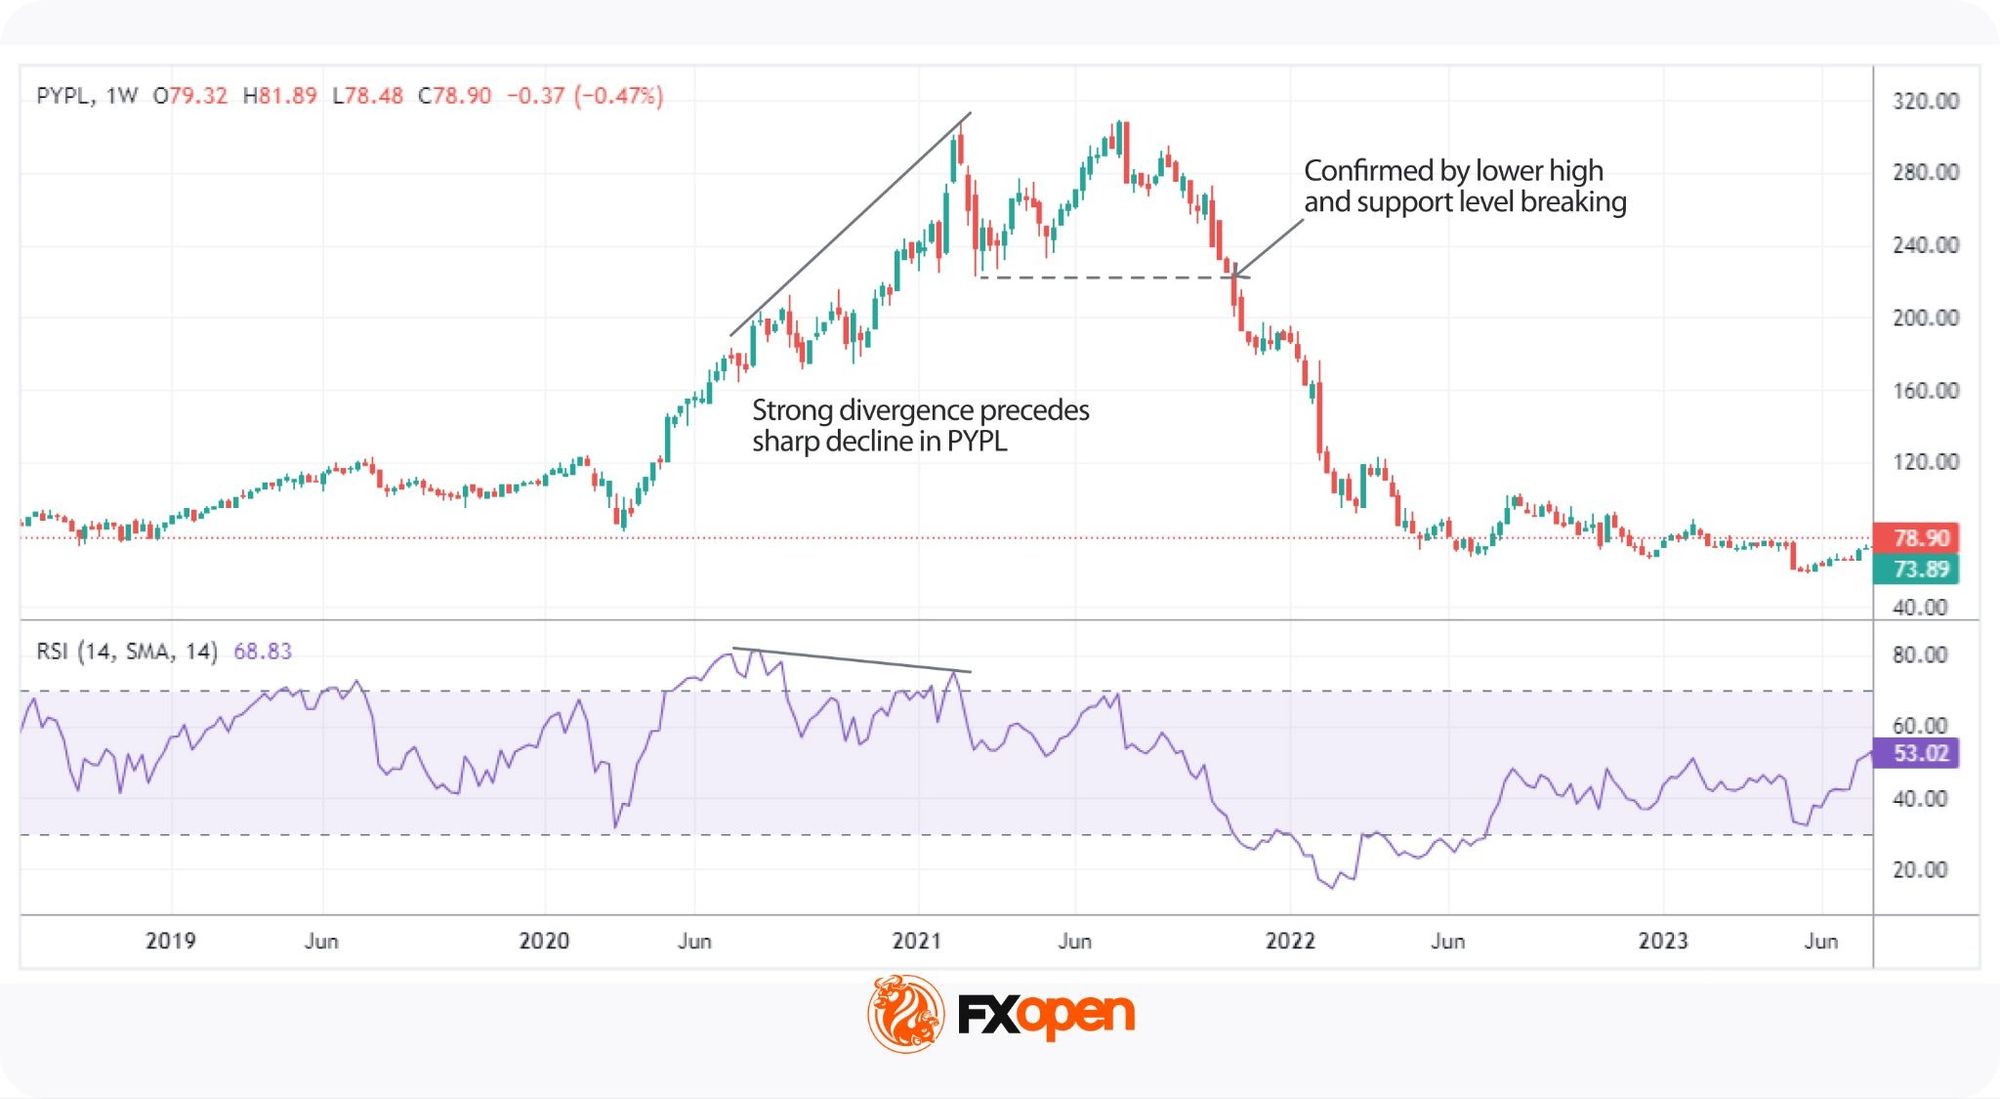
Divergence describes a price move that runs against its indicator, such as a stock pushing to a new high while RSI prints a lower high, which signals weakening momentum and a possible turn. Traders typically use divergence as a confirmation tool rather than a standalone trigger, because pairing it with a price action signal reduces the risk of acting on a false reading.
Timeframes
Timeframe selection shapes how overbought and oversold signals appear on a chart, because daily and weekly views can disagree on the same stock, with the daily flashing oversold while the weekly remains neutral. Traders match the timeframe to their strategy, whether short-term or long-term.
Many traders apply a top-down approach, confirming the higher timeframe direction first before refining entries on lower timeframes. This multi-timeframe check may support market analysis when readings conflict.
Risks of Trading Oversold and Overbought Stocks
Trading overbought and oversold stocks carries risks beyond standard market exposure, because the signals can flag setups that never play out, and the indicators can stay at extremes for far longer than traders expect. Robust risk management practice may potentially reduce exposure to each pitfall below.
- False signals: an oversold or overbought reading does not guarantee a reversal, because prices can keep rising or falling despite the indicator, and treating every extreme reading as a trade trigger leads to poor outcomes.
- Extended trends: during strong runs, stocks can stay extended for weeks, and acting too early often produces premature losses.
- Market sentiment: news events or macroeconomic shifts can overpower technical signals, with strong optimism or fear keeping a stock in overbought or oversold territory longer than expected.
- Lack of confirmation: relying on a single indicator carries higher risk, so many traders combine technical and fundamental analysis, or stack multiple stock technical analysis indicators, before acting on an extreme reading.
The Bottom Line
Understanding overbought and oversold stocks, along with the indicators used to identify them, can help traders spot trend changes. While these conditions may signal a reversal, it’s important to recognise there is no one best overbought and oversold indicator and use multiple tools for confirmation.
To put this knowledge into practice, you can consider opening an FXOpen account, which offers access to stock CFDs and advanced trading platforms.
FAQ
What Is Overbought and Oversold?
Overbought and oversold are terms used to describe extreme price movements in markets. A stock is considered overbought when its price has risen rapidly and above its underlying value, which potentially makes it overvalued. It’s oversold when the price has fallen sharply and below its underlying value, which makes it undervalued. These conditions can signal that a price reversal may be coming, though they don’t guarantee it.
What Is an Overbought Stock?
The overbought stock meaning refers to a stock that has increased quickly and is potentially trading higher than its actual value. This often occurs due to strong demand or market optimism. Overbought conditions might signal that the price is at risk of a pullback.
What Is an Oversold Stock?
The oversold stock meaning refers to a stock that has dropped significantly and may be below its true value. This often happens when there’s been excessive selling, and it could suggest that its price is due for a rebound.
How Can You Find Oversold Stocks?
Traders often use technical indicators like the Relative Strength Index (RSI) to find the most oversold stocks. An RSI reading below 30 typically suggests that a stock is oversold and may present a buying opportunity. Other indicators, like the Stochastic Oscillator, are also commonly used to identify oversold conditions.
What Is the Difference Between Overbought and Oversold?
The difference between overbought and oversold lies in direction. An overbought stock has risen too far and may face downward pressure, while an oversold stock has fallen too far and may rebound. Both flag possible reversals.
Which Indicators Identify Oversold Stocks?
Common indicators include the Relative Strength Index, Stochastic Oscillator, and MACD, with an RSI reading below 30 or a Stochastic below 20 typically pointing to oversold conditions. Traders often combine indicators for confirmation.
Can a Stock Stay Overbought or Oversold?
Yes, a stock can stay overbought or oversold for weeks during strong trends. In such a case, indicator readings may sit at extreme levels for long. Traders use confirmation tools to avoid premature entries.
This article represents the opinion of the Companies operating under the FXOpen brand only. It is not to be construed as an offer, solicitation, or recommendation with respect to products and services provided by the Companies operating under the FXOpen brand, nor is it to be considered financial advice.

Crypto World
SpaceX’s crypto-traded IPO was sharply falling. It now points upward to a $2.4 trillion valuation


Blockchain-based prediction markets have recently emerged as the go-to-place for investors to bet on the SpaceX IPO, offering a decentralized alternative to traditional pre-IPO markets. Unlike private equity deals that require accreditation and high minimums, these onchain markets are accessible to retail investors with minimal capital, creating 24/7 price discovery on IPO odds.
At Wednesday’s level near $157, SPCX implied only a roughly 16% premium to the $135 IPO price, down from about 60% when the contract briefly traded near $216 in May. At $183, the implied premium is back near 36%.
Other shadow markets are now pointing the same way. Bloomberg reported Friday that IG International derivatives implied a SpaceX valuation of about $2.4 trillion, more than 35% above the $1.77 trillion valuation set by the IPO price.
Elsewhere, Polymarket traders put 70% odds on SpaceX closing its first trading day above $2 trillion.
The reversal comes as pre-IPO SPCX has shown caution in the market, falling by about 30% over the past few weeks. It suggested traders still expected SpaceX to trade above the offer price, but not at the explosive premium implied by the bookbuild. And Friday’s bounce now says that discount is closing.
Crypto World
Former SEC, CFTC Chair Gary Gensler argues that prediction markets don’t overrule state regulations

“To put the argument in the plainest real-world terms: Senate Majority Leader Harry Reid of Nevada would never have consented to or passively accepted legislation displacing an activity so critical to his state’s economy and politics by permitting sports betting only under CFTC auspices,” Gensler’s brief said.
Courts have so far been split; some have ruled in favor of prediction market providers, while others have ruled in favor of states.
The Third Circuit Court of Appeals ruled in April that the state of New Jersey could not shut down prediction markets, but panel of the Ninth Circuit Court of Appeals seemed more inclined to rule for the states.
It is likely that the Supreme Court will ultimately take up the issue, and Congress is also poking around.
Amicus briefs
The CFTC, currently helmed by Chair Mike Selig, filed its own amicus brief in this case last month, arguing that any event contract traded by a designated contract market overseen by the regulator is a swap.
Congress’ definition of a swap was broad and the language in the statutes allows for the CFTC-regulated firms to offer their products, the regulator’s filing said.
Genler’s brief disagreed.
“The CFTC now posits hedging theories for some sports bets that are at best only tenuously connected to reliable hedges of commercial risks. That connection, however, is crucial, as Congress included only those event contracts that hedge risks in a manner similar to a swap and are sufficiently ‘associated with a potential financial, economic, or commercial consequence,’” Gensler’s brief said.


Leading crypto exchange Coinbase has launched Coinbase for Agents. This product connects AI agents directly to user accounts so they can trade, pay, and execute financial workflows within limits the user controls.
The exchange also unveiled Coinbase Advisor, an in-app agent that delivers recommendations and guidance to users without any external setup. It is a registered investment advisor with the Securities and Exchange Commission (SEC) and as a commodity trading advisor with the National Futures Association (NFA).
AI Agents Gain Direct Access to Coinbase Accounts
The product ships in two formats. An MCP serves web-based harnesses such as ChatGPT and Claude Web, while a CLI targets terminal environments like Claude Code. Coinbase said the MCP connects with a single login, while the CLI offers lower token overhead and deeper customization.
Follow us on X to get the latest news as it happens
Agents can rebalance portfolios according to target allocations, place limit orders on dips, and schedule recurring buys. They can also monitor idle cash and pay for premium data.
Each agent can operate inside an isolated, permissioned portfolio with no visibility into a user’s other holdings. Upcoming controls will add maximum trade sizes and spending caps.
“Think of it like giving a gift card rather than handing over your bank account. You define the limits. Your agent executes within them,” Coinbase said.
Payments made through the product pass the same transaction monitoring and Know Your Transaction (KYT) checks as the rest of the exchange.
Expansion Plans Reach Stocks and Prediction Markets
Crypto spot and derivatives trading are fully enabled at launch. Moreover, Coinbase plans to extend access to stocks, index funds, prediction markets, and commodities.
The launch builds on AgentKit, released in 2024 to put wallets in agents’ hands, and the x402 payments protocol introduced last year.
Other firms are also moving in the same direction. Swiss bank Sygnum completed the first live AI agent transaction by a regulated Swiss bank in May. In addition, Anchorage Digital unveiled Agentic Banking the same month.
Coinbase described the products as the start of a full consumer agentic suite. Adoption rates among everyday investors will show whether agent-led trading extends beyond early enthusiasts in the coming months.
Subscribe to our YouTube channel to watch leaders and journalists provide expert insights
The post Coinbase Opens Crypto Trading to AI Agents Through New Tool appeared first on BeInCrypto.


SpaceX priced its initial public offering at $135 a share and starts trading on the Nasdaq on Friday under the ticker SPCX. The $75 billion raise is the largest IPO in history. It values the company near $1.75 trillion and puts Musk on track to become the world’s first trillionaire.
Demand topped $250 billion, with retail orders alone above $100 billion.
Crypto took the cue higher. Bitcoin rose about 1.6% to roughly $63,550 and is now green on the week, per CoinDesk data, recovering the ground it lost in the early-June selloff. Solana added 3%, XRP and dogecoin each rose 2.3%, and Hyperliquid bounced 7.6% on the day.
Dogecoin barely stood out. It rose 2.3%, in line with the broad market. The token has spent years jumping on Musk and SpaceX headlines, and this was the biggest SpaceX event ever.
The real signal comes when SPCX prints its first trade. A strong debut confirms the risk-on turn, while a weak one tests it.
SpaceX is preparing for what could become the largest IPO in history, with an expected offering price of $135 per share and a targeted valuation of at least $1.8 trillion. With roughly 13 billion shares outstanding, the company could immediately rank among the largest publicly traded corporations in the United States.
But SpaceX’s debut is already dividing investors. Some traders are betting on a historic surge. Others are warning that it could become one of the most painful retail traps in recent memory.
Can SpaceX Reach a $4 Trillion Valuation on Day One?
Prediction markets show extreme bullish outliers. Some bettors speculate that SpaceX’s closing market capitalization could exceed $4 trillion by the end of its first trading day. That would imply a share price above $300, representing a gain of more than 125% from the IPO price.
However, the probability assigned to that outcome is extremely low, near 1%. A more moderate expectation places a roughly 38% probability on SpaceX exceeding $2.4 trillion, implying a closing price around $185, or a 35% premium to the IPO level.
At the lower end of expectations, there is a small probability that SpaceX could close below a $1 trillion valuation, which would imply a share price near $76, roughly 40% below the IPO price. Some analysts have even suggested a fundamental valuation closer to $780 billion, highlighting the wide dispersion in estimates.
The scale of these valuation ranges reflects the unprecedented hype surrounding SpaceX’s exposure to both artificial intelligence and the commercial space economy.
The Valuation Problem
Based on its prospectus, SpaceX generated approximately $18.67 billion in revenue last year. At a $1.8 trillion valuation, the company would trade at a price-to-sales ratio of roughly 96.
Historically, companies operating in transformative industries have struggled to sustain price-to-sales ratios above 30 over long periods. A ratio approaching 100 raises concerns that initial pricing may reflect sentiment rather than sustainable fundamentals.
Mega IPOs also have a mixed historical track record. Companies like Facebook and Saudi Aramco experienced significant drawdowns within six months of debuting. Initial enthusiasm often fades once the post-IPO lockup dynamics and earnings realities set in.
Structural Tailwinds Could Inflate Early Prices
Unlike traditional IPOs, SpaceX may benefit from accelerated index inclusion. Nasdaq modified its Fast Entry rules, potentially allowing SpaceX to join the Nasdaq-100 within approximately 15 trading days. The company could also qualify for Russell indexes within five trading sessions, and S&P 500 inclusion rules may be waived.
This matters because passive ETFs tracking these indexes would be forced to purchase billions of dollars in SpaceX shares shortly after listing. That mechanical demand could push prices higher in the short term.
However, such forced buying also concentrates float ownership in passive funds. Once insider lockups expire, accelerated selling could create volatility, potentially transferring risk to late retail entrants.
CoinCodex SpaceX Price Prediction for 2026–2027
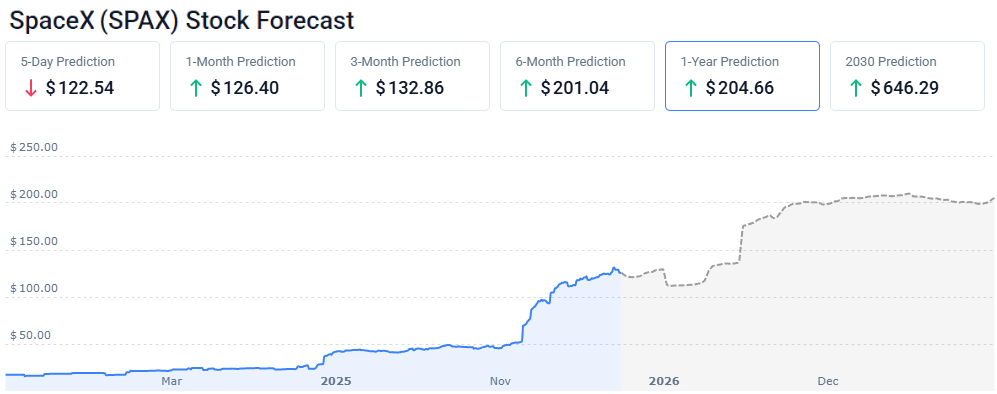
According to CoinCodex’s SpaceX price prediction, the stock may experience moderate consolidation shortly after its IPO before entering a stronger upward phase later in 2026. In June 2026, the projected average price stands at $123.32, slightly below the expected IPO level of $135.
July and August follow a similar pattern of relative weakness, with projected averages near $119.18 and $118.53, suggesting that early enthusiasm could cool as the market reassesses valuation and lockup dynamics.

Momentum is projected to strengthen beginning in September 2026, when the average price rises to $141.91. That shift marks the first meaningful breakout above IPO pricing in the model. The acceleration continues into October, where the projected average climbs to $182.47, followed by $197.11 in
November and $199.87 in December. This late-year rally implies that sustained demand, potentially tied to earnings visibility or index inclusion effects, could support a significant recovery after the initial consolidation phase.
Moving into early 2027, projections stabilize in the $200 to $208 range through the first quarter, with March 2027 averaging $207.85. Prices then show modest consolidation into the spring, hovering just above $200 through June 2027.
Under this base case scenario, the model implies a long-term appreciation of roughly 60% to 66% from the IPO price, but notably does not support extreme first-day surge scenarios above $300 per share. Instead, it suggests a more gradual climb following initial volatility rather than an immediate doubling of value.
The post SpaceX Price Prediction: Bubble Euphoria or $4 Trillion Breakout? appeared first on BeInCrypto.
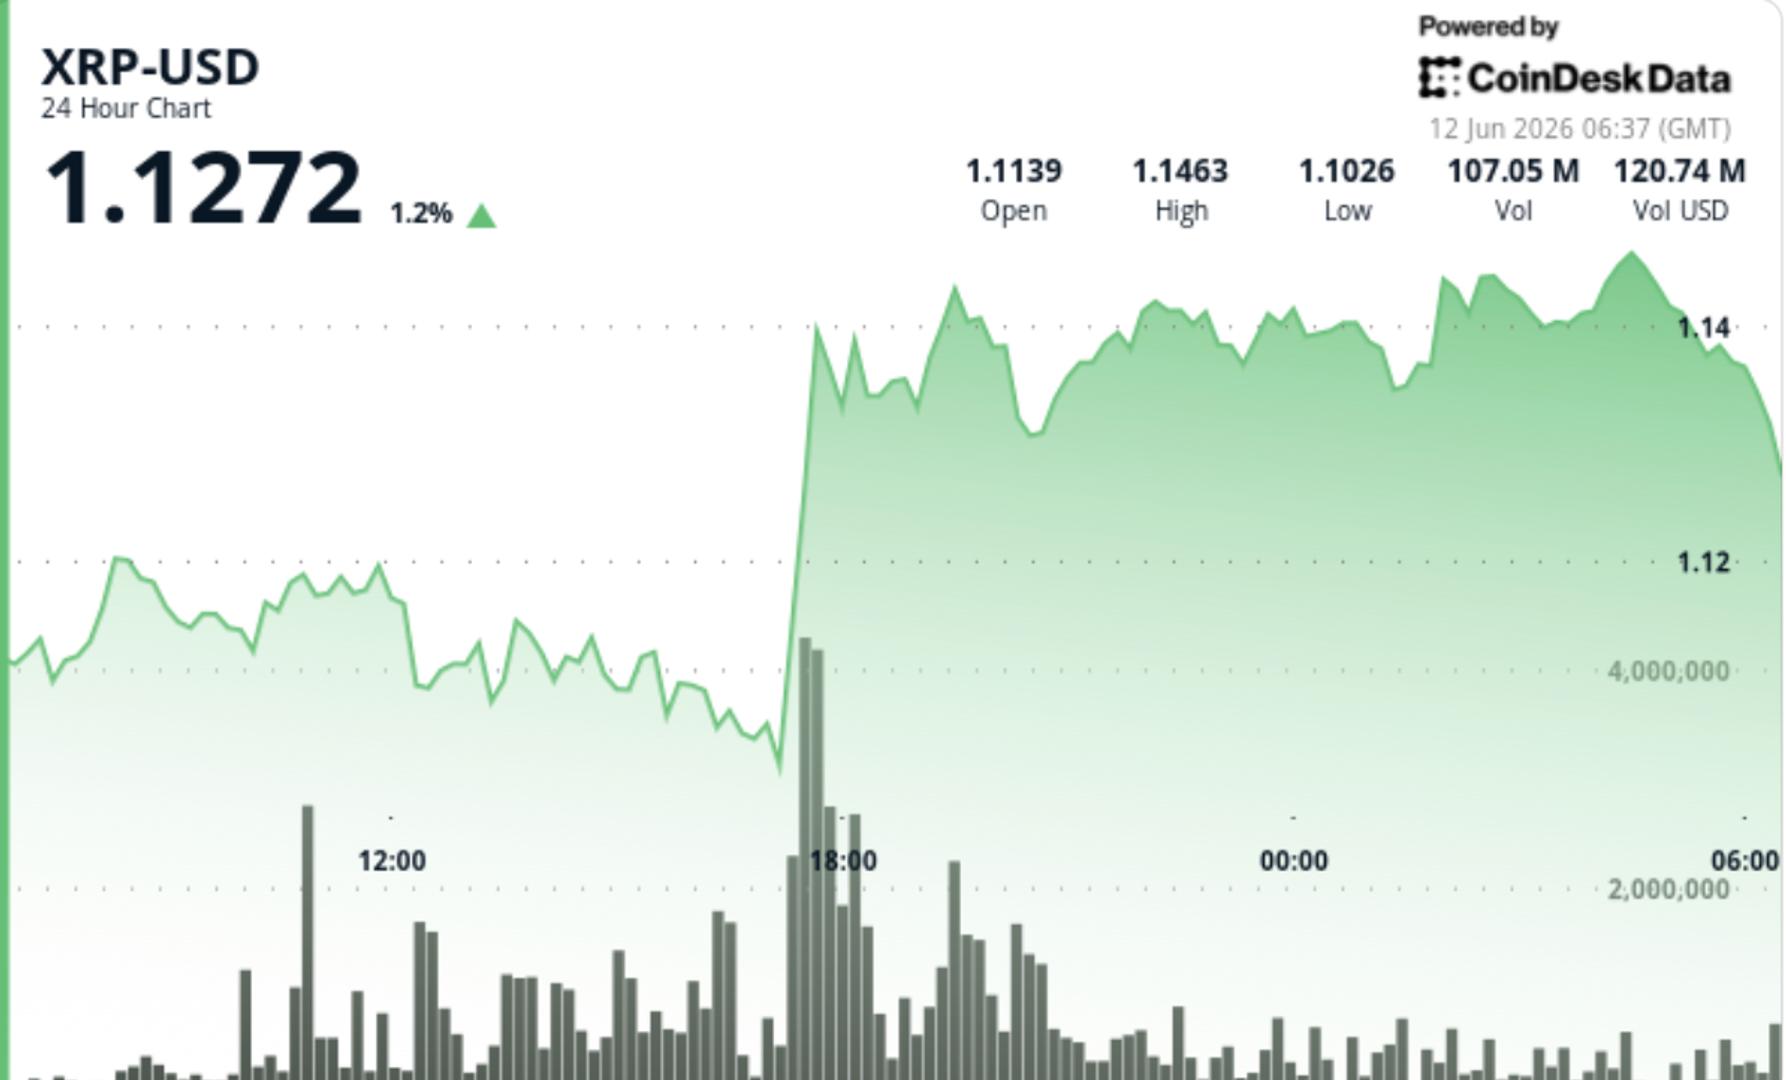

XRP bounced sharply from last week’s selloff, reclaiming $1.14 on its strongest volume in weeks. Buyers pushed the token through resistance near $1.12 and kept buying into the close, a change from the short-lived rebounds that have repeatedly faded since February.
The next test sits higher up, as every major recovery this year has stalled before reaching the $1.20-$1.25 area.
News Background
• Ripple said Bitso’s MXN-backed stablecoin MXNB will launch on the XRP Ledger and integrate with its Payments on Decentralized Exchange infrastructure, expanding regulated cross-border settlement between the U.S. and Mexico.
• Ripple’s RLUSD and Bitso’s MXNB are designed to provide on-chain dollar and peso liquidity for enterprise payment flows, adding another institutional use case for XRPL infrastructure.
• The initiative builds around XRPL’s Permissioned DEX, a framework aimed at regulated financial participants rather than retail users.
Price Action Summary
• XRP rose from $1.1080 to $1.1442 during the 24-hour session, gaining 3.3%.
• The key move came during the June 11 17:00 UTC session, when volume surged to 120.2 million XRP, more than 160% above average, pushing price through resistance near $1.1220.

LG Electronics has teamed with Ethereum layer-2 Arbitrum to explore a blockchain-powered advertising network designed to streamline the buying, selling, and tracking of digital ad inventory. Fortune reported on Thursday that the collaboration aims to provide a shared database for advertisers and publishers and to automate how audiences interact with ads, with a potential market rollout this year.
“We are evaluating whether this approach can deliver meaningful value to advertisers, publishers and audiences,” said Samuel Byungsun Park, head of LG Electronics’ blockchain research lab. The venture, still in the exploration stage, underscores a broader push within the tech industry to apply blockchain and automation to the sprawling digital advertising ecosystem.
Arbitrum would supply the network’s backbone—an automated, software-driven system intended to reduce reliance on traditional intermediaries that currently mediate ad buys between brands and publishers. By consolidating inventory data and consumer interaction signals on a blockchain-based ledger, the partners hope to provide greater transparency and efficiency for buyers and sellers alike. As Steven Goldfeder, Arbitrum’s co-founder, put it to Fortune, the goal is to enable markets to operate in an automated fashion, reducing the need for manual intervention.
On the market reaction, Arbitrum’s token ARB rose about 5.44% on Thursday in response to the news of the collaboration and the broader Layer-2 development it represents. Arbitrum confirmed the update on X, underscoring momentum around the network as it expands into new usage scenarios beyond its core scaling role for Ethereum.
Cointelegraph reached out to both Arbitrum and LG Electronics for comment on the initiative and its timing.
LG has long explored cryptocurrency and blockchain technology, testing the waters with internal ventures and consumer-facing products. In 2018, LG CNS, the company’s solutions arm, launched its own blockchain platform called Monachain, aimed at business-to-business use cases such as digital authentication, payments and supply chain management. More recently, LG Electronics built a decentralized wallet called Wallypto on the Hedera Hashgraph network, designed to accompany the LG Art Lab NFT platform that showcased digital artworks on televisions. The NFT project was shut down in June 2025, part of a broader wave of NFT marketplace closures that year, and LG subsequently terminated Wallypto in September 2025.
The evolving LG crypto portfolio reflects a cautious, testing approach rather than a full-scale pivot. The company’s history highlights both the potential for big-tech players to innovate in digital advertising through blockchain-enabled networks and the practical challenges that accompany consumer-facing crypto products in a fast-changing market.
Key takeaways
- LG Electronics and Arbitrum are jointly exploring a blockchain-enabled advertising network intended to unify ad inventory and automate measurement of audience interactions, potentially reducing reliance on traditional intermediaries.
- The project could reach market within the year, according to Fortune, with Arbitrum providing the shared data backbone and automation.
- ARBI’s token rose about 5.44% on Thursday following the news, reflecting investor interest in Layer-2 applications expanding beyond scaling Ethereum.
- Digital ad spend is enormous and growing; global estimates place 2025 spend at around $679 billion, representing roughly two-thirds of total ad expenditure, which helps explain why advertisers are watching blockchain-enabled ad networks closely.
- LG’s crypto experiments show a pattern of methodical exploration: Monachain (2018), Wallypto on Hedera, and the LG Art Lab NFT platform, with mixed outcomes and eventual pivots or shutdowns in later years.
LG, Arbitrum and the ad-tech disruption thesis
The collaboration between LG Electronics and Arbitrum sits at the intersection of two big trends in crypto and tech: enterprise-scale adoption of blockchain for operational efficiency, and the ongoing transformation of digital advertising through data transparency and automation. By offering a shared ledger of ad inventory and audience interactions, the envisioned network could in theory reduce duplication of data across platforms, lower reconciliation costs, and provide advertisers with clearer insight into reach and effectiveness.
On the efficiency front, the promise is straightforward: automate the core processes that currently require human oversight and multiple middlemen. In the traditional ad-tech stack, agencies, exchanges, networks, and data providers orchestrate ad placements and measurement, often resulting in opaque pathways and higher costs. A blockchain-backed approach could, in theory, give advertisers and publishers a single source of truth and faster settlement, while enabling more granular targeting and measurable outcomes.
However, the venture also hinges on practical considerations. Adoption by marketers and publishers, integration with existing demand-side platforms (DSPs) and supply-side platforms (SSPs), data privacy compliance, and the ability to scale across ecosystems are all critical factors. The Fortune report notes the initiative is in the evaluation stage, with a possible market introduction later in 2026, but concrete product details and governance models remain to be announced.
From an investor perspective, the immediate reaction is twofold. First, there is interest in the potential efficiency gains and transparency benefits that blockchain could deliver to an ad market long plagued by friction and opaque metrics. Second, there is caution about execution risk and the challenge of achieving broad industry-wide adoption, given the inertia of established ad-tech stacks and the regulatory environment governing data usage and online advertising.
LG’s crypto journey: lessons from a cautious, experimental approach
LG’s longer association with crypto and blockchain has been characterized by measured experimentation rather than a rapid pivot to consumer products. The 2018 Monachain project positioned LG CNS to showcase enterprise blockchain capabilities, including digital authentication and supply chain use cases. The Wallypto wallet, built on Hedera Hashgraph, served as a companion tool for the LG Art Lab NFT platform, which was designed to display digital artworks on LG televisions. The NFT platform was shuttered in June 2025, amid the broader NFT market retrenchment, and Wallypto was terminated in September of the same year.
These moves illustrate LG’s willingness to explore crypto-related technologies while maintaining a cautious portfolio approach. The current advertising network project with Arbitrum signals a shift toward applying blockchain to core business operations—advertising and marketing—where the potential for efficiency gains and new data paradigms could be significant if the project proves scalable and broadly adopted.
Industry observers will be watching how the LG-Arbitrum initiative addresses critical questions: What governance mechanisms and data-sharing rules will be used? How will user privacy and consent be handled? What performance benchmarks will define success for advertisers and publishers? And, perhaps most importantly, will a blockchain-enabled ad network achieve the level of transparency and automation needed to displace parts of the traditional ad-tech stack?
What comes next for blockchain-enabled advertising
As with any frontier technology in advertising, the path from concept to widespread adoption is likely to be incremental. The LG-Arbitrum project provides a concrete example of large corporate experimentation with blockchain to reimagine a principal revenue driver: digital advertising. While the exact rollout timeline remains uncertain, the partnership underscores a broader industry interest in leveraging distributed ledgers to streamline data flows, cut costs, and offer clearer metrics for advertisers and publishers alike.
Investors and industry participants should monitor how this initiative progresses alongside ongoing regulatory developments around data privacy, consumer consent, and platform interoperability. If the early signs hold—transparent inventory, automated market operation, and measurable efficiency gains—the collaboration could become a notable case study in how big-tech brands collaborate with specialized Layer-2 networks to reshape ad tech.
For readers, the next milestones to watch are concrete product milestones, governance models, and any pilot deployments with participating brands or publishers. As with many blockchain-at-scale experiments, real-world traction will determine whether this remains an exploratory project or becomes a reproducible blueprint for the future of digital advertising.
LG Electronics and Arbitrum declined to comment further beyond the statements already shared with Fortune and other outlets, and the industry will be awaiting more details as they become available.


The U.S. Securities and Exchange Commission proposed removing two key Regulation NMS rules, opening a new debate over tokenized U.S. stocks and DeFi trading.
Summary
- SEC proposed removing Rules 611 and 610(e), changing long-standing trade protections for U.S. equities markets.
- Analysts say the move could help DeFi market makers support tokenized U.S. stock trading.
- Tokenized equities still face registration, settlement, clearing, and investor-rights questions under U.S. securities rules.
The SEC said on June 11 that it proposed rescinding Rules 611 and 610(e) of Regulation National Market System. The rules have shaped U.S. equity trading since 2005.
Rule 611 blocks trade-throughs in national market system stocks. In simple terms, a trading venue cannot execute a stock trade at a worse price when a better protected quote is available on another venue.
Rule 610(e) deals with locked and crossed quotations. These rules require trading centers to avoid quotes that equal or cross the national best bid and offer in U.S. stocks.
The SEC said the proposal would also remove related definitions from Rule 600 and make other matching changes. The public comment period will stay open for 60 days after the proposal appears in the Federal Register.
SEC Chairman Atkins says rule change could cut costs
SEC Chairman Paul Atkins said the plan aims to simplify equity market structure after two decades of Rule 611. He said the rule may have created problems that limited market growth.
“After two decades of Rule 611, it is high time that the Commission review its unintended consequences that have hindered — rather than enhanced — the long-term growth of our markets,” said SEC Chairman Paul S. Atkins.
“This proposal is intended to simplify market structure and reduce costs for market participants while allowing competition, innovation, and other market forces to shape the continuing evolution of our equity markets,” Atkins added.
The proposal does not approve tokenized stock trading by itself. It starts a rulemaking process and gives market participants a chance to comment before the agency decides whether to finalize the rescission.
Analysts point to tokenized stocks
Galaxy Digital’s Alex Thorn said the proposal could remove a major barrier for tokenized U.S. equities in DeFi. He argued that automated market makers cannot easily follow Rule 611 because they execute trades through liquidity pools and bonding curves.
“An AMM cannot comply with 611 by construction. It executes against a bonding curve at whatever the pool price is, with slippage, at block-time granularity,” Thorn wrote.
The issue is that DeFi pools cannot check every stock exchange quote in real time before each swap. They also cannot route orders across markets in the same way as traditional trading systems.
Thorn also said Rule 610(e) creates similar issues. AMM prices move with trading flow, which means tokenized equity pools could often lock or cross displayed quotes in the traditional market.
Tokenized equities still face other rules
If the SEC removes the rules, analysts say broker-level best execution duties may play a larger role. FINRA Rule 5310 requires brokers to seek the best available terms for customer orders.
That framework may fit tokenized markets better than trade-by-trade price protection rules. Still, tokenized stocks face other hurdles, including exchange registration, ATS rules, clearing, settlement, and investor rights.
As previously reported, the SEC has been studying an innovation exemption that could allow tokenized public stocks to trade on blockchain platforms. The plan may require tokenized shares to carry the same rights as normal shares, including dividends and voting rights.
Moreover, as reported by crypto.news, Commissioner Hester Peirce has also said any exemption may stay limited in scope. She said it would likely apply to digital versions of existing public equities, not synthetic stock tokens without shareholder rights.
The SEC proposal adds a new step to that wider policy shift. It could reduce one market structure barrier, but the final rules will depend on the comment process and further agency action.


Michael Saylor addressed Strategy’s sale of 32 BTC on stage at BTC Prague on Thursday. He told the audience the transaction does not change the company’s long-term Bitcoin (BTC) thesis.
The executive chairman faced questions because he has urged investors for years to never sell their bitcoin. A small treasury transaction turned that slogan against him this week.
Why Strategy Sold 32 BTC for the First Time Since 2022
Strategy sold 32 BTC between May 26 and May 31 for roughly $2.5 million. That works out to an average of $77,135 per coin, slightly above its $75,699 cost basis.
A June 1 filing with the SEC disclosed the transaction. MSTR shares fell about 6% afterward, and the company’s first bitcoin sale since December 2022 dominated the conversation. The disclosure even triggered a $15 million dispute on Polymarket over contract settlement.
The proceeds will fund distributions on Strategy’s preferred stock. The board declared June 30 cash dividends across all five preferred series, a recurring obligation tied to the firm’s capital structure.
The sale covered about 0.004% of Strategy’s 843,706 BTC, a stack worth roughly $62 billion. Still, the company had already slowed accumulation. It paused buying before earnings in the spring and recently skipped its weekly purchase altogether.
Saylor Speaks Out on His Never Sell Bitcoin Advice
Speaking in Prague on June 11, Saylor confronted the apparent contradiction head-on.
“I said to you never sell your bitcoin.”
Saylor said at BTC Prague, in a video shared by Alex Bragin.
Here is the answer on stage of @BTCPrague why Michael @saylor sold 32 BTC pic.twitter.com/5vGM0P9Rwh
— Alex Bragin (@BraginRights) June 11, 2026
He explained that the advice targeted individual investors, while the corporate sale served a specific financial obligation. In his framing, the company practiced normal treasury management rather than an exit from bitcoin.
He also brushed off the online trolls mocking the sale. In his view, it would be dumb for a company to rule out selling regardless of its obligations.
He stressed that liquidity needs drove the decision, not a bearish view on bitcoin’s future. The sale’s size supports that reading, since $2.5 million barely registers against a $62 billion position.
Saylor once urged followers to sell a kidney before parting with their bitcoin. Those earlier absolutist posts sharpened criticism once the filing appeared.
Skeptics remain unconvinced. Some analysts argue the episode adds to mounting pressure on MSTR as the stock trades below recent highs. Meanwhile, bitcoin traded near $63,400 on Friday, up 1.4% over 24 hours.
The next test arrives on June 30, when the preferred dividends fall due. Investors will watch whether Strategy funds future distributions from new capital or reaches into its bitcoin reserve again.
The post ‘I Said to YOU Never Sell Your Bitcoin’: Saylor Speaks Out on 32 BTC Sale appeared first on BeInCrypto.
The Avalanche Treasury Company saw a rocky start as it debuted on Nasdaq under the ticker AVAT on Thursday, with shares dropping 16% by the end of the day.
The new company gained access to the Nasdaq after merging with special-purpose acquisition company (SPAC) Mountain Lake Acquisition in a $675 million deal first announced in October.
The company, with support from institutional backers including Dragonfly, Pantera, ParaFi Capital, VanEck, Galaxy Digital and Kraken, aims to give investors exposure to the Avalanche blockchain ecosystem without holding the cryptocurrency.
Bart Smith, Avalanche Treasury CEO and former Susquehanna executive, said Thursday that it wasn’t a bet on price, but an investment that “represents meaningful potential for the repositioning of institutional finance.”
Avalanche launched in 2020 with proof-of-stake consensus, high throughput and a multi-chain architecture. Today, more than 550 projects are building in the ecosystem, with more than $1 billion in institutional funds deployed and more than $1.65 billion in real-world assets tokenized on the network.
Tough first day trading for AVAT
AVAT shares fell 16% from their open at $2.20, ending the day at $1.85, according to Google Finance. This has been a typical pattern for crypto company initial public offerings, especially in a bear market.
Related: SpaceX IPO nears 4 times oversubscribed, squeezing crypto and tech
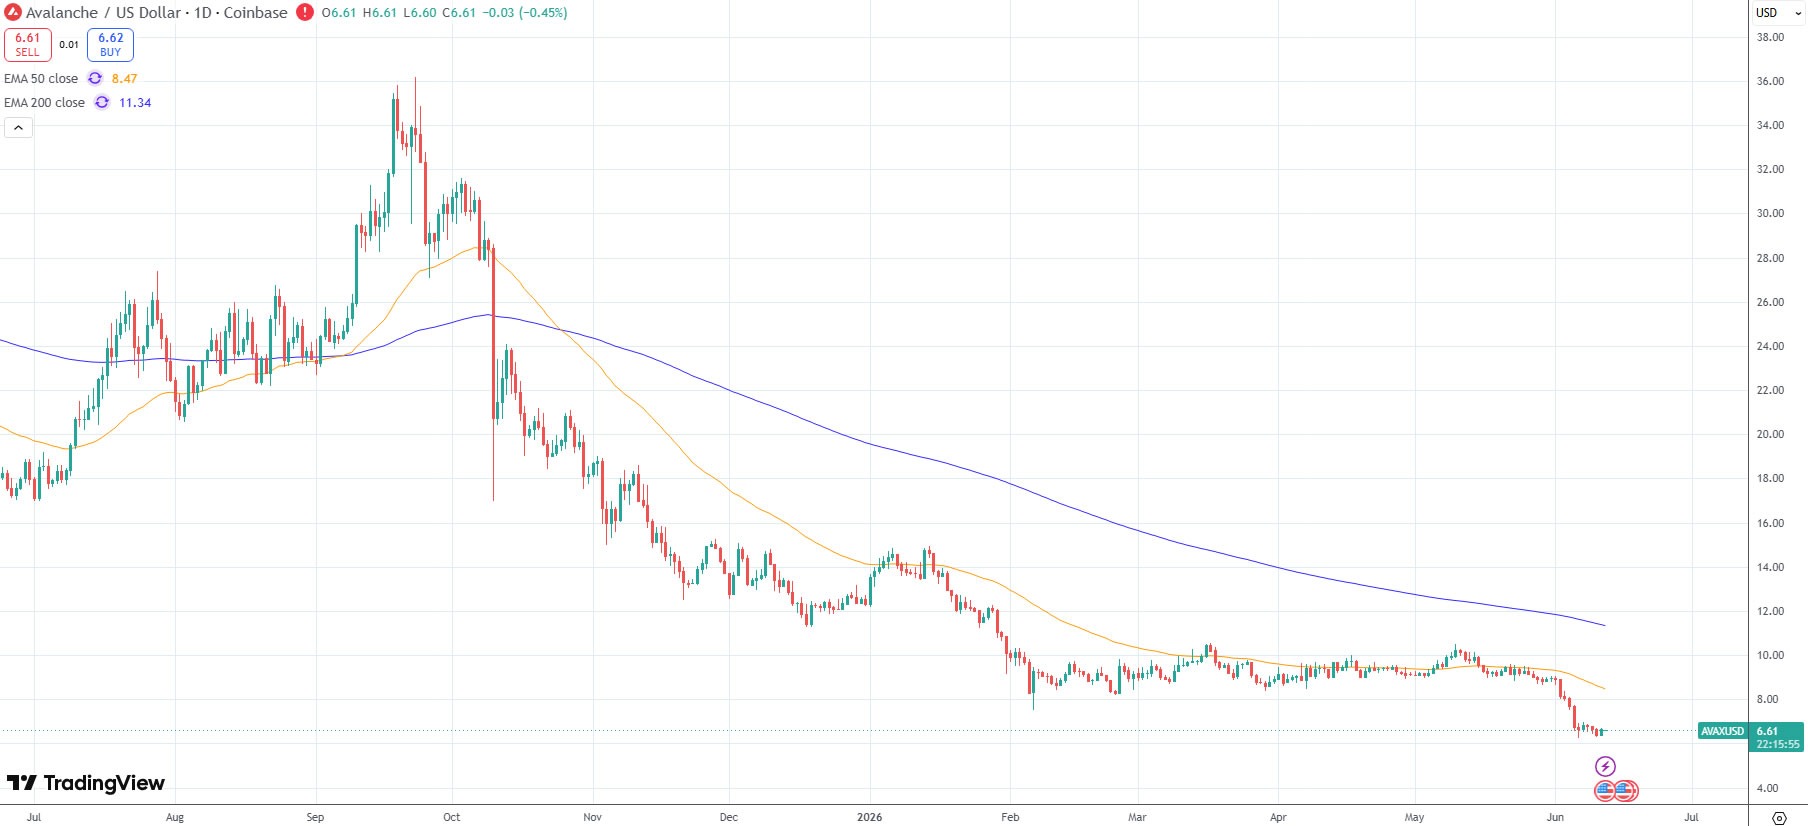
AVAX saw a small 3.4% gain on the day, but the asset has lost 33% over the past 30 days and remains down 95% from its November 2021 all-time high. It is currently trading at its lowest level since early 2021, at $6.61, according to TradingView.

Altcoins have been crushed in 2026, and AVAX is at a five-year low. Source: TradingView
DATs are having a rough ride
Avalanche is the latest crypto ecosystem to launch a publicly listed company, but it comes amid a difficult time for crypto treasury firms.
The weekly net flow of BTC into digital asset treasuries has declined to around $266 million this week, following weekly highs of over $2 billion in April and May, according to Coinglass.
The world’s largest BTC treasury, Strategy, has seen its stock value tumble 69% over the past 12 months as the Bitcoin bear market deepens.
Bitmine Immersion Technologies pivoted from BTC mining to an Ethereum treasury in mid-2025. Its shares (BMNR) saw explosive growth, reaching an all-time high of $135 in July that year, but have since tanked by 88% to $16.50 a year later.
SOL Strategies Inc., a Solana-focused DAT, began trading in September 2025 under STKE, but share prices have also collapsed by 92% over the past 12 months.
Magazine: Does ‘Paper Bitcoin’ mean there’s an unlimited supply of BTC?

Australian shares rally as traders bet on peace deal

SpaceX’s crypto-traded IPO was sharply falling. It now points upward to a $2.4 trillion valuation

Belarussian Visa Row Threatened Scotlands World Cup Hopes


-

 Fashion7 days ago
Weekend Open Thread: Evereve – Corporette.com
-
 Entertainment5 days ago
The Best Mystery Series of All Time Is Surging on Streaming 30 Years After It Ended
-
 Crypto World7 days ago
Jensen Huang Approves Samsung, SK Hynix, and Micron for NVIDIA (NVDA) HBM4 Memory Supply
-

 NewsBeat4 days ago
Alexander Zverev wins the French Open to finally earn a 1st Grand Slam title
-

 Crypto World4 days ago
Anatomy of the June crypto crash: Fed, Iran, Saylor
-

 Tech6 days ago
Suspicious Polyfill login prompts pop up on Toshiba, Muji websites
-
 Crypto World5 days ago
Senator Cynthia Lummis Calls CLARITY Act the Most Consequential Financial Legislation of This Generation
-
 Tech7 days ago
Microsoft launches MXC, an OS-level sandbox for AI agents, with OpenAI and Nvidia already on board
-
 Tech5 days ago
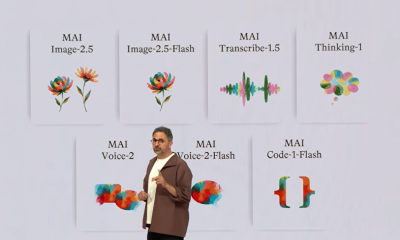
Microsoft unveils seven homegrown AI models in new bid for ‘long term self-sufficiency’
-

 Business7 days ago
(VIDEO) Justin Bieber Delivers Surprise Happy Birthday Serenade to Diners at Los Angeles Mexican Restaurant
-
 NewsBeat5 days ago
Alexander Zverev conquers demons and outlasts Flavio Cobolli to win French Open for first major title
-

 Tech6 days ago
Von der Leyen’s AI envoy pick draws conflict-of-interest fire
-

 Business4 days ago
High Stakes for Wembanyama as New York Pushes for 3-0 Lead
-
 Business5 days ago
The Pain Points Taking a Fragile Tech Rally Down a Notch
-

 Tech6 days ago
Hackers now exploit SolarWinds Serv-U flaw to crash servers
-

 Tech7 days ago
Meta steals a tactic from Tesla and builds data centers in tents
-
 Crypto World4 days ago
Eli Lilly (LLY) Stock Surges 4% Following Breakthrough Sleep Apnea Trial Results
-
Crypto World7 days ago
LBank Surpasses 25 Million Users Worldwide as AFA Partnership Continues to Drive Global Growth
-

 Tech4 days ago
Notion restores access to Anthropic after service disruption
-

 Crypto World5 days ago
Trump’s AI Ownership Plan Could Benefit Anthropic at OpenAI’s Expense
You must be logged in to post a comment Login