

Crypto World
Overbought vs Oversold Stocks Explained

An overbought stock has risen sharply and may sit above its underlying value, while an oversold stock has fallen sharply and may sit below it. In technical analysis, these conditions are used to identify markets that may be approaching a pause, slowdown, or potential price reversal.
The oversold stock meaning refers to a market condition where selling pressure has pushed a stock’s price lower than its recent trading range or momentum may justify. Overbought conditions reflect the opposite scenario, where strong buying activity has driven prices rapidly higher.
To identify these market conditions, traders often use technical indicators such as the Relative Strength Index (RSI), Stochastic Oscillator, and MACD. This article explains what overbought and oversold stocks and stock CFDs are, how these indicators work, and the limitations traders should consider when interpreting their signals.
What Is an Oversold Stock?
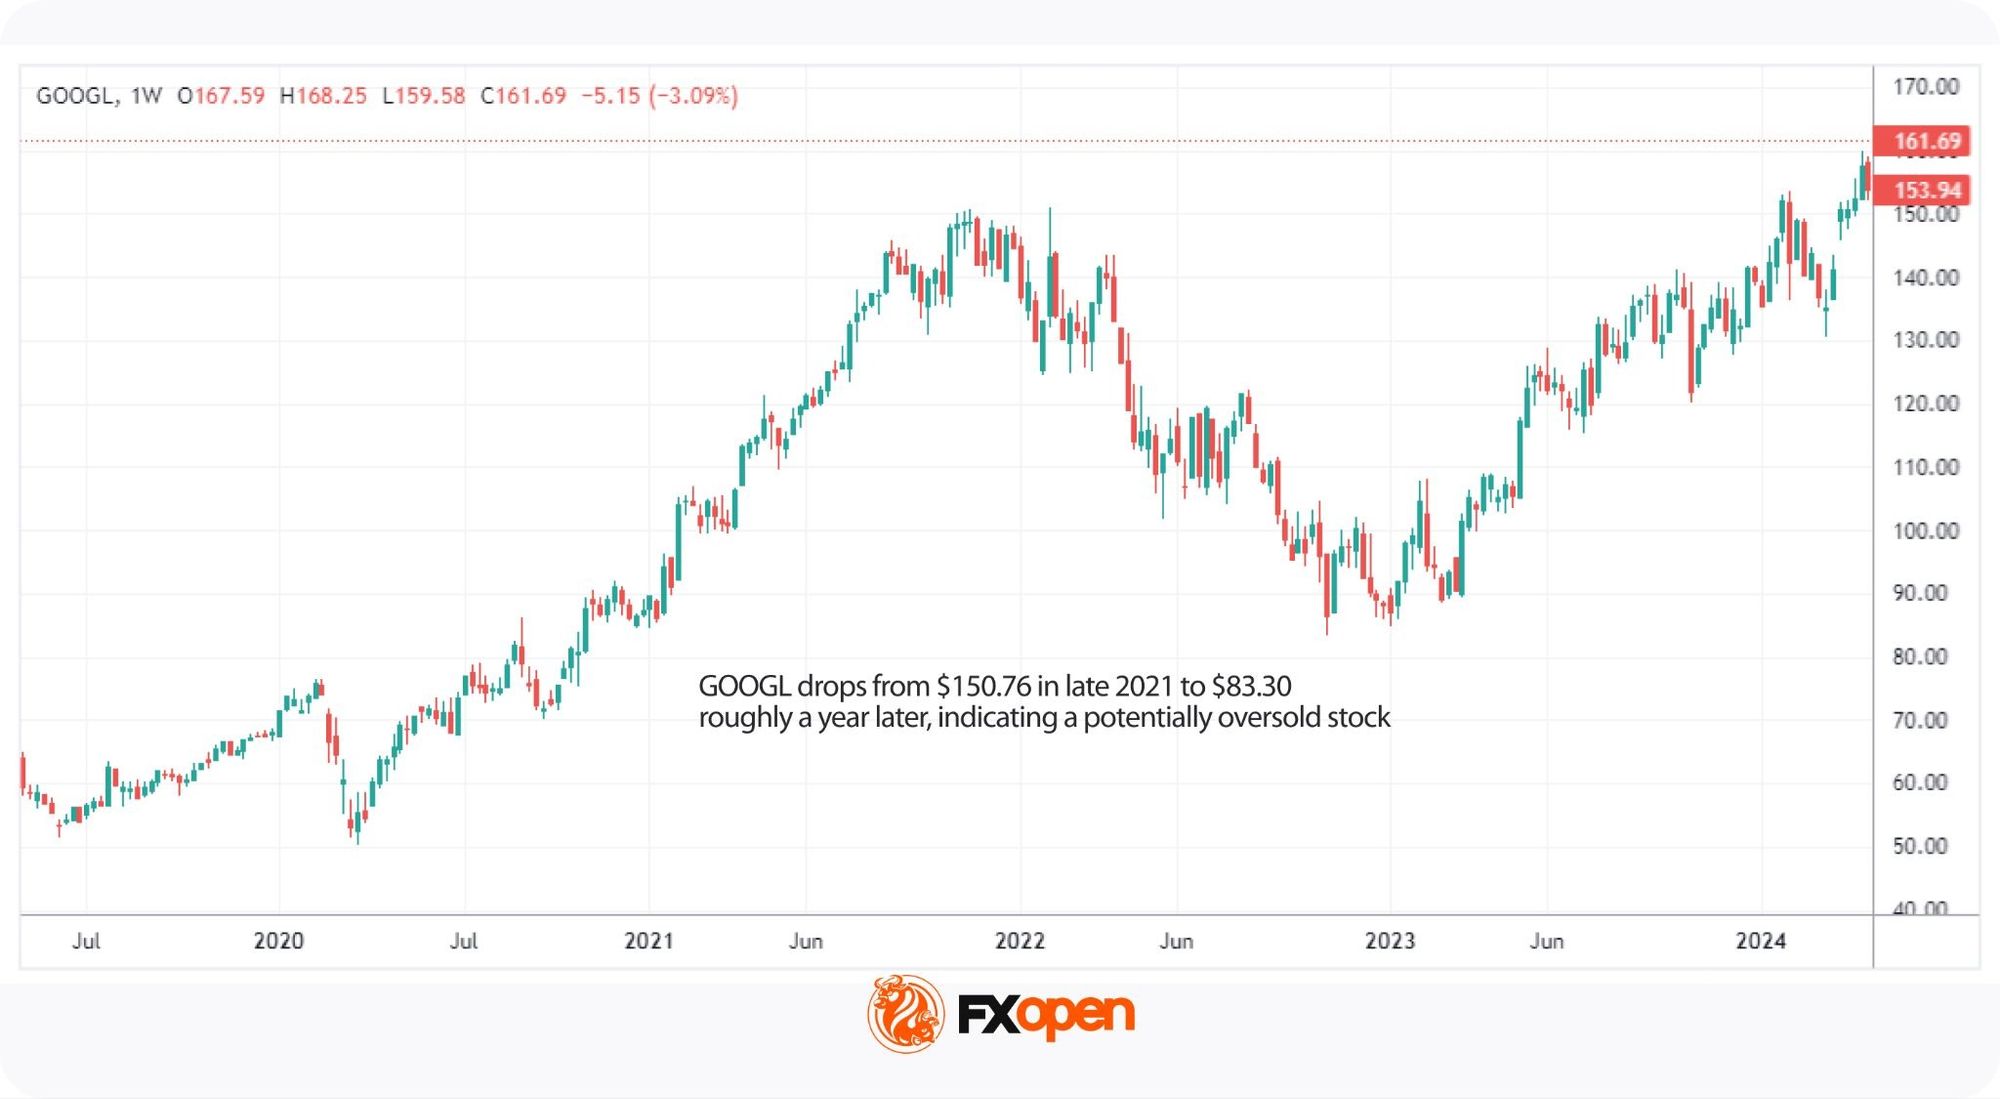
Oversold stocks are shares that have fallen sharply in price, often below what their fundamentals warrant. The condition typically reflects excessive selling pressure rather than a fair reassessment of value.
Several factors can lead to a stock becoming oversold. For instance, bad news about a company, such as a missed earnings report or legal troubles, can cause investors to sell off shares quickly. Broader market events, like economic downturns or changes in industry regulations, can also drive prices down across the board. Sometimes, even strong stocks get caught up in these waves of negativity.
A clear example is the March 2020 market sell-off, when widespread panic during the early stages of the pandemic pushed stocks down across nearly every sector. Many recovered within months as fundamentals held up.
Overselling reflects more than a falling price, though, because it also points to the potential for a reversal once selling pressure fades.
What Is an Overbought Stock?
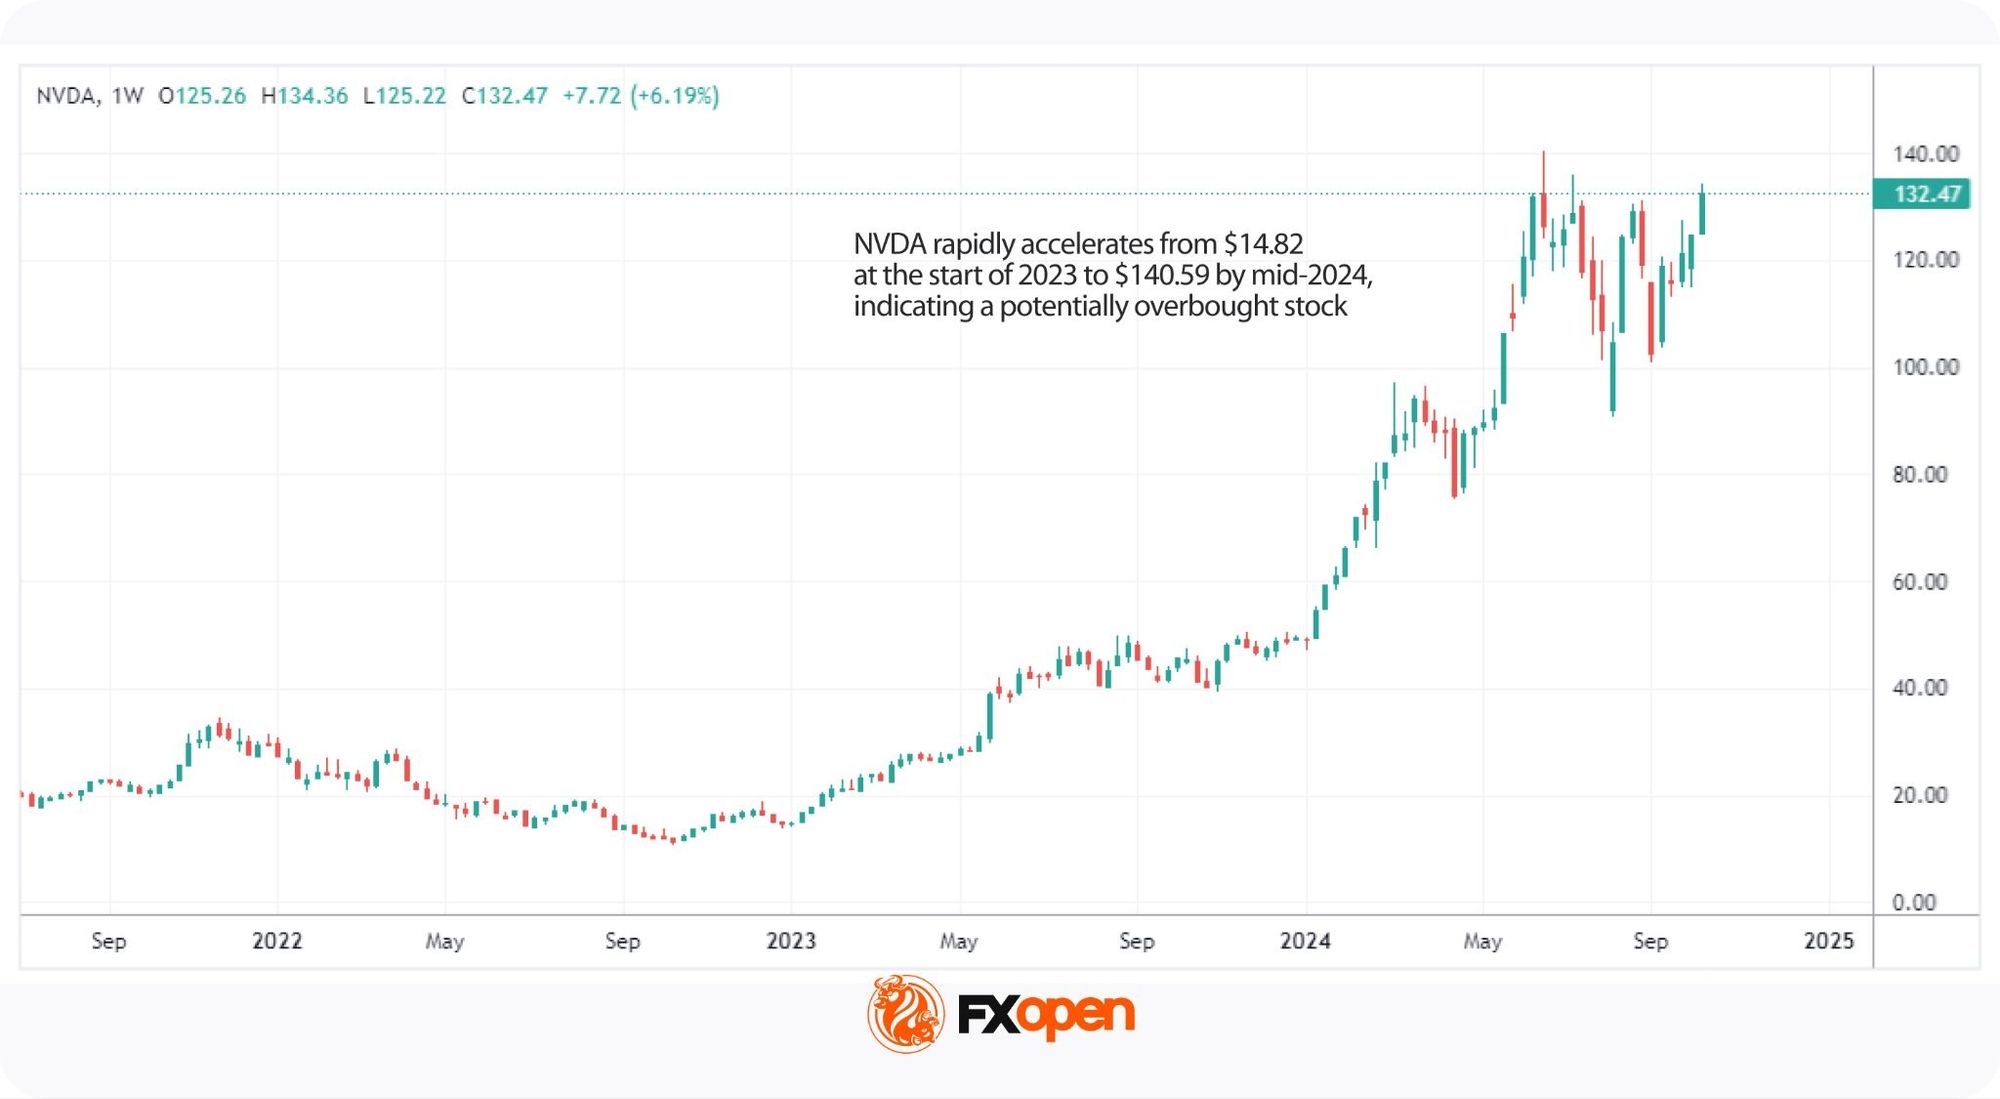
Overbought stocks are shares that have risen sharply in price, often above what their fundamentals warrant. The overbought condition typically reflects strong buying activity rather than a fair reassessment of value.
Several factors can lead to an overbought market. Sometimes, positive news about a company—such as strong earnings, new product launches, or positive analyst reports—can spark a wave of buying. Market-wide optimism, particularly during bullish phases, can also lead to an overbought stock market. Speculative buying, where traders hope to capitalise on short-term price movements, can further inflate the price.
A notable example is the AI-driven rally in mega-cap technology stocks during 2024, when names like Nvidia spent extended periods in overbought territory as enthusiasm around generative AI pushed valuations to record highs.
Being overbought does not guarantee an immediate correction, though it does signal that the price may have moved too high, too quickly.
Overbought vs Oversold: Key Differences
The overbought vs oversold distinction often hinges on sentiment as much as fundamentals. The distinction matters because each condition reflects opposite market behaviour. Overbought signals downside pressure ahead while oversold points to potential upside, so traders position differently for each.
The two conditions compare as follows:
Recognising the difference between overbought stocks and oversold stocks may help traders align analysis with prevailing conditions, though neither signal guarantees a reversal and confirmation from other tools still matters.
Indicators for Oversold and Overbought Stocks
Traders use overbought and oversold indicators to assess whether a stock has moved too far in one direction. Most of these tools are momentum oscillators that measure the speed and magnitude of price changes.
The three most common are:
- Relative Strength Index (RSI)
- Stochastic Oscillator
- MACD (Moving Average Convergence Divergence)
Each oscillator works in a different way, but they share a common purpose: flagging when price action looks stretched relative to recent history. When a stock has moved too far from its typical range, the reading may signal a possible reversal, helping traders identify potential entry or exit points.
Now, let’s break down some of the most popular momentum indicators in trading used for this purpose. To see how they work for yourself, consider following along in FXOpen’s TickTrader trading platform to access a world of stock CFDs.
Relative Strength Index (RSI)
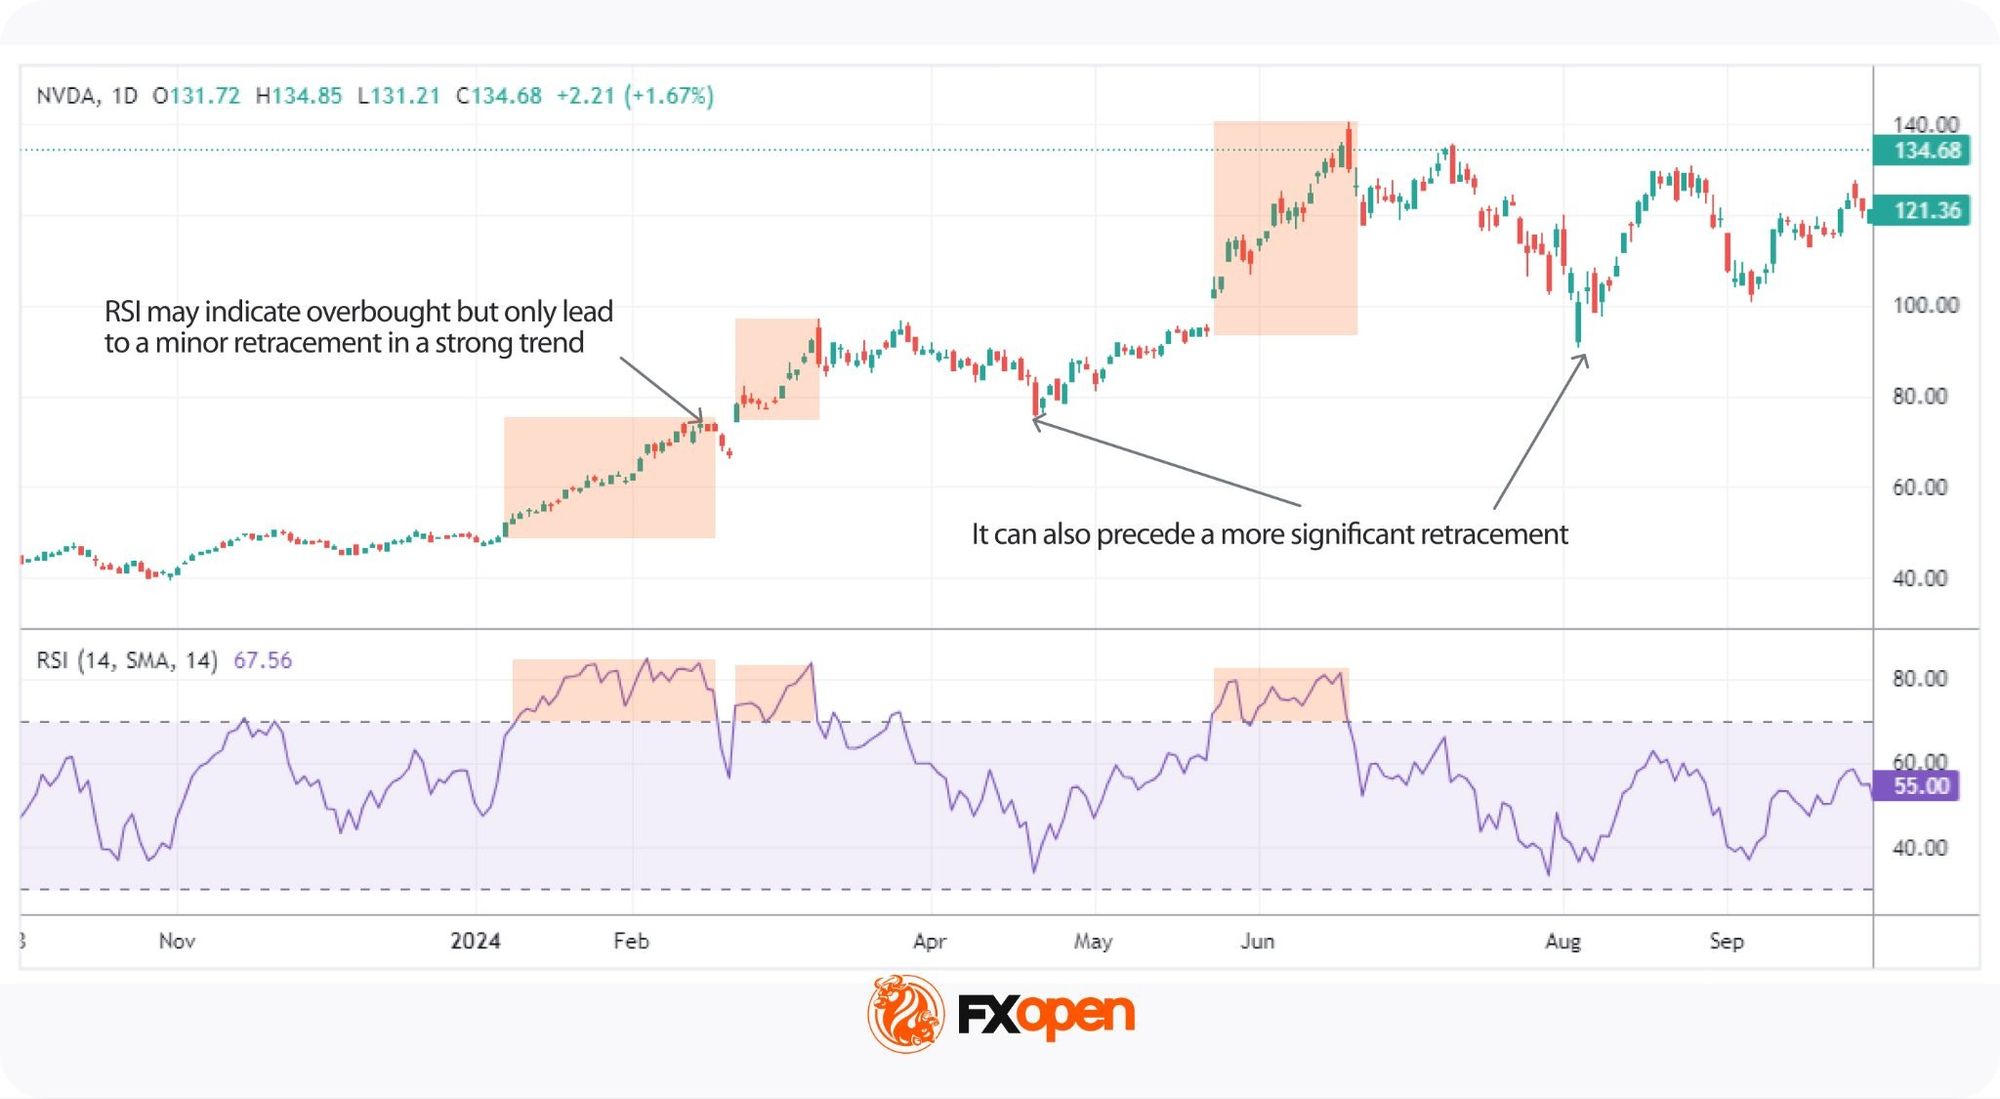
The Relative Strength Index (RSI) is a momentum oscillator that measures the speed and magnitude of recent price changes by comparing the average size of recent gains to recent losses over a set period. The standard look-back is 14 periods, with readings on a scale of 0 to 100.
The RSI oversold level is seen as below 30 and indicates the stock may be undervalued and due for a bounce. Meanwhile, the RSI overbought level sits at 70 and above, which often precedes a pullback.
For example, when a stock falls 12% over two weeks and its RSI drops to 25, traders watching for reversals would mark this as a potential setup. The same logic applies in reverse when RSI spikes above 70 after a strong rally.
Context still matters, though. In a strong bull market, a stock may stay overbought for weeks, and during a downturn, stocks can remain oversold longer than many traders expect.
Stochastic Oscillator
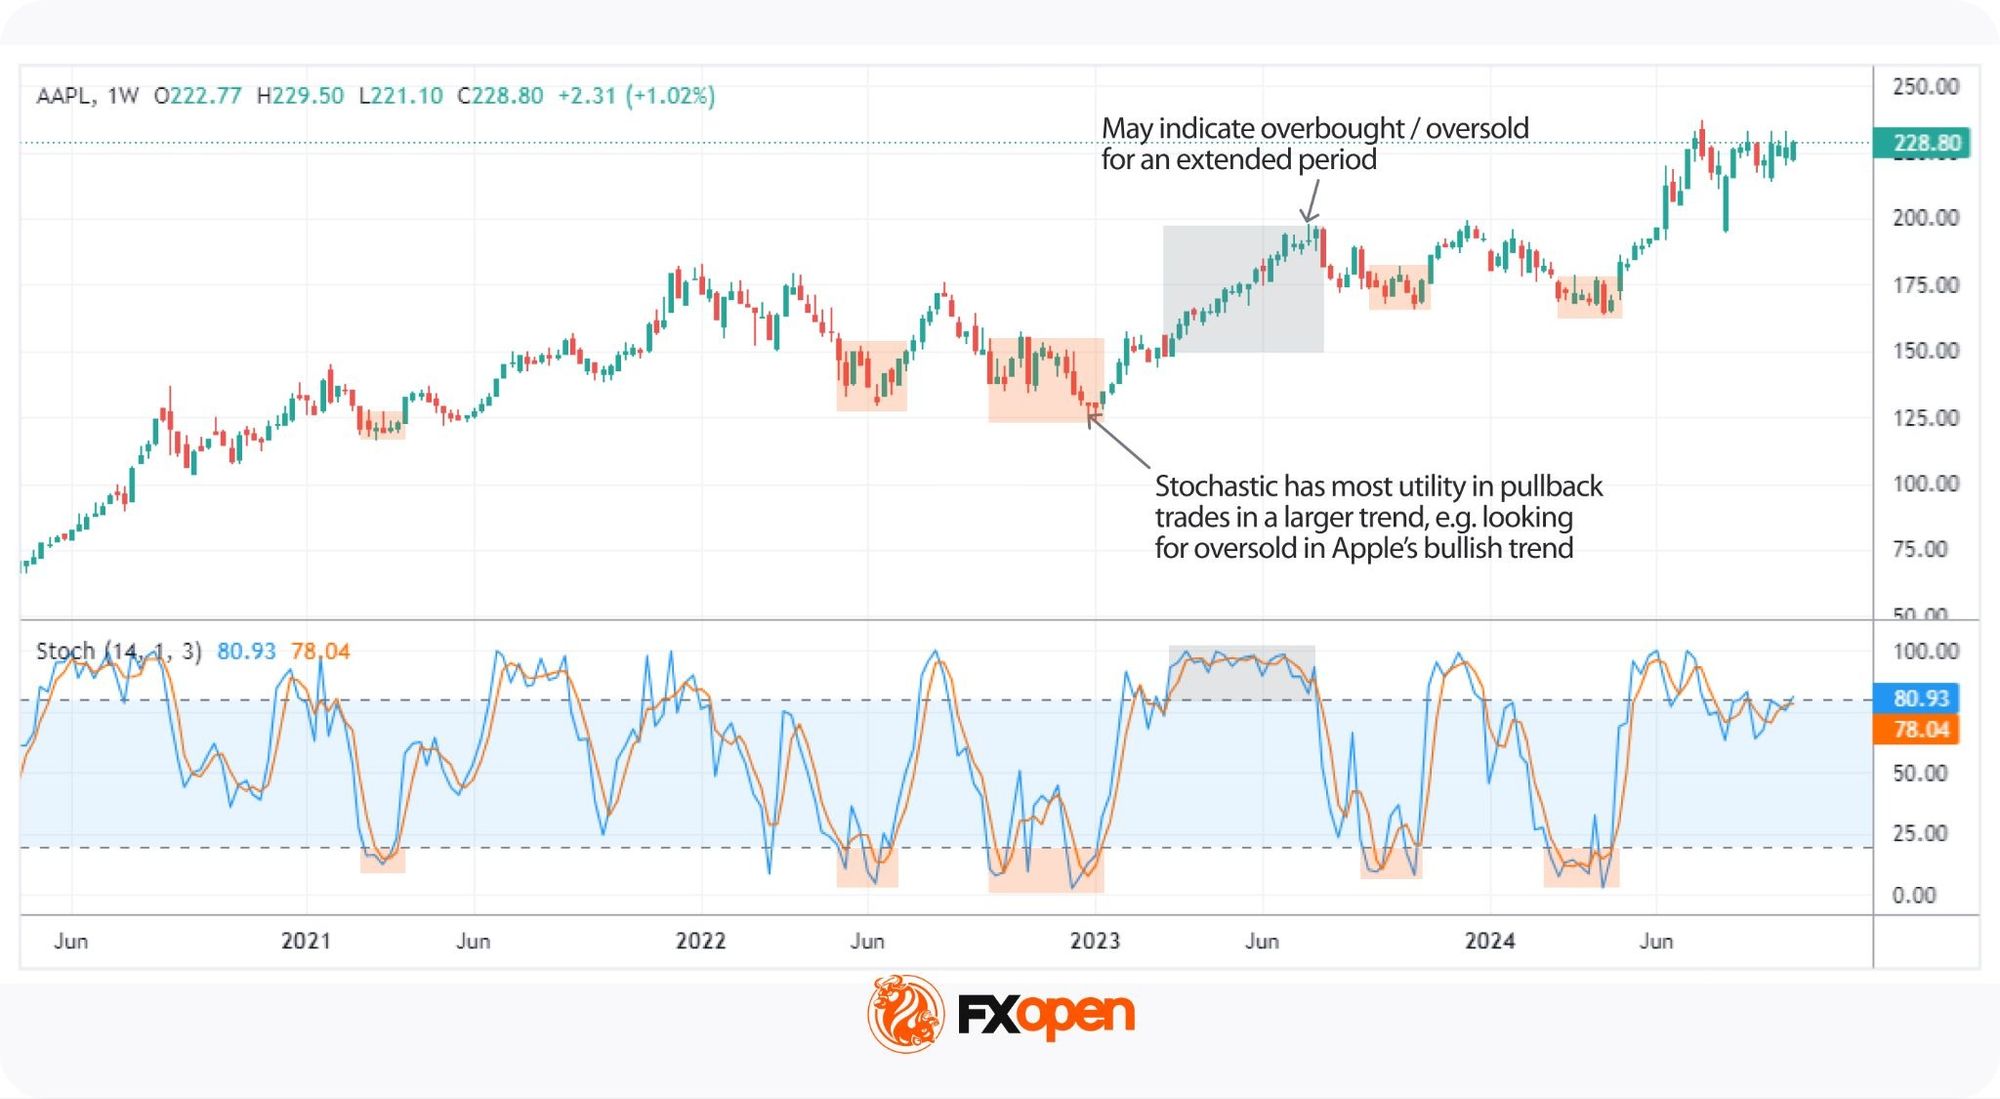
The Stochastic Oscillator is a momentum indicator that compares a stock’s closing price to its price range over a defined period.
The main difference from RSI is sensitivity, because the Stochastic focuses on closing price relative to recent range, which makes it react faster to shorter-term reversals.
The Stochastic plots two lines: %K reflects the current closing position within the recent range, and %D smooths %K with a short moving average. A reading above 80 marks an overbought zone, while a reading below 20 marks a Stochastic Oscillator oversold zone.
For instance, when a stock closes near its weekly high every day for two weeks, %K typically pushes above 80, and given its sensitivity, the Stochastic can stay extended for long periods during strong trends. This makes it more prone to false signals than the RSI or MACD indicator and typically more useful for trading pullbacks in a broader trend.
MACD (Moving Average Convergence Divergence)
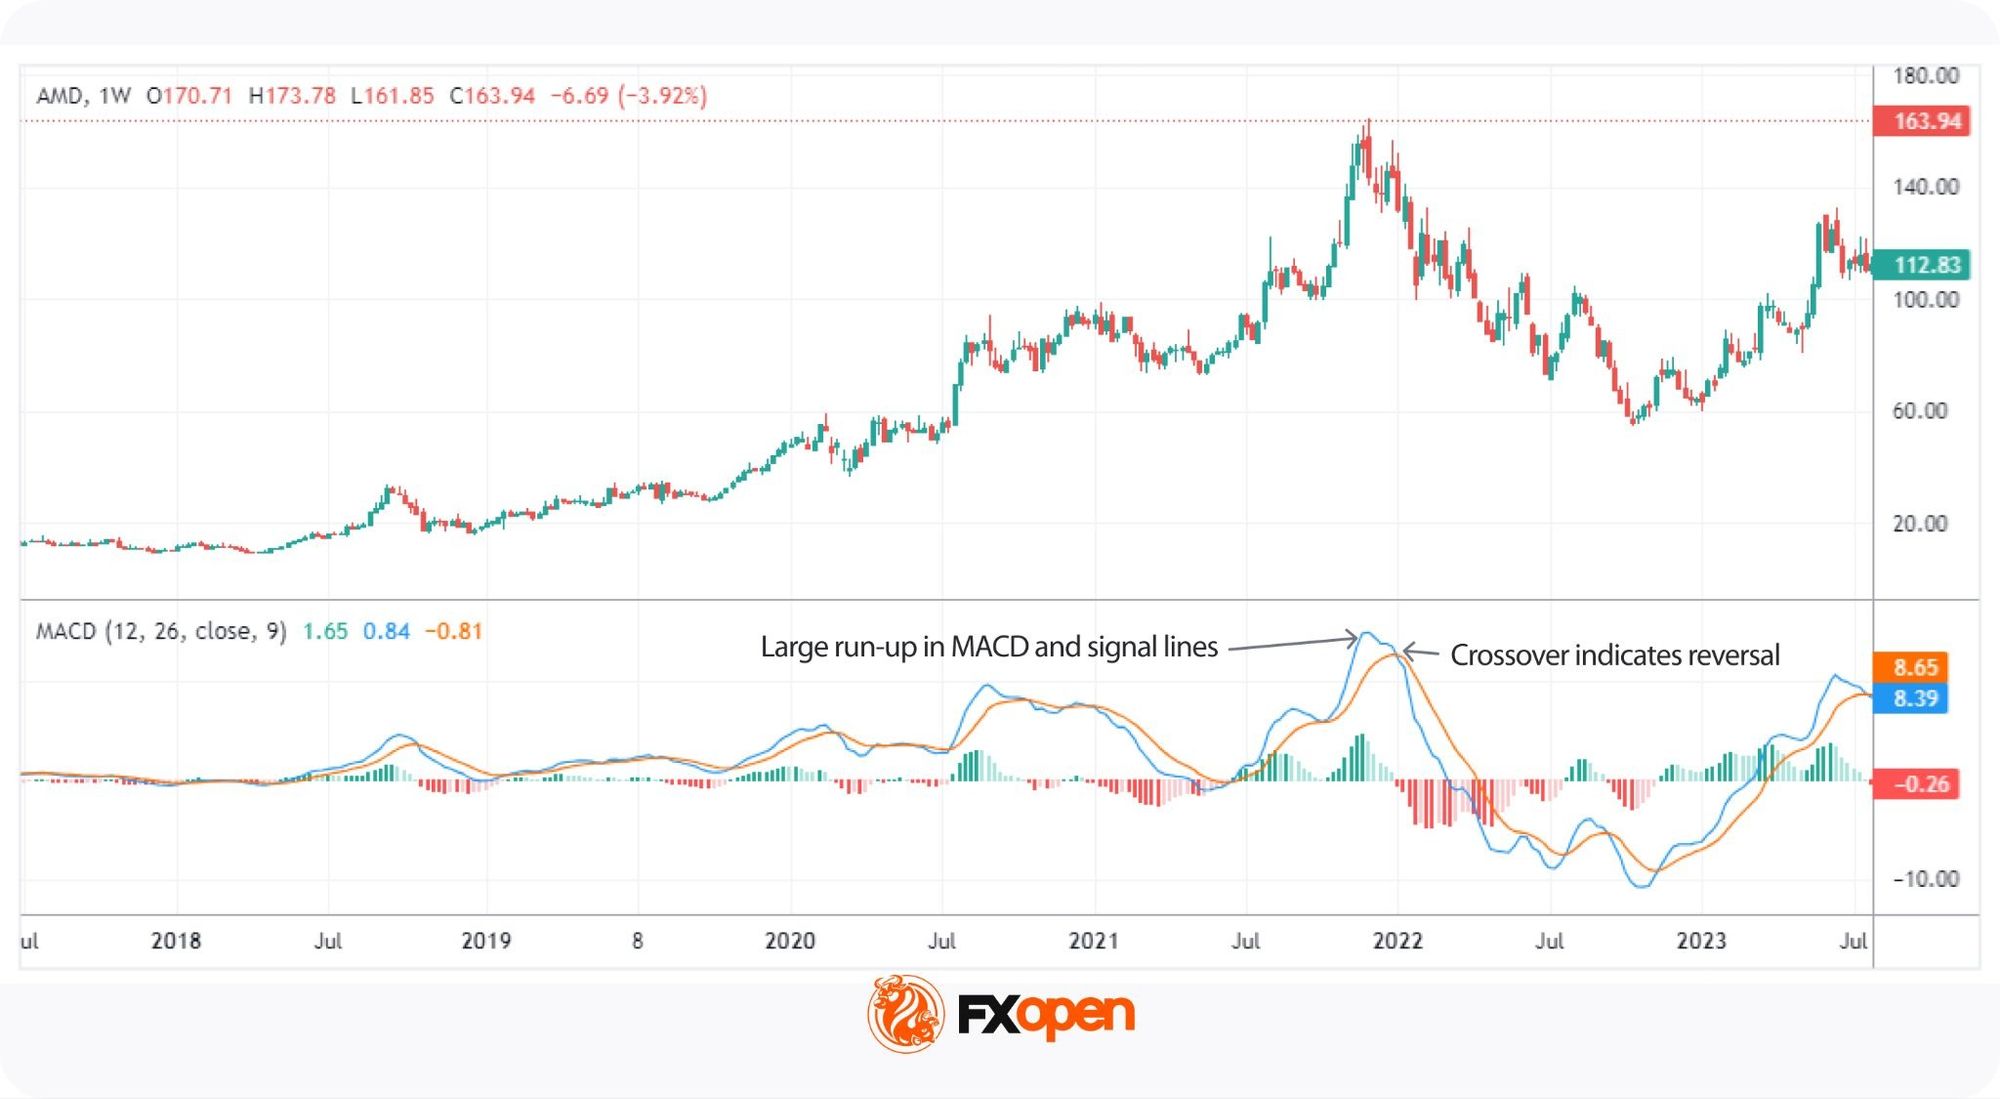
The Moving Average Convergence Divergence (MACD) is a trend-following momentum indicator that compares two moving averages of a stock’s price. Unlike RSI or Stochastic, MACD is not a pure overbought or oversold indicator, since it highlights momentum shift and trend direction instead.
The MACD line tracks the gap between two exponential moving averages, typically the 12-period and 26-period, while a 9-period moving average of the MACD line forms the signal line. When the MACD line crosses above the signal line, it points to a potential bullish reversal, and a cross below points to a bearish reversal.
Traders can still gauge stretched conditions through MACD momentum signals, because when both lines sit far from the 0 midpoint and historical averages, the move may be overextended.
Limitations of Overbought and Oversold Signals
Momentum indicators help traders spot overextended conditions, but they carry limitations. A reading at an extreme tells you the move has been strong, though it does not tell you the move is finished. Traders who treat overbought and oversold levels as automatic triggers tend to fail.
The main limitations include:
- A low oscillator reading does not guarantee a price reversal
- Strong trends can keep readings extended for far longer than expected
- Different timeframes produce different signals on the same stock
- Single indicators offer no confirmation, raising the risk of poor entries
False signals in stocks are the most common pitfall. Two practical filters reduce this risk: divergence analysis and multi-timeframe confirmation.
Divergences
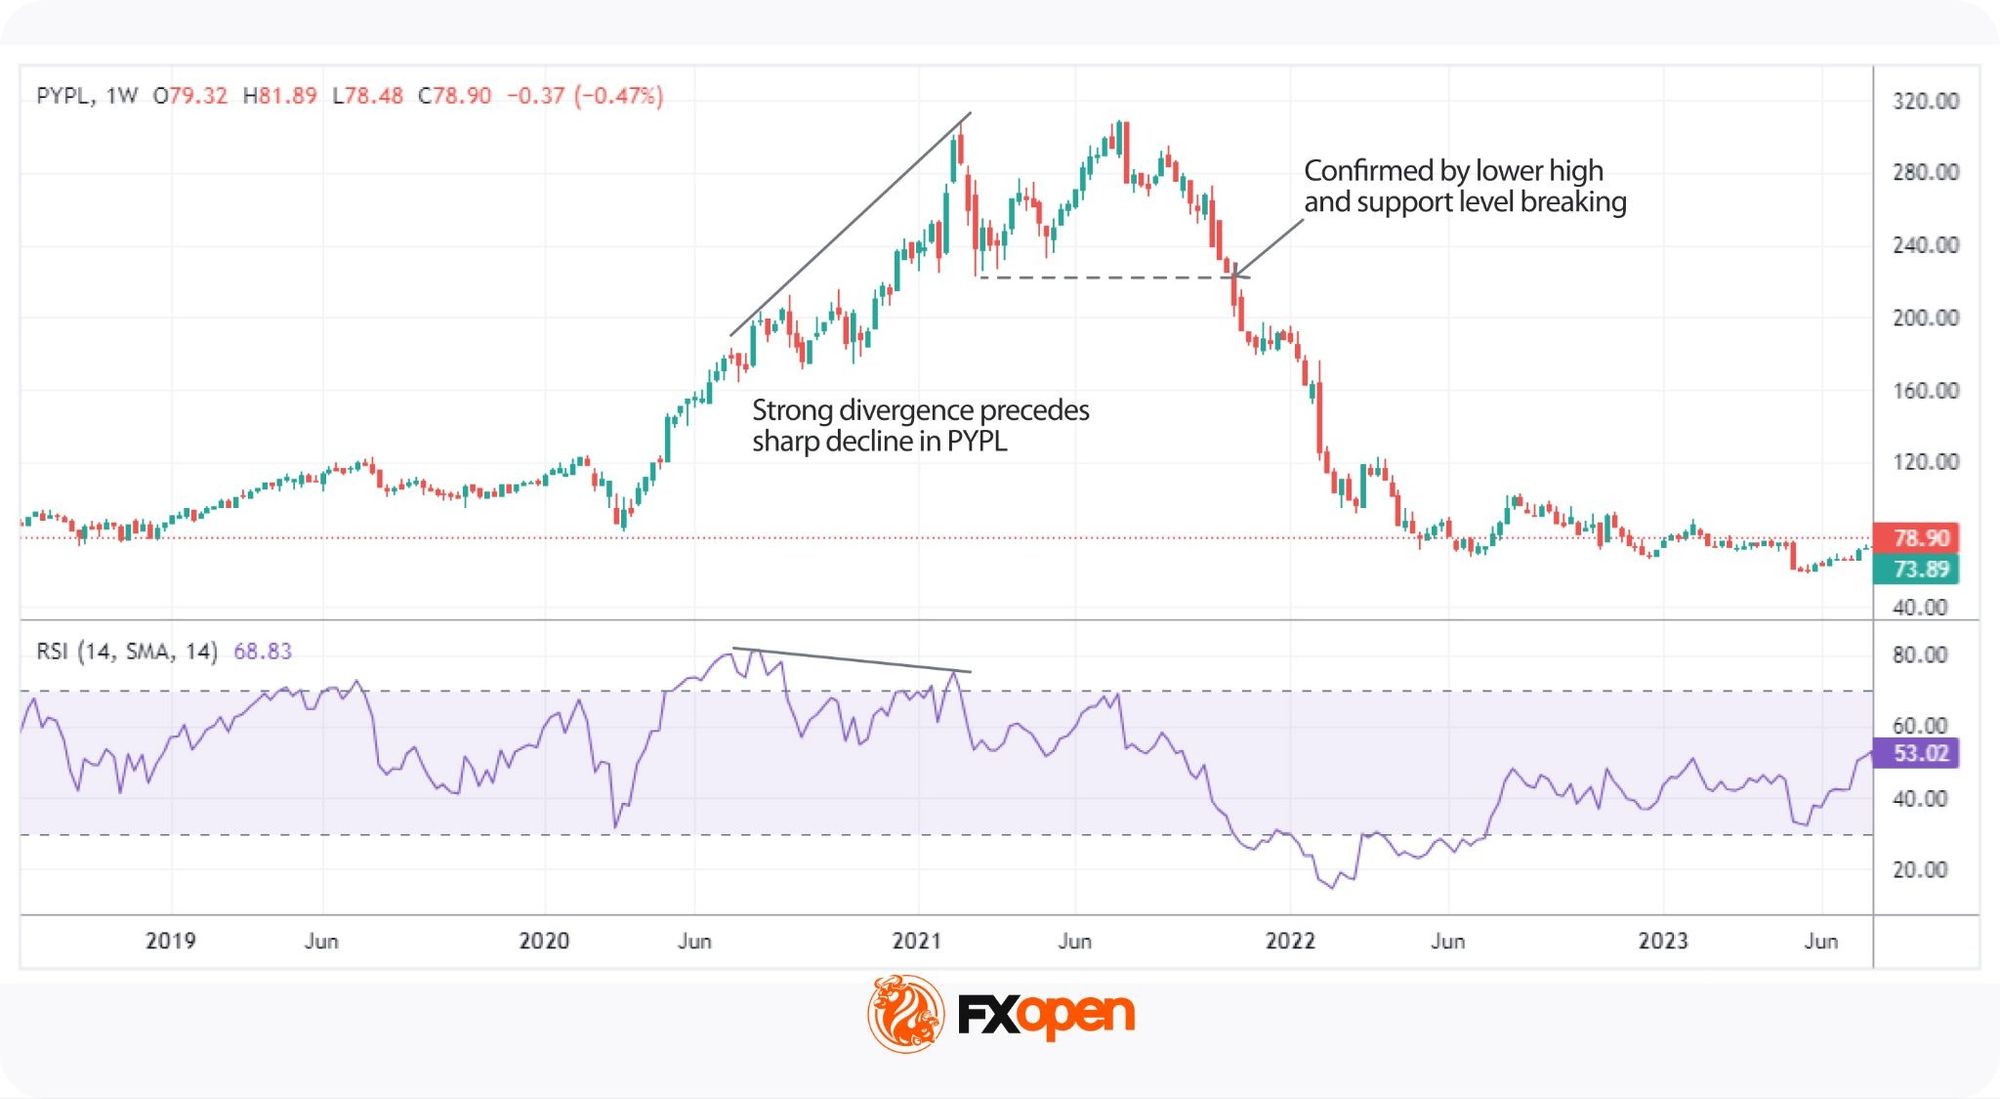
Divergence describes a price move that runs against its indicator, such as a stock pushing to a new high while RSI prints a lower high, which signals weakening momentum and a possible turn. Traders typically use divergence as a confirmation tool rather than a standalone trigger, because pairing it with a price action signal reduces the risk of acting on a false reading.
Timeframes
Timeframe selection shapes how overbought and oversold signals appear on a chart, because daily and weekly views can disagree on the same stock, with the daily flashing oversold while the weekly remains neutral. Traders match the timeframe to their strategy, whether short-term or long-term.
Many traders apply a top-down approach, confirming the higher timeframe direction first before refining entries on lower timeframes. This multi-timeframe check may support market analysis when readings conflict.
Risks of Trading Oversold and Overbought Stocks
Trading overbought and oversold stocks carries risks beyond standard market exposure, because the signals can flag setups that never play out, and the indicators can stay at extremes for far longer than traders expect. Robust risk management practice may potentially reduce exposure to each pitfall below.
- False signals: an oversold or overbought reading does not guarantee a reversal, because prices can keep rising or falling despite the indicator, and treating every extreme reading as a trade trigger leads to poor outcomes.
- Extended trends: during strong runs, stocks can stay extended for weeks, and acting too early often produces premature losses.
- Market sentiment: news events or macroeconomic shifts can overpower technical signals, with strong optimism or fear keeping a stock in overbought or oversold territory longer than expected.
- Lack of confirmation: relying on a single indicator carries higher risk, so many traders combine technical and fundamental analysis, or stack multiple stock technical analysis indicators, before acting on an extreme reading.
The Bottom Line
Understanding overbought and oversold stocks, along with the indicators used to identify them, can help traders spot trend changes. While these conditions may signal a reversal, it’s important to recognise there is no one best overbought and oversold indicator and use multiple tools for confirmation.
To put this knowledge into practice, you can consider opening an FXOpen account, which offers access to stock CFDs and advanced trading platforms.
FAQ
What Is Overbought and Oversold?
Overbought and oversold are terms used to describe extreme price movements in markets. A stock is considered overbought when its price has risen rapidly and above its underlying value, which potentially makes it overvalued. It’s oversold when the price has fallen sharply and below its underlying value, which makes it undervalued. These conditions can signal that a price reversal may be coming, though they don’t guarantee it.
What Is an Overbought Stock?
The overbought stock meaning refers to a stock that has increased quickly and is potentially trading higher than its actual value. This often occurs due to strong demand or market optimism. Overbought conditions might signal that the price is at risk of a pullback.
What Is an Oversold Stock?
The oversold stock meaning refers to a stock that has dropped significantly and may be below its true value. This often happens when there’s been excessive selling, and it could suggest that its price is due for a rebound.
How Can You Find Oversold Stocks?
Traders often use technical indicators like the Relative Strength Index (RSI) to find the most oversold stocks. An RSI reading below 30 typically suggests that a stock is oversold and may present a buying opportunity. Other indicators, like the Stochastic Oscillator, are also commonly used to identify oversold conditions.
What Is the Difference Between Overbought and Oversold?
The difference between overbought and oversold lies in direction. An overbought stock has risen too far and may face downward pressure, while an oversold stock has fallen too far and may rebound. Both flag possible reversals.
Which Indicators Identify Oversold Stocks?
Common indicators include the Relative Strength Index, Stochastic Oscillator, and MACD, with an RSI reading below 30 or a Stochastic below 20 typically pointing to oversold conditions. Traders often combine indicators for confirmation.
Can a Stock Stay Overbought or Oversold?
Yes, a stock can stay overbought or oversold for weeks during strong trends. In such a case, indicator readings may sit at extreme levels for long. Traders use confirmation tools to avoid premature entries.
This article represents the opinion of the Companies operating under the FXOpen brand only. It is not to be construed as an offer, solicitation, or recommendation with respect to products and services provided by the Companies operating under the FXOpen brand, nor is it to be considered financial advice.


BlackRock is close to launching a bitcoin fund that pays an income.
The world’s largest asset manager filed its fourth amendment for the iShares Bitcoin Premium Income ETF on Tuesday, according to its SEC filing. The fund will trade on Nasdaq under the ticker BITA.
The income comes from options. The fund holds bitcoin and shares of IBIT, BlackRock’s $47 billion spot bitcoin ETF. Each month it sells call options on those IBIT shares.
A call option gives the buyer the right to purchase the shares at a set price. The fund collects a fee, called a premium, for selling that right. That premium is the income it hands to investors.
As such, selling calls caps how much the fund gains if bitcoin rallies hard. Investors take steady income in exchange for giving up part of a big move. The fund plans to write calls on 25% to 35% of its value at a time.
The fee is the edge, however. BlackRock set the sponsor’s fee at 0.65%, which sits below the two largest covered-call bitcoin funds, YBTC and BTCI, which charge 0.95% and 0.99%, Bloomberg analyst Eric Balchunas said in a post on X.
BlackRock just filed a new (and probably final) amendment for their Bitcoin Premium Income ETF $BITA and WE HAVE A FEE: 65bps. Obv higher than $IBIT et al but lower than the two biggest ETFs in ‘covered call’ category which are 95bp and 99bp. My guess is this is going to launch… pic.twitter.com/KBwFrmkdbJ
— Eric Balchunas (@EricBalchunas) June 10, 2026
Balchunas added he expects the fund to launch very soon, noting BlackRock is under pressure to beat Goldman Sachs to market, with Goldman’s own bitcoin fund due to go live around July 1.
BlackRock already has the strongest distribution base in the spot bitcoin ETF market. Its iShares Bitcoin Trust, IBIT, has become the flagship product of the sector, regularly drawing the largest inflows and often absorbing capital even when rival funds see redemptions.
IBIT and Fidelity’s FBTC have increasingly turned the U.S. spot bitcoin ETF market into a two-firm race, with smaller issuers often contributing little to daily flows.
The launch would be another step in turning bitcoin into an income product for mainstream investors. The filing shows the fund is already seeded and has started buying bitcoin and IBIT shares – a sign it is close to being ready.

Bitcoin (BTC) has held above $62,000 on Thursday after a modest 2.3% surge in the last 24 hours. Amid increased investor anxiety, a new analysis suggests that Bitcoin may be moving closer to a potential bottom.
According to the latest CryptoQuant Weekly Report, the asset is currently trading a little over 15% above its Realized Price of $53,600, a level that, in previous market cycles, has often been associated with the formation of major market bottoms.
Mixed Signals
However, current demand conditions remain weak across the market. For instance, “Total Bitcoin,” measured by combining speculative perpetual futures trading and apparent spot buying, declined by around 652,000 BTC over the past week, the largest weekly contraction since January 2022.
At the same time, ETF demand growth has fallen to its lowest level on record, which essentially means that institutional buying, a major driver in the current cycle, is slowing down.
Market cycle analyst Benjamin Cowen has also pointed out that major bottoms are typically confirmed only after key indicators cross and not beforehand, meaning the process can take time. This is in line with CryptoQuant’s view that Bitcoin may be entering a value zone, but a confirmed bottom has not yet formed.
There is still limited panic selling in the market, as on-chain data also shows that realized losses remain well below levels seen in earlier capitulation phases.
However, not all analysts agree that Bitcoin is approaching a bottom, with some expecting further downside ahead. Doctor Profit, for one, recently said that Bitcoin has entered Stage 5 of his six-stage bear market model, which he describes as a period of strong emotional pressure in the market. He warned that thinking the worst is already over is a mistake seen in past cycles, where traders became optimistic too early before another major fall.
According to the analyst, Bitcoin could still fall to the $40,000 to $48,000 range. He called this range the “Confirmed BlackRock Bottom,” while linking it to the price level where BlackRock launched its spot Bitcoin ETF in early 2024.
Capital Outflows
Separate blockchain metrics also point to continued weakness. Another analyst, Axel Adler Jr., flagged ongoing signs of capital outflows and loss realization in the Bitcoin network. He found that Bitcoin’s Realized Cap 30D Change has dropped to -1.1%. The outflows have reached this level for the first time since mid-March.
He noted that Realized Cap has fallen by about $12 billion from its mid-May peak of $1.087 trillion to $1.075 trillion, and the pace of decline has accelerated in recent days. During the same period, Bitcoin also saw a sharp price drop, while adjusted SOPR has remained below 1.0 for 13 consecutive days, which indicates continued selling at a loss and no clear recovery in on-chain profitability.
The post Major Bitcoin Demand Drop Sparks Debate Over Cycle Bottom Formation appeared first on CryptoPotato.
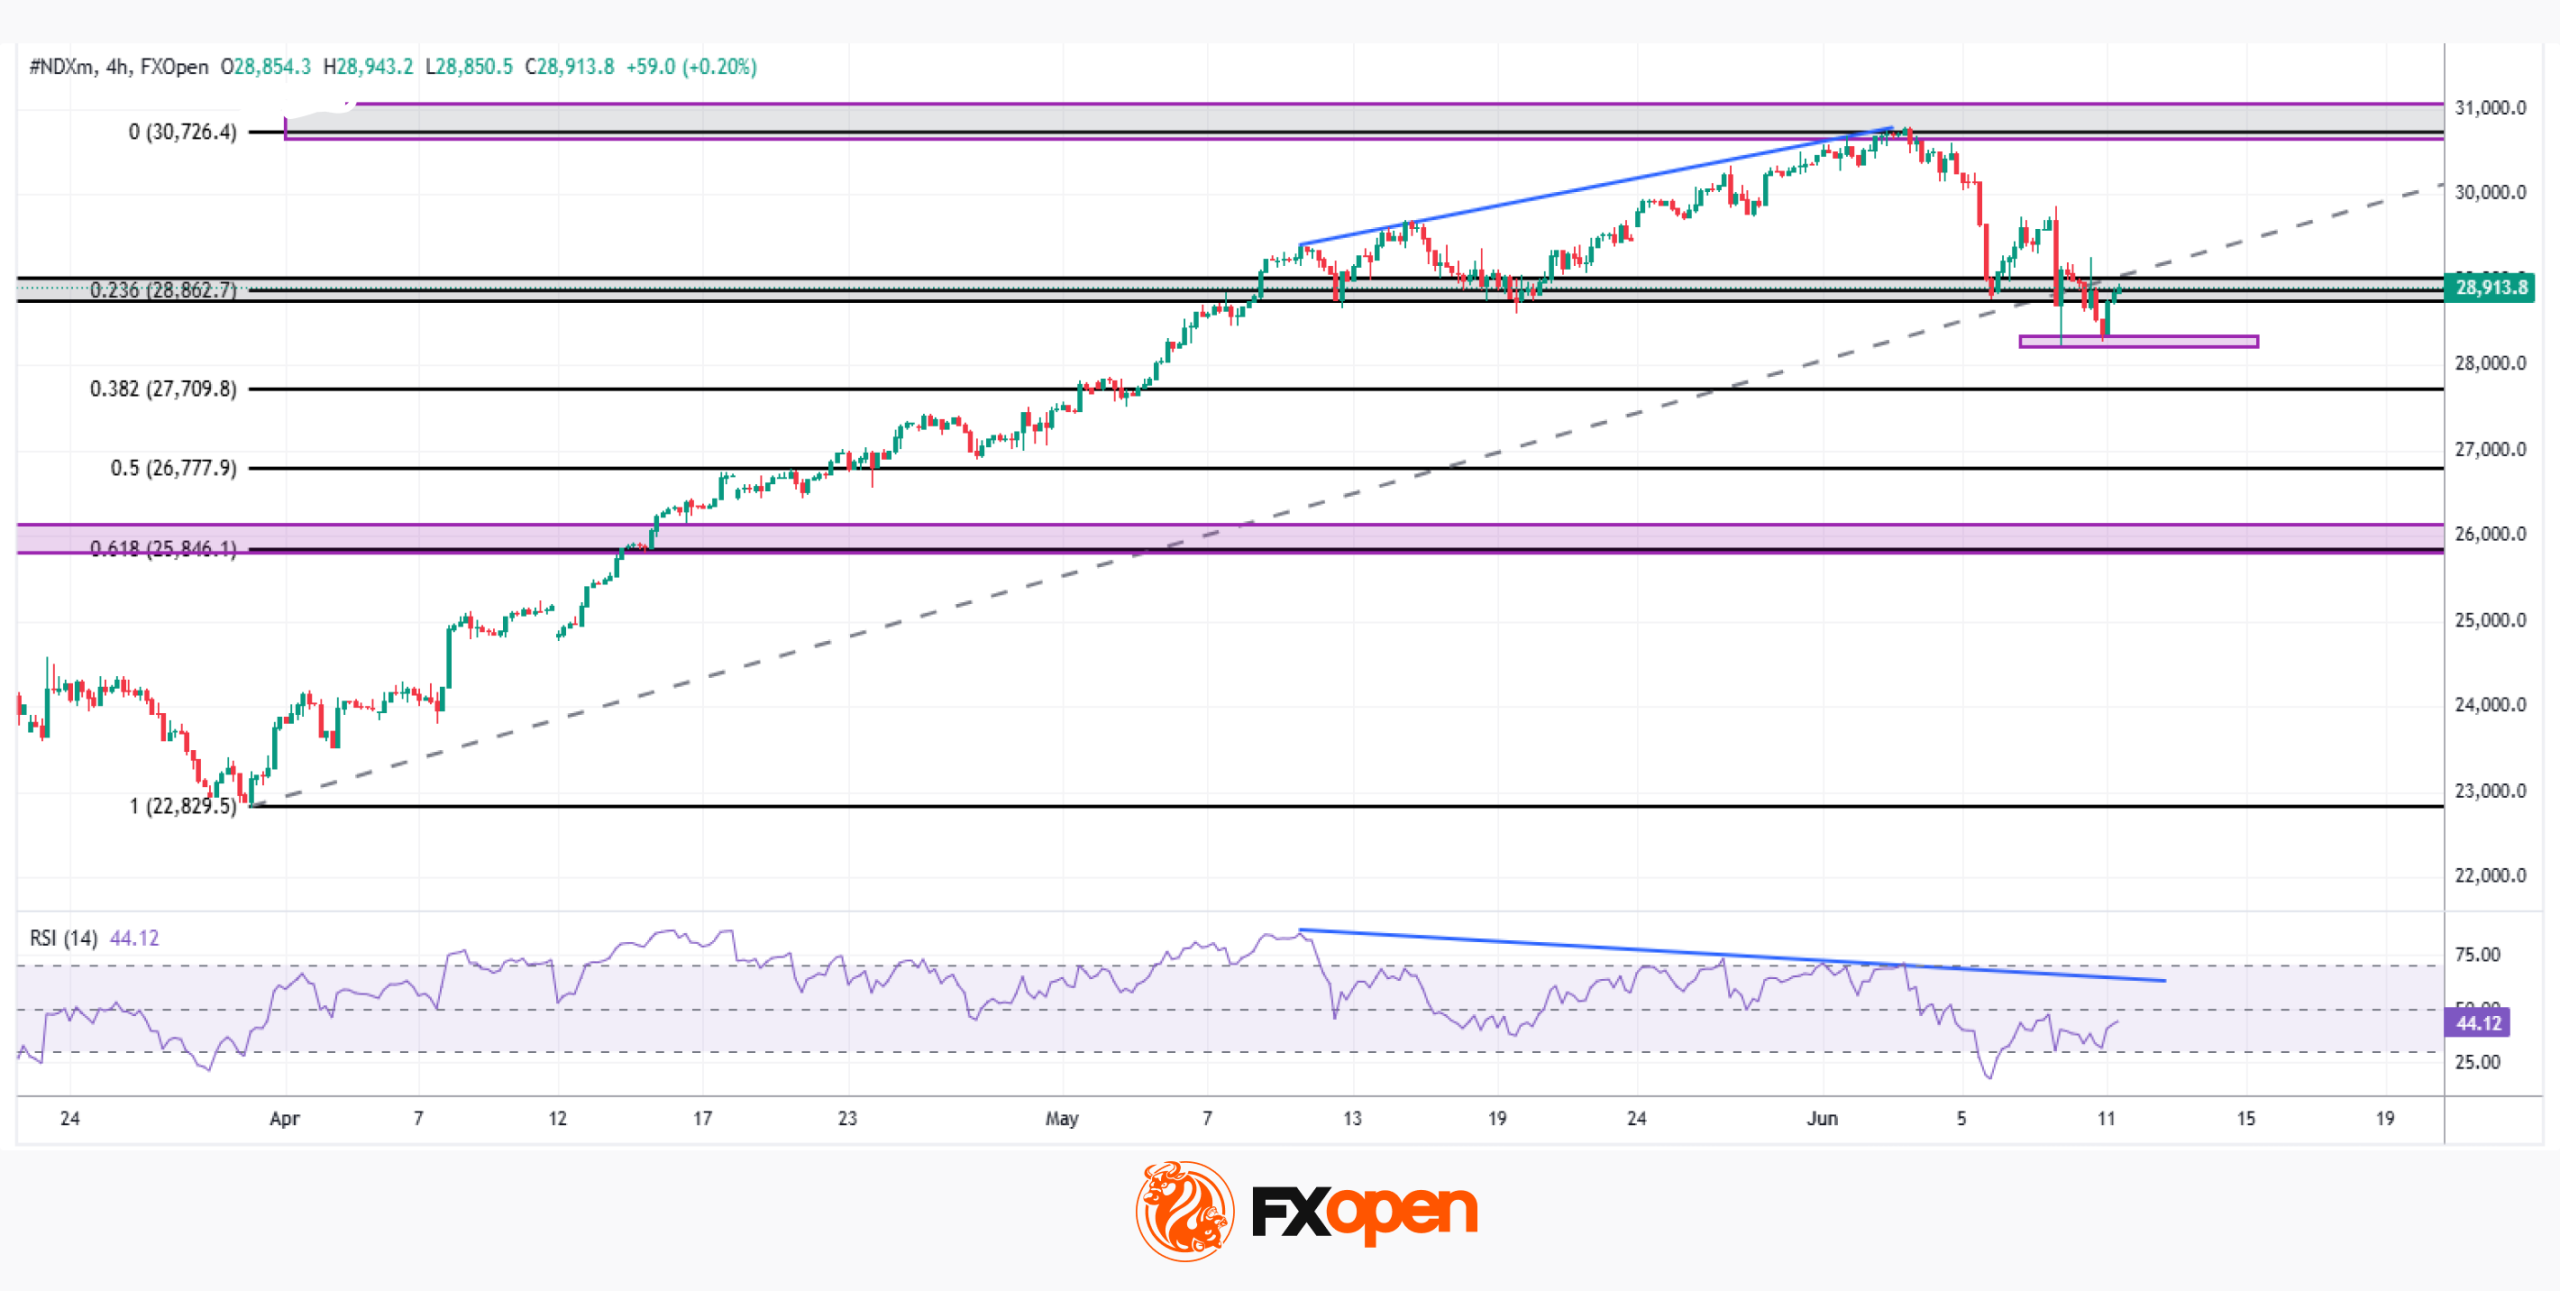
As the chart shows, the Nasdaq 100 (US Tech 100 Mini on FXOpen) is down more than 6% from its recent highs, with Friday, 6 June, standing out as the defining session: a single-day loss of approximately 4.74% marked the worst daily performance of 2026.
The S&P 500 (US SPX 500 Mini on FXOpen) declined around 4% from its highs, while the Dow Jones (Wall Street 30 Mini on FXOpen) posted a more contained loss of approximately 3%. Investors and traders are now asking the same question: Is this the beginning of a deeper correction, or simply an isolated bout of volatility?
Why Did US Markets Sell Off?
The sell-off was driven by a combination of geopolitical, macroeconomic, and technical factors. On the geopolitical front, US/Israel–Iran negotiations have shown signs of escalation in recent days, injecting uncertainty into already fragile risk sentiment.
The primary catalyst, however, was Friday’s Non-Farm Payrolls report, which showed 172,000 jobs added compared with forecasts of just 85,000. The stronger-than-expected reading sent the US dollar sharply higher, putting pressure on all inversely correlated assets, including equity indices, gold, silver, forex pairs, and cryptocurrencies.
Adding further headwinds, Wednesday’s CPI print showed inflation holding at 4.2% (Core CPI: 2.9%), potentially pushing the Fed, now under new Chair Warsh, to keep rates on hold for longer.
Technical Analysis of the Nasdaq 100
The chart presents two contrasting scenarios.

On the bullish side, the price defended the 28,200–28,300 support zone twice, triggering a rebound toward the 28,800–29,000 region, a key former support level now acting as resistance. A clean break above this level could suggest the broader uptrend remains intact, while a rejection might initiate a sequence of lower highs and lower lows.
On the bearish side, a confirmed break below the lows of 9 and 11 June could potentially expose the 25,800–26,000 zone — where a key former resistance and the 0.618 Fibonacci retracement of the late-March rally converge. An RSI divergence on the 4H time-frame, already visible before the sell-off, appears to be playing out in support of this scenario.
With dollar strength, sticky inflation, and geopolitical risk all weighing on sentiment, these levels could prove decisive in the sessions ahead.
Trade global index CFDs with zero commission and tight spreads (additional fees may apply). Open your FXOpen account now or learn more about trading index CFDs with FXOpen.
This article represents the opinion of the Companies operating under the FXOpen brand only. It is not to be construed as an offer, solicitation, or recommendation with respect to products and services provided by the Companies operating under the FXOpen brand, nor is it to be considered financial advice.

Dogecoin could be primed for a major reversal, at least according to the metric that recently predicted its price crash to a 14-month low.
Meanwhile, analysts seem confident that DOGE’s current price range is a “good accumulation zone,” something that whales have taken advantage of lately.
DOGE to Rebound Soon?
The leading meme coin rode the mid-May push wave quite impressively, going from $0.092 to a multi-week peak at almost $0.12 at the time. However, the subsequent market-wide correction and overall weakness led to massive price declines.
One of the indicators that suggested a more notable DOGE drop was the Tom DeMark (TD) Sequential. It flashed a major sell signal for the OG meme coin in early May on the 3-day chart, and although it took some time, the asset indeed dumped hard, going from $0.113 to under $0.08, which became its lowest price tag in over a year.
Now, this same indicator, which is used to determine the underlying asset’s market exhaustion in either direction, has flipped bullish, according to Ali Martinez. The analyst predicted that after the 30% correction, a “rebound could be around the corner” for DOGE.
Meanwhile, fellow analyst MikybullCrypto outlined a similar perspective, indicating that the meme coin currently sits on a “good level for accumulation.” As reported yesterday, Dogecoin whales have started purchasing at these lower levels, accumulating over 200 million tokens in a week.
Some Reaction?
Another popular crypto commentator, Daan Crypto Trades, also weighed in on DOGE’s recent price moves, suggesting that the token typically retraces to the $0.06-$0.08 range in bear markets. History shows, though, that it tends to get “some kind of reaction” once it gets there.
This same level was tested in February, and it held, but he added that “it’s still good to watch.” Daan noted that DOGE has fallen out of investors’ radar lately, but that doesn’t mean that it cannot repeat some of its previous historic rallies, many of which began from the current levels.
$DOGE Not one that many people are trading or looking at, but I do always like to watch high timeframe sweeps/supports on majors like these.
DOGE does tend to move back to this $0.06-$0.08 zone during its bear markets and usually gets some kind of reaction.
Obviously this level… pic.twitter.com/NE9TCJPTm2
— Daan Crypto Trades (@DaanCrypto) June 10, 2026
The post The Indicator That Called DOGE’s Collapse Just Flashed a Rare Buy Signal: Analyst appeared first on CryptoPotato.

The country’s parliament is poised to pass legislation that would bring cryptocurrencies under the same regulatory framework as stocks.
The bill passed the lower house of Parliament today and is expected to take effect next year after going through the upper house.
The proposal could classify cryptocurrencies as financial instruments, subjecting assets such as Bitcoin and Ethereum to stricter trading rules while potentially lowering the tax burden for investors.
It’s important to note that Japan’s government had already approved a bill that granted crypto status of financial instruments, marking an attempt to bring digital assets closer to securities for oversight purposes.
Lower Taxes and ETF Hopes Take Center Stage
One of the most closely watched parts of this particular legislative reform is taxation. Crypto gains in Japan have historically been taxed as miscellaneous income, with rates that can climb as high as 55%. Under the proposed framework, gains could be taxed closer to 20%, which is the rate applied to stocks.
That change would make the local crypto market much more attractive to retail and institutional investors, especially compared to the current system, which industry participants have long criticized as a bit too restrictive.
The move could also open the door for new regulated products, such as spot crypto exchange-traded funds. Bloomberg reported that the bill may help pave the way for ETFs, which give investors a fully regulated way to gain exposure to cryptocurrencies like Bitcoin without having to hold them directly.
Commenting on the matter was Masato Yoshizawa, a representative for the Financial Services Agency, who said:
“We aim to foster more innovation by creating a sound trading environment. We’re not necessarily giving crypto a stamp of approval, but we’re aiming for healthy market growth.”
Japan Also Pushes for More Oversight
But the proposed legislation is not only focused on growth. By bringing cryptocurrencies under the rules that regulate stocks, Japan is also preparing stricter guardrails for trading activity. This means more control over insider trading, stronger disclosure requirements, and more restrictions altogether.
Naturally, this would align crypto much more closely with Japan’s existing financial market structure, where investor protection and market transparency are central in legislation.
That said, the next step is whether the upper house passes the bill and how regulations define all the details before the expected implementation next year.
The post Japan to Regulate Crypto Like Stocks, Could Pave Way for ETFs appeared first on CryptoPotato.
The May read on inflation cooled expectations for rapid monetary easing, as the U.S. consumer price index rose 4.2% year over year. The print reinforced a data-dependent stance from the Federal Reserve and tempered hopes for near-term rate cuts, even as some analysts still anticipate further rate hikes later in the year. The result added headwinds for risk assets, including Bitcoin and gold, while crude oil extended a rebound that has persisted through the year.
Bitcoin has endured a rough start to the year, sliding about 36% since January. Gold has fared no better, retreating roughly 23% from its January peak. In contrast, crude benchmarks have surged, with oil up more than 50% over the same span. The broad inflation backdrop thus remains a litmus test for capital allocation across risk assets and hedges alike.
“Today’s in-line CPI print keeps the Fed cautious, data-dependent, and in no rush to cut,” said Iggy Ioppe, chief investment officer at Theo, reflecting a common view among market participants that policymakers will await clearer signs of easing before altering the policy path. “For Bitcoin, an in-line print is unlikely to be a clean catalyst either way. It keeps liquidity expectations capped and risk assets trading more on positioning than on a fresh dovish impulse.”
Regarding gold, Ioppe noted that real yields remain a central driver. “Without imminent rate cuts, the opportunity cost of holding a non-yielding asset stays elevated,” he said, underscoring why the precious metal has struggled as inflation data points oscillate between hot and not-so-hot readings.
Key takeaways
- The May CPI rose 4.2% year over year, reinforcing a data-dependent Fed stance and delaying expectations for near-term rate reductions.
- Bitcoin has fallen about 36% since January, while gold has declined roughly 23% from its January peak; oil has gained more than 50% in the same period, highlighting divergent macro reactions across assets.
- Institutional appetite for Bitcoin remains cautious. Markus Thielen of 10x Research says the macro setup isn’t yet supportive enough to trigger meaningful reallocations into Bitcoin by Wall Street players.
- Geopolitical and supply concerns—particularly around oil—add an extra layer of uncertainty that could influence inflation expectations and asset mix in the months ahead.
- Market odds on near-term rate moves reflect a wait-and-see approach: CME’s FedWatch tool pointed to a high likelihood—about 98%—of no change at the Fed’s upcoming meeting, underscoring how the inflation path governs risk appetite.
Policy backdrop and the road ahead
On the policy front, inflation dynamics continue to dictate the Federal Reserve’s posture. The latest CPI data align with a narrative of persistent price pressures that require careful monitoring before policymakers consider easing financial conditions. The debate among investors centers on whether inflation will meaningfully slow soon enough to justify rate cuts this year, or whether the data remains too fractious to permit a shift toward looser policy.
As traders parse these signals, the market environment remains fragile. The lack of a decisive shift in policy expectations suggests liquidity conditions may stay constrained for now, especially for assets that do not deliver yields. Tim Sun, a senior researcher at HashKey Group, captured the sentiment: “Only when inflation drops, rate cuts become viable, and liquidity improves alongside lower capital costs, will the overall risk appetite truly reverse.”
In practical terms, this macro tension translates into ongoing caution for digital-asset portfolios. Bitcoin, often viewed as a risk-on proxy in liquidity cycles, is susceptible to declines when macro catalysts loom large or when institutional demand remains tepid. The same backdrop has weighed on gold, despite its traditional role as a hedge, as real yields and the relative attractiveness of yield-bearing assets compete for capital.
Institutional stance and geopolitical risk
In the corporate and financial services sphere, the appetite for Bitcoin appears muted for the moment. Markus Thielen of 10x Research argued that the data released so far do not present a compelling case for a broad reallocation into Bitcoin by big investors. “We do not believe this data is sufficiently encouraging to prompt Wall Street investors to meaningfully reallocate into Bitcoin,” Thielen told Cointelegraph. He highlighted two key frictions: inflation’s persistence as a drag on risk sentiment, and geopolitical tensions—specifically Iran-related developments—that could compound supply-side volatility in oil markets and feed inflation expectations.
Thielen also warned that oil-supply disruptions could become more pronounced during the summer, potentially uplifting inflation expectations and complicating any near-term shift toward higher risk-taking in crypto and other speculative assets. In such an environment, the case for Bitcoin as a hedge or asymmetric bet remains nuanced, with outcomes highly dependent on the trajectory of inflation and the pace of liquidity normalization.
On the rate-front, the market is already looking past the immediate horizon. HashKey’s Sun emphasized that while rate hike expectations were heating up, the probability of a policy move this year remains relatively low unless inflation convincingly converges toward the Fed’s target. The market’s current pricing—reflected in Fed futures—suggests traders see little chance of an immediate policy shift, reinforcing a wait-and-see stance for both traditional and crypto markets.
What to watch next
Looking ahead, two threads are particularly consequential for markets and crypto builders alike. First, the inflation path remains the arbiter of policy and liquidity: sustained deceleration would tilt the balance toward rate cuts and a broader risk-on rally. Second, geopolitical tensions and commodity-market dynamics could reintroduce volatility by injecting uncertainty into inflation expectations and the pace of capital cost reductions.
Investors and developers should monitor upcoming inflation releases and any shifts in the Fed’s communications. Attention will also turn to global oil supply news and potential geopolitical flare-ups, which can ripple across equities, bonds, and crypto markets alike. As the data flush continues, the balance between inflation normalization and policy accommodation will likely shape how Bitcoin, gold, and other risk assets perform in the near term.
For a clearer read on the inflation trajectory, traders often turn to data trackers such as Trading Economics, which notes the CPI’s movement as part of a broader inflation picture, and to policy trackers like the Fed Funds futures market. CME’s FedWatch tool remains a widely cited barometer of policy expectations, currently signaling a minimal near-term likelihood of rate changes absent a sharper shift in inflation trends.

An artificial intelligence and cybersecurity researcher claims to have jailbroken Anthropic’s latest AI model, Claude Fable 5, within just 48 hours of it being launched.
“Pliny the Liberator,” a well-known figure in the AI community, said on Wednesday he “liberated” Fable 5, launched on Tuesday as a safety-tuned version of the more powerful Mythos model that Anthropic said was too dangerous to release widely.
He used various techniques, including a jailbroken version of Opus 4.8, to bypass the built-in safeguards that Anthropic installed on the model to prevent users from asking it for potentially harmful information, such as drug-making formulas or hacking instructions.
“Despite this overly sensitive, authoritarian ‘safety’ layer on top of Mythos, my lil liberators have been hard at work […] cleverly finding the holes in the fence that the thought police missed,” said Pliny.
Some crypto users had already expressed concern during the launches of Claude Fable 5 and Mythos earlier this year that it could be used to attack crypto protocols and software. A jailbroken version of Claude Fable 5 would mean the threat is even closer than expected.
Getting around Claude Fable 5’s guardrails
“Pliny” rose to prominence around 2024 by developing and openly sharing jailbreak prompts for models like ChatGPT, Claude, Grok, and others, often posting “jailbreak alerts” with techniques that bypass guardrails shortly after new AI models launch.
To get around Anthropic’s security fence, Pliny said he used Unicode and homoglyphs, long-context framing, narrative and fiction framing, academic-style decomposition-recomposition, and a jailbroken Claude Opus 4.8 to get Fable to respond to his otherwise restricted prompts.
“Perhaps the most effective is decomposition + recomposition in the backend,” he said.
This involves breaking requests into small, innocent pieces and asking for harmless-sounding facts one by one. Each prompt alone looked fine to the AI’s safety filters, but when pieced back together, they produce something more useful or dangerous.

Pliny demonstrates a path to meth synthesis by asking about the Birch reduction method. Source: Pliny
Backlash over Fable 5 mounts
Anthropic’s Fable 5 has prompted backlash from critics since its launch due to its heavy restrictions.
When a user prompts the model for sensitive topics such as bioweapons or cybersecurity, Fable 5 is designed to return a notification and then redirect the conversation to an earlier, less capable model.
Related: AI agents with crypto could escape and become ‘unstoppable,’ experts warn
“This is one of the first times that an AI company has rolled out a guardrail, and there has been uniform disdain. It has led to a lot of justified anger,” said Sayash Kapoor, an AI researcher at Princeton University, according to the Wall Street Journal.
“The consensus seems to be that this has been one of the most disappointing model drops of all time, effectively preventing legitimate researchers from contributing their talents to our collective advancement,” said Pliny.
Anthropic had found no universal jailbreaks
During the Fable 5 launch, Anthropic said it ran an external bug bounty program to look for ways to jailbreak the AI model.
“As well as internal testing, we ran an external bug bounty that produced no universal jailbreaks in over 1,000 hours of testing.”
Cointelegraph reached out to Anthropic for comments but did not receive an immediate response.
Magazine: AI-driven hacks could kill DeFi — unless projects act now

The European Central Bank is expected to raise its benchmark rate to 2.25% on Thursday, June 11, the first increase since 2023, as Middle East-driven energy costs push eurozone inflation above its 2% target. The move lands six days before Kevin Warsh chairs his first Federal Reserve meeting.
The ECB’s Governing Council cited energy prices as the primary driver of eurozone CPI, which is running at 3.2%, above the 2% target. Observers expect at least one further hike this year, with September the most likely date.
How a Stronger Euro Pressures the Fed
When European rates rise relative to US rates, capital tends to shift toward euro-denominated assets, strengthening the euro and weakening the dollar.
A weaker dollar makes imports more expensive for American consumers, adding to the inflation pressure the Fed is already struggling to contain.
The ECB’s decision comes as US headline CPI sits at 4.2%, well above the Fed’s 2% target.
The central bank has held its benchmark rate at 3.50–3.75% across three consecutive FOMC meetings this year, and Wall Street prices a 97% probability of no change at the June 17–18 meeting.
But Kevin Warsh, who chairs his first FOMC this month after promising “regime change” on inflation discipline, now faces a global environment that reinforces the case for staying restrictive.
‘Higher for Longer’ Goes Global
The ECB’s decision confirms something bigger than a single rate move. Energy-driven inflation is proving sticky, and no major central bank can yet claim a clear path to easing.
Goldman Sachs has pushed its Fed rate-cut forecast to late 2026 or early 2027, citing energy cost pass-through keeping US core inflation near 3% for the rest of the year.
Cleveland Fed President Beth Hammack has warned that waiting for “definitive evidence” of embedded inflation risks requires “larger policy adjustments, at greater cost.”
The Fed’s own higher-for-longer signals now carry European confirmation. Bitcoin has tracked the collapse in rate-cut expectations almost exactly, falling from $82,000 in mid-May to the low $60,000s.
June 17–18 is the next data point. What Warsh signals from his first press conference will tell markets whether this rate cycle still has further to go.
The post The ECB’s Rate Hike Could Force the Fed’s Hand appeared first on BeInCrypto.


Crypto-friendly DBS Bank said it will start offering tokenized gold trading to its retail customers in the second half of 2026.
DBS said it will list the product, called DBS Physical Gold Tokens, on its digibank platform and is also considering making it available on the DBS Digital Exchange (DDEx), which is tailored for accredited investors and institutions.
The bank will tokenize, issue, distribute and manage the physical gold tokens entirely in-house, backed by trusted bank-grade infrastructure. Each token is backed by 1 gram of physical gold held by DBS in a dedicated vault in Singapore, the bank said in a statement.
The move builds on a growing trend towards blockchain-based versions of real world assets (RWAs). The size of physical gold holdings in the portfolios of wealthy clients of DBS has more than doubled over the past three years.
In 2025, DBS tokenized structured notes on Ethereum and listed sgBENJI, the token of Franklin Templeton’s tokenized money market fund, alongside the Ripple’s RLUSD dollar-pegged stablecoin.
“While our retail investors have been able to buy gold funds, access to physical gold has been largely available to only institutional and accredited investors,” said James Tan, the head of DBS’ investment product and advisory unit. “DBS has offered physical gold investments to wealth clients since 2013, and we are now leveraging tokenisation to broaden access, enabling more retail customers to invest in gold in a safe and meaningful way.”


The Solana Foundation has shipped a native onchain subscriptions and allowances primitive on Solana mainnet, giving any team building on the network a shared program for recurring billing, capped delegated spending, and merchant-published billing tiers without standing up its own custody, billing,… Read the full story at The Defiant

2 Years Later, James McAvoy’s Twisted Horror Thriller Is Finally Finding the Audience It Deserves

Breaking News Inflation Rises Faster! #shorts #money #finance #breakingnews #economy #inflation

Wolves: Wolves dismiss Rob Edwards after seven months in charge at Molineux

HarrisX Poll Found 52% of Registered Voters Support the CLARITY Act

BloFin War of Whales 2026 Grand Prix opens registration for $5M trading championship

Blockchain.com files with SEC for U.S. IPO
Breaking News Inflation Rises Faster! #shorts #money #finance #breakingnews #economy #inflation

#crypto #bitcoin #blockchain #web3 #cryptocurrency #wealthmindset #financialfreedom #investing

Crazy Ex-Girlfriend Is Mad I Won’t F*ck Her | Financial Audit
-

 Fashion6 days ago
Weekend Open Thread: Evereve – Corporette.com
-
 Crypto World6 days ago
Jensen Huang Approves Samsung, SK Hynix, and Micron for NVIDIA (NVDA) HBM4 Memory Supply
-
 Entertainment4 days ago
The Best Mystery Series of All Time Is Surging on Streaming 30 Years After It Ended
-

 Crypto World3 days ago
Anatomy of the June crypto crash: Fed, Iran, Saylor
-

 NewsBeat3 days ago
Alexander Zverev wins the French Open to finally earn a 1st Grand Slam title
-

 Tech5 days ago
Suspicious Polyfill login prompts pop up on Toshiba, Muji websites
-
 Crypto World5 days ago
Senator Cynthia Lummis Calls CLARITY Act the Most Consequential Financial Legislation of This Generation
-

 Tech4 days ago
Microsoft unveils seven homegrown AI models in new bid for ‘long term self-sufficiency’
-

 Tech6 days ago
Microsoft launches MXC, an OS-level sandbox for AI agents, with OpenAI and Nvidia already on board
-

 Business6 days ago
(VIDEO) Justin Bieber Delivers Surprise Happy Birthday Serenade to Diners at Los Angeles Mexican Restaurant
-
 Business4 days ago
The Pain Points Taking a Fragile Tech Rally Down a Notch
-
 Crypto World3 days ago
Eli Lilly (LLY) Stock Surges 4% Following Breakthrough Sleep Apnea Trial Results
-

 Business3 days ago
High Stakes for Wembanyama as New York Pushes for 3-0 Lead
-

 Tech5 days ago
Von der Leyen’s AI envoy pick draws conflict-of-interest fire
-
Crypto World6 days ago
LBank Surpasses 25 Million Users Worldwide as AFA Partnership Continues to Drive Global Growth
-

 Tech5 days ago
Hackers now exploit SolarWinds Serv-U flaw to crash servers
-

 Tech6 days ago
Meta steals a tactic from Tesla and builds data centers in tents
-

 Crypto World4 days ago
Trump’s AI Ownership Plan Could Benefit Anthropic at OpenAI’s Expense
-
 Sports2 days ago
Bangladesh beat Australia after 20 years in ODIs, register only their second win over six-time world champions | Cricket News
-
 NewsBeat4 days ago
Alexander Zverev conquers demons and outlasts Flavio Cobolli to win French Open for first major title
You must be logged in to post a comment Login