

Crypto World
Imbalance Trading in Forex and CFDs
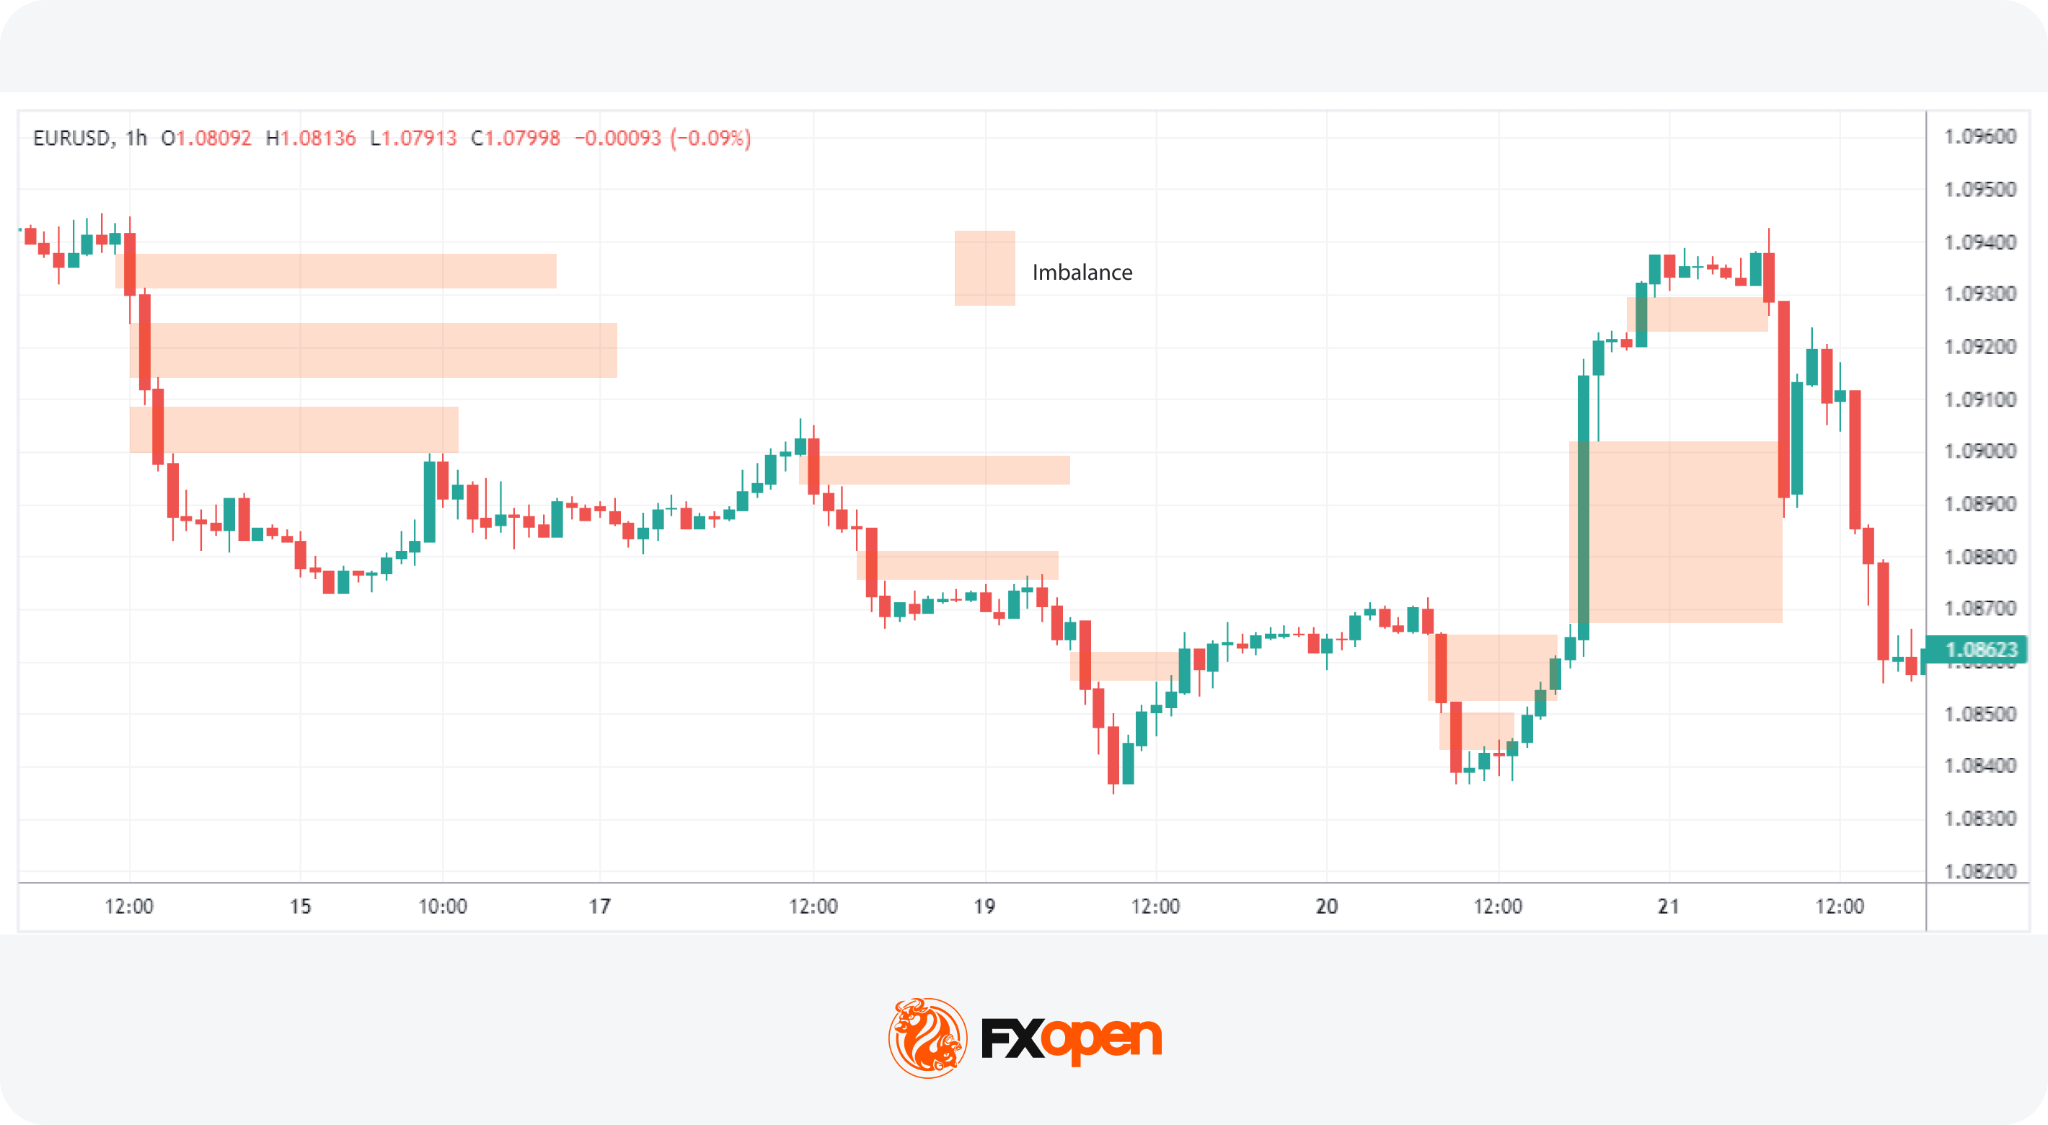
An imbalance in trading is a price zone where supply or demand heavily outweighs the opposite side, causing a sharp directional move with little trading in between. These zones sit at the heart of Smart Money Concept analysis. They shape how traders read momentum, structure, and entry points across forex and CFDs.
This article covers what drives imbalance in forex and CFDs and how it shows up on a chart. It walks through how an imbalance trading strategy may be built around price action, the link between an order flow imbalance and liquidity, and the difference between imbalance zones, fair value gaps, and order blocks.
What Is Imbalance in Trading?
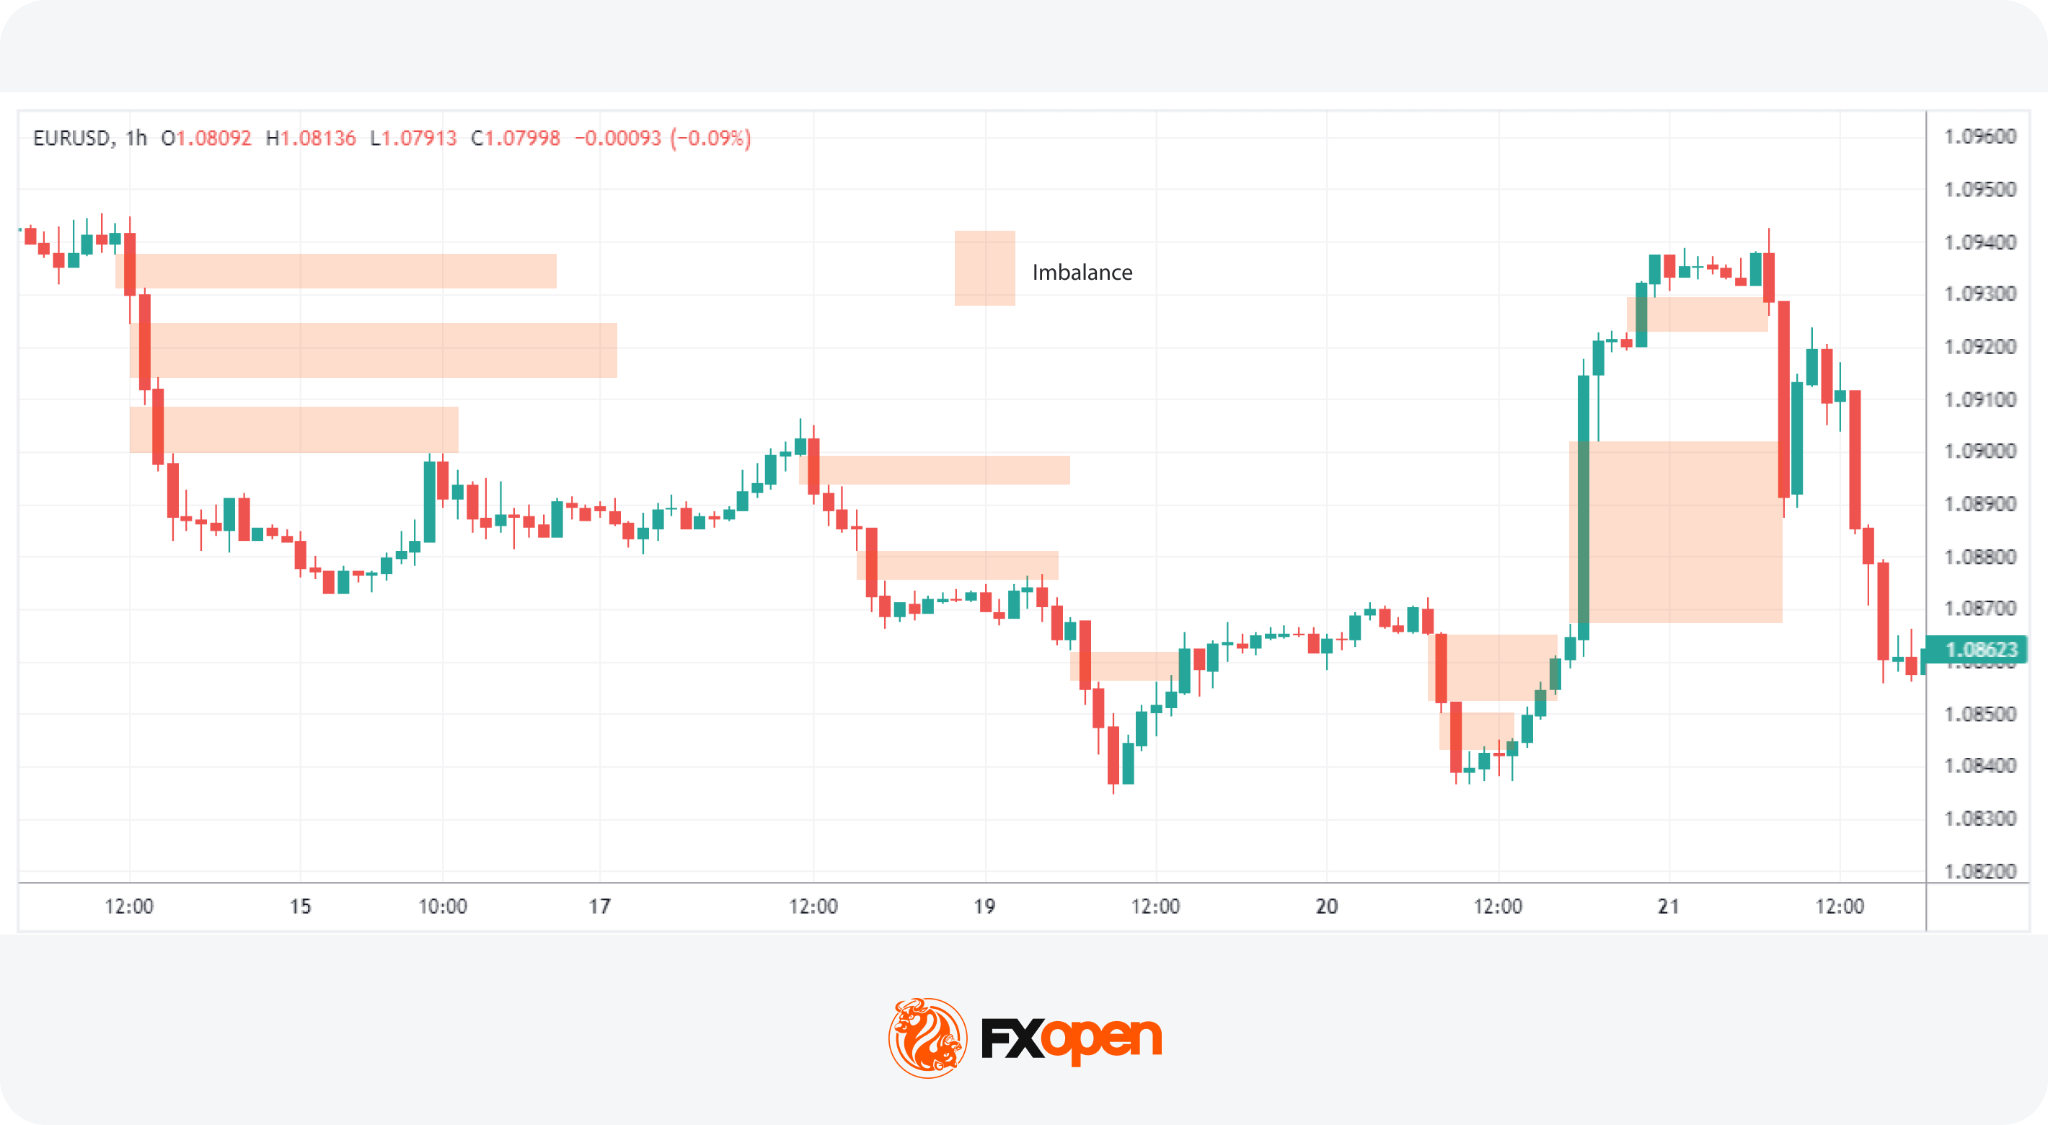
Imbalance in trading is a price zone where buy or sell orders heavily outweigh the opposite side, causing a sharp directional move with little trading in between. This imbalance of orders can significantly influence asset prices, pushing them up or down. It’s a fundamental concept in forex, crypto*, commodity, and stock markets.
Three related terms appear often:
- Imbalance: any zone where one side of the order flow dominates and price displaces sharply.
- Fair value gap (FVG): a three-candle pattern where wicks of the outer candles fail to overlap.
- Liquidity void: a wider displacement zone, often spanning several candles, that may contain multiple FVGs.
A market imbalance occurs when there’s an overwhelming interest from buyers (buy-side imbalance) or sellers (sell-side imbalance) without enough opposite-side orders to match. These zones are read by retail traders as visible footprints of large activity. Institutional desks often cause the imbalance themselves through size-driven execution the order book cannot absorb on one side.
Imbalance zones in trading are critical components of the Smart Money Concept (SMC), a framework that focuses on understanding the actions of institutional investors. SMC proponents argue that by analysing where and how these imbalances occur, traders can align their strategies with those of the market’s most influential players. The rationale is that institutional movements, often the cause behind significant imbalances, have the power to drive market trends.
Types of Imbalance in Trading
Order imbalances in trading come in different forms depending on direction, structure, and timeframe. Knowing which type is in front of you may shape how the zone is read and what reaction is expected.
- Buy-side vs sell-side imbalance: a buy-side imbalance is a sharp upward move where aggressive buy orders overwhelm available supply, leaving a thin zone below that price may revisit. A sell-side imbalance is a sharp downward move, where heavy selling pressure creates an unfilled gap above as price drops quickly.
- Fair value gap vs volume imbalance: a fair value gap is a structural three-candle pattern, while a volume imbalance focuses on disparity in traded volume between bid and offer at a level. Both highlight inefficiency but rely on different inputs.
- Micro vs macro imbalance: micro imbalances appear on 1-minute and 5-minute charts and may resolve within a session. Macro imbalances sit on the daily or weekly chart and may take weeks or months to fill.
Higher-timeframe imbalances usually carry more weight than lower-timeframe ones. For deeper context on the wider zones, the FXOpen article on liquidity zones and liquidity voids covers the mechanics in more detail.
Fair Value Gaps vs Imbalance vs Order Blocks
Imbalances, fair value gaps (FVGs), and order blocks are related but not identical. They sit on a spectrum of the same idea: a market inefficiency that price may return to.
An imbalance is the broad category. A fair value gap in forex is one specific imbalance pattern. An order block is the cause behind many imbalances, not the imbalance itself. Traders often combine the three: a fair value gap that forms just after an order block, in line with the prevailing trend, may carry stronger confluence than any single element alone.
Why Imbalances Matter in Trading
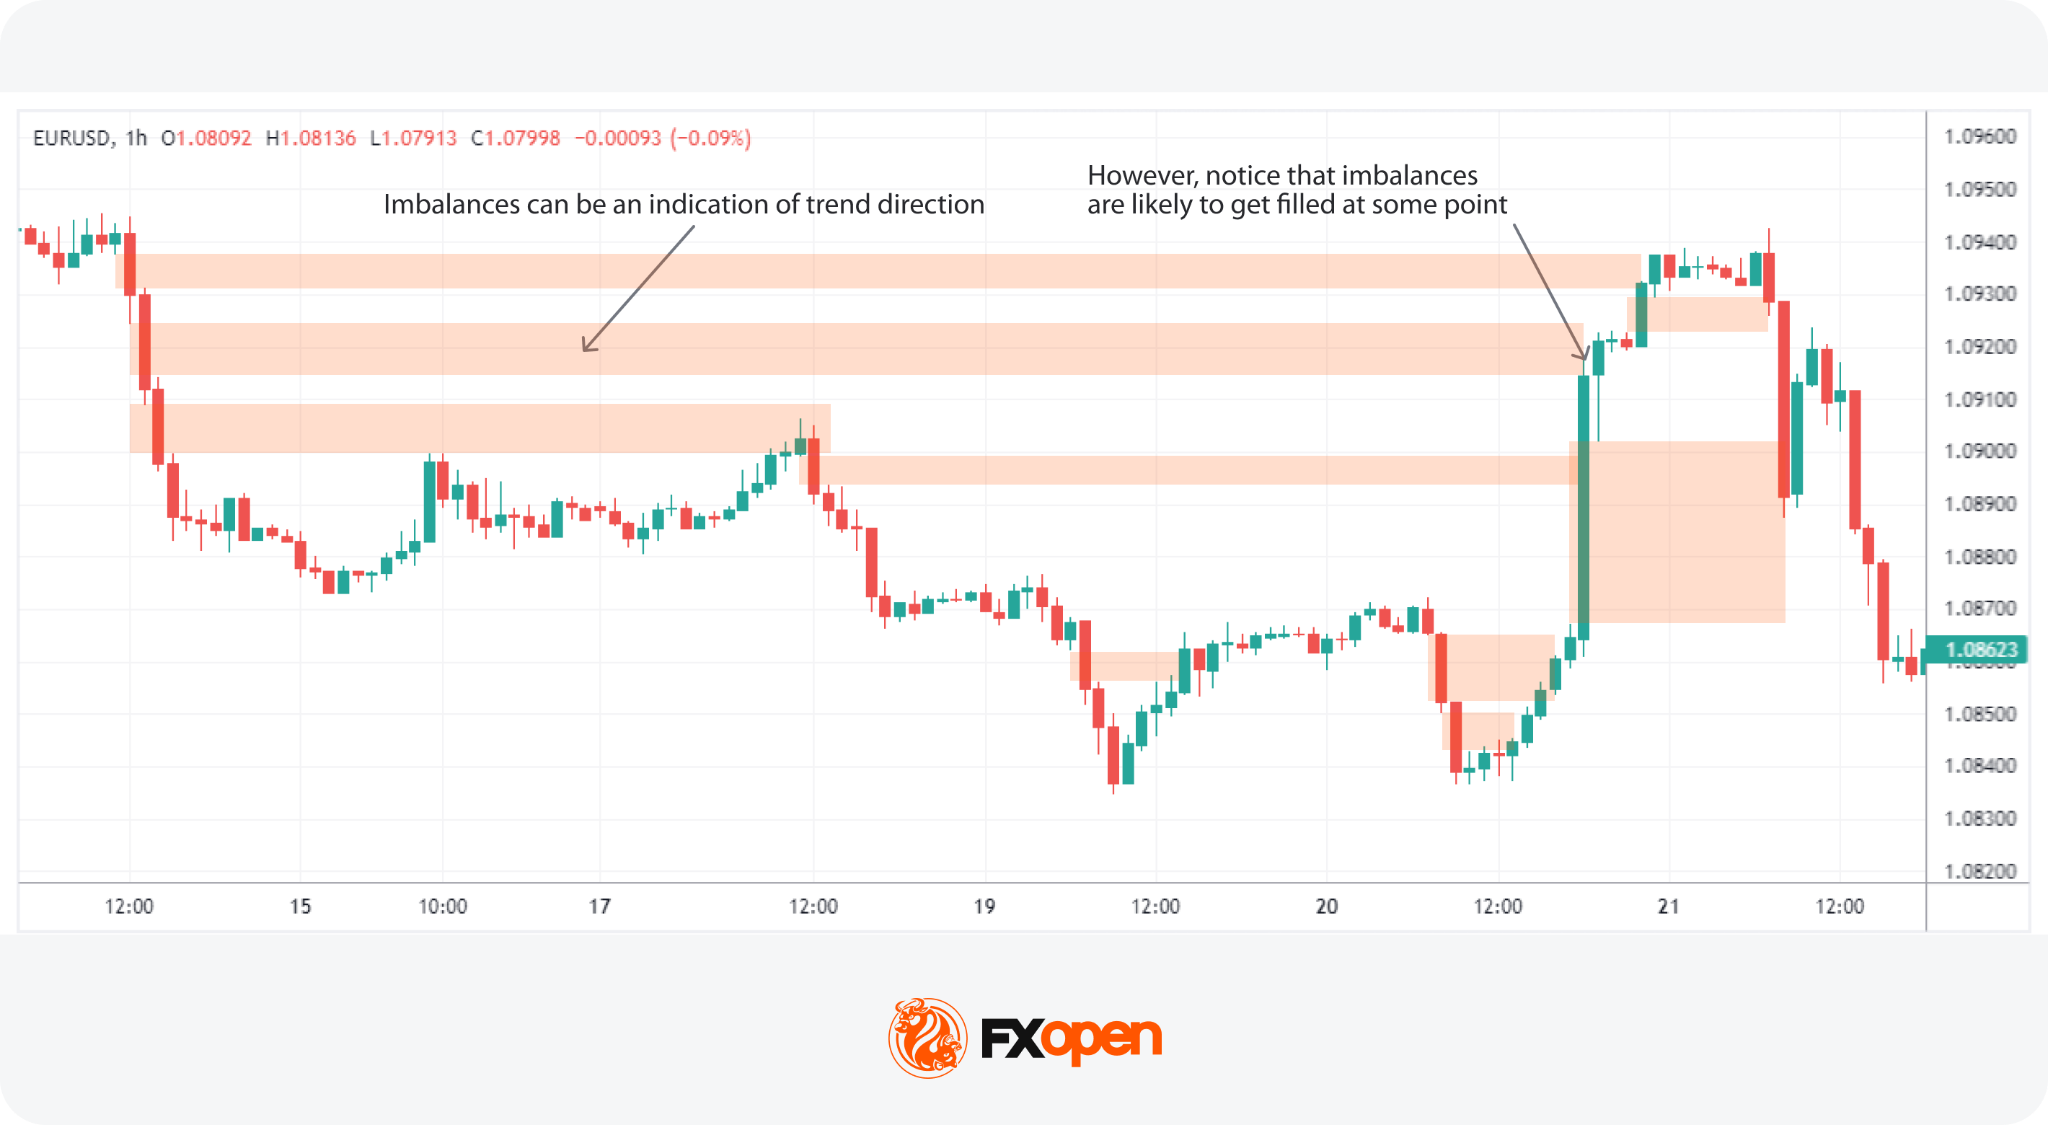
Traders often use imbalances to gauge market sentiment and direction. Large imbalances indicate a pronounced market preference for either buying or selling, suggesting that the trend in the direction of the imbalance is likely to persist. This directional insight is particularly potent with substantial imbalances (also known as liquidity voids), whereas smaller ones may be less useful for market analysis.
Markets tend to “fill” imbalance gaps, created by a lack of trading volume in a price range. This phenomenon hinges on the idea that prices gravitate towards areas of minimal resistance.
Price often returns to fill them, but some remain unfilled for weeks, months, or indefinitely, especially when tied to fundamental repricing events.
Three main reasons traders track imbalances:
- Trend continuation: an imbalance that forms with the higher-timeframe trend may act as a continuation signal.
- Mean reversion: price often retraces back into an imbalance before resuming, offering a reference point for entries.
- Liquidity targeting: large participants may push price through imbalances to access resting orders on the other side. Order flow analysis is a complementary concept here.
Imbalances offer probability, not certainty.
Identifying Imbalances on a Chart
How to identify imbalance in forex and CFD charts? In imbalance trading, traders look for areas where price moved rapidly with limited opposing activity. These conditions often reflect aggressive order flow entering the market while available liquidity on the opposite side remains limited. Fair value gaps (FVGs) are among the most common visual representations of imbalance on a forex or CFD chart.
A fair value gap is typically identified through a three-candle pattern. The central candle represents a strong impulsive move, while the candles before and after it create the boundaries of the imbalance zone. Once the third candle closes, the pattern may indicate that price moved through the area too quickly to establish balanced trading activity.
Strong displacement candles are often associated with meaningful imbalances. Common visual characteristics include:
- large candle bodies
- limited or no wick rejection
- breakout from consolidation
- expansion in volume
- rapid directional movement
The stronger the displacement, the more significant the imbalance is often considered.
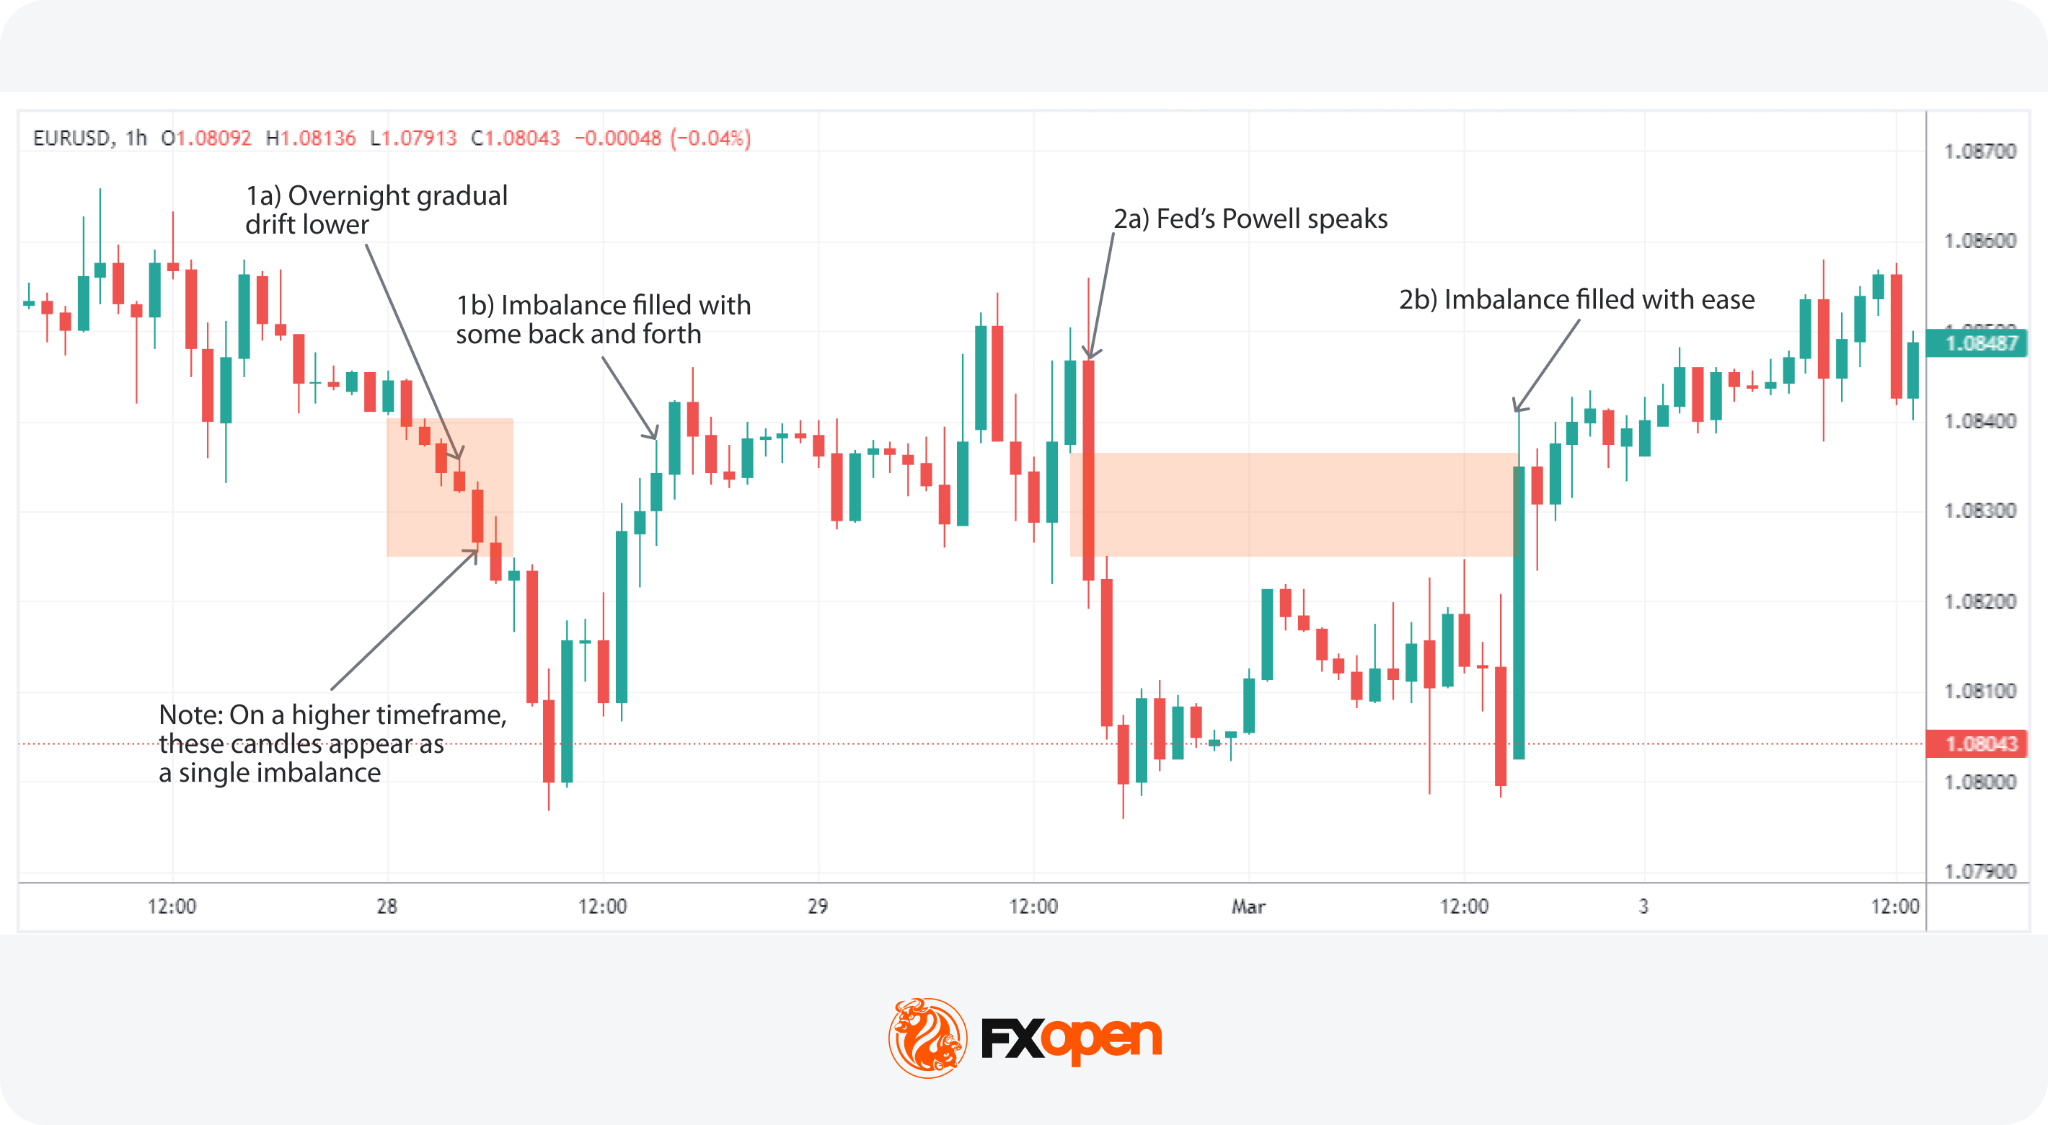
Imbalances may also appear as thin trading or low-interaction zones rather than textbook FVG structures. These areas often show limited candle overlap and minimal back-and-forth price action, indicating that the market moved rapidly through the zone.
A common process for identifying imbalance includes:
- identifying a strong impulsive move
- checking for limited candle overlap
- defining the imbalance boundaries
- comparing the setup with higher-timeframe structure
Timeframe hierarchy also matters. Imbalances that remain visible across both higher and lower timeframes are often considered more significant than those appearing only on lower charts. A daily imbalance may therefore carry more weight than a similar formation on a 5-minute chart. Higher-timeframe imbalance zones are often used as the primary reference area, while lower-timeframe imbalances may help refine entries.
Imbalance Trading Strategy Explained
An imbalance trading strategy combines trend direction, structure, and zone identification into a repeatable framework. According to theory, in an imbalance trading strategy, traders stick with the prevailing market trend. By combining trend analysis with imbalance identification, traders can align themselves with the market’s momentum and identify valuable setups.
The Smart Money imbalance framework runs in four steps:
- Trend identification. In SMC, traders usually identify trends by examining market structure: higher highs and higher lows for bullish conditions, lower highs and lower lows for bearish. An Exponential Moving Average (EMA) may be applied as a simpler proxy. A downward-sloping EMA typically indicates a bearish trend, while an upward slope reflects bullish conditions.
- Imbalance formation. A strong displacement move may create an imbalance or fair value gap. Traders often monitor whether price later revisits this area before continuing in the direction of the prevailing trend.
- Order block identification. Traders then identify the last significant countertrend movement before a strong impulsive move. In Smart Money Concepts (SMC), this area is commonly referred to as an order block and may represent a zone where institutional activity previously entered the market.
- Entry point. Some traders wait for price to retrace back into the imbalance or order block after the impulsive move to enter the market in the trend direction. In bullish conditions, attention is usually placed on retracements into bullish imbalance zones; in bearish conditions, traders typically focus on retracements into bearish imbalance zones.
- Risk and exit planning. Stop-loss placement, position sizing, and exit logic are all defined before entry.
Consider following along on live charts in FXOpen’s TickTrader platform for the deepest understanding.
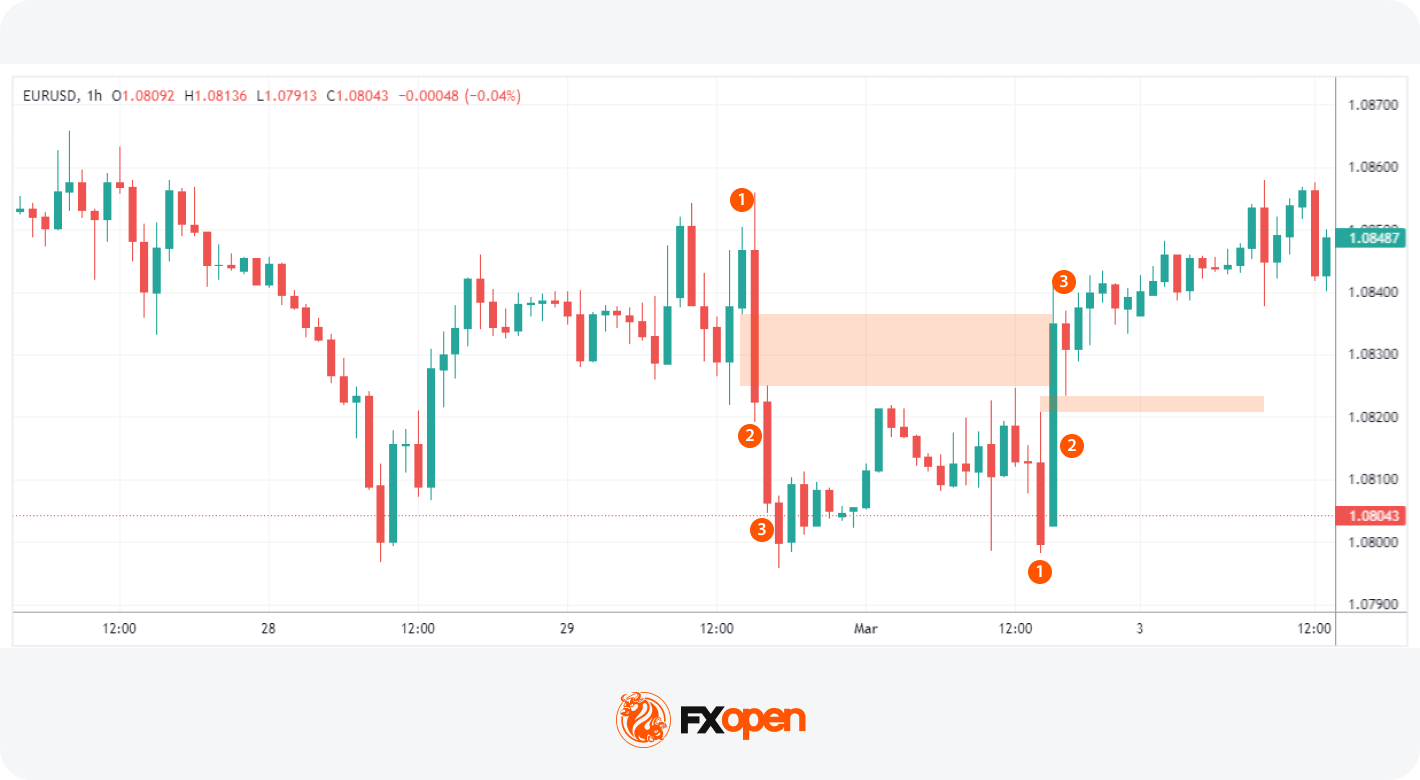
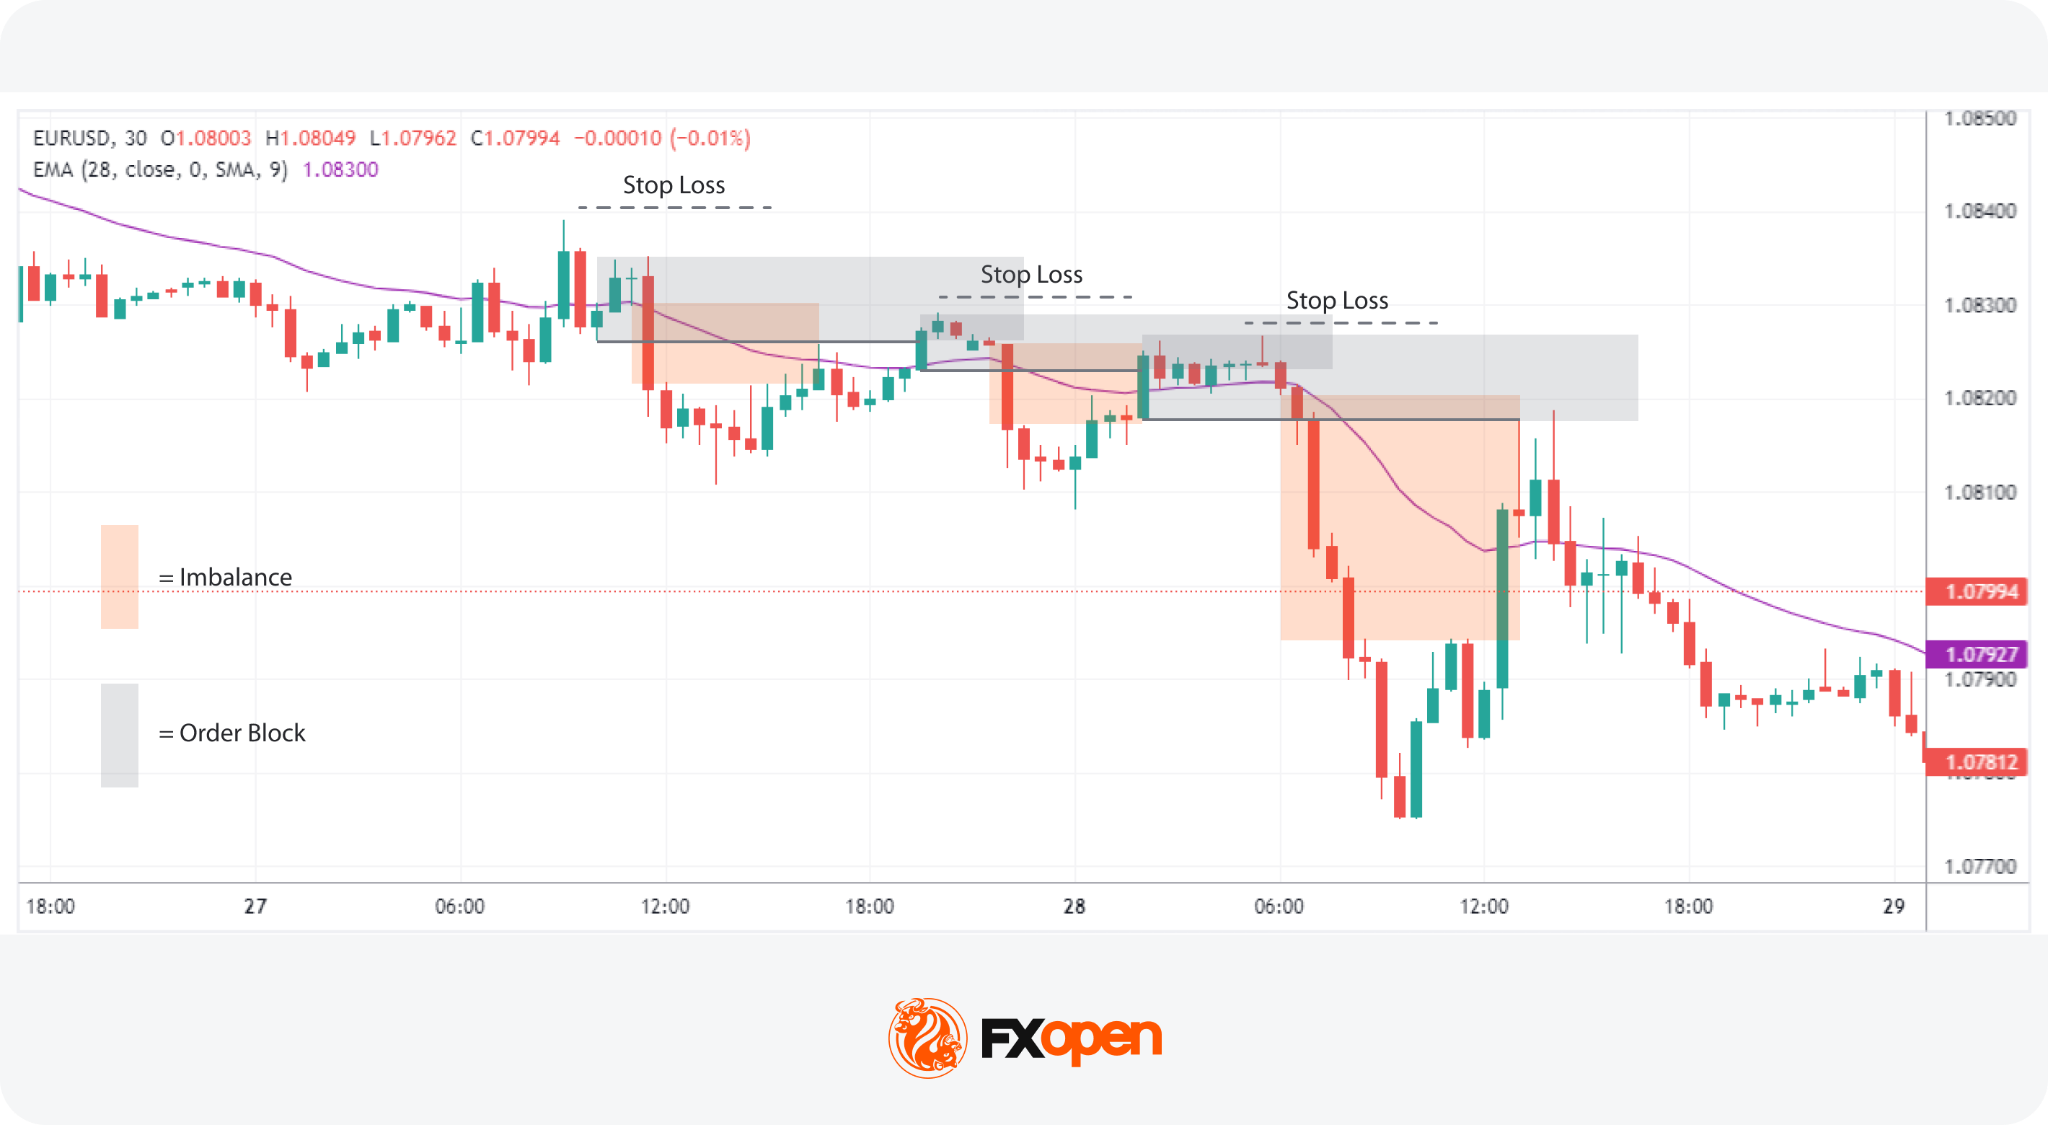
Entry
- Traders identify the market trend using the slope of an EMA.
- They look for an imbalance that results in a new high or low in line with the identified trend.
- The entry point in the trend direction may be set at the high (bullish trend) or low (bearish trend) of the last strong counter-trend candle before the imbalance.
Stop Loss
- A stop loss may be set just beyond the order block. This anchors risk to the structure that triggered the trade rather than an arbitrary pip distance.
Take Profit
- Profit-taking strategies may involve waiting for the price to fill another imbalance or reaching a predetermined technical level.
- To make the most of the trend, traders could employ trailing stops above or below new swing points or follow a longer-term moving average as a dynamic exit radar.
When Not to Trade
Some conditions reduce the reliability of imbalance trading setups:
- Just before major news releases, where volatility may spike and stops may be filled on noise rather than direction.
- When the imbalance forms against the higher-timeframe trend.
- In choppy, range-bound markets where directional bias is unclear.
- When multiple imbalances stack with no clean retracement, making entries harder to define.
Risk Considerations in Imbalance Trading
Imbalance setups offer structure, but they carry the same downsides as any pattern-based approach. Three areas warrant particular attention.
- False signals. Not every imbalance fills. Some price moves continue without retracement, especially during strong trends or trend reversals. A retracement into the zone is not guaranteed.
- News volatility. High-impact data releases can create imbalances that look textbook but resolve in unexpected ways. Slippage and widened spreads during these windows mean stop-losses may be filled at worse prices than expected.
- Overfitting and confirmation bias. Traders sometimes draw imbalances after the fact, marking only the patterns that worked. Without rules defined before the move, the strategy drifts into hindsight pattern-matching rather than systematic trading.
Defining clear entry, stop, and invalidation rules before the trade may support consistency. Risk management may potentially reduce reliance on any single signal when combined with broader structural analysis
Imbalance vs Liquidity
Imbalances and liquidity are linked mechanically. An imbalance forms precisely because liquidity on one side of the order book runs thin, allowing aggressive buying or selling to push price through several levels without resistance.
When aggressive buying or selling outpaces available counterparties at a price level, rapid repricing follows. This is the order flow imbalance in action, and it leaves the visible footprint traders mark as a fair value gap or liquidity void.
What Causes Imbalance in Trading?
Imbalances in forex and CFDs are driven by four main forces: news shocks, institutional flow, sentiment shifts, and technical triggers. Each one shifts the order book in a distinct way, and the order flow impact behind each helps explain why the visible gap forms on the chart. Academic work on market microstructure, including the Bank for International Settlements paper on market liquidity, examines how these forces interact at the deepest level.
High-impact news releases and economic events can quickly skew the balance as traders react en masse to new information, either flooding the market with buy orders or triggering a sell-off. Central bank decisions, inflation prints, and employment data are among the most common triggers. The order flow impact is immediate: liquidity providers widen spreads or pull resting orders, and price gaps to a new level.
Due to their sheer volume, large institutional orders create imbalances by outpacing the market’s ability to absorb them, sharply moving prices in one direction. The order flow impact here is more deliberate. A fund executing a sizable trade may break the order across price levels, but the cumulative pressure still consumes resting liquidity and leaves a visible imbalance behind.
Shifts in market sentiment, driven by broader economic indicators or trending market narratives, can collectively tilt trading activity towards buying or selling, further contributing to order flow imbalance. The shift is often gradual rather than sudden, but the cumulative result still drives one side of the book to dominate.
Technical factors, like prices reaching critical support or resistance levels, can activate automated trading algorithms that rapidly buy or sell, exacerbating the imbalance as these systems execute large-scale trades based on pre-set conditions. The order flow impact tends to be self-reinforcing: a breakout triggers more algorithmic activity, which extends the move and deepens the imbalance.
The Bottom Line
Order imbalances can serve as an indicator of market sentiment, helping traders recognise when supply and demand are not synchronised. By learning how to identify these situations and incorporating them into a structured trading approach, traders may spot potential price moves before they unfold. As with any strategy, combining order imbalance analysis with risk management and other technical tools can support traders when making trading decisions and provide a more balanced view of the market.
If you seek to apply these concepts in real-world scenarios, you can consider opening an FXOpen account, which offers trading with tight spreads and low commissions.
FAQs
What Is Imbalance in Trading?
In trading, an imbalance refers to a situation where buy orders significantly outnumber sell orders, or vice versa, leading to potential shifts in asset prices. This disproportion indicates strong market sentiment towards either buying or selling, impacting price movement direction.
What Causes Imbalance in Forex Markets?
Trade imbalances are primarily caused by significant news releases, large institutional orders, shifts in market sentiment, and technical triggers. These factors can lead to a sudden surge in buying or selling activity, creating an imbalance between supply and demand.
What Is an Imbalance Zone?
An imbalance zone is a specific area on a trading chart where the price has moved sharply, creating a gap known as a fair value gap. This gap signifies a period during which trading volume was minimal, suggesting a potential area for price to return to in the future.
What Is the Order Imbalance-Based Strategy?
The order imbalance-based strategy involves identifying moments when buy or sell orders dominate and using this information to anticipate future price movements. Traders use these imbalances to inform their entry and exit points.
What Is the Difference Between a Fair Value Gap and a Volume Imbalance?
A fair value gap refers to a price area skipped over during rapid market movement, indicating a potential return point for the price. Volume imbalance, however, specifically relates to the difference in volume between buy and sell orders, impacting price direction without necessarily creating a visual gap on the chart.
What Is a Fair Value Gap?
A fair value gap (FVG) is a three-candle pattern where the wicks of the outer two candles fail to overlap, leaving a gap between them. It is one specific form of imbalance and often appears during sharp directional moves. Traders watch FVGs as zones may be revisited before continuing the prevailing trend.
Does Price Always Return to an Imbalance?
No, price does not always return to an imbalance. Many imbalances are filled within hours, days, or weeks, but some remain open indefinitely, particularly those tied to fundamental repricing events such as central bank decisions or major economic shifts. Traders treat imbalance fills as probable rather than guaranteed and combine them with broader structural analysis.
What Is the Difference Between Imbalance and Order Block?
An imbalance is the visible gap or thin zone left after a strong directional move. An order block is the last opposing candle before that move, where institutional orders are thought to have been placed. The order block is the cause, the imbalance is the effect. Traders often look for both elements to align before entering.
How Is Imbalance Identified on a Chart?
Imbalance is commonly identified through strong displacement candles, fair value gaps, or areas with limited candle overlap. Traders often look for rapid directional movement, breakout conditions, and low-interaction price zones that suggest the market moved too quickly to establish balanced trading activity.
What Timeframes Are Used for Imbalance Trading?
Imbalance trading is applied across all timeframes, from 1-minute charts up to the weekly. Higher timeframes such as 4-hour, daily, and weekly tend to produce stronger imbalances. Lower timeframes are typically used for entry refinement once a higher-timeframe imbalance has been located. Multi-timeframe analysis sits at the core of the approach.
*Important: At FXOpen UK, Cryptocurrency trading via CFDs is only available to our Professional clients. They are not available for trading by Retail clients. To find out more information about how this may affect you, please get in touch with our team.
This article represents the opinion of the Companies operating under the FXOpen brand only. It is not to be construed as an offer, solicitation, or recommendation with respect to products and services provided by the Companies operating under the FXOpen brand, nor is it to be considered financial advice.


Payward, the parent of cryptocurrency exchange Kraken, is cutting 150 jobs ahead of its planned U.S. stock-market listing. The reduction affects about 5% of its 3,000-person global workforce.
The move forms part of a broader optimization push aimed at improving margins. Management wants a leaner financial profile before going public.
Layoffs Continue a Multi-Year Lean-Out
The latest cuts extend a sustained workforce reduction that began in October 2024. Payward eliminated about 400 roles then, or roughly 15% of staff.
The reduction followed shortly after Arjun Sethi joined David Ripley as co-CEO. Further cuts then followed in early 2025 as the company merged overlapping teams.
A Payward spokesperson declined to address specific personnel decisions. The company continually evaluates its structure to align talent with strategic priorities.
Meanwhile, hiring continues in select growth areas, including derivatives, payments, and tokenized assets.
Workforce optimization has become a common pre-IPO playbook for crypto firms. Therefore, trimming costs strengthens key profitability metrics that public investors scrutinize.
IPO Plans Remain on Hold
Payward filed a confidential S-1 registration statement with the SEC in November 2025. The filing targets a public valuation near $20 billion.
However, the firm paused its listing timeline in March 2026. Weaker performance among recent crypto listings had cooled investor appetite.
Co-CEO Arjun Sethi has publicly stated the company is roughly 80% ready to go public. His comments signal the S-1 remains active despite the delay.
Meanwhile, Payward continues to expand through acquisitions, including NinjaTrader for derivatives and Reap Technologies for stablecoin payments.
Payward closed an $800 million funding round at the time of the SEC filing. The round established the $20 billion valuation now informing IPO discussions.
The financing followed a wave of secondary investments from traditional finance partners.
Whether Payward returns to the IPO queue this year may hinge on how the next wave of crypto listings performs.
The post Kraken Parent Payward Makes Deep Cuts as IPO Pressure Mounts appeared first on BeInCrypto.


CME Group and ICE have reportedly warned the CFTC and Capitol Hill officials that Hyperliquid’s decentralized perpetual futures platform could enable market manipulation and sanctions evasion.

Augustus Bank’s CEO, Ferdinand Dabitz, says legacy clearing banks cannot truly rebuild their cores for artificial intelligence and programmable money, as his startup moves closer to launching a US national bank designed around both.
The Office of the Comptroller of the Currency (OCC) granted conditional approval for Augustus Bank N.A. on Monday under the Guiding and Establishing National Innovation for US Stablecoins (GENIUS) Act, which created a federal framework for payment stablecoins and clarified how banks and certain nonbank entities can issue and integrate dollar-pegged tokens under federal oversight.
Augustus now plans to establish a full-service national bank in Dallas, Texas, focused on fully reserved stablecoins, AI-driven compliance and automation-heavy back-office processes. Dabitz told Cointelegraph it was just “a couple of months” from full approval and launch. However, final approval remains subject to pre-opening conditions.
The company is targeting the “broken” correspondent clearing business dominated by global banks such as Citi, arguing that incumbents cannot fully re-platform systems built for humans, not machines, that still close on weekends and rely on decades-old cores.
“The short answer is replacing them,” Dabitz said when asked whether Augustus could coexist alongside traditional clearing banks.
Augustus bets stablecoins and AI can remake clearing
Augustus began life in Berlin in 2021 as Ivy, a euro-clearing fintech that built a transaction banking platform for non-US financial institutions, fintechs and crypto firms.
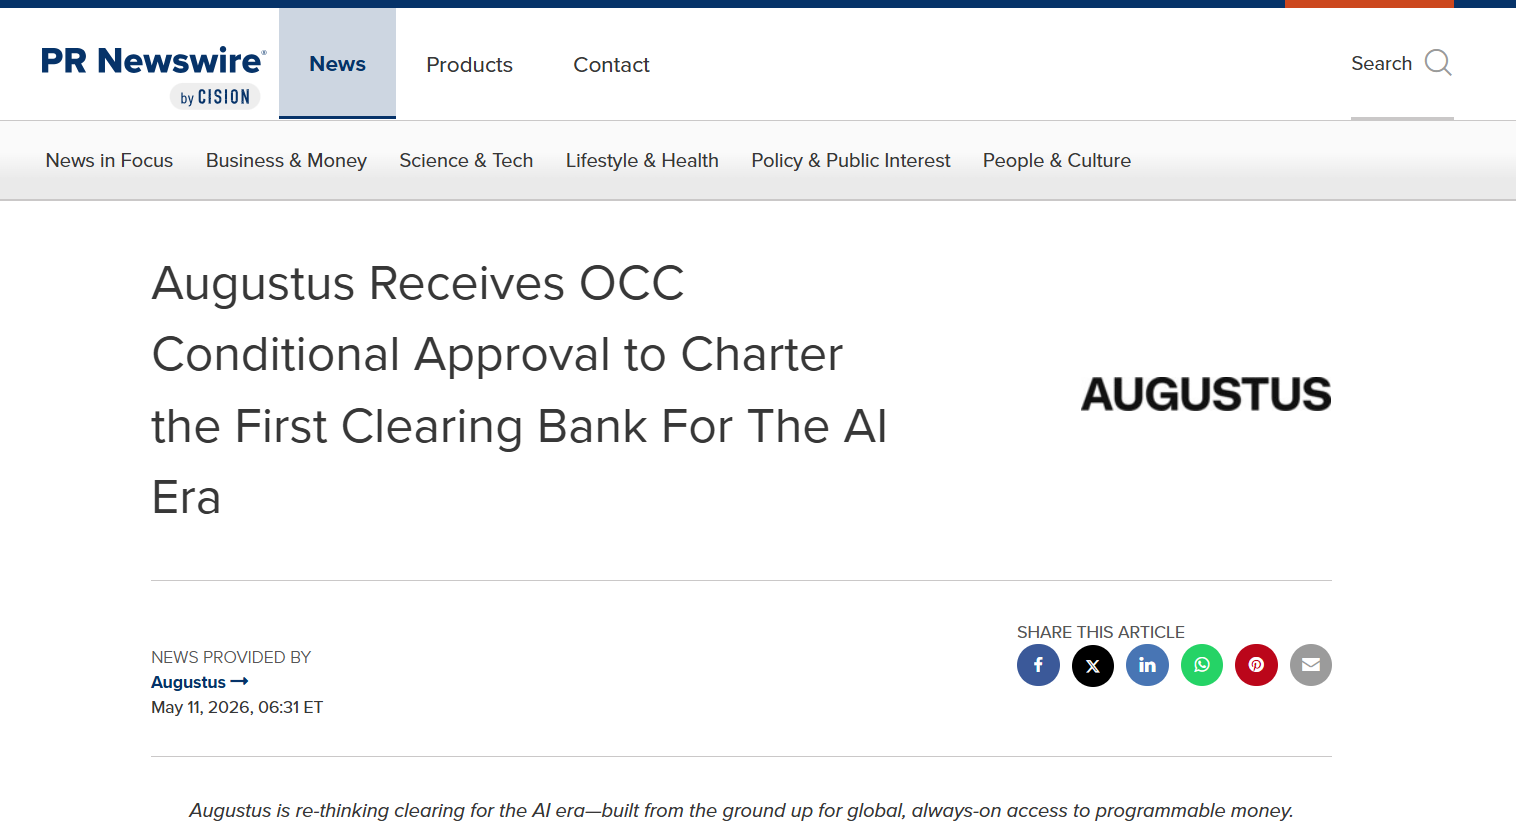
Augustus received conditional OCC approval this week. Source: PR Newswire
The bank already runs euro payments and instant settlement for clients, including crypto exchange Kraken. “The clearing bank bond is truly broken,” he said, arguing there’s an opportunity to “rethink it as an application and deliver something pretty terrific.”
Related: JPMorgan to launch tokenized money market fund for stablecoin issuers
Central to Dabitz’s pitch is the belief that large banks can upgrade legacy infrastructure but cannot fundamentally rebuild around AI and tokenized money. “I’ve come to the conclusion it’s impossible to re-platform a bank,” he said.
Augustus plans a three-layer stablecoin model: using stablecoins as a funding rail for payments, as a treasury and liquidity tool to release what Dabitz estimates is around $3 trillion in trapped idle capital, and as the interface layer for AI agents interacting directly with money.
He said the model could enable real-time treasury optimization and allow AI systems to become “first-class customers” of the bank, handling tasks such as liquidity management and transaction monitoring on behalf of corporates.
Competition from banking giants
Dabitz’s argument comes as major banks accelerate their own AI and digital asset initiatives.
JPMorgan Chase says it invests more than $18 billion annually in technology, including AI, and Citi reported over $6.1 billion in clearing-related revenue in Q1 alone, highlighting the scale of the incumbent profit pool Augustus is targeting.
Dabitz argues his team can still move faster because it is designing AI and stablecoin workflows into its operating model from the outset rather than retrofitting existing systems.
Related: Argentine banks testing JPMorgan’s JPM Coin to speed up settlements: Report
He also described the US banking market as structurally under-innovated, noting that banking is unusually labor-heavy compared with other major industries, with people rather than assets forming a major part of operating costs.
Pushing AI deeper into banking operations
Augustus wants to compress processes such as transaction monitoring, case handling and suspicious activity reporting from “20 hours to 20 minutes” using AI, with humans supervising the systems rather than manually performing every step.
Critics question whether a young, AI-focused bank with a 25-year-old leader at its helm can safely automate compliance-heavy operations without introducing model risk, explainability problems or operational failures.
Dabitz said that only makes the challenge “more exciting” and that the company plans to work closely with regulators and banking executives to ensure “the checks and balances and the harness for the AI to operate in a safe and sound manner.”
Magazine: Bitcoin will not hit $1M by 2030, says veteran trader Peter Brandt

THORChain developers announced that one of six Asgard vaults was compromised, resulting in approximately $7.4M in unauthorized outbound transactions before the network halted signing activity.


Tokenized ETFs have crossed $430 million in total onchain market cap, with Ondo Finance’s IVVon token surging 150% in the past month on Ethereum.


Gemini’s “agentic trading” lets AI models like ChatGPT and Claude plug into user accounts via MCP, executing crypto trades autonomously and turning AI from signal vendor into primary CEX client.
Summary
- Gemini has wired its full trading API into Anthropic’s Model Context Protocol, so compatible AI agents can pull market data, query order books, place orders and manage positions directly from user‑linked accounts.
- Users set budgets, strategies and caps, while modular “Trading Skills” give agents DCA, grid, multi‑leg and risk tools, making a growing slice of Gemini’s resting and market orders originate from opaque, black‑box models.
- Unlike TON’s non‑custodial “Agentic Wallets,” which push autonomy to Telegram edge wallets, Gemini centralizes agentic activity inside a regulated CEX perimeter, recasting AI as a client type that humans merely configure.
Gemini has rolled out “agentic trading,” a feature that lets AI systems like ChatGPT and Claude connect directly to user accounts and execute crypto trades autonomously on the exchange, rather than just spitting out trade ideas for humans to click. The move quietly shifts AI from being a glorified signal service to being a client class in its own right, with opaque, proprietary models now sourcing, routing, and managing a chunk of CEX order flow on their own.
According to Gemini’s own blog, “agentic trading means your AI agent acts on your behalf — placing trades, monitoring markets, and managing risk automatically,” with users defining strategies and constraints while the agent handles execution. Under the hood, Gemini has integrated its full trading API with the Model Context Protocol (MCP), an open standard originally built by Anthropic that lets AI agents call external tools and services; compatible models include Claude and ChatGPT, which can query markets, place orders and adjust positions over time. Third‑party write‑ups emphasize that Gemini is the first regulated US exchange to expose a dedicated “agentic” interface, turning centralized exchange infrastructure into a native venue for autonomous trading agents rather than just human click‑flow and traditional algos.
Gemini heats up the AI race
Practically, the system is built around modular “Trading Skills” — pre‑built functions AI agents can invoke to get real‑time market data, inspect order‑book depth and spreads, and pull historical candle data, with more complex order‑routing and risk modules promised over time. Users link their accounts to an AI model via MCP, set budget and risk limits, and then let the agent run strategies that can range from simple DCA or grid trading to multi‑leg structures and volatility plays, with Gemini stressing that “human oversight remains part of the design” through caps and rules. But the microstructure implication is obvious: once enough people plug in agents and walk away, a material share of resting and market orders on Gemini will be coming from black‑box models tuned to optimize for particular objectives, not from human decision cycles.
That changes who you are actually trading against. Historically, the story was “retail vs HFT vs a few prop‑shop algos”; now Gemini is effectively advertising “AI as a client type,” more akin to how prime brokers have algorithmic clients that are not directly human‑decisioned on each trade. In high‑volatility periods, tightly coupled agent strategies can amplify feedback loops — especially if many users are copying off the same “AI signals” or fine‑tuning similar models on overlapping data — and you can easily imagine clusters of agents front‑running naive human behavior or unintentionally engaging in coordinated patterns that look a lot like cartelized flow.
There is a clean contrast here with TON’s on‑chain “Agentic Wallets.” TON is pushing autonomy to the network edge: agents live in Telegram, manage non‑custodial wallets on TON, and interact with DeFi directly on an L1. Gemini is doing the opposite: recenters agentic trading inside a regulated, custodial CEX, where AI agents are tightly coupled to one exchange’s API and compliance perimeter. In both cases the future is the same: the next “HFT villain” in crypto will not be a named firm on the other side of your order, but a swarm of un‑audited models, systematically optimized around the fee, tax and KYC constraints their operators face — and increasingly treated by the infrastructure itself as the primary customer, with humans demoted to parameter‑setters and occasional override buttons.


Dogecoin price debate heats up as Poly Truth and Meme Punch enter cheap crypto conversations in 2026.
Disclosure: This article does not represent investment advice. The content and materials featured on this page are for educational purposes only.
Summary
- Dogecoin remains a popular low-cost crypto, but newer presales like PTRUE and MEPU are gaining attention.
- Poly Truth combines AI-powered prediction analysis, staking rewards, and audited smart contracts in its presale.
- Meme Punch blends memecoin culture with a PvP battle game where players earn and spend MEPU tokens.
The search for a Dogecoin price prediction picks up every May, and 2026 is no different. DOGE is still one of the most recognized names in crypto, and the price keeps it well within “cheap crypto” territory.
The question is whether DOGE is still the smartest cheap pick, or whether other low-cost projects deserve more attention. Names like Poly Truth (PTRUE) and Meme Punch (MEPU) are starting to show up in the same conversations.
Dogecoin price prediction May 2026
DOGE is currently sitting around $0.11, and the short-term outlook for May points to a mixed but mostly recovering month. According to Changelly, the first half of May looks softer, with the price dipping as low as $0.108 around May 22 before turning back up.
The second half is where things get more interesting. From around May 25 onward, the forecast shows steady gains almost every day, reaching about $0.129 by May 31. That works out to roughly a 12% rise from current levels by the end of the month.
So the picture for DOGE in May isn’t a straight run. It starts slow, takes a small dip mid-month, then builds momentum into the final week.
A few things could help that momentum hold. Spot DOGE ETFs are already live, and any pickup in inflows would give the price a real lift. The same goes for any movement on X Money adding DOGE as a payment option, which has been talked about for months.
Is DOGE still the best cheap crypto to buy?
DOGE is still extremely cheap per token. Anyone can purchase a stack of coins for a few dollars, which contributes to its following.
However, DOGE is no longer cheap in terms of market capitalization. It is already among the top ten coins with a value of more than $17 billion. Because the amount of money required to double the price has increased along with it, it is much more difficult to replicate the kind of returns it produced in 2021 at this size.
The trade-off is that. Although DOGE offers a cheap entry fee and a well-known brand, there is less space for expansion than in the past. Smaller projects are beginning to close the gap for buyers looking for cheap tokens with greater potential.
Two cheaper picks worth knowing
Two projects worth a closer look for those who are after smaller market caps and more growth potential.
Poly Truth (PTRUE)
Poly Truth is an AI-powered research tool for prediction markets. Drop in any active prediction event, like an election or a sports final, and the platform digs through news, market data, and community signals to figure out the most likely outcome.
The whole thing runs on a three-part system. Scrapers pull the data, an AI analyst weighs it and works out the probabilities, and the final report shows which outcome has the strongest case and why.
What stands out about PTRUE:
- Real product – The tool is the project, not a future promise.
- Tiered access – Bigger holders unlock more features inside the platform.
- Staking during presale – Holders can stake their tokens to earn rewards before launch.
- Audited – Both SolidProof and Coinsult have audited the contract.
- Locked team tokens – 12-month vest with a 3-month cliff.
The token is currently in Stage 1 of the presale at $0.001190, with the next price step at $0.001216.
Meme Punch (MEPU)
Meme Punch puts a different spin on memecoins. Instead of asking the investor to buy and hold, it builds the meme into a game they can actually play.
The setup is a medieval battle arena where five of the most familiar meme characters in crypto, Pepe, Doge, Floki, Brett, and Pudgy Penguin, fight each other in PvP combat. Pick a character, jump into battles, and climb the leaderboard. Winning earns MEPU, and the token can also be spent inside the game on weapons, skins, and special powers.
That makes MEPU one of the few meme tokens with actual in-game utility. It’s a currency players use, not just a coin sitting in a wallet.
The basics:
- Built on Ethereum, with a total supply of 10 billion
- Presale takes 40%, with staking and game rewards together taking another 24%
- Payment options cover ETH, BNB, SOL, USDT, USDC, and card
Final thoughts
Any Dogecoin price prediction for May 2026 points to a slow but mostly positive month, with most of the gains showing up in the final week. DOGE is still cheap on a per-token basis, but the room left to grow isn’t what it used to be.
That’s why picks like Poly Truth (PTRUE) and Meme Punch (MEPU) are worth knowing about. Smaller market caps, real products behind them, and more upside if either one delivers.
Frequently asked questions
How high will Dogecoin go in 2030?
Most long-term forecasts put DOGE between $0.30 and $1 by 2030, depending on ETF flows and adoption. Smaller picks like Poly Truth (PTRUE) and Meme Punch (MEPU) tend to come up for buyers chasing bigger returns over the same window.
Will Dogecoin reach $1 dollar?
A $1 DOGE would need a market cap close to $150 billion, which is doable in a strong bull cycle but far from certain. Early-stage tokens like $PTRUE and $MEPU have more room to deliver bigger percentage moves.
What will Dogecoin be worth in 5 years?
Forecasts land mostly between $0.40 and $1.50, depending on which model to look at. The same window is usually where presale picks like PTRUE and MEPU either prove themselves or fade.
Can Dogecoin reach $3 dollars?
$3 would push DOGE past $400 billion in market cap, which isn’t realistic without a massive shift in supply or demand. That kind of return is more often found in low-cap projects, which is where PTRUE and MEPU come into the conversation.
Disclosure: This content is provided by a third party. Neither crypto.news nor the author of this article endorses any product mentioned on this page. Users should conduct their own research before taking any action related to the company.

Four months after Elon Musk pledged to open-source X’s recommendation algorithm and refresh it every four weeks, the official xai-org repository still shows one commit. Crypto users are calling the release theater, not transparency.
The promise dates to January 10, when Musk said the code would publish within seven days and refresh monthly with detailed developer notes. The repository went live on January 17 and has not been touched since.
Promised Monthly Updates Never Arrived
The xai-org/x-algorithm repository contains four components, written 62.9% in Rust and 37.1% in Python. None has received a follow-up commit.
The developer notes Musk promised alongside each refresh have not appeared either. A similar 2023 release from the old twitter/the-algorithm repo received the same complaints before going dormant.
That silence lands during the same months crypto users have logged repeated complaints about suppressed reach on the platform.
“The algorithm is the worst it’s ever been. All I see is politics, rage bait, engagement bait and like 10% crypto content. Communities are dying and this app is becoming Instagram 2.0 when infact it’s best feature was the fact communities formed around topics and you stayed largely within that community on your feed,” Ethan, a market watcher, observed.
Ethereum co-founder Vitalik Buterin had publicly questioned whether X could meet the transparency standard before the repo even shipped.
The Numbers That Actually Rank Posts Are Missing
The published code shows the final score formula but not the weights attached to each predicted action.
The Phoenix module README states its transformer is “representative of the model used internally with the exception of specific scaling optimizations,” an admission the deployed system differs from what readers can audit.
Crypto critics also note the model learns from negative signals like reports and blocks, which turns coordinated bots into a working suppression vector.
Decentralized alternatives like Farcaster publish full forkable protocols, not sample code no one can verify against production.
What the next four weeks deliver, if anything, will say more about Musk’s transparency posture than the original repo upload ever did.
“Critique of the X algorithm is welcome. There will be monthly updates of the latest algorithm to GitHub with release notes. As reminder, you can always choose no algorithm via the Following tab,” Musk assuaged.
The post X Algorithm Repo Sits at One Commit 4 Months After Open-Source Promise appeared first on BeInCrypto.
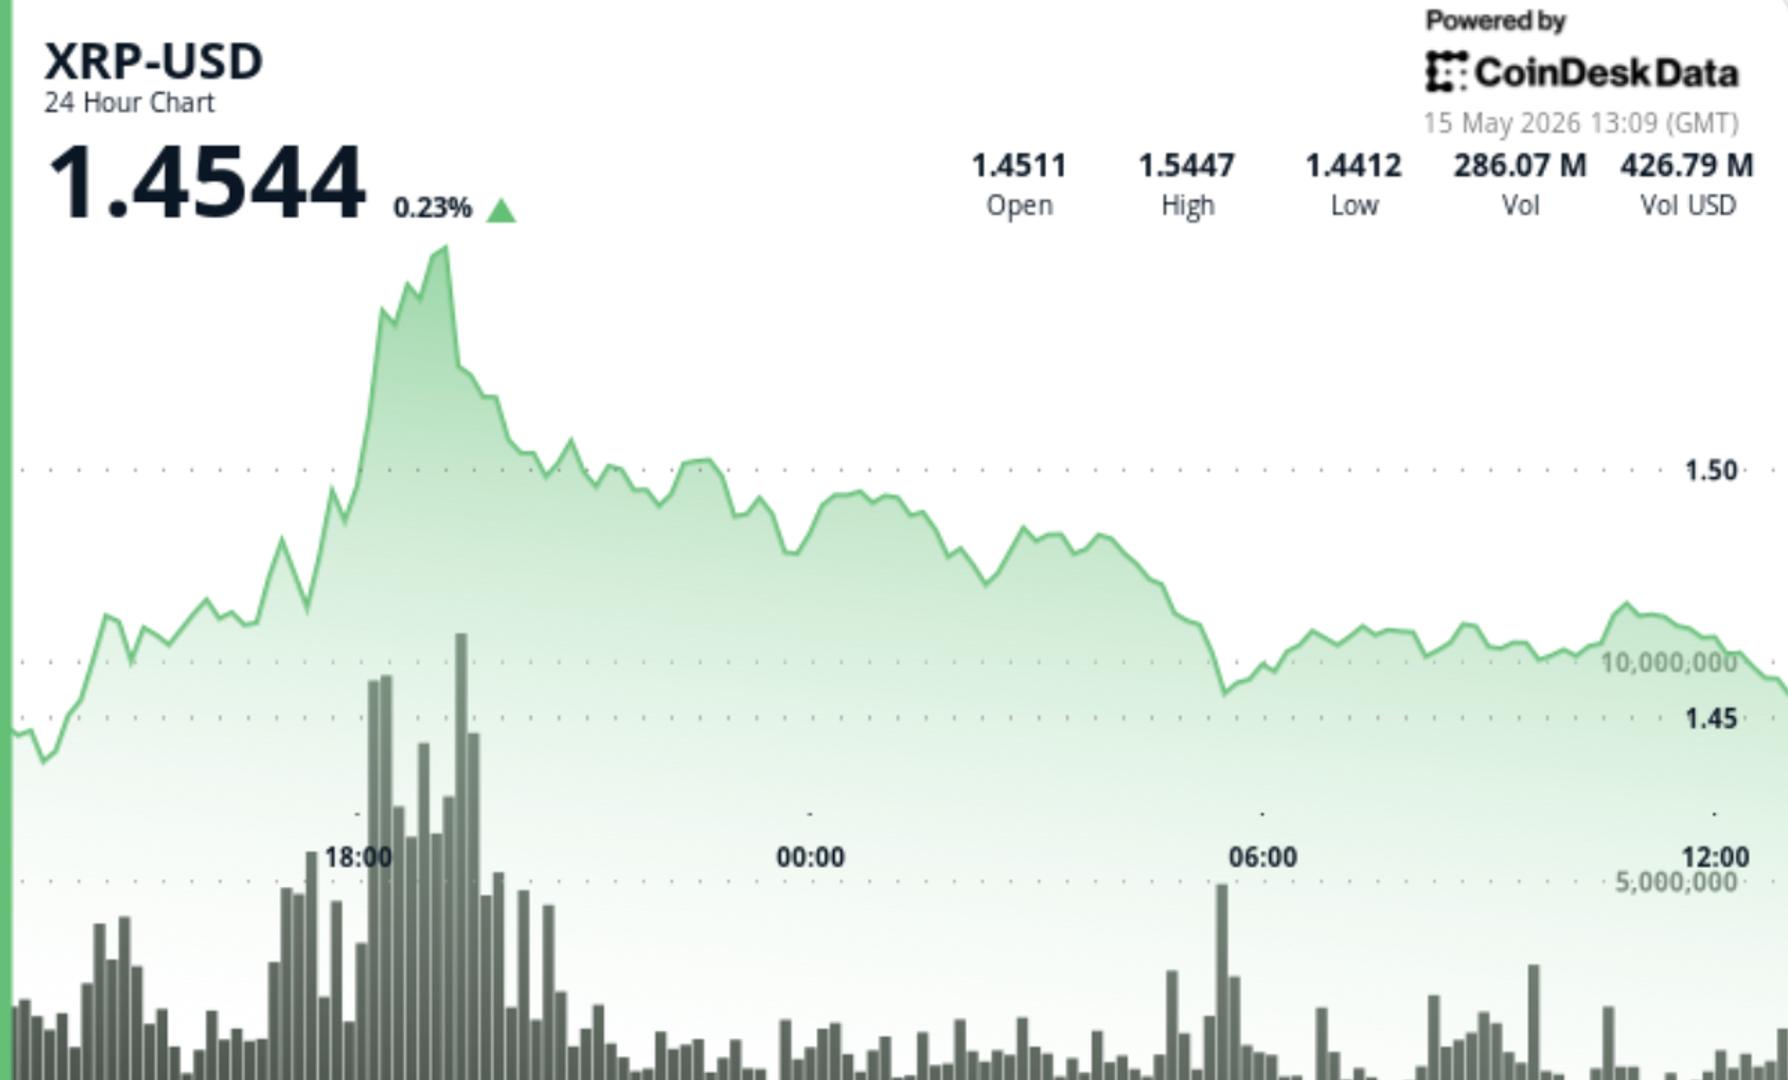

XRP stayed pinned below resistance even as derivatives activity surged ahead of a key Senate vote that could formally reinforce the token’s commodity status.
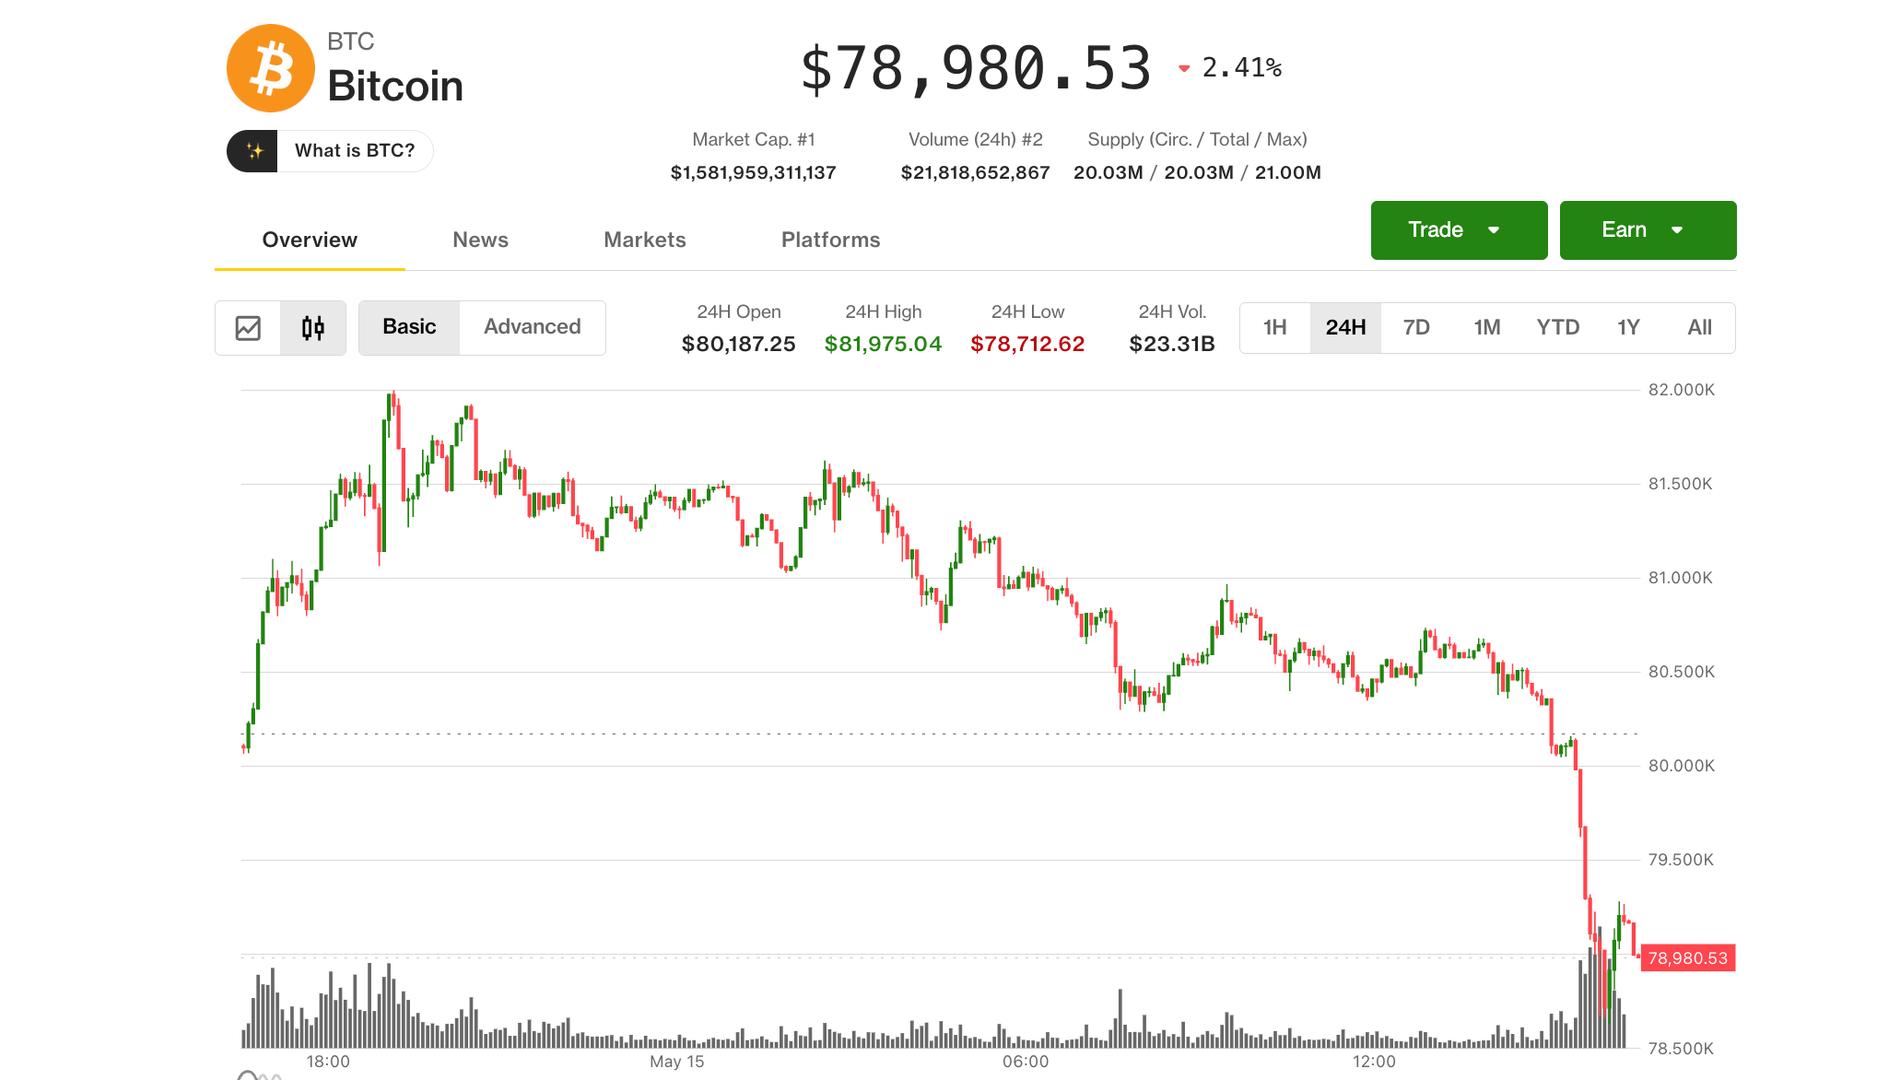

Stocks, gold and crypto slide while crude oil tops $100 and traders rapidly reprice Fed expectations for rate hikes.

Hacking Hard Drive Firmware | Hackaday

H&R Real Estate Investment Trust (HR.UN:CA) Q1 2026 Earnings Call Transcript

Kraken Parent Payward Makes Deep Cuts as IPO Pressure Mounts
Manchester United reach agreement with Casemiro over contract clause amid transfer speculation

US brings back mandatory military draft registration

Steven Gerrard disagrees with Gary Neville over ‘shock’ Chelsea and Arsenal claim | Football

CLARITY Act Vote LIVE Today: Game Changer for Bitcoin & Crypto Regulation

#minecraft #lifeisbutadream #dream #cryptocurrency #minecraftsurvivalseriesepisode1 #fyp #trading

Gold vs Delhi Property #shorts #finance #gold #money #education
-

 Fashion7 days ago
Weekend Open Thread: Marianne Dress
-

 Fashion4 days ago
Coffee Break: Travel Steam Iron
-

 Fashion5 days ago
What to Know Before Buying a Curling Wand or Curling Iron
-

 Politics4 days ago
What to expect when you’re expecting a budget
-

 Tech5 days ago
Auto Enthusiast Carves Functional Two-Stroke Engine from Solid Metal
-

 Politics6 days ago
Politics Home Article | Starmer Enters The Danger Zone
-
 Business6 days ago
Ignore market noise, India’s long-term story intact, say D-Street bulls Ramesh Damani and Sunil Singhania
-

 Tech4 days ago
GM Agrees To Pay $12.75 Million To Settle California Lawsuit Over Misuse Of Customers’ Driving Data
-

 Crypto World5 days ago
CZ says US crypto rivals tried to block Trump pardon
-

 Crypto World6 days ago
PROS explodes 48% as Upbit and Bithumb listings ignite demand
-

 Tech4 days ago
GM agrees to $12.75M California settlement over sale of drivers’ data
-

 Entertainment7 days ago
YNW Melly Denied Bond Again Ahead Of Double Murder Retrial
-

 Crypto World7 days ago
Kraken Parent Seeks OCC Charter, Signaling Regulated Banking Access
-
Crypto World7 days ago
The Hantavirus Danger: Can a Potential Outbreak Spark a New Meme Coin Frenzy?
-
Crypto World2 days ago
Bitcoin Suisse expands with Digital Asset License and Investment Business Act Registration Approval in Bermuda
-

 Sports7 days ago
Why Nathan Mackinnon Remains the Hart Trophy Favourite over Connor McDavid and Nikita Kucherov | NHL
-

 Sports7 days ago
After Waka Waka, Shakira now drops first teaser for FIFA WC 2026 song | FIFA World Cup 2022
-
 Crypto World7 days ago
Solana UFO Meme Coins Surge After Pentagon Reveals Alien Files
-

 Entertainment7 days ago
Bethenny Frankel Says She Loves ‘Torturing’ Men
-

 Politics3 days ago
Pakistan to enter Chinese capital market as war inflation bites
You must be logged in to post a comment Login