

Crypto World
Bitcoin (BTC) Price: Senate Backs CLARITY Act as Macro Pressures Mount

Key Highlights
- Senate Banking Committee passed the CLARITY Act with bipartisan support (15-9), triggering widespread optimism across crypto social channels.
- Sentiment analysis from Santiment reveals bullish-to-bearish ratio of 1.55:1, though the platform cautions against following crowd psychology.
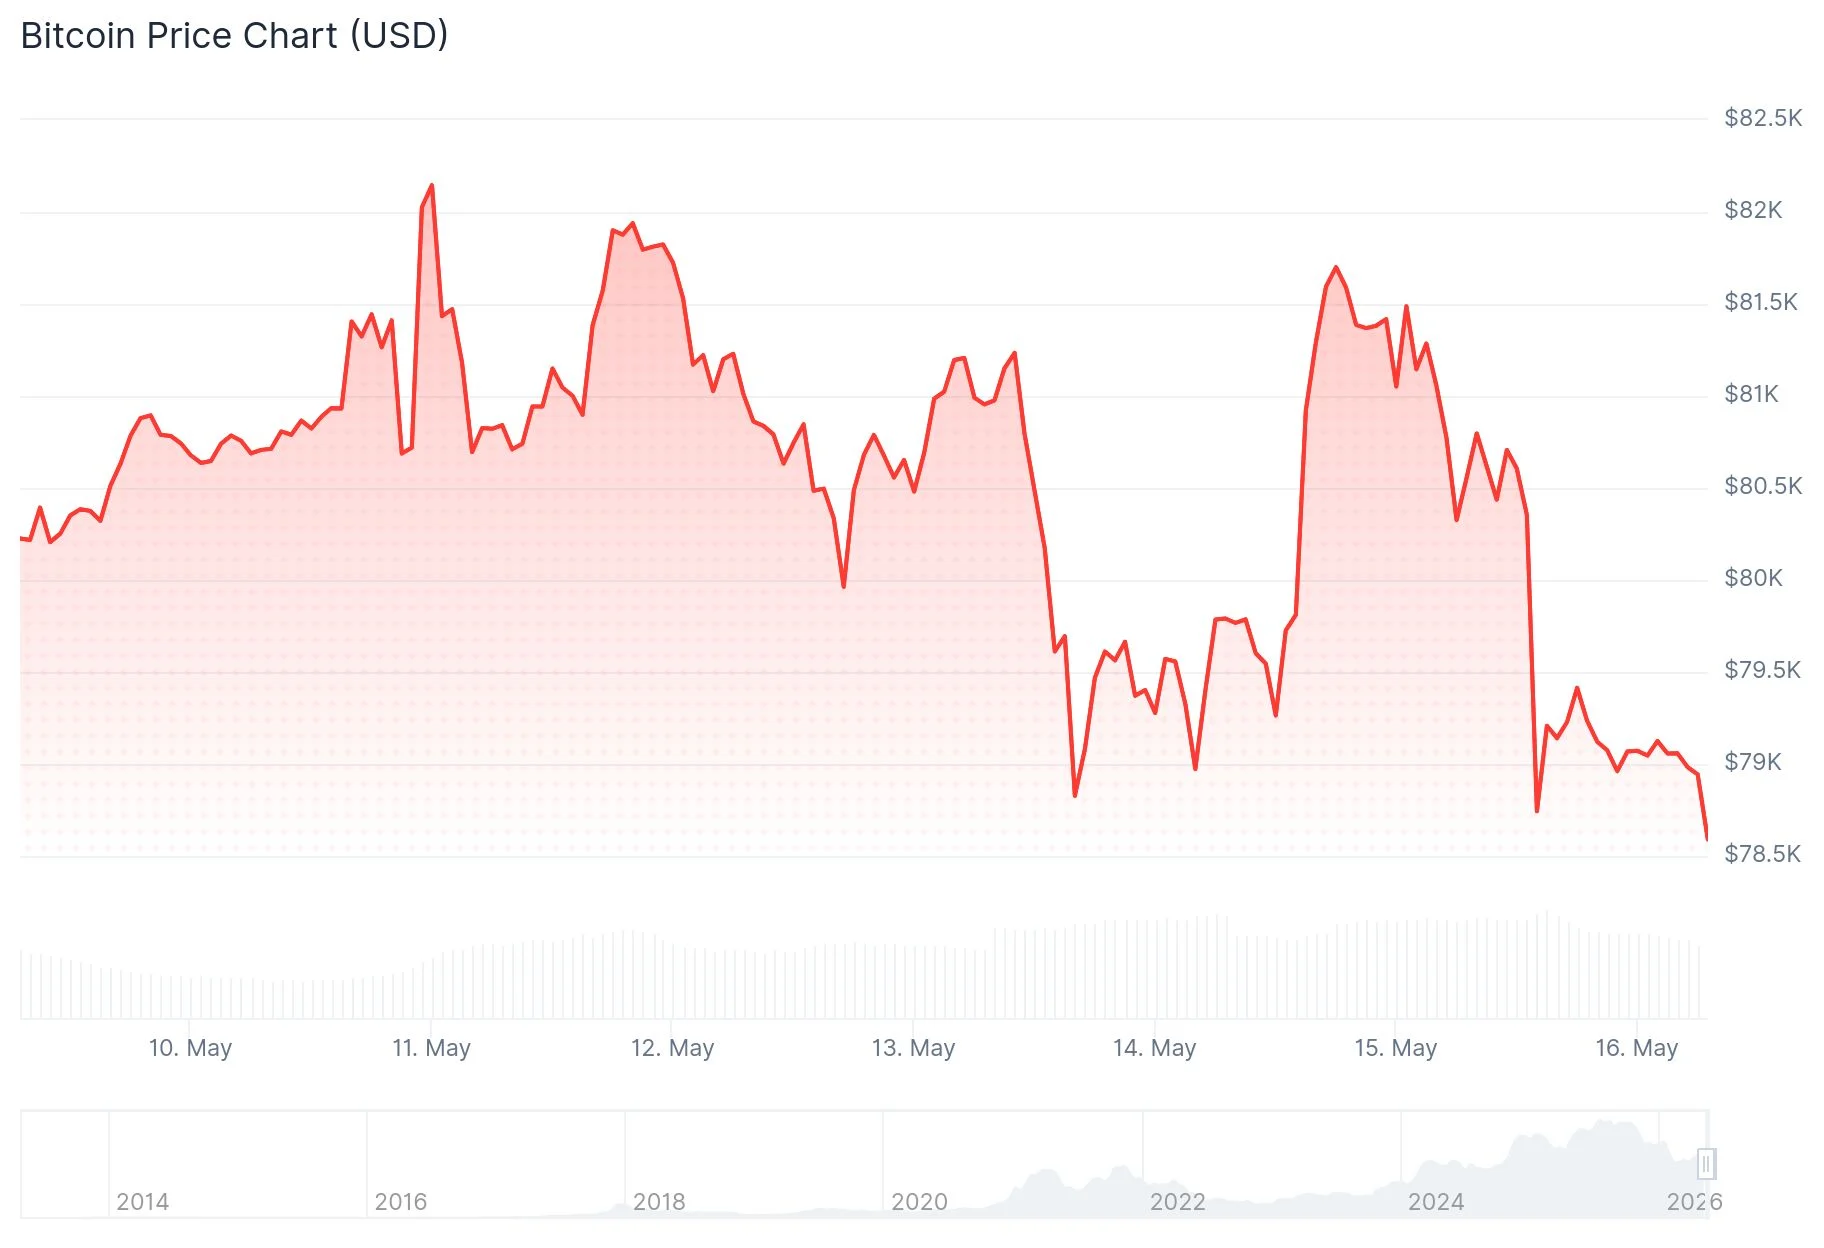
- BTC trades in the $79K-$80K range, showing a modest 3% gain since the start of May, yet remains down approximately 23% year-over-year.
- The 10-year US Treasury yield climbed above 4.55%, creating downward pressure on Bitcoin and broader risk assets.
- Spot Bitcoin ETFs experienced $290.4 million in net withdrawals on May 15, per CoinCentral data.
Bitcoin continues to consolidate around the $80,000 threshold as competing forces — positive regulatory developments and challenging macroeconomic conditions — create a tug-of-war in the marketplace.
The week’s headline development centers on the Senate Banking Committee’s advancement of the Digital Asset Market Clarity Act, commonly referred to as the CLARITY Act, which passed by a 15-9 margin. The measure received unanimous support from all 13 Republican committee members along with two Democrats, while nine Democrats opposed the bill.
Crypto analytics firm Santiment characterized the social media response as showing “a major spike of euphoria.” According to their metrics, positive commentary about Bitcoin currently outpaces negative sentiment by a ratio of 1.55 to 1.
Yet Santiment accompanied this observation with a cautionary note. “We advise caution. Markets typically move opposite to the crowd’s expectations at all times,” the company stated via their X platform.
White House digital asset advisor Patrick Witt offered measured commentary as well. Describing the committee’s decision as “a major step forward,” Witt emphasized via X that “there’s more work to be done before this legislation is ready for prime time.”
Conversely, Michael van de Poppe from MN Trading Capital struck an optimistic tone. In a Friday X post, he characterized the CLARITY Act as “the biggest, and historical, bill for the entire industry,” suggesting it “can be a strong trigger for the upcoming bull market.”
Santiment offered additional perspective, suggesting the bill’s passage could attract institutional capital that has remained dormant amid regulatory ambiguity. However, the firm also cautioned that significant cryptocurrency price movements may already be “baked in” ahead of any official legislation signing.
Macro Headwinds: Rising Yields and ETF Withdrawals
The broader financial landscape presents a more nuanced picture. Friday saw the 10-year US Treasury yield push beyond 4.55% — marking its peak since May 2025. Meanwhile, the 30-year bond yield reached 5.12%, a level not witnessed since June 2007.
As bond yields climbed, Bitcoin retreated below the $80,000 threshold during New York trading hours, tracking movements in US equity markets. The S&P 500 similarly surrendered its weekly gains. Bitcoin registered 24-hour losses ranging from 2.43% to 2.68% depending on the data provider.
Investment vehicle flows painted an additional bearish picture for May 15. Bitcoin ETFs collectively experienced $290.4 million in net redemptions. Ethereum ETFs saw $65.7 million in outflows, while Solana ETFs registered neutral activity with zero net movement.
The Crypto Fear & Greed Index registered 31 on Saturday, placing market sentiment firmly in “Fear” territory.
Technical Perspective Remains Constructive for Some
Not all market observers are adopting a defensive stance. Analyst Kaleo highlighted on X that Bitcoin’s support levels have been progressively rising throughout the year. “Have you noticed throughout the year the figure they’re using for the lower end keeps climbing higher and higher?” he observed. “New all time highs are still on the table this year. Zoom out and keep stacking.”
Bitcoin’s 200-day exponential moving average currently stands at $82,941, a technical level that has repeatedly rejected upward price attempts during the recent rally phase.
BTC trades approximately 30% beneath its October 2025 record high. As of this writing, Bitcoin is valued at roughly $79,084, representing a 3.15% increase since the beginning of May.


The CLARITY Act cleared the Senate Banking Committee 15 to 9 on May 14, but analysts say significant obstacles remain before it can become law.
Summary
- The CLARITY Act cleared the Senate Banking Committee in a 15 to 9 bipartisan vote, with all 13 Republicans and two Democrats voting in favour.
- The bill still needs 60 Senate floor votes, a resolved ethics provision and reconciliation with the House version before reaching Trump’s desk.
- TD Cowen analysts said they remain pessimistic, as Democrats will demand a vote on a conflict of interest amendment Republicans do not want.
The CLARITY Act cleared the Senate Banking Committee in a 15 to 9 bipartisan vote on May 14, its most consequential legislative step since the House passed a similar version by 294 to 134 in July 2025. The vote was secured at the last moment after Chairman Tim Scott used a procedural maneuver to admit further amendments, bringing two Democrats across the aisle alongside all 13 Republicans.
All 13 Republicans voted yes. Democratic Senators Ruben Gallego of Arizona and Angela Alsobrooks of Maryland joined them, though both qualified their support. “My vote today is a vote to keep working in good faith,” Alsobrooks said. “We still have so much work to do.” Gallego warned he was “not afraid to vote no” on the Senate floor if an ethics deal is not reached.
Analysts warn the real fight starts now
GSR Chief Legal and Strategy Officer Joshua Riezman said before the vote that the odds of the CLARITY Act reaching the president’s desk this session were below 50%. TD Cowen was sharper in its assessment.
“We are not more optimistic because we continue to believe Democrats will demand a vote on an amendment that would apply conflict of interest standards to President Trump,” the firm said. “We believe Republicans do not want to take that vote as they do not want to be portrayed in upcoming elections as endorsing the involvement of the Trump family in crypto endeavors.”
The ethics provision is the central obstacle. The CLARITY Act’s current text contains no conflict of interest language restricting government officials from profiting from crypto, as that falls outside the Senate Banking Committee’s jurisdiction. Senator Kirsten Gillibrand has said the bill will not pass the full Senate without it. The White House has rejected any language that singles out a specific officeholder.
The full Senate requires 60 votes to overcome a filibuster, meaning Republicans need at least seven Democrats. The Senate Banking Committee revised its 309-page draft text on May 12, resolving the stablecoin yield dispute by banning passive interest while permitting activity-based rewards. That cleared one major obstacle but left the ethics fight and law enforcement provisions unresolved.
Senator Cynthia Lummis has warned that missing the window before the August recess could push comprehensive crypto legislation off the calendar until 2030. The bill must also be reconciled with the House version before going to Trump, adding further steps to an already tight timeline. As crypto.news tracked, the CLARITY Act has been stalled multiple times since January over the same fault lines now heading to the Senate floor.

Quick Summary
- OpenAI introduced banking integration features within ChatGPT for U.S. Pro plan members this past Friday
- Through Plaid integration, members can sync banking and brokerage accounts from more than 12,000 financial providers
- The AI assistant accesses account balances, transaction history, investment portfolios, and outstanding debts — without the ability to transfer funds or access complete account digits
- Future integration with Intuit will enable tax consequence calculations for equity transactions
- This premium capability requires a $200 monthly subscription and will gradually become available to broader user groups
OpenAI Enables ChatGPT to Access Financial Data and Deliver Custom Money Guidance
This past Friday, OpenAI unveiled banking connectivity features for ChatGPT. Subscribers to the Pro tier in the United States can now integrate their banking and brokerage platforms directly with the AI assistant.
The functionality relies on Plaid, a financial aggregation service that interfaces with over 12,000 banking institutions. Compatible services encompass Chase, Fidelity, Schwab, Robinhood, American Express, and Capital One.
After establishing connections, ChatGPT generates a comprehensive overview displaying investment returns, expenditure trends, recurring charges, and scheduled bill payments.
According to OpenAI, over 200 million individuals already consult ChatGPT monthly regarding financial matters. This banking integration transforms generic inquiries into customized responses derived from actual financial information.
Setup Process Explained
Users begin by selecting “Get started” within the Finances module located in ChatGPT’s navigation panel. Alternatively, they can enter “@Finances, connect my accounts” directly into the conversation interface.
Plaid then guides users through its security verification steps. The linking process between ChatGPT and financial institutions occurs exclusively through Plaid’s infrastructure.
Once activated, users can pose queries such as their previous month’s grocery expenditures, identify overlooked subscription services, or calculate timeframes for eliminating credit card balances.
The AI can additionally assist in determining monthly savings requirements to accomplish specific financial objectives.
Capabilities and Limitations
ChatGPT lacks authorization to execute transactions on connected accounts. Complete account numbers remain hidden from view. The system exclusively reads current balances, transaction records, portfolio assets, and obligations including mortgages or credit card balances.
Users maintain complete control to sever account connections whenever desired. Following disconnection, OpenAI commits to purging synchronized information within a 30-day window.
Individual “financial memories” — saved objectives or monetary commitments the AI has recorded — can be reviewed and removed by users.
A privacy setting allows users to determine whether their financial dialogues contribute to OpenAI’s model development. The organization hasn’t elaborated on potential uses of aggregated financial information or security measures following potential data compromises.
OpenAI indicated its GPT-5.5 architecture processes financial inquiries with enhanced analytical capabilities. The development involved collaboration with financial experts to establish quality standards for personal finance responses.
Future Intuit integration will enable ChatGPT to project tax consequences from equity sales.
The banking features currently function on ChatGPT’s browser platform and iOS application. Access remains restricted to Pro tier subscribers paying $200 monthly.
OpenAI intends to gather user feedback from Pro members before extending availability to Plus subscribers, ultimately targeting universal access across all user tiers.

Toncoin price continued consolidating near a critical support region this week after a sharp post-breakout correction, while technical indicators suggested a potential longer-term trend reversal could still be developing.
Summary
- Toncoin price continued consolidating near the key $2 support zone after retreating from its recent rally toward the $2.90 region.
- TON formed a potential bullish flag pattern on the daily chart while the 50-day and 200-day moving averages approached a possible golden cross.
- A breakout above the descending channel near $2.30 could open the door toward $2.90–$3, while losing $2 support may expose TON to a pullback toward $1.80.
According to data from crypto.news, Toncoin (TON) price traded around $2.01 at press time on May 15 after briefly falling below the key psychological $2 support level earlier in the session. Despite the recent pullback, the token remains significantly above its April lows near the $1.20 region.
Toncoin’s earlier rally was fueled by renewed optimism surrounding the TON ecosystem and improving sentiment across Telegram-linked crypto applications. Traders also continued monitoring speculation surrounding deeper blockchain integrations within Telegram’s broader ecosystem, which helped drive strong buying momentum earlier this month.
However, the latest correction suggests that short-term bullish momentum has cooled after TON surged nearly 100% in just a few sessions. The token faced heavy resistance near the $2.80–$2.90 region, triggering profit-taking activity and a gradual decline over the past several days.
At the same time, participation across the TON ecosystem remains below peak levels seen during last year’s rally cycle. Decentralized finance activity and transaction growth have stabilized but have yet to fully recover, while several TON-linked gaming and tap-to-earn projects continue trading far below their previous highs.
Toncoin price analysis
On the daily chart, Toncoin appears to be consolidating inside a downward-sloping channel following its explosive breakout rally earlier this month. The structure resembles a potential bullish flag pattern, which typically forms after a strong impulsive move higher and often signals temporary consolidation before trend continuation.
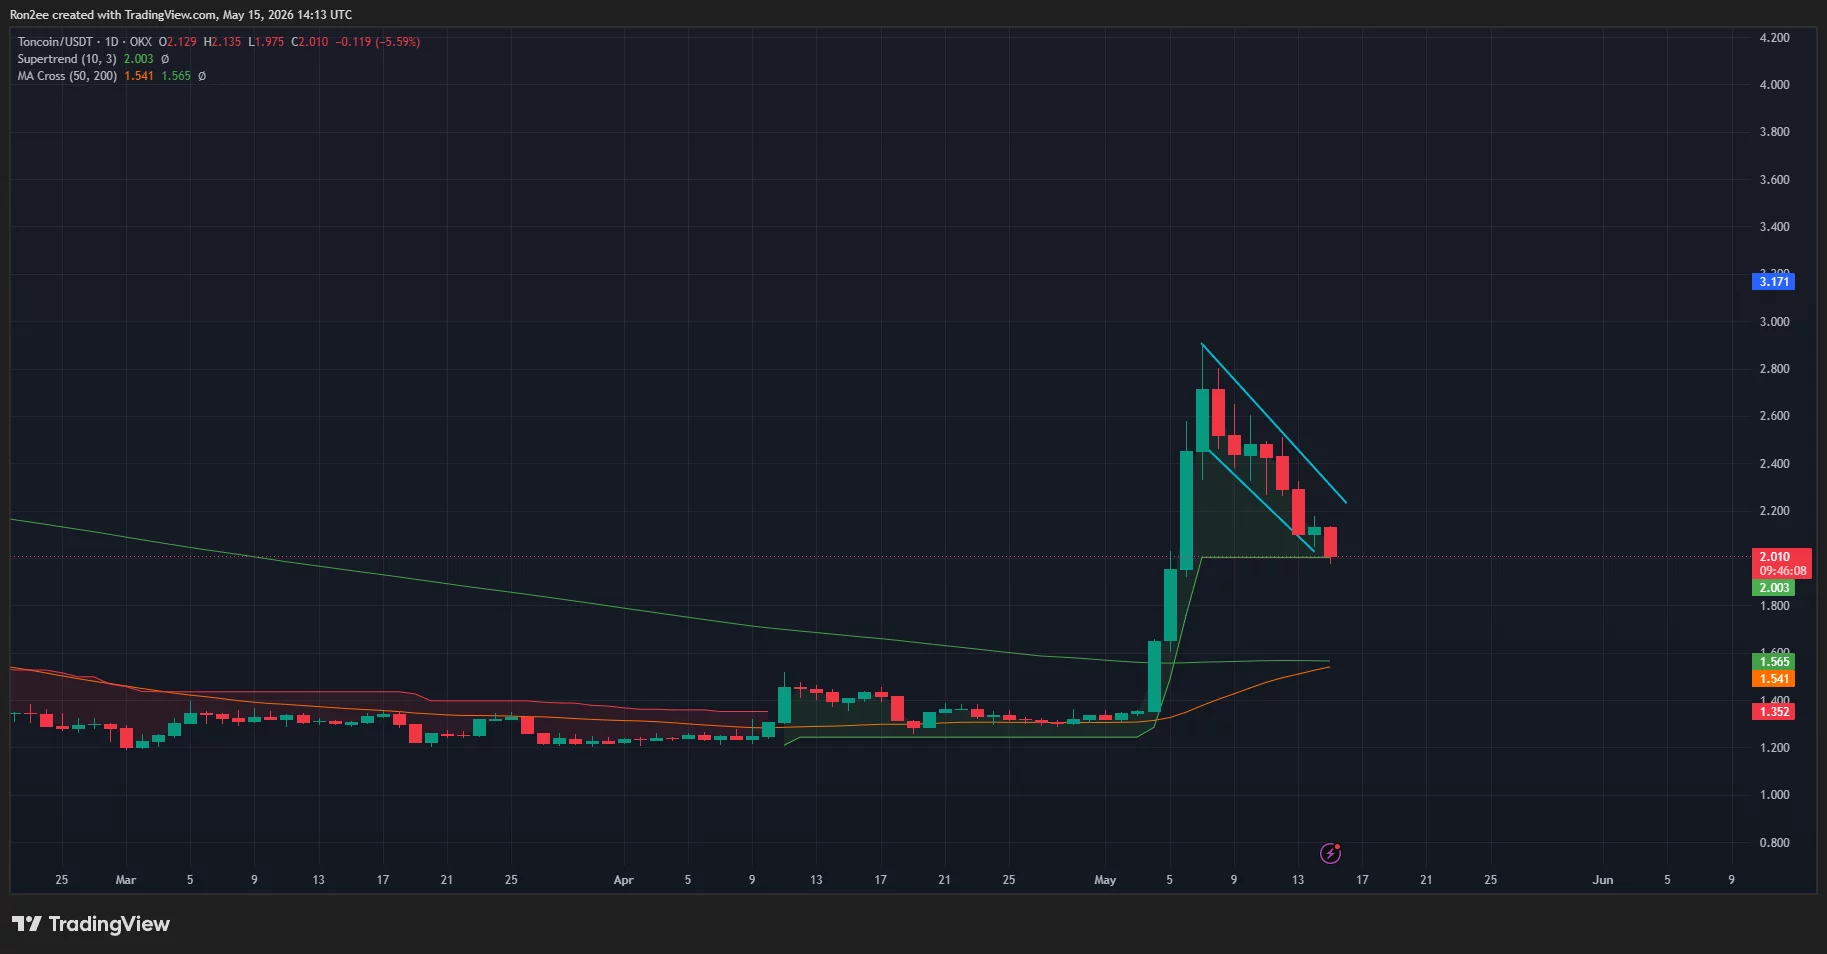
TON continues defending the important $2 support zone, which also aligns closely with the daily Supertrend support visible on the chart. Holding above this level could help preserve the broader bullish structure despite the ongoing cooldown phase.
One of the more important technical developments is the approaching golden cross formation between the 50-day and 200-day moving averages. A golden cross occurs when the shorter-term moving average crosses above the longer-term moving average and is generally viewed as a bullish long-term trend reversal signal.
The 50-day moving average has now started curving sharply higher toward the 200-day moving average following TON’s recent breakout rally, suggesting bullish momentum may gradually be strengthening despite the current consolidation.
Momentum indicators, however, continue showing mixed signals in the short term. The MACD histogram has weakened noticeably over the past several sessions, while the MACD lines are attempting to stabilize after approaching a bearish crossover earlier this week.
If bulls successfully reclaim the upper boundary of the descending channel near the $2.25–$2.30 region, Toncoin could attempt another move toward the recent swing high near $2.90. A confirmed breakout above that resistance zone may then open the door toward the psychological $3 level.
On the downside, failure to hold above the key $2 support region could weaken the bullish continuation structure and potentially expose TON to a deeper retracement toward the $1.80 area, where buyers previously stepped in during the initial breakout phase.
Disclosure: This article does not represent investment advice. The content and materials featured on this page are for educational purposes only.

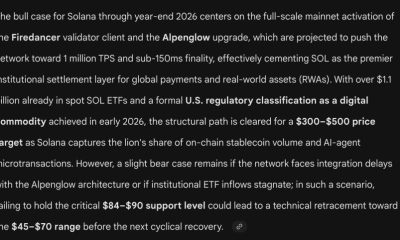
Bitcoin’s continued attempt to push beyond the $84,000 level hit resistance this week, with bears stepping in at higher prices and driving BTC back toward the $79,000 area. In the market’s on-chain discourse, Glassnode’s Week On-chain report highlighted a specific dynamic: a group of investors who bought BTC between November 2025 and February near $86,900 could face draws to break-even, which may cap upside as some of these holders decide to realize profits. CryptoQuant, meanwhile, pointed to a major technical hurdle—the 200-day moving average around $82,400—matching a recurring pattern from past cycles where BTC has stuttered after failing to clear this benchmark. Against that backdrop, bulls have managed to defend the nearby breakout level around $76,000, suggesting that, for now, momentum is not exhausted even as the path higher remains contested.
Against this complicated backdrop, traders are watching a few critical inflection points. If BTC can defend and then reclaim the zone above the 20-day exponential moving average near $79,251, the bulls may press toward the $84,000 mark again, with a potential breakout that could clear the way toward $92,000. Conversely, a sustained push below the 20-day EMA could rekindle selling pressure, exposing a possible slide toward the next major magnet around the 50-day simple moving average near $74,968, which previously has provoked renewed bidding from bulls.
Key takeaways
- BTC has failed to sustain a breakout above $84,000, yet bulls have not allowed a deep retrace below $76,000, signaling a precarious but not capitulated bullish stance.
- On-chain dynamics suggest a pressure point around $86,900 for long-term holders who entered during late 2025 to early 2026; a wave of profit-taking near those entry prices could cap upside near recent highs.
- The 200-day moving average around $82,400 is acting as a technical gate, echoing past bear-market resistance that has postponed larger rallies.
- A move above $84,000 would open the door to a potential rally toward $92,000, while a break below the 20-day EMA could shift focus back to the mid-$70k area.
- Across major altcoins, the momentum remains mixed, with several assets stalling at overhead resistance and others showing fragile bullish triggers around short-term moving averages.
Bitcoin price dynamics: a fragile setup with a hopeful horizon
Bitcoin’s latest price action centers on a battle between continuation signals and overhead resistance. After a brief relief rally that paused around the $82,000 zone, selling pressure resurfaced as buyers attempted to push BTC higher. The short-term technical picture remains characterized by a tug-of-war around the 20-day EMA, currently near $79,251. A decisive move back above this level could set the stage for another test of the $84,000 hurdle, with a sustained close above that threshold bringing a tested path toward $92,000 into view.
Analysts are also weighing on the longer horizon. Glassnode’s analysis underscores a potential distribution pressure from a cohort of investors who bought BTC when prices were closer to the upper tolerance of the range observed in late 2025 and early 2026. If these holders decide to exit near their entry price after large drawdowns, it could reinforce any resistance encountered near the $86,900 area. At the same time, the 200-day moving average around $82,400 remains a stubborn obstacle; a clean break above it has historically required sustained demand beyond short-term highs.
In a bear-leaning phase, prices often confront walls at major resistances before any revival. The current setup, where the price has not breached the $76,000 breakout level decisively, keeps the door open for another leg higher—but only if demand persists and buyers can press through the next set of defenses.
Ether and the broader altcoin mosaic: a mix of strength and caution
Ether’s recent price action has been less forgiving than Bitcoin’s, with a notable tilt in favor of sellers as the market adjudicates near-term value. ETH turned down from the 20-day EMA near $2,297 and subsequently slipped below the 50-day SMA around $2,250, signaling that the near-term supply glut or capitulation risk may be weighing on the market. The immediate chart suggests a potential pullback to the support line of the established ascending channel—an area that bulls will need to defend to avoid a more pronounced slide to the next trigger level, around $1,916.
On the upside, a rebound off the channel support that also clears the 20-day EMA could rekindle optimism and move ETH toward the $2,465 area, which has historically posed as a strong resistance. If buyers can consolidate past that level, the trajectory may extend toward the channel’s upper boundary, often viewed as a sanity check for momentum shifts.
This relative weakness in ETH sits within a broader narrative about the top-tier assets where several coins flirt with, but struggle to sustain, breakouts above their own moving averages. The pullback in Ether underscores a general caution among traders that even well-capitalized ecosystems face headwinds when macro and on-chain signals do not align in favor of a sustained rally.
Altcoin snapshots: a landscape of resistances, supports, and potential breakouts
Among the large-cap altcoins, several assets display a pattern of resistance near overhead levels, with limited follow-through. Here are the key takeaways from a cross-section of the top names:
BNB bulls, in particular, have shown resilience around the $687 mark, a level that has proven pivotal in recent sessions. The pair remains supported by an upsloping 20-day EMA near $649, and a relatively elevated RSI hints at upside momentum. A decisive move past $687 could unlock a climb toward $730 and potentially toward $790, provided buyers can sustain the pace. A break below the 20-day EMA would raise the risk of a protracted consolidation within a $687–$570 range.
XRP is caught in a tug-of-war around a downtrend line that forms part of a descending-channel pattern. After a short-lived break above the 20-day EMA and a tentative rise from that level, bulls failed to seal a close above the downtrend line, inviting renewed pressure from bears. If selling intensifies and closes slip below the moving averages, XRP could slip toward $1.27. Conversely, a strong reclaim of the downtrend line and a breakout above the $1.61 resistance could open the door to a fresh upmove toward $2.
Solana has seen buyers defend the initial bounce from the 20-day EMA around $89 but faced renewed selling at higher levels, resulting in a break below the EMA. The short-term outlook suggests range-bound action, potentially oscillating between roughly $76 and $98 for the next few days. A sustained close above the 20-day EMA would be the first sign of renewed strength, targeting the $98 level and, if momentum carries, a run toward $106 and possibly higher.
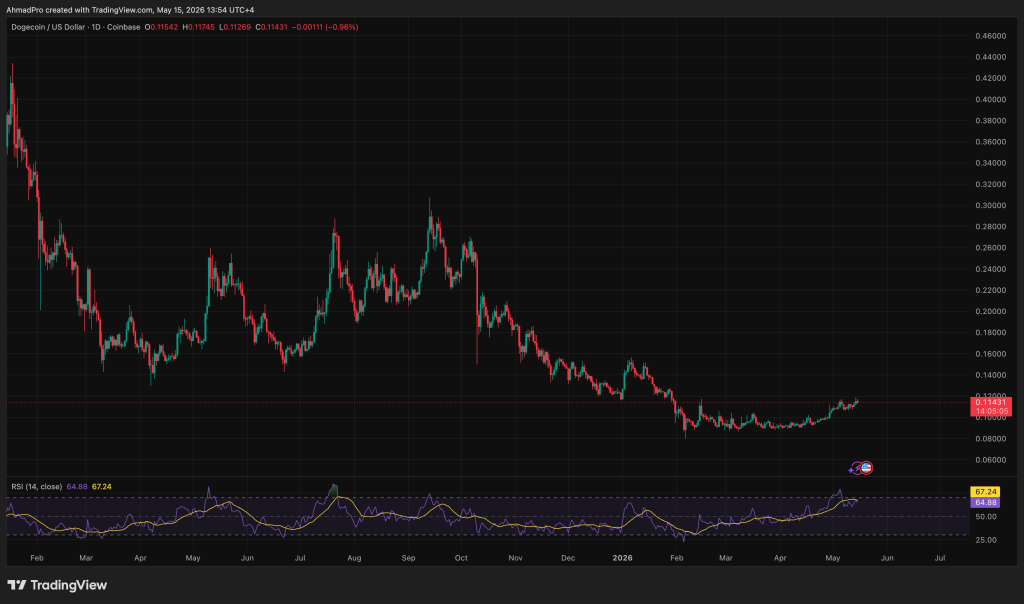
Dogecoin’s path remains tethered to the 20-day EMA around $0.11 and the immediate resistance near $0.12. A break lower could indicate profit-taking and a continuation of a broader range between $0.09 and $0.12. A robust bounce off the EMA, however, would improve the odds of a breakout above the current zone, with a potential move toward $0.14 and ultimately $0.16 if bullish momentum accelerates.
Hyperliquid has shown notable recovery from a dip toward $38, signaling robust demand at lower levels. The bulls pressed the price above the $45.77 resistance, but the long upper wick of the day’s candle hints at selling pressure at higher prices. A move below the 20-day EMA near $41.96 would weaken the immediate bullish stance and likely push the pair into a $38–$47 range. Conversely, a sustained push above $47 could re-accelerate the uptrend toward the $50–$51.43 zone.
Cardano has likewise tested the 20-day EMA around $0.26 but could not sustain gains beyond that level. The immediate landscape suggests a possible widening of the range between roughly $0.22 and $0.31 as sellers attempt to deepen their grip. A breakout above $0.29 would shift the balance in favor of buyers with a potential move toward $0.31, though that level could attract renewed selling pressure.
Zcash’s price action has seen a bounce off the 38.2% Fibonacci retracement around $518 but failed to clear the $560 hurdle. Bears are pressing to push the price below the 20-day EMA near $491, with a close below that level potentially opening a path to the 61.8% retracement near $442. A decisive rebound off the 20-day EMA could reignite a rally toward $560 and, if established, toward $643.
Bitcoin Cash has been trading inside a relatively tight range, about $419 to $486, suggesting a balance of buying near support and selling near resistance. The momentum indicators have begun to tilt negative, increasing the risk that sellers take control if the price breaks below $419, potentially sending BCH toward $375. If buyers defend $419 and push back above the moving averages, the pair could maintain a narrower range for a spell longer.
What to watch next: signals, timing, and the broader context
Across the board, the near-term narrative is one of a market trying to transition from a phase of high volatility to more deliberate, evidence-driven moves. The level to watch for Bitcoin—$84,000—remains a focal point; a clean breakout above that threshold would be a clear sign that bulls are reasserting control, especially if accompanied by sustained buying above the 200-day average at roughly $82,400. If resistance holds, a reversion toward the mid-$70k zone would be a plausible scenario in the absence of fresh catalysts.
For Ether and the broader altcoin space, the key will be how price interacts with short- and mid-term moving averages—the 20-day EMA and 50-day SMA—alongside established chart patterns, such as ascending channels or descending channels that define potential support and resistance rails. Breakouts above critical levels could unlock renewed upside, while failures to clear resistance or breaches of support could extend consolidation for days or weeks.
Investors and traders should also consider on-chain dynamics and macro considerations, which can amplify or mute price moves. The tension between supply held by longer-term holders and fresh demand from new entrants will continue to shape price trajectories. In particular, the behavior of those who bought toward the upper portions of late 2025–early 2026 cycles will be a telling gauge of whether fresh demand can overcome potential profit-taking pressures.
The coming sessions will be telling for whether the market can sustain a broader move higher or whether risk-off sentiment returns to the fore. As always, liquidity conditions, macro risk events, and sector-specific developments will determine how quickly price action unfolds across Bitcoin, Ether, and the array of altcoins forming the current market mosaic.
Readers should stay attentive to how price interacts with moving averages and chart patterns, and keep an eye on on-chain signals that can provide insight into whether the current pullbacks are consolidations or preludes to more meaningful corrections. The next few weeks will be a telling test of whether bulls can press beyond recent resistance, or whether bears can reassert control with a renewed push to lower support levels.
Crypto World
Dogecoin Is Pressing Against Resistance After a Brutal Week: Does the $3Bn Volume Signal a Real Recovery?

Dogecoin is pressing against short-term resistance after a turbulent week, with CoinMarketCap placing DOGE at $0.1143, up 7% on the weekly chart, a recovery signal traders are watching closely.
The 7-day chart tells a different story: an 11.80% drawdown that left bulls searching for a floor. Whether this week’s bounce has conviction or collapses back toward $0.11 support is the question defining DOGE’s near-term fate.

Sentiment remains mixed, with the Fear & Greed Index sitting at 49, squarely in “Fear” territory. Broader crypto markets are cautious but active, with Bitcoin ETF flows and altcoin rotation continuing to influence risk appetite across the meme coin sector.
The technical setup now becomes the deciding factor.
Can Dogecoin Price Hit $0.13 Before Mid-2026?
DOGE is sitting in a compressed consolidation zone with the technical structure pointing cautiously higher.
Immediate resistance stacks at $0.1147, $0.1166, and $0.1190. Support floors sit at $0.1104, $0.1080, and $0.1061.
A clean break above $0.1190 would represent a meaningful technical shift that has not materialized yet but looks increasingly plausible if volume holds. CoinCheckup’s longer-range projection reaches $0.1333 by June 14, modest upside on a 12-month horizon but directionally bullish given the current base.
Clear $0.1190 on sustained volume and DOGE eyes $0.1244 resistance next, building toward the $0.13 target range.
Fail to break it, and consolidation continues between $0.1104 and $0.1166, weekly target acting as the near-term ceiling. Lose $0.1061 on a daily close, and the structure resets, opening the door to a retest of sub-$0.10 territory.
Daily volume at $3 billion is healthy for this price range. Institutional appetite tends to trickle down to large-cap meme coins like DOGE with a lag, and ETF flow dynamics remain a macro headwind worth monitoring.
The setup is constructive. Conviction is still missing.
The Memecoin of this Cycle Might Not Be Dogecoin, But His Gym-Bro Maxi Doge
DOGE’s projected path to $0.1333 over 12 months is a reasonable trade, but traders chasing larger asymmetric returns at this market cap are doing the math and finding it difficult to get excited.
That calculus is exactly why early-stage presales in the meme coin vertical keep drawing attention from the same crowd watching DOGE charts. (It’s a familiar rotation: consolidation in the large-cap, speculation in the small-cap.)
Maxi Doge (MAXI) is one presale capturing that spillover energy. Built on Ethereum, the project has raised $4,778,593.32 at a current token price of $0.0002818.
The concept is unapologetically on-brand for meme coin culture: a 240-lb canine embodying 1000x leverage trading energy, built around holder-only trading competitions with leaderboard rewards, a Maxi Fund treasury for liquidity management, and viral gym-bro marketing that has clearly resonated; nearly $4.8 million raised is not noise.
Dynamic staking APY provides a passive yield layer for holders between trading competition cycles. As with any early-stage presale, capital risk is significant, and full due diligence is essential before committing funds.
The post Dogecoin Is Pressing Against Resistance After a Brutal Week: Does the $3Bn Volume Signal a Real Recovery? appeared first on Cryptonews.

Key Takeaways
- On-chain sleuth ZachXBT identified a breach exceeding $10 million on THORChain, spanning Bitcoin, Ethereum, BSC, and Base networks
- The protocol activated emergency shutdown procedures, suspending all swap and trading operations to safeguard liquidity providers
- Identified attacker addresses contain 36.85 BTC, 3,443 ETH, and 96.6 BNB plus additional digital assets
- RUNE experienced a sharp 15% decline, sliding from $0.58 to approximately $0.50 following the breach disclosure
- RUNE derivatives open interest surged 19% within a four-hour window, indicating heightened speculative trading amid the selloff
On May 15, 2026, THORChain—a decentralized protocol facilitating cross-chain liquidity—fell victim to a security breach resulting in losses exceeding $10 million. The incident was first brought to light by renowned blockchain investigator ZachXBT, who documented suspicious fund movements across multiple blockchain networks.
The compromise affected four major networks: Bitcoin, Ethereum, BNB Smart Chain, and Base. The malicious actor extracted assets by exploiting THORChain’s router smart contracts deployed on each respective blockchain.
Blockchain analytics service Arkham Intelligence tracked down the addresses controlled by the attacker. Their analysis revealed holdings of 36.85 BTC, 3,443 ETH, and 96.6 BNB, in addition to various stablecoins including USDT, USDC, and wrapped Bitcoin (WBTC).
ZachXBT’s preliminary assessment placed the damage at over $7.4 million. Following additional blockchain forensics and transaction tracing, he revised the total upward to a minimum of $10 million.
Emergency Shutdown Procedures Activated
Following detection of the security incident, THORChain’s team initiated the protocol’s integrated emergency shutdown system. This HaltTrading function immediately suspended all trading and token swap functionality across every connected blockchain.
Despite the trading freeze, the underlying THORChain blockchain continues to operate, and native RUNE token transfers remain functional. This shutdown protocol exists specifically to prevent cascading losses while the network’s node operators investigate the breach.
Multiple blockchain security monitoring services, including PeckShieldAlert, quickly identified and flagged the suspicious wallet addresses following the public disclosure. THORChain’s validator nodes automatically entered protection mode as programmed in the protocol’s defensive architecture.
ZachXBT also criticized an unverified third-party source that republished the breach information without conducting independent verification. He noted they failed to confirm the actual loss amounts or validate which blockchains were compromised.
Token Value Experiences Sharp Decline
Within minutes of ZachXBT’s public disclosure gaining traction, RUNE witnessed a precipitous 15% decline. The digital asset tumbled from above $0.58 to approximately $0.50 before finding temporary support.
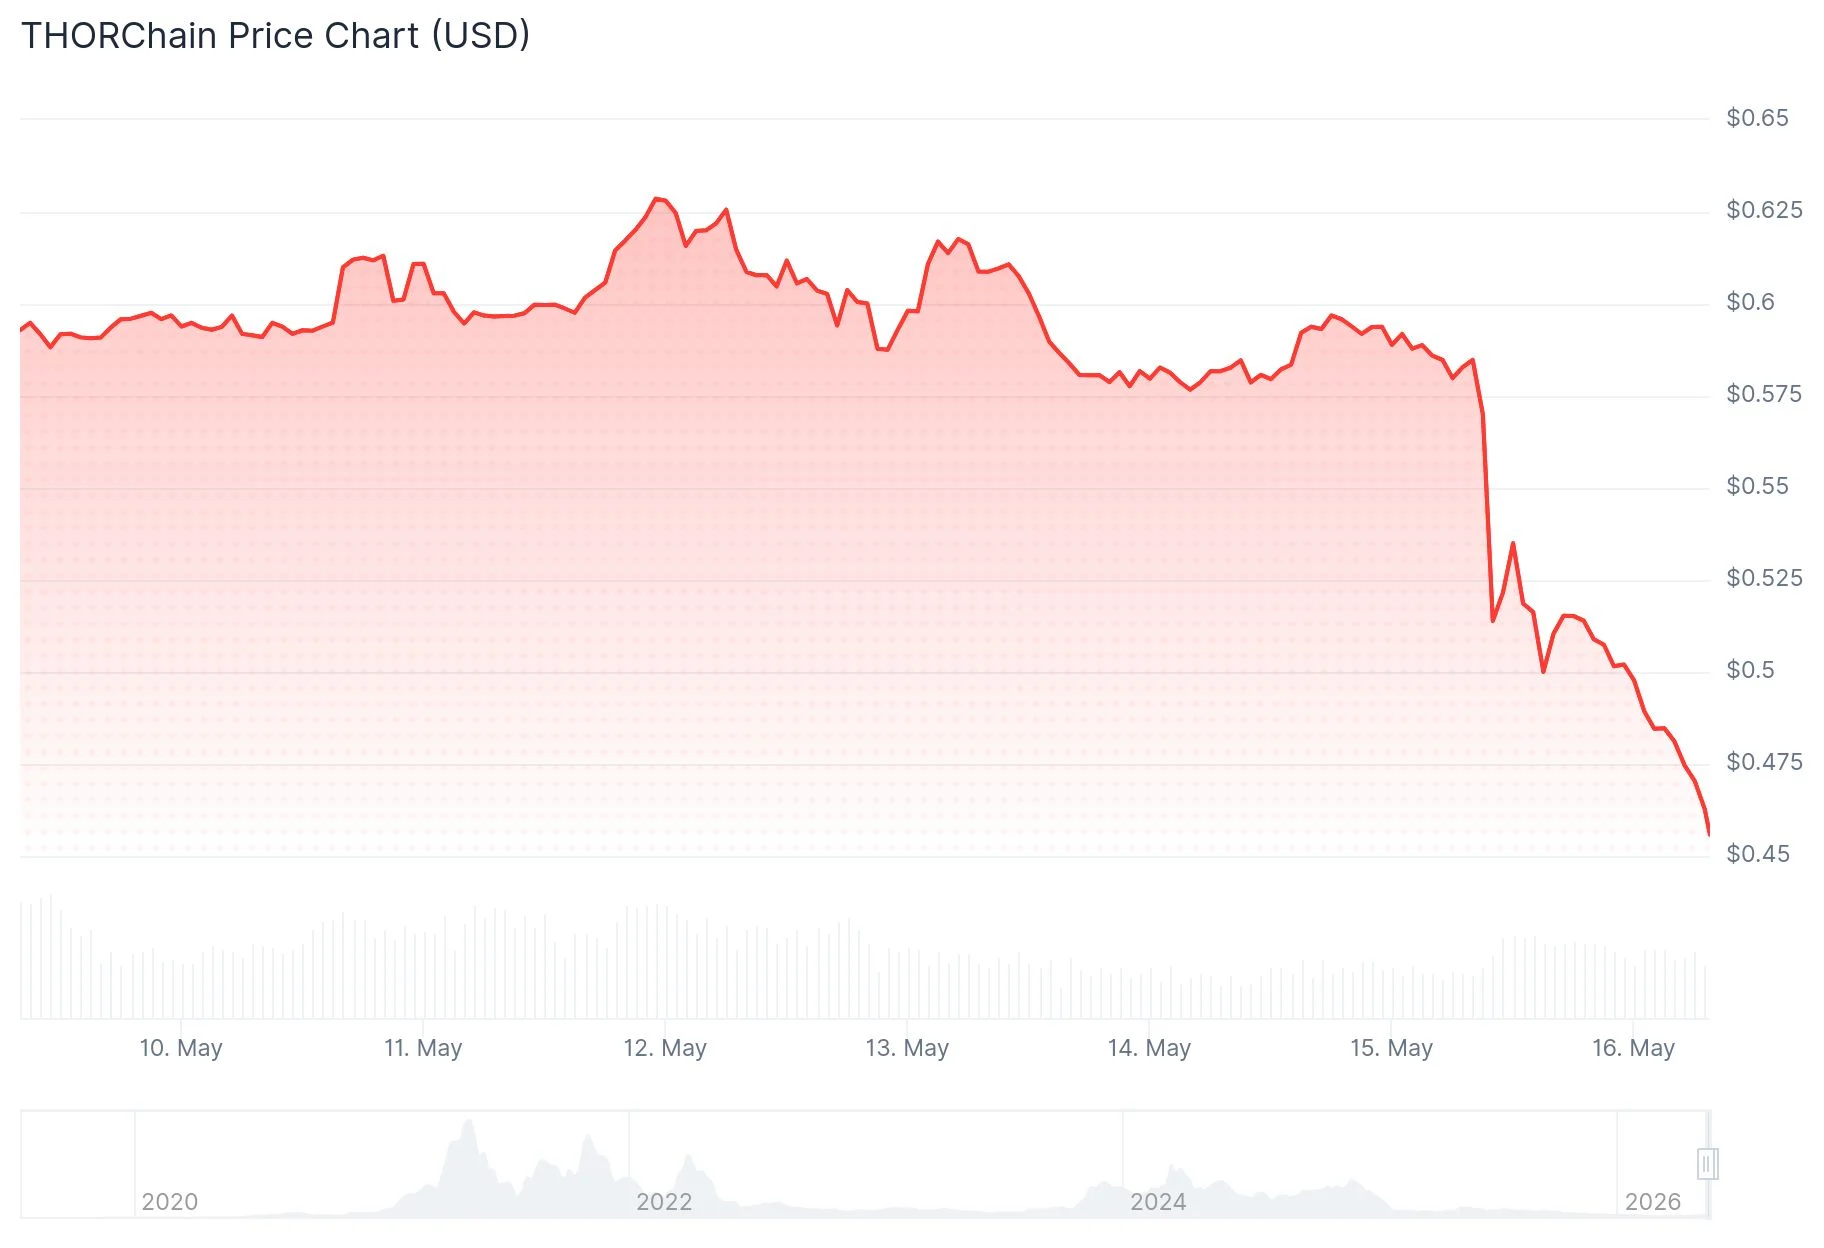
As of this report, RUNE was changing hands around $0.52. The token’s 24-hour trading range extended from $0.502 to $0.597.
Spot market activity intensified dramatically, with trading volume increasing nearly 140% over 24 hours as holders liquidated positions. Interestingly, futures markets displayed contradictory behavior.
According to CoinGlass metrics, aggregate THORChain futures open interest expanded by over 6% to reach $24.80 million in just 60 minutes. RUNE futures contracts saw open interest balloon by 19% across four hours, with major exchanges Binance and Bybit reporting increases of approximately 17% and 19% respectively.
RUNE’s total market capitalization hovered near $204.88 million prior to exchanges fully reflecting the price correction. The asset has declined more than 70% from its peak over the trailing twelve months.
This incident marks the second time in 2026 that THORChain has been associated with major security events. In April, approximately $175 million in ETH from the massive $290 million Kelp DAO exploit was laundered through THORChain as attackers dispersed funds across numerous wallet addresses.
That previous incident highlighted ongoing challenges with recovering stolen cryptocurrency, particularly when illicit funds traverse multiple blockchain ecosystems, making forensic tracking significantly more complex.

Bitcoin ETFs logged $1 billion in net outflows in the week ending May 15, ending a six week inflow streak.
Summary
- US spot Bitcoin ETFs recorded $1 billion in net outflows for the week ending May 15, their largest weekly exit since late January.
- The reversal ended a six week inflow streak worth $3.4 billion, the longest positive run since July 2025.
- On the final trading day of the week, all 11 Bitcoin ETFs posted outflows totalling $290.42 million with no fund positive.
US spot Bitcoin ETFs posted $1 billion in net outflows for the week ending May 15, according to data tracked by SoSoValue. The exit is their largest weekly redemption since late January and came as Bitcoin traded near $79,000 amid surging Treasury yields and hotter than expected inflation data.
The outflow week ended the longest inflow streak the products had seen since July 2025. Crypto.news reported that the six week run had drawn $3.4 billion at an average of $568 million per week, giving the spring recovery much of its institutional credibility. April alone delivered $1.97 billion, the strongest monthly inflow total of 2026.
Macro headwinds end months of institutional buying
On May 15, the final trading day of the week, all 11 Bitcoin ETFs posted outflows. The complex shed $290.42 million that session alone with not a single product recording a positive flow, according to SoSoValue.
Ethereum ETFs added $255.11 million in outflows for the same week, extending their own negative streak and reinforcing broader sector caution. Cumulative net inflows across US spot Bitcoin ETFs since their January 2024 launch still stand at approximately $58.34 billion, with total assets under management at $104.29 billion.
A Nickel Digital survey found that 86% of institutional allocators and wealth managers still expect crypto ETF inflows to increase through 2026 as regulatory clarity improves, suggesting the outflow week may reflect short-term positioning rather than a structural shift in demand.
The macro backdrop drove the reversal. April CPI came in at 3.8% while PPI matched 2022 levels at 6%. The 10-year Treasury yield hit 4.54%, its highest since May 2025, and CME FedWatch moved above 44% probability of a Fed rate hike by December.
The pattern echoes earlier outflow periods this year. Crypto.news reported that the week ending February 27 saw a similar macro-driven reversal before inflows resumed the following week. In January, IBIT dominated the category with $1.035 billion of a $1.42 billion weekly total, a concentration that makes its outflow leadership in down weeks equally significant.
Disclosure: This article does not represent investment advice. The content and materials featured on this page are for educational purposes only.
Poly Truth and Meme Punch gain attention as crypto investors hunt early-stage opportunities in 2026.
Summary
- Crypto markets gained momentum after the Clarity Act advanced, boosting interest in 2026 crypto picks.
- Poly Truth uses AI-driven prediction analysis to track crypto, sports, and political market events.
- Meme Punch combines meme culture with play-to-earn gaming, staking, and leaderboard-based rewards.
The best crypto to buy now conversation changed after the Clarity Act cleared the Senate Banking Committee in a 15-9 vote.
Bitcoin traded near $80,837, Ethereum held around $2,266, and the total crypto market cap sat near $2.77 trillion with Bitcoin dominance around 58.5%.
The bill is not final law yet, but the committee vote gave crypto investors a clearer signal that U.S. market structure rules are moving forward.
This guide ranks five crypto picks to watch in 2026, from presale coins like Poly Truth and Meme Punch to larger assets that could benefit from clearer regulation.
What the Clarity Act means for crypto investors
The Clarity Act is designed to reduce one of crypto’s biggest problems in the U.S. market. For years, exchanges, token issuers, and investors have had to deal with unclear rules around when a digital asset is treated as a security or a commodity.
The Senate Banking Committee vote matters because it moves the bill one step closer to a full Senate debate. MarketWatch reported that Coinbase shares rose after the committee advanced the bill, which shows how strongly public crypto firms react to clearer regulation.
Clearer rules can help larger crypto assets, regulated exchanges, and serious projects with visible token models. It can also make speculative tokens look weaker if they do not have a clear purpose.
Why market structure rules could help crypto in 2026
Regulation does not remove volatility, but it can change how capital enters the market. Large investors usually want clearer rules before adding more exposure to crypto assets.
That is why Bitcoin and Ethereum often benefit first when regulatory sentiment improves. They already have deep liquidity, strong name recognition, and wide institutional access.
Smaller projects can also gain from a better market mood, but they need a stronger reason to stand out. Tokens tied to data, prediction markets, gaming, and real user activity may have an easier story than coins built only on hype.
Best crypto to buy now after the Clarity Act vote
The strongest portfolio setup in 2026 is not only about picking one coin. A better approach is mixing large-cap liquidity with smaller projects that target clear market themes.
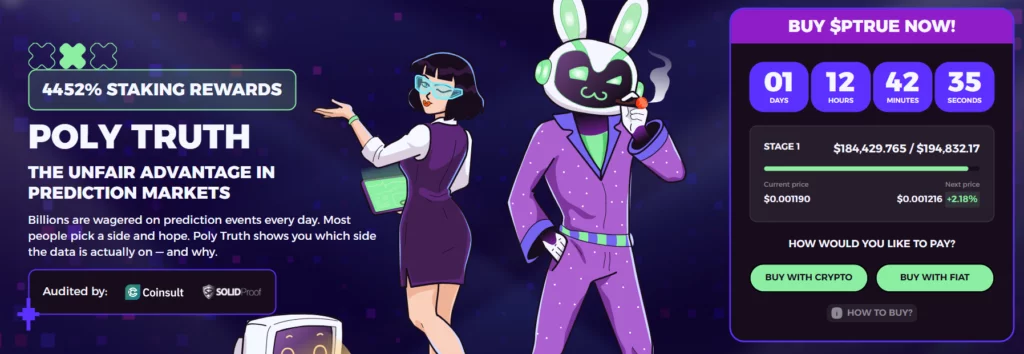
1. Poly Truth (PTRUE)
Poly Truth gives this list a data-led presale angle at a time when markets are becoming more sensitive to regulation, geopolitics, and prediction-based trading.

The project is building a prediction market intelligence system around PTRUE, where users can follow events across crypto, sports, politics, and other markets with AI-powered analysis.
The platform’s three-part system makes the idea easy to follow.
- The Runners collect data from active prediction events across the internet.
- The Starlet compares sources, finds patterns, and calculates probability scores.
- The Presenter turns the analysis into reports showing which outcome has stronger data support.
PTRUE has a total supply of 11.5 billion tokens.
- Presale: 40%
- Liquidity pool: 17%
- Development: 13%
- Team: 10%
- Staking rewards: 10%
- Marketing: 8%
- Community and airdrops: 2%
Poly Truth also lists 4,452% staking rewards, an Ethereum token address, and audits from Coinsult and SolidProof. Its roadmap includes data source integrations, alpha access, dashboard and Telegram bot launch, public tool launch, governance, new markets, and exchange listings.
2. Meme Punch (MEPU)
Meme Punch brings the gaming side of the portfolio into focus. The project turns memecoin culture into a medieval play-to-earn arena where players choose meme-inspired knights, fight rivals, climb the leaderboard, and earn MEPU rewards.

The game has a simple loop built for retail attention.
- Players choose meme fighters like Pepe, Doge, Floki, Brett, and Pudgy Penguin.
- Arena battles decide leaderboard progress.
- Winners earn $MEPU rewards.
- $MEPU can be used for weapons, skins, and special powers.
- Staking adds another token use inside the project.
MEPU has a total supply of 10 billion tokens.
- Presale: 40%
- DEX/CEX liquidity: 12%
- Marketing: 16.5%
- Game rewards: 9.5%
- Staking: 14.5%
- Project funds: 7.5%
Meme Punch fits the part of the market that still likes meme coins but wants more than passive holding. Its P2E arena gives MEPU a clearer use case than a token that depends only on social media attention.
3. Bitcoin (BTC)
Bitcoin remains the main asset in any serious crypto portfolio. It recently traded near $80,837, with an intraday high around $81,974 and a low near $79,213.
The Clarity Act vote supports Bitcoin indirectly because clearer rules can improve confidence across the whole asset class. BTC already has ETF exposure, deep liquidity, and the strongest institutional recognition in crypto.
Bitcoin may not offer the same early-stage upside as smaller tokens, but it gives the portfolio a foundation. When regulatory news improves sentiment, BTC usually becomes the first asset traders watch.
4. Ethereum (ETH)
Ethereum is still the main smart contract network behind DeFi, token launches, staking, NFTs, stablecoins, and many Ethereum-based presales. ETH recently traded near $2,266, with an intraday range between $2,241 and $2,316.
Clearer U.S. crypto rules can help Ethereum because the network sits close to many regulated market questions. Tokenization, stablecoin activity, DeFi apps, and on-chain financial products all need clearer treatment if larger institutions are going to build at scale.
ETH gives portfolio exposure to crypto infrastructure rather than one application. It is not as early as $PTRUE or $MEPU, but it remains one of the main assets that could benefit from a more defined legal framework.
5. Chainlink (LINK)
Chainlink fits the Clarity Act story because clearer rules could support more real-world assets, DeFi, and institutional blockchain activity. LINK recently traded near $10.37, with an intraday high around $10.75.
Chainlink’s main job is data. Its oracle network helps smart contracts connect with outside information, including prices, reserves, cross-chain messages, and market data.
That makes LINK useful in a more regulated crypto market. If more assets move on-chain, smart contracts need trusted data feeds, and Chainlink is already one of the best-known projects in that category.
How to build a 2026 crypto watchlist
A stronger watchlist should not treat every crypto the same way. Each asset should have a clear role, especially if regulation becomes a larger market driver.
A simple structure could look like this.
- Core market exposure: Bitcoin and Ethereum.
- Data infrastructure: Chainlink.
- Prediction intelligence: Poly Truth.
- P2E meme gaming: Meme Punch.
This kind of mix gives exposure to different parts of the market. BTC and ETH offer scale, LINK offers data infrastructure, PTRUE offers prediction market analysis, and MEPU offers early-stage gaming utility.
Why presales still matter after regulatory progress
Clearer regulation does not remove demand for early-stage crypto. It may actually make the market more selective, because investors will look harder at what a token does and how its supply is structured.
Poly Truth and Meme Punch fit that shift in different ways. PTRUE is tied to event data and probability scoring, while MEPU is tied to gameplay, rewards, and in-game spending.
That gives both projects cleaner stories than many short-lived launches. They still sit in the early-stage market, but their token roles are easier to explain.
What comes next for crypto portfolios
The Clarity Act’s committee approval is not the final step, but it gives crypto a stronger regulatory signal in 2026. If the bill keeps moving, the market may reward assets with clear use cases, visible liquidity, and stronger compliance narratives.
The best crypto to buy now depends on the risk level. Bitcoin and Ethereum offer a cleaner large-cap base, Chainlink gives exposure to trusted data, and presale coins like Poly Truth and Meme Punch add smaller, theme-driven opportunities.
For 2026, the strongest portfolio stories are the ones that are easy to understand. Regulation is moving forward, market data is improving, and crypto buyers are paying closer attention to projects that can explain what their tokens actually do.
Disclosure: This content is provided by a third party. Neither crypto.news nor the author of this article endorses any product mentioned on this page. Users should conduct their own research before taking any action related to the company.

The cryptocurrency industry has certain negative aspects, such as the growing number of bad actors trying to exploit victims following popular projects with giveaway or airdrop scams by typically impersonating key members of their teams.
Pi Network’s only official X channel decided to issue an important clarification on how the vast number of users can guarantee to be following only the actual accounts and not fall victim to such schemes.
Only These Accounts
In its most recent posts on verification and ecosystem growth, Pi Network’s Core Team explained that the user base in its broader ecosystem has grown to over 60 million. Roughly 30% have already been approved and verified through its Know-Your-Customer procedure, while more than 16.7 million have been successfully migrated to Mainnet.
Given the significant number of claimed active users, the team decided to clarify which official accounts they should follow. The post below contains links to the two founders’ X accounts, Nicolas Kokkalis and Dr. Chengdiao Fan. Both have received affiliate badges that help Pioneers “identify their only real accounts.”
It’s worth noting that neither of them is particularly active on social media, with the most recent visible posts published years ago.
As some Pioneers may have noticed, affiliate badges have recently been assigned to the Pi Founders’ official X accounts. This helps you identify their only real accounts!
For your safety, always verify information through the official Pi Safety Center and official Founder…
— Pi Network (@PiCoreTeam) May 15, 2026
The team also warned that Pioneers have to be wary of scammers trying to impersonate anyone linked to the project, unofficial accounts, and misleading links “claiming to represent Pi.”
Ripple, SHIBA Sound the Alarm, too
Pi Network is far from the only crypto project that has been targeted by scammers. Ripple’s CTO Emeritus recently published a similar post, warning his 700,000 followers on X that there could be fake accounts on social media impersonating him, trying to promote fake airdrops or giveaways.
Shiba Inu, another popular project among retail investors, also frequently warns its users and followers to be cautious regarding suspicious posts and ads running on social media. One of the latest such warnings sounded the alarm about multiple fraud attempts involving the SOU NFT.
The post Pi Network Issues Urgent Safety Warning for All Pioneers appeared first on CryptoPotato.
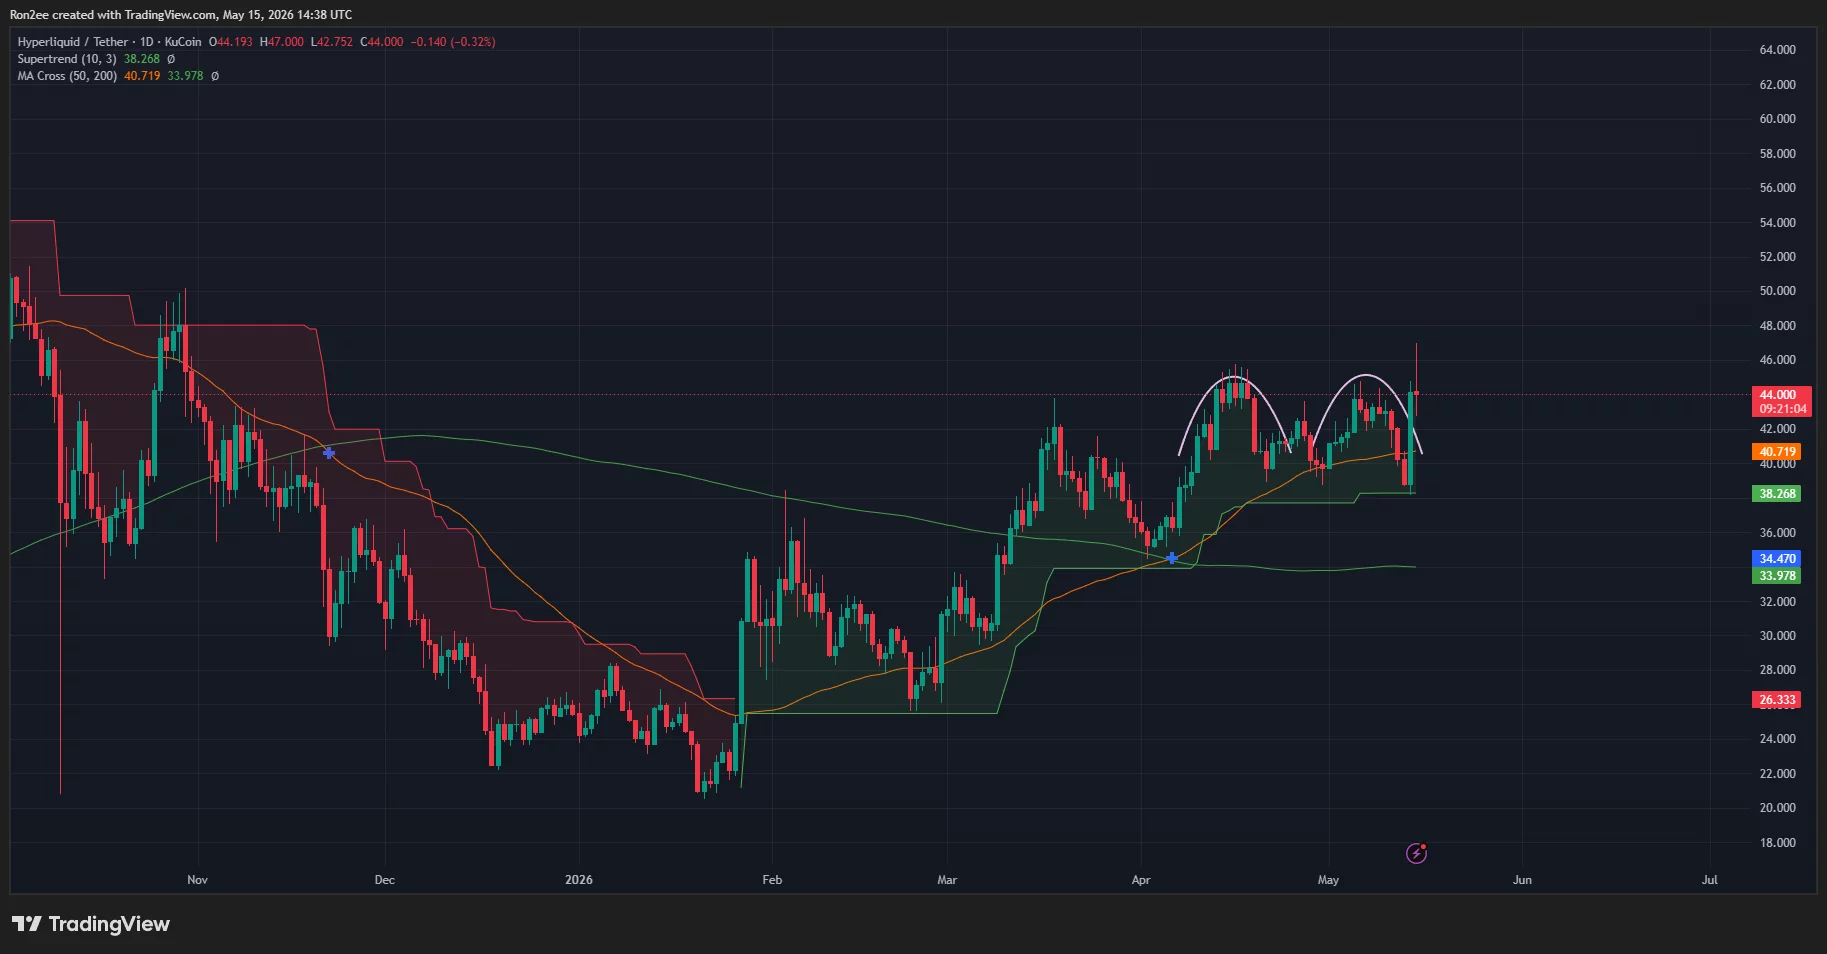
Hyperliquid price remained volatile this week after rebounding sharply from a recent pullback, while growing institutional involvement and the launch of new spot exchange-traded products strengthened bullish sentiment surrounding the decentralized trading protocol.
Summary
- Hyperliquid price rebounded toward $46 after bulls invalidated a bearish double top pattern and defended key support near $38.
- Bitwise launched one of the first U.S.-listed spot HYPE ETFs with native staking, intensifying competition with recent 21Shares products.
- Coinbase and Circle developments strengthened institutional optimism around Hyperliquid as demand for DeFi trading infrastructure continued rising.
According to data from crypto.news, Hyperliquid (HYPE) price was trading around $44 at press time on May 15 after briefly surging above the $46 region earlier in the session. The token has recovered significantly from its January lows near $22 as demand surrounding decentralized perpetual trading infrastructure continued rising.
One of the biggest catalysts supporting Hyperliquid this week was the launch of the new spot Hyperliquid ETF from Bitwise Asset Management.
The Bitwise Hyperliquid ETF officially begins trading on Friday and is among the first U.S.-listed spot HYPE investment products. The fund also incorporates native staking through Bitwise Onchain Solutions, allowing investors to gain both spot exposure and staking-related yield.
The launch highlights the accelerating institutional race to offer regulated exposure to decentralized finance infrastructure beyond Bitcoin and Ethereum.
Competition within the emerging Hyperliquid ETF market has also intensified rapidly. Earlier this month, 21Shares launched two HYPE-linked ETFs in the United States, including the spot-focused THYP product and the leveraged 2x Long HYPE ETF trading under the ticker TXXH.
The growing number of ETF launches reflects rising investor demand for exposure to on-chain trading ecosystems as decentralized finance continues attracting both institutional and retail participation.
Hyperliquid has also benefited from broader institutional integration narratives involving major crypto infrastructure companies. Recent developments tied to Coinbase and Circle have further strengthened investor confidence in the ecosystem, particularly as stablecoin infrastructure and institutional trading connectivity around Hyperliquid continue expanding.
Hyperliquid price analysis
On the daily chart, Hyperliquid recently appeared to form a bearish double top pattern near the $45–$46 resistance zone after two consecutive rejection attempts around similar highs.

However, bulls have now largely invalidated the bearish setup following the latest rebound from the $38 support region. The quick recovery back toward the prior highs suggests buyers continue aggressively defending the broader uptrend despite short-term volatility.
At the same time, HYPE remains firmly above both its 50-day and 200-day moving averages, a structure that typically signals strengthening bullish market conditions. The 50-day moving average also continues trending sharply upward above the 200-day moving average, reinforcing the ongoing bullish momentum shift.
The Supertrend indicator additionally remains in bullish territory on the daily timeframe, with support currently positioned near the $38 region. As long as HYPE continues holding above that area, the broader bullish structure may remain intact.
Momentum indicators also suggest the recent cooldown may have primarily been a healthy consolidation phase rather than the beginning of a larger reversal. Price action over the past several weeks resembles a potential bullish continuation structure following Hyperliquid’s explosive rally earlier this year.
If bulls successfully reclaim and hold above the $46 resistance region, Hyperliquid could attempt another breakout toward the psychological $50 level in the short term.
On the downside, failure to hold above the current support structure near $38 could weaken bullish momentum and potentially expose HYPE to a deeper correction toward the 200-day moving average near the $34 region.
Disclosure: This article does not represent investment advice. The content and materials featured on this page are for educational purposes only.

Long Island Rail Road strike will halt North America’s largest commuter system

Sticky Inflation Tests Markets As Credit Holds Firm

CLARITY Act clears committee with hurdles ahead
Manchester United reach agreement with Casemiro over contract clause amid transfer speculation

US brings back mandatory military draft registration

Steven Gerrard disagrees with Gary Neville over ‘shock’ Chelsea and Arsenal claim | Football


-

 Fashion5 days ago
Coffee Break: Travel Steam Iron
-

 Fashion15 hours ago
Weekend Open Thread: Theory – Corporette.com
-

 Fashion5 days ago
What to Know Before Buying a Curling Wand or Curling Iron
-

 Politics4 days ago
What to expect when you’re expecting a budget
-

 Tech6 days ago
Auto Enthusiast Carves Functional Two-Stroke Engine from Solid Metal
-

 Crypto World8 hours ago
BloFin War of Whales 2026 Grand Prix opens registration for $5M trading championship
-
 Business7 days ago
Ignore market noise, India’s long-term story intact, say D-Street bulls Ramesh Damani and Sunil Singhania
-

 Tech5 days ago
GM Agrees To Pay $12.75 Million To Settle California Lawsuit Over Misuse Of Customers’ Driving Data
-

 Crypto World7 days ago
PROS explodes 48% as Upbit and Bithumb listings ignite demand
-

 Tech1 day ago
Tech Moves: Microsoft AI leader jumps to OpenAI; former AI2 exec joins Meta; and more
-

 Crypto World6 days ago
CZ says US crypto rivals tried to block Trump pardon
-

 Tech4 days ago
GM agrees to $12.75M California settlement over sale of drivers’ data
-
Crypto World3 days ago
Bitcoin Suisse expands with Digital Asset License and Investment Business Act Registration Approval in Bermuda
-

 Crypto World14 hours ago
E-Estate Announces 1 Year Live: Washington DC Summit as Real Estate Tokenization Enters Its Next Phase
-

 Politics3 days ago
Pakistan to enter Chinese capital market as war inflation bites
-
 Crypto World2 days ago
Google’s Gemini AI Predicts Incredible Solana Price by the End of 2026
-

 Crypto World3 days ago
Bitcoin Suisse expands with Digital Asset License and Investment Business Act Registration Approval in Bermuda
-

 Politics6 days ago
Sky News Presenter Says Keir Starmer Is Not Waving But Drowning
-
Crypto World7 days ago
Hacker Drains $5.9M From Ethereum Liquidity Provider TrustedVolumes
-

 Fashion6 days ago
Amazon Sundays: Spring Glassware & Vases
You must be logged in to post a comment Login