

Crypto World
Coins.ph adds Bitcoin and Ethereum to Philippines QR payments


- Coins.ph adds BTC and ETH payments to the Philippines QRPh system.
- Users can spend crypto at 700,000 QRPh-enabled merchants.
- Stablecoins remain key for remittances and daily crypto payments.
Coins.ph has expanded its QRPh crypto payment functionality to support Bitcoin and Ethereum transactions, broadening the use of digital assets within the Philippines’ national QR payment infrastructure.
The Manila-based crypto platform announced on May 19 that users can now pay merchants nationwide using Bitcoin (BTC) and Ethereum (ETH) through QRPh, the national QR code standard developed by the Bangko Sentral ng Pilipinas (BSP).
The expansion builds on Coins.ph’s earlier rollout of QRPh-compatible stablecoin payments, which introduced support for USDT earlier this year.
Under the system, crypto balances are automatically converted into Philippine pesos during checkout, allowing users to pay merchants directly without manually converting digital assets into local currency beforehand.
Coins.ph estimates that the integration enables crypto payments across approximately 700,000 QRPh-enabled merchants throughout the country.
Crypto payments expand within national QR infrastructure
The latest update broadens the range of cryptocurrencies supported within the Philippines’ existing QR payment ecosystem.
QRPh serves as the national QR code standard designed to enable interoperable digital payments between financial institutions and merchants across the country.
Earlier this year, Coins.ph became the first digital wallet provider in the Philippines to integrate direct crypto payments into the national QR infrastructure through stablecoin support.
The company said the earlier USDT rollout generated substantial transaction volume and demonstrated growing consumer demand for crypto-based payments integrated into everyday financial activity.
With the addition of Bitcoin and Ethereum, Coins.ph is now extending access to two of the world’s largest cryptocurrencies while maintaining the same checkout experience used for stablecoin payments.
The company said the process allows users to scan QRPh codes at merchants while the system automatically converts crypto into Philippine pesos in real time.
Stablecoins remain central to remittance use cases
Coins.ph said stablecoins continue to play a key role within the broader payment infrastructure, particularly given the Philippines’ position as one of the world’s largest remittance markets.
The country receives approximately $38 billion in annual remittance inflows, according to the company.
Stablecoins have increasingly become part of cross-border payment flows, allowing recipients to receive and hold digital dollar-denominated assets before converting or spending them locally.
Coins.ph said the QRPh integration enables users to move between fiat currency and digital assets within a single payment flow, removing additional conversion steps that are often required in crypto transactions.
The addition of Bitcoin and Ethereum broadens supported payment assets while preserving what the company described as a unified payment experience focused on practical daily use.
Coins.ph highlights broader crypto adoption growth
Coins.ph operates as a licensed Virtual Asset Service Provider and Electronic Money Issuer under BSP regulation.
The Philippines remains one of the fastest-growing crypto markets globally. According to estimates cited by the company, the country now has more than 15 million crypto users, representing roughly 13.4% of the population.
Wei Zhou, CEO of Coins.ph, said:
“The addition of new tokens to our QRPH crypto payments feature is a great achievement following the landmark introduction of USDT payments for the Philippine financial landscape. We aren’t just adding new tokens; we are redefining what a digital wallet can do. This is the future of finance in action and we’re making the world’s most popular cryptocurrencies a functional part of the Filipino daily life.”
Coins.ph said its broader platform combines digital assets, payments infrastructure, remittances, foreign exchange services, investments, and treasury products into a unified financial ecosystem designed to support both businesses and consumers.

Welcome to our institutional newsletter, Crypto Long & Short. This week:
- Alec Beckman on why BTC-backed lending is not a crypto story, but a capital efficiency story.
- Serena Sebastiani on how stablecoins aren’t a crypto product; they’re becoming the settlement infrastructure global finance forgot.
- Top headlines institutions should pay attention to by Francisco Rodrigues.
- “Ethena’s Solana lending markets cross $1B in 4 days” in Chart of the Week.
Thanks for joining us!
Expert Insights
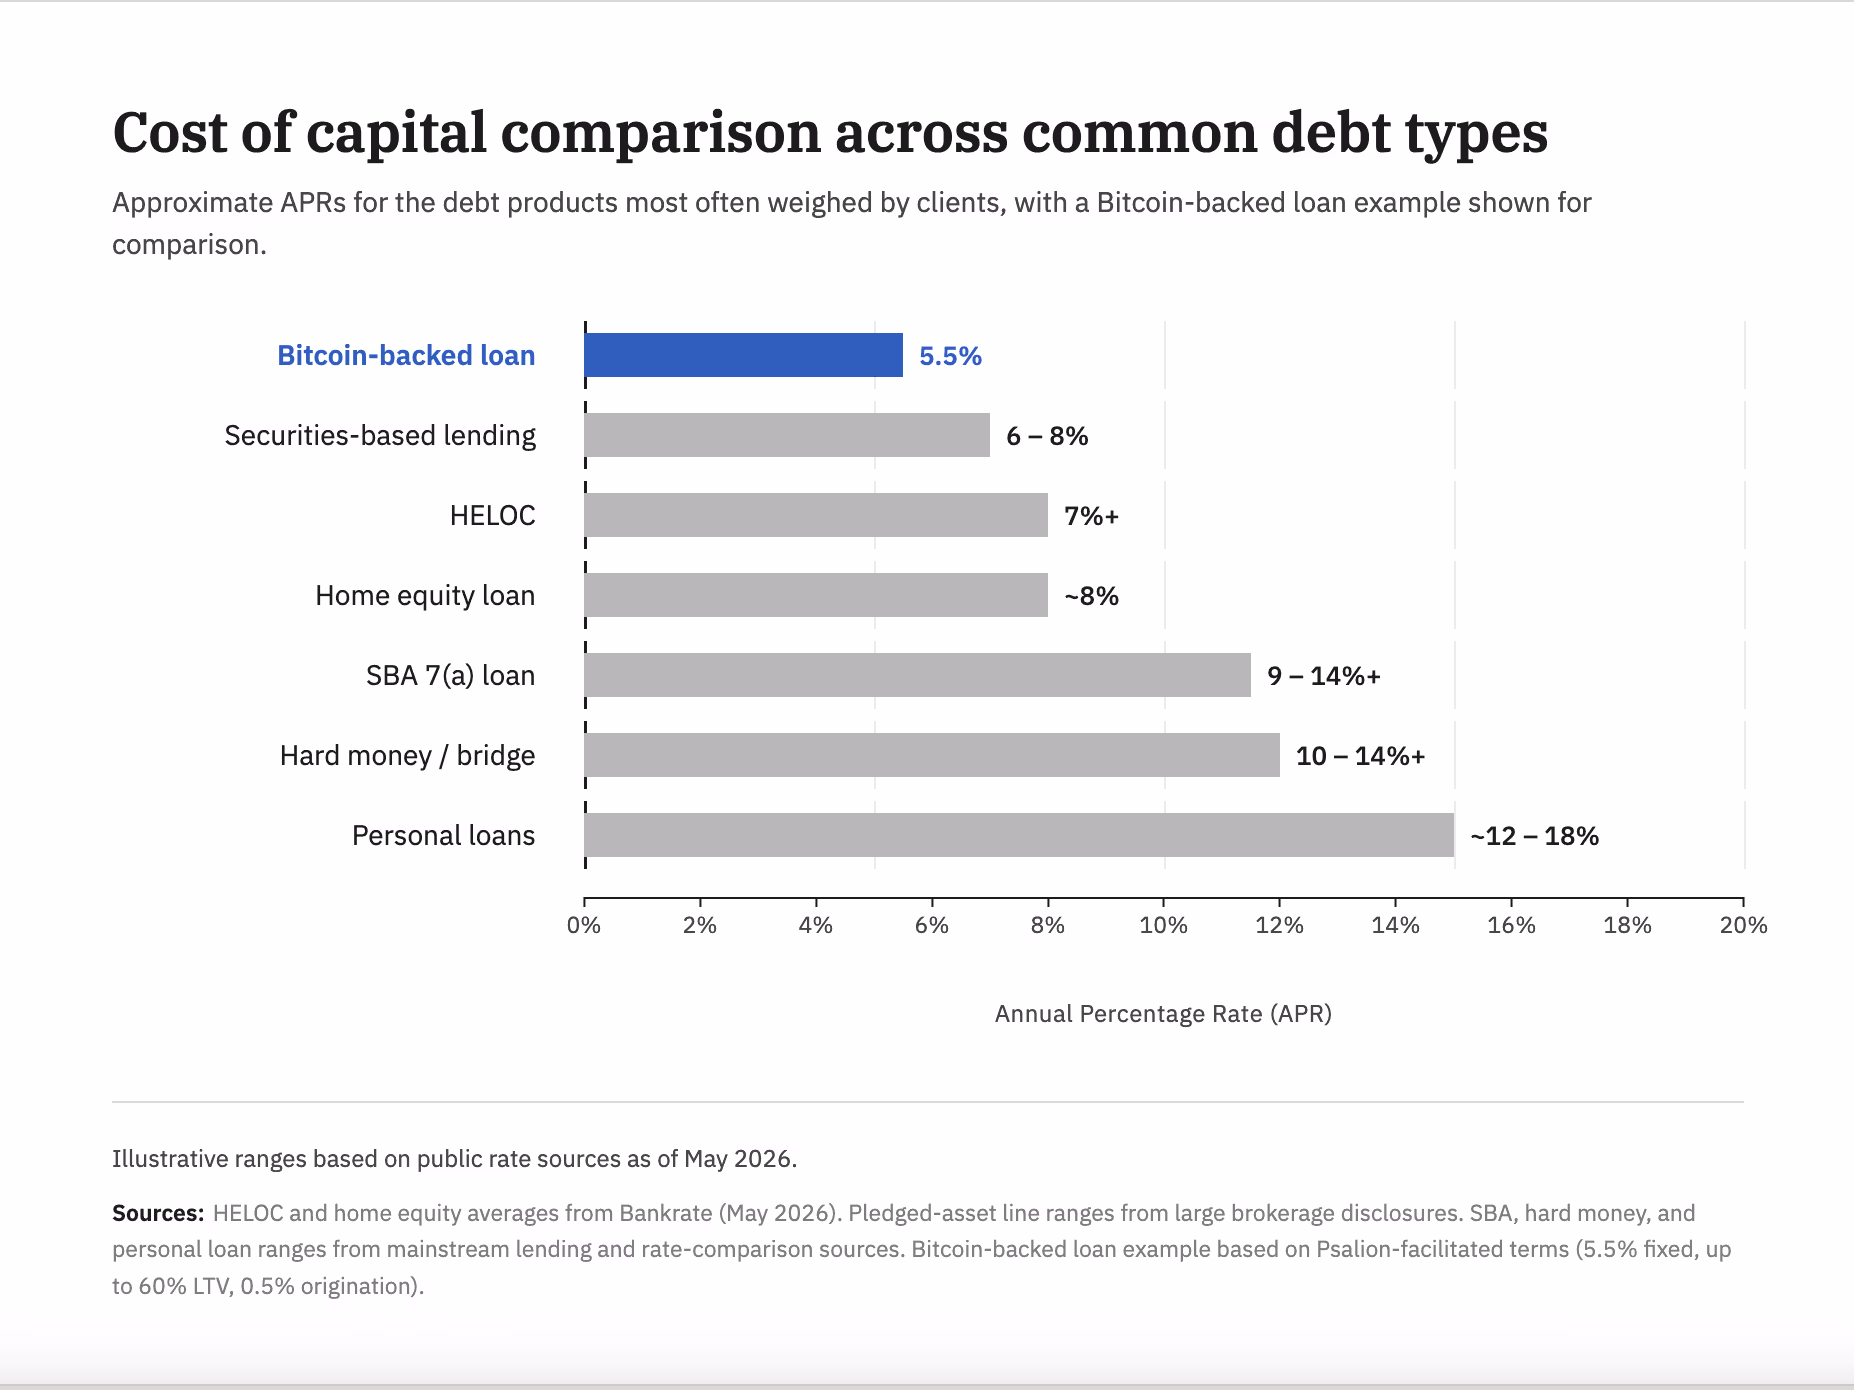
Bitcoin-backed loans belong in the cost-of-capital conversation
By Alec Beckman, VP of the Americas, Psalion
The argument is not about whether to buy bitcoin or not. It is for advisors, real estate investors, small business owners and founders who already own it, or work with clients who do. The practical question is simple: if a client carries meaningful debt, why is BTC-backed lending not in the capital stack discussion? Debt-heavy professionals already compare collateral, rate, fees, speed and covenants. Bitcoin-backed loans should be evaluated the same way.
The debt menu is familiar. HELOCs are tied to home equity, often variable, and currently sit above 7% for many borrowers. Hard money and bridge loans can move quickly, but often price around 10% to 14% plus points. Securities-based lending can be efficient, but rates often begin around 6% to 8% and require sizable brokerage assets in one place. Personal loans frequently land in the low-to-mid teens. SBA loans can be useful, but the all-in cost, documentation and time to fund are not trivial.

Bitcoin-backed lending changes the collateral, not the math. The borrower pledges BTC, receives dollars or stablecoins and repays under agreed terms. The asset is liquid, verifiable and easy to monitor. Market rates still vary widely, but more competitive structures are emerging. At Psalion, for example, we facilitate access to Bitcoin-backed loans at a 5.5% fixed rate, up to 60% LTV, with a 0.5% origination fee. That is one data point, but it shows why the category belongs in a serious debt comparison.
Rate matters first. For someone already holding BTC, the relevant question is not “Should I borrow?” It is “Where should I borrow?” Against a house? A business? A securities portfolio? Or BTC? If BTC collateral produces cheaper capital than the borrower’s existing debt, it can reduce the blended cost of capital.
Fees matter next. Hard money can carry points on origination. SBA structures can include guarantee fees, closing costs and advisory costs. Personal loans may embed higher APR through origination. Lower fee bitcoin-backed lending can make the all-in economics materially cleaner.
Friction matters too. Traditional credit often requires income verification, tax returns, appraisals, operating statements, personal guarantees, covenants and time. BTC-backed lending is collateral-first. The collateral can be verified quickly and monitored continuously. Faster access to liquidity is not just convenience. It can change the economics of a refinance, acquisition, tax payment or bridge need.
Advisors should care because BTC is now part of more client balance sheets. Too often, BTC sits idle while the same client pays higher rates elsewhere. If the client can borrow against BTC and replace more expensive debt, the advisor has improved the balance sheet without forcing a sale and potentially creating a taxable gain.
There is a second use case: yield on spread. Some real estate investors, founders and business owners see opportunities where expected returns exceed their cost of capital, such as private credit, commercial real estate lending, inventory or operating expansion.

Borrowing against BTC to pursue those opportunities can make sense when the borrower understands both sides of the trade: the yield opportunity and the collateral risk.
That risk is real. Bitcoin is volatile. If the price falls enough, LTV can breach agreed thresholds and trigger margin calls or liquidation. Liquidation can create a taxable event. This is not for every client. It is for borrowers who understand BTC volatility, maintain liquidity and size loans conservatively below maximum LTV.
For clients who already own bitcoin and already carry debt, BTC-backed lending is not a crypto story. It is a capital efficiency story. Ignoring it may mean leaving cheaper capital, or a valuable spread opportunity, on the table.
Principled Perspectives
Stablecoins are now infrastructures
By Serena Sebastiani, chief strategy officer and head of government and regulatory affairs, Fuze
There’s a kind of financial friction that becomes invisible when you live inside it long enough.
From New York or London, cross-border payments work. From Nairobi, Jakarta or Almaty, they don’t.
An SME in Nairobi pays a supplier in Karachi. The money leaves Monday. It arrives Thursday. Along the way it passes through two correspondent banks, absorbs fees on both ends, gets hit with an FX spread on the USD conversion and triggers multiple compliance checks. Both the buyer and the supplier absorb the friction by pricing it into the deal and extending the credit note.
This is how it actually works to operate across the fastest-growing trade corridors globally: Gulf to South Asia, intra-African trade, CIS to MENA, and Southeast Asia remittances.
Multiply that by the $136 billion SME trade finance gap in Africa alone. Multiply it by the $100 billion in annual remittances flowing into the continent. Multiply it across the Gulf-to-South-Asia corridor, CIS-to-MENA and intra-ASEAN. And also account for the cost of sending money into Sub-Saharan Africa, which remains the most expensive region in the world, at 8.3% on average (almost three times the UN’s 3% target). In live corridors today, stablecoin rails are already operating at under 1%. What we’re looking at is not simply a matter of optimizing the margins, but a structural gap in the fastest-growing regions of the global economy.
SWIFT was built for a specific world: large banks, large tickets and major financial centres. It works perfectly for that world. Yet the supplier payment in Nairobi, the remittance from Riyadh to Manila, or the trade settlement between Almaty and Istanbul has been making do with infrastructure designed for someone else’s economy.
That’s the gap stablecoins are moving into, and they’re not a product but real plumbing.

Chart 1: The Remittance Cost Gap
Sources: World Bank (Q1 2025); UN SDG 10.c; Transak / Operational corridor data
What we observe from the ground
I spent time with regulators and market operators across high-growth corridors and a pattern that emerges is that people closest to the friction are the least ideological about the solution. They are the ones actually trying to integrate stablecoins into the existing financial system.
In Kigali for example, the framing isn’t “crypto adoption.” Rwanda’s National Bank launched a CBDC pilot in February with cross-border interoperability as the explicit design priority. A draft Virtual Assets Law now in parliament applies a clean two-tier structure: Central Bank oversight for payment stablecoins and Capital Markets Authority for investment instruments. A fintech license passporting agreement with Kenya, signed in March, is already being designed as a template for the East African Community. This is regulatory infrastructure being built with precision, for a specific problem, by people who understand their own market.
The insight is not Rwanda-specific, but Africa-wide, where mobile money already functions as the default financial layer. With over a billion registered accounts, 96% financial inclusion in markets like Rwanda, this distribution infrastructure took decades to build. What mobile money never solved for is cross-border interoperability. Stablecoins fit that gap naturally, not replacing fiat currencies, but acting as the settlement layer that makes mobile money efficient.
The same logic, four corridors
Middle East
The Central Bank of UAE’s Payment Token Services Regulation treats stablecoins as settlement infrastructure rather than speculative securities. That regulatory framing is practical and allows banks to issue AED stablecoins that can be used directly as a means of payment, and banks and licensed fintechs can build on stablecoin rails without treating every transaction as a liability. In this way, the Gulf stablecoin settlement is happening inside regulated perimeters.
CIS markets
In Kazakhstan, Uzbekistan and Georgia, the driver is dollar access. Domestic currency volatility creates structural demand for USD, and formal banking doesn’t reliably provide them. Stablecoin adoption here is dollarization leveraging a new distribution channel. The institutional opportunity is providing that access inside a compliance framework, with the custody and reserve standards that make it durable.
Southeast Asia
In Southeast Asia, the driver is cost and speed. In corridors like Gulf-Indonesia or Gulf-Philippines for remittances, stablecoin rails eliminate the need for pre-funding and speed up settlement from days to minutes (often under 20 minutes, 24/7). Cost reductions of 40–80% are already observable in operational flows.
I engaged with regulators, banks and fintechs in these markets. The question here is: how can we facilitate higher volumes on stablecoin rails and give back to the households?
Africa
Remittances are expensive, but the B2B case is urgent as well. Intra-African trade only accounts for 16% of total trade, against 68% for Europe and 59% for Asia. The AfCFTA created the legal architecture for a $3.4 trillion market, but the payment infrastructure hasn’t kept up. Chinese traders sourcing African goods are already settling in USDT because it is superior for their transaction sizes and timelines. To make this properly institutional and largely adopted, the essence is to guarantee that the activity happens compliantly, with proper rails.

Chart 2: Intra-Regional Trade Share — Africa vs Peers
Sources: UNCTAD / AfDB / WTO; World Bank / African Union (AfCFTA projection)
Stablecoins are infrastructure
Global banks and fintechs are still largely approaching stablecoins as a product to distribute to customers. The more significant opportunity is treating them as infrastructure to build on, particularly in remittances and B2B payment flows: treasury management, supplier payments and FX settlement. These are flows where the speed improvement and cost reduction are measurable (minutes vs days, basis points), and where the compliance trails on well-designed digital rails are demonstrable and trackable. These include on-chain transaction monitoring, wallet attribution and automated regulatory reporting that produces a compliance record that informal transfer channels structurally cannot. The data generated by these rails is what gets correspondent banking relationships restored in markets where de-risking has cut them.
Solving the friction
What remains to be solved for the infrastructure to properly work at scale? Regulatory frameworks that define reserve standards and redemption rights, cross-border supervisory coordination and AML/CFT laws interoperability.
All this is being worked through, and more in the market that matters (high-growth) than in established developed countries.
From experience working with regulators and now proactively engaging with them, I learned that the pattern that works is: 1. A phased licensing framework that lets regulators learn alongside the market; 2. Proportionate requirements scaled to institutional size and risk profile; 3. Bilateral passporting agreements that make compliance portable across corridors.
The corridors where this infrastructure is most needed are not waiting for global standards to arrive but are actively building. The question for global institutions is whether they’re part of that architecture or arriving late to fintech-leading infrastructure.
Headlines of the Week
This week’s headlines show structural progress on Wall Street’s onchain push, with a market-structure bill clearing its biggest hurdle, JPMorgan extending its tokenization stack, and asset managers tackling the redemption-speed problem. Solana has meanwhile kept quietly cementing its infrastructure for institutional use.
- Clarity Act clears U.S. Senate committee, on its way to a final test in Congress: Chairman Tim Scott secured a 15-9 bipartisan vote with Democrats Gallego and Alsobrooks crossing over, though unresolved law enforcement and government-ethics provisions still stand between the bill and a floor vote before the summer recess.
- JPMorgan files to launch new tokenized fund as Wall Street tokenization race heats up: The Ethereum-based JLTXX fund, run through JPMorgan’s Kinexys blockchain unit, is structured to satisfy GENIUS Act stablecoin reserve requirements — landing days after BlackRock filed for its own tokenized Treasury vehicle.
- BlackRock, Janus Henderson tokenized funds get instant redemptions with new $1 billion facility: Grove’s Basin facility advances stablecoin liquidity against approved redemptions from BlackRock’s $2.2 billion BUIDL and Janus Henderson’s $1.1 billion JTRSY, targeting the multi-day settlement gap that has held back the $15 billion tokenized Treasury market.
- Mike Novogratz’s Galaxy receives New York BitLicense for institutional crypto push: NYDFS cleared GalaxyOne Prime NY to serve hedge funds, RIAs and family offices on a $9 billion platform, making Galaxy only the second firm to win a BitLicense in 2026 after Strike.
- Solana is shedding its memecoin reputation as big banks move billions into its ecosystem: A Messari report shows Solana’s tokenized RWA market cap jumped 43% QoQ to $2.01 billion, with BlackRock’s BUIDL, Ondo, Franklin Templeton and a Citigroup-PwC trade finance PoC live on the network, alongside payments integrations from Visa, Stripe, PayPal and Western Union.
Chart of the Week
Ethena’s Solana lending markets cross $1B in 4 days
Combined USDe and USDG supply across the Bitwise-curated Jupiter Lend market and the Kamino Ethena market rose from $401M on launch day (May 12) to $1.06B on May 16 – driven almost entirely by looper-led growth on Jupiter Lend, where supply climbed from $201M to $812M while Kamino’s Ethena Prime vault held steady around $250M.

Listen. Read. Watch. Engage.
Looking for more? Receive the latest crypto news from coindesk.com and market updates from coindesk.com/institutions.


MoneyGram has become Tempo’s anchor remittance validator in a new strategic blockchain partnership designed to enhance cross-border payment infrastructure.

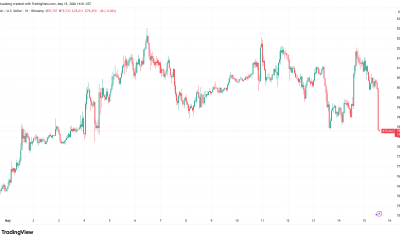
Ether (ETH)is shaping up for a potentially sharper slide as a bearish continuation pattern tightens on the daily chart. A break below the lower boundary of a bear flag around $2,000 could accelerate selling, with the measured target pointing toward roughly $1,075—about a 49% decline from prevailing levels. The sequence would echo a similar breakdown seen in January, when ETH tumbled more than 41% from its highs.
Beyond the chart look, the risk matrix includes potential liquidity shocks for leveraged longs and a cooler stance from large holders. If prices slip past $2,000, market data projects over $1.7 billion in long ETH liquidations across major exchanges, underscoring the fragility of bullish bets in a downward-biased setup. At the same time, holders’ behavior signals growing caution among big and mid-size players, even as ETH attempts a rebound toward the $2,400 area earlier this week.
Key takeaways
- Bear flag target for ETH sits near $1,075, implying about a 49% drop from current levels if the pattern resolves to the downside.
- A break below $2,000 could unleash more than $1.7 billion in leveraged long liquidations across exchanges, amplifying downside momentum.
- Whale activity has cooled, with mega‑whales (addresses holding more than 10,000 ETH) at a 10‑month low and large holders reducing exposure, signaling waning mid‑term conviction.
- Technical and momentum signals are deteriorating, including a potential death cross and weakening daily and weekly RSI readings, increasing the risk of a sustained pullback.
Bear flag dynamics and historical context
Market technicians describe a bear flag as a bearish continuation pattern that forms after a sharp decline followed by a brief consolidation within a rising channel. The pattern’s measured move is calculated by taking the prior downtrend’s height and projecting it from the breakdown point. In ETH’s case, a breakdown below the $2,000 level yields a target near $1,075, representing a substantial retracement from the current zone.
Analysts have pointed to a January breakdown as a recent precedent for how such patterns can unfold. The price action then produced a meaningful correction, reinforcing the idea that the flag’s target is not merely theoretical but anchored in actual price history.
Beyond the chart, sentiment around ETH’s near‑term path remains fragile. If price cannot hold above the trend line around $2,000, a sequence of lower supports could come into play, potentially widening the slide toward the mid‑$1,000s. Some observers stressed that if the bear flag fails to hold, risk can extend to around $1,300 before any stabilizing relief appears, though this remains contingent on the speed and depth of selling pressure.
Liquidity risk and positioning implications
When price nears critical supports, the risk of cascading liquidations increases for leveraged traders. Data aggregators project that a decisive break below $2,000 could trigger more than $1.7 billion in long ETH liquidations across exchange platforms, reflecting the heavy exposure that buyers carried into the current setup. This dynamic tends to feed a self‑reinforcing cycle: as liquidations mount, selling pressure intensifies and price tends to move lower still.
The scale of potential liquidations aligns with a broader narrative of thinning bullish conviction in the immediate term. For many traders, that means a heightened emphasis on risk controls, tighter stop placement, and a readiness to adapt to evolving price signals rather than assume a bottom is at hand simply because ETH rebounded from a dip.
Whale and holder dynamics
On the ownership front, Glassnode and related trackers have shown a cooling in large‑holder activity. The number of mega‑whale wallets—those holding more than 10,000 ETH—has fallen to a 10‑month low, around 1,050 addresses, signaling a reduction in the willingness of the biggest players to back sizable ETH bets at current levels. The tier just below, wallets holding between 1,000 and 10,000 ETH, also declined to a nine‑month low of about 4,750, with a negative month‑over‑month shift continuing to weigh on mid‑sized holders.
Taken together, the data paints a picture of retreat rather than accumulation among top cohorts, a trend that can magnify downside risk if price breaks lower. The broader pattern suggests a shift toward de‑risking and exit for many large holders, consistent with a market seeking clearer directional catalysts before re‑loading.
Coin participants have also pointed to inflows into exchanges as a signal of potential selling pressure building in the near term. In an environment where big holders are trimming exposure and leveraged long bets face a liquidity squeeze, such institutional dynamics can help explain why the path of least resistance remains downward in the short horizon.
What to watch next
Traders should monitor the $2,000 level closely, as a decisive move beneath it would raise the odds of a test of the bear flag’s lower targets and invite a wave of liquidations. On the other hand, sustained price action above $2,000 and a successful hold above nearby support could inject relief into the market, especially if momentum indicators turn more constructive on the daily and weekly timeframes. The confluence of a potential death cross, deteriorating RSI signals, and the ongoing distribution among top wallet cohorts forms a complex risk picture that remains sensitive to macro and on‑chain developments.
As the market weighs these technicals against broader crypto and macro trends, investors will be watching for signs of a revival in conviction—whether through renewed accumulation by large holders, a shift in exchange flows, or a macro‑driven bid that can flip the near‑term downbeat narrative. Until then, ETH remains vulnerable to a test of the lower boundary of its current pattern, with the next few trading sessions likely to reveal whether the bears have the upper hand or a new catalyst emerges to re‑ignite momentum.


- Jupiter price traded between $0.19 and $0.21, up 8% in the past 24 hours.
- TVL rose to $2.94 billion, and Jupiter launched Metis V8 to reduce execution drift.
- The technical picture included a daily RSI at 52 and an upsloping.
Jupiter (JUP) rose more than 8% in the past 24 hours, with prices respecting a rising trendline support.
The jump in the JUP token’s value has coincided with the protocol’s total value locked (TVL) climbing to $2.94 billion amid the launch of Metis V8, an update to a routing engine with over $2 trillion in lifetime volume.
As the DEX aggregator’s native token rises, the key question is whether the technical picture gives the bulls an edge.
Jupiter price surges as TVL jumps to $2.94 billion
JUP was trading within an intraday range between $0.19 and $0.21, with prices up more than 8% and daily volume up roughly 37% to over $26 million. The Jupiter market capitalization expanded to $700 million.
Elsewhere, the protocol’s TVL increased to $2.94 billion, marking a notable jump from $2.30 billion on May 1, 2026.
The significant rise reflects renewed capital inflows and increasing usage.
In crypto, total value locked acts as an important metric that measures assets committed to a protocol, indicating liquidity depth, user trust, and the ecosystem’s capacity to support large trades without severe slippage.
Leading tokens contributing to Jupiter’s TVL are SOL, USDE, USDG, and WBTC, highlighting both native Solana liquidity and bridged/pegged assets that underpin cross-asset routing activity.
Jupiter eyes further DeFi traction with Metis V8
As a leading DEX aggregator on Solana, Jupiter has maintained prominence by optimizing routing and reducing execution friction for traders.
The project witnessed negative sentiment that cooled interest earlier in May, aligning with broader market turmoil.
However, the protocol has attracted fresh flows and could reinforce a bullish picture via its product enhancements.
On Wednesday, Jupiter announced the launch of Metis V8, the latest iteration of its DeFi routing engine designed to tighten execution quality.
Metis V8 focuses on reducing Quotation Execution drift using slippage penalties and implements just-in-time (JIT) on-chain finalization to improve execution certainty.
Metis V8: Solving The QE Drift
Metis, the top router in DeFi with more than $2T+ in lifetime volume, has always been focused on the hardest problems in routing. And these days, it is not just about finding the best quote, it is about making sure what lands is as close to the… pic.twitter.com/sTYi867DUx
— Jupiter (@JupiterExchange) May 20, 2026
The update also targets sub-2 slot latency and introduces a rapid quotation mode.
Jupiter says the update aims at minimizing adverse price movement between quote and execution.
These technical improvements should strengthen Jupiter’s value proposition for high-frequency routing and larger order flows, potentially translating to sustained TVL and fee generation.
JUP price forecast
The JUP token has bounced strongly from the $0.19 area as bulls attempt to extend a recovery that followed a swift reversal from highs near $0.27 down to $0.18 between May 10 and May 17, 2026.
Gains mean buyers could look to test a key supply zone once more, with this corresponding to local highs recorded in late December 2025 and again this May.

On the technical front, momentum indicators show mixed signals.
The daily RSI sits around 52 and is upsloping, suggesting mild bullish momentum and room for further gains.
However, the Supertrend indicator currently issues a sell signal, reflecting potential downside risk following the surge from lows of $0.15 in April.
Until price decisively breaks higher, the near-term resistance levels to monitor would be $0.23 and $0.27.
A more significant barrier would be at $0.30 and $0.45. On the flipside, key support levels could be at $0.17 and the $0.14-$0.13 area.


Six months ago, the first spot Dogecoin ETF started trading on a major US exchange. The flows have been tiny, the price has gone almost nowhere, and the whole experiment has played out in near-silence. That silence is the story. For an asset built on noise, behaving like a normal investment product is the most surprising thing Dogecoin has ever done.
Summary
- Spot Dogecoin ETFs have remained active six months after launch, with combined assets under management reaching nearly $14.7 million despite muted inflows and limited price movement.
- Products from REX Osprey, 21Shares, and Grayscale have started giving institutional investors multiple regulated ways to gain Dogecoin exposure through traditional markets.
- Recent ETF flow patterns have pointed to gradual accumulation by professional allocators rather than speculative retail trading that once defined Dogecoin’s market cycles.
A meme coin walked onto Wall Street, and nothing exploded
In November 2025, an asset created in 2013 as a literal joke about a Shiba Inu became eligible for an exchange-traded fund. By January 2026, a second one was trading on the Nasdaq, physically backed one-for-one by Dogecoin (DOGE) held in cold storage. As of mid-May 2026, both products are still live, both are still attracting money, and combined assets under management sit at roughly $14.7 million across the suite.
That is not a typo. Fourteen million dollars. For context, spot Bitcoin ETFs hit their first billion in a matter of weeks. Spot XRP ETFs are sitting on well over a billion. Dogecoin’s ETF complex, after six months, is smaller than a mid-sized private equity fund.
The instinct, looking at those numbers, is to write the whole thing off as a failure. That is the wrong read, and missing why it is wrong means missing what may be the most interesting quiet shift in crypto this year. The spot Dogecoin ETFs were never going to launch with a billion in inflows, because Dogecoin was never an asset that traditional finance was waiting to buy. What is actually happening is stranger and more telling. A meme coin is being slowly, boringly, and professionally accumulated by a small group of allocators who have decided it belongs in a portfolio. The trickle is the point. And it tells you something about what Dogecoin is becoming.
The two products, and why their differences matter
Before going further, it is worth understanding what exists, because the two live Dogecoin ETFs are not the same thing in different wrappers. There are two distinct bets about what Dogecoin is.
The first to launch was REX-Osprey DOJE, which listed on Cboe BZX on September 18, 2025. It is structured under the 1940 Act using a Cayman subsidiary that holds derivatives rather than DOGE itself. Day-one inflows came in around $17 million, a meaningful number that suggested real opening-day appetite. Eight months on, the fund’s AUM sits at roughly $17.8 million, essentially flat, and its net asset value was down more than 55 percent from inception to the end of 2025. The fee is 1.50 percent, expensive by ETF standards.
The second, 21Shares TDOG, launched on Nasdaq on January 22, 2026. It is the cleaner of the two products. Physically backed, one-for-one with Dogecoin held in cold storage, and charging a fee of 0.50 percent, in line with how the major Bitcoin and Ether ETFs are priced. As of early May 2026, TDOG’s AUM is around $4.1 million.
The two products tell two different stories. DOJE is the early-mover trade, a structured, derivatives-based vehicle that arrived first, sold itself to opportunistic buyers, and has been mostly digesting since. TDOG is the institutional-grade product, more expensive to build, cheaper to own, and aimed at a buyer who wants their Dogecoin exposure to look and behave like a normal ETF position. Add Grayscale’s GDOG, which now sits alongside TDOG as a magnet for the bulk of recent inflows, and you have a small but real product shelf. The maturity here is not in the dollar size. It is a fact that allocators now have a choice of how to hold Dogecoin in a regulated form. That choice did not exist eighteen months ago. It exists now.
What the inflow pattern actually shows
The story being told on crypto Twitter is that DOGE ETFs are “quietly cooking,” racking up inflow days, gathering momentum. The actual flow data is messier and, on close reading, more interesting.
What the spot Dogecoin ETFs have shown since launch is not a steady drumbeat of buying. It is long stretches of basically zero net flow, broken by sporadic days of small inflows. In one recent eight-day stretch, the funds saw net inflows on four of them, with monthly inflows in May running at roughly $1.3 million through mid-month and climbing toward $2.15 million as the month wore on. On May 19, with Bitcoin and Ether ETFs collectively bleeding more than $700 million, Dogecoin ETF activity jumped 215 percent and pulled in around $860,000 in net inflows in a single day.
None of those numbers is large. All of them are real.
The pattern behind those numbers is what makes the story worth telling. It is not retail mania. Retail mania looks like January 2021. It does not look like four inflow days out of eight at less than a million dollars each. The pattern looks much more like the early days of an asset that a small group of professional allocators has decided is worth a token allocation in a diversified book. They buy when there is rotation out of the majors. They sit on their hands when the broader market is dull. They are not trying to time DOGE’s next leg up. They are treating it as one of many uncorrelated bets that earn a single-digit-percent slot in a portfolio.
That is, by some distance, the most boring thing Dogecoin has ever been the protagonist of. And boring, here, is the most interesting word in the sentence.
What it means for an asset to “grow up”
For most of its life, Dogecoin was a behavior. Its price moved on tweets, on memes, on collective enthusiasm, on a sense among holders that the joke itself was the asset. The peaks were vertical, and the crashes were vertical. The thesis, to the extent there was one, was vibes.
A maturing asset behaves differently. It still has cycles, but the buyer base diversifies. A wider range of investors hold it for a wider range of reasons. Some are still there for the meme. Some are there for the payments use case, which Dogecoin is now genuinely being explored for in House of Doge’s enterprise pilots. Some are there because they read a research note recommending a small allocation as part of a multi-asset crypto basket, and the regulated ETF gave them the wrapper to act on it.
The behavioral signs of that diversification have started to show up. Whale wallets, addresses holding tens of millions of DOGE or more, have climbed through 2026 to multi-year highs. Steady ETF inflows, even tiny ones, reduce free-floating supply on the margin. DOGE recently broke above its full EMA stack for the first time since October 2025, a piece of technical evidence that the buyer mix has shifted. None of that is a moonshot signal. It is, again, the picture of an asset behaving more like an asset than like a vibe.
Two notes of caution worth keeping in mind. First, this transition is partial. Dogecoin is still highly volatile, still moves on sentiment, and still trades around $0.11 after a brutal first quarter that broke many holders. Calling it “mature” in the sense that Bitcoin is mature would be silly. The shift is from “pure meme” to “meme with an investable layer on top,” not to anything resembling a blue-chip asset. Second, the inflows are small enough that they could reverse in a single bad month and undo the trend. Six months of consistent net positive flow is a beginning. It is not yet a pattern that can survive a serious test.
The bigger thing the ETF approvals signaled
Step back from Dogecoin specifically, and the existence of these products says something more important than any flow number.
The SEC approved a spot ETF for an asset with no foundation managing its development in the traditional sense, no formal roadmap, no consensus use case beyond payments and culture, and a mascot that is a meme of a dog. That approval, under the new generic listing standards the SEC adopted in 2025, was the moment American securities regulation effectively decoupled “is this asset investable through a regulated wrapper?” from “does this asset have a serious institutional pitch?” If Dogecoin can have an ETF, the list of crypto assets that cannot is suddenly very short.
That has knock-on effects worth watching. It clears the path for ETFs covering other large meme or culture-driven tokens. It tells issuers there is real money in the long tail of regulated crypto products, even if no single fund will rival Bitcoin’s. And it forces a quiet rethink of what “investable” has ever really meant. For a long time, the unstated answer was: an asset serious people can defend in a meeting.
Dogecoin in an ETF wrapper is the asset that broke that definition. Once it breaks, it does not put itself back together.
What to actually watch from here
For a Dogecoin holder, or anyone trying to read whether this slow maturation is real or a head fake, the things worth tracking are unglamorous.
Watch whether net inflows stay positive over multiple months, not whether any single month spikes. Six straight months of net positive flow, including a brutal Q1, is more meaningful than any single big day. Watch whether TDOG and GDOG, the cheaper and more institutionally structured products, continue to attract the bulk of new money relative to DOJE. That is the cleanest signal of whether the buyer base is sliding toward more professional allocators. Watch whether House of Doge’s payments and enterprise work produce any visible adoption traction that gives DOGE a use case beyond culture. And watch whether ETF inflows hold up during the next genuine risk-off stretch in crypto, rather than evaporating the moment Bitcoin sells off.
If those things keep happening, slowly, in the same quiet way they have been, then six months from now the story will be hard to deny. A meme coin will have professionalized. It will not have stopped being a meme coin, but it will have grown an investor base that does not depend on the meme. That is not the moonshot most DOGE holders have spent years waiting for. It may be something more durable and more useful than the moonshot ever would have been.
For an asset that started as a joke about a dog, becoming a slightly boring portfolio holding is one of the strangest possible victories. It is, against the odds, that Dogecoin is actually winning.
This article is for informational purposes and does not constitute financial or investment advice. Cryptocurrency markets are volatile, and ETF flows, AUM, and prices change quickly; the figures described reflect reporting available as of mid-May 2026. Always do your own research.
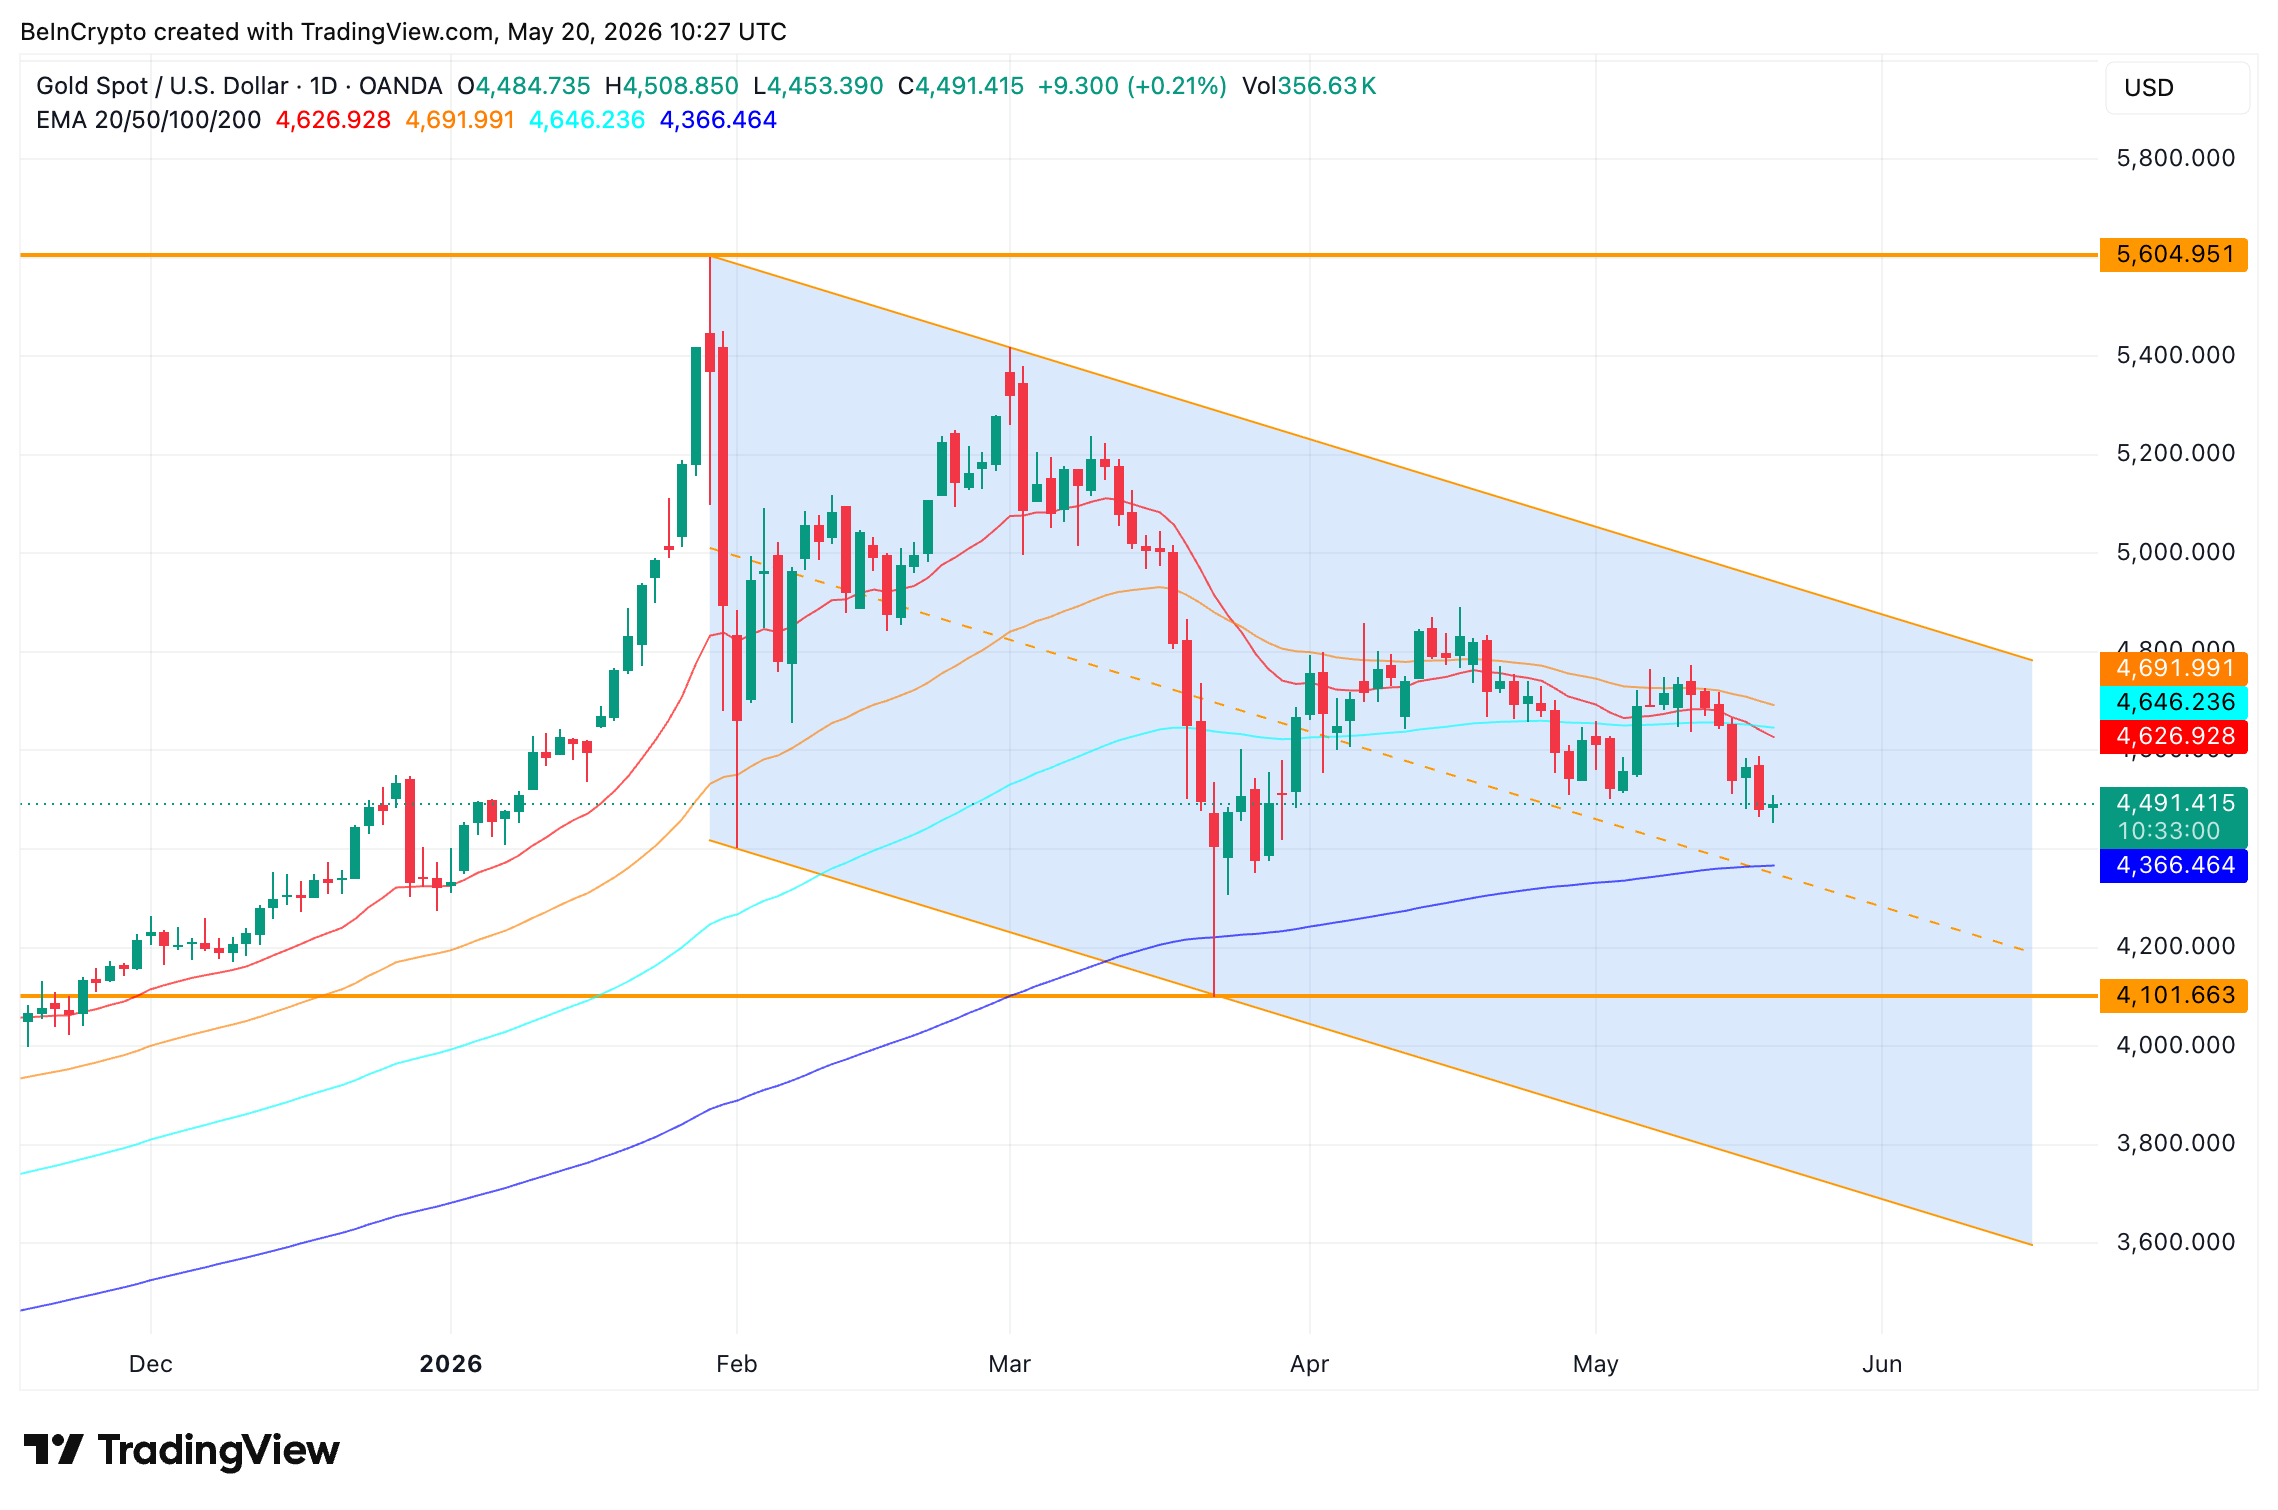
Gold price sits at $4,491 below most of its short-term moving averages, with commercial hedgers stacking shorts at the top while speculators add longs.
The breakdown sits inside a five-month falling channel that has held since January, while options positioning and Iran-oil tension acting on the dollar add layers to the bearish setup.
Gold Slips Below Three Short-Term EMAs Inside Falling Channel
Gold (XAU/USD) has been trading inside a descending channel since January, with the asset bouncing off the lower boundary on March 23 before recovering. The channel’s downward slope confirms the broader trend has been weakening even as buyers defended the floor each time.
Want more insights like this? Sign up for Editor Harsh Notariya’s Daily Newsletter here.
The structure has cracked further in recent weeks. Gold has broken below its 20-day, 50-day, and 100-day exponential moving averages (EMAs), trend indicators that weigh recent prices more heavily than older candles. Only the 200-day EMA still holds, at $4,366, marking the structural line in the sand for the broader uptrend.

The fact that gold lost three short-term EMAs without a clean reclaim suggests sellers control the immediate trend. The 200-day reclaim or hold becomes the next decisive factor, but positioning data adds the next layer of context.
Commercial Hedgers Sell the Top While Speculators Add Longs
The latest Commitments of Traders (COT) report from the CFTC, released on May 12, shows a sharp divergence in gold futures positioning. The COT report tracks commercial hedgers, who are physical-market participants like miners, refiners, and jewelers, against non-commercial speculators, who are typically managed money funds and large traders.
Commercial hedgers added 10,818 short contracts in the week ending May 12 (when the right shoulder top formed), a meaningful increase in bearish hedge positioning. Commercial shorts now make up 71.2% of open interest, the dominant force in the market.
Non-commercial speculators, by contrast, added 7,979 long contracts in the same week. Their net long exposure expanded even as commercials hedged aggressively.

Commercials are usually considered the better-informed money in gold futures, the smart money, This is because they have direct exposure to the physical gold supply chain. Their hedging behavior at price tops has historically been a contrarian bearish signal, and this divergence carries even more weight when options positioning shows hedging building on the other side too.
GLD Put Hedges Climb While Call-Heavy Open Interest Holds
The options market on the SPDR Gold Shares ETF (GLD) shows hedging accumulation that aligns with the COT divergence. The GLD put-call ratio by open interest sits at 0.58, meaning calls still outnumber puts among open contracts overall.
However, the open interest ratio has climbed from 0.47 lows in early February toward 0.58 as of May 19, suggesting put accumulation has accelerated. The volume ratio has also tightened to 0.97, meaning daily put and call volumes are almost evenly matched.

Implied volatility (IV) sits at 23.22% with an IV percentile of 62%, which measures the share of trading days over the past year that IV has been at or below the current reading. The percentile above 60% indicates options pricing is somewhat elevated.
The pattern across both venues lines up. The call-heavy open interest and bullish speculator longs reflect retail and managed money sentiment, while the rising put hedges and aggressive commercial shorts reflect institutional caution. The two venues tell the same story from different angles.
Iran-Oil Tension Pressures the Dollar and Adds to Gold’s Drift
The macro backdrop has been adding to gold’s swings. Iran-related geopolitical tension has kept oil markets unsteady through May, feeding into the dollar through the petrodollar feedback loop.
Higher oil prices lift inflation expectations, which can pressure the dollar but also support it when safe-haven flows dominate. Gold usually benefits from a weaker dollar and rising inflation but has not gained cleanly because the dollar has not moved decisively in either direction.
The metal is down roughly 6.83% over the past month while remaining up 36% year-on-year.

The recent month’s drift mirrors the indecision in the macro chain, where conflicting forces have prevented a clean directional move. With macro forces stuck in equilibrium, the Gold price chart becomes the final decider.
Gold Price Levels That Decide Whether the Pattern Confirms
The gold price action across April and May has carved a head-and-shoulders pattern inside the descending channel. The left shoulder formed in early April. The head peaked near $4,890 in late April. And the right shoulder topped around $4,775 in mid-May. The neckline slopes downward and sits close to $4,308.
For gold price to show strength, the asset needs to hold above $4,539, the 0.618 Fibonacci level of the recent swing. Below that, the chart shows weakening points at $4,474 (the nearest support), $4,393, and the $4,308 neckline.
A confirmed break of $4,308 projects a 6.35% measured move toward $4,038. The $4,308 level also aligns closely with the 200-day EMA we highlighted earlier.
Bullish invalidation begins at $4,775 and completes at $4,890. A clean move above $4,890 voids the pattern and re-engages the speculator long positioning from the COT report.

The pattern nuance worth flagging is that a head-and-shoulders setup only confirms after a clean neckline break with volume. Until $4,308 cracks decisively, the structure remains a forming pattern rather than a confirmed bearish signal.
The $4,308 neckline separates a controlled hold above $4,539 from a 6.35% slide toward $4,038.
The post Gold Price Risks 6% Drop as Smart Money Quietly Sells the Top appeared first on BeInCrypto.


The European Commission said it is seeking feedback on whether the European Union’s landmark crypto framework, the Markets in Crypto-Assets Regulation (MiCA), remains fit for purpose as digital asset markets evolve.
The consultation, which remains open until Aug. 31, invites responses from both the public and industry stakeholders, including crypto firms, financial institutions, technology providers, academics and consumer groups, the executive branch of the EU announced on Wednesday.
MiCA was voted into law in 2023, establishing the EU’s first harmonized regulatory regime for crypto-assets and related services. The framework covers cryptoassets and stablecoins, as well as issuers and cryptoasset service providers operating within the bloc. The first regulations, related to stablecoins, took effect in June 2024, and the rules became fully applicable the following December.
The Commission said it is now reassessing the framework given the rapid changes in digital asset markets and shifts in the international regulatory landscape since MiCA was first developed.
The consultation includes both a public questionnaire and a more technical targeted consultation focused on legal and operational aspects of the regime.
Crypto World
Airfare Jumps 21% Year-Over-Year as Major U.S. Carriers Announce Robust Summer Travel Demand

Key Highlights
- U.S. airline ticket prices increased 20.7% compared to April 2025, accelerating from March’s 14.9% gain.
- Bank of America credit and debit card transaction data reveals double-digit spending growth for airline purchases in May.
- Most carriers have reduced third-quarter domestic capacity plans, though American Airlines continues expanding at 9.3%.
- United Airlines forecasts 53 million travelers during summer months; American Airlines anticipates serving 75 million passengers through early September.
- Aviation sector equities rallied Wednesday, with Allegiant Travel climbing 6.8% following a 4% decline in crude oil prices.
U.S. airline equities experienced significant gains Wednesday following a substantial decline in crude oil prices of approximately 4%, while major carriers confirmed that robust summer travel demand persists. Bank of America published comprehensive industry analytics demonstrating healthy pricing power and consumer spending patterns entering the peak travel period.
Ticket Prices and Consumer Spending Show Upward Momentum
Airline ticket costs have experienced substantial increases throughout 2026. April data from the Airline Fare Consumer Price Index revealed a 20.7% year-over-year surge, marking an acceleration from March’s 14.9% increase. On a monthly basis, fares climbed 6.3%.
The Air Passenger Services Producer Price Index similarly demonstrated strength, posting an 11.1% annual increase in April, surpassing March’s 8.1% gain. Data compiled by the Airline Reporting Corporation indicated average ticket prices rose 16.2% compared to the prior year period.
Proprietary Bank of America payment card analytics revealed airline-related spending reached double-digit growth rates in May. This expansion was primarily attributable to elevated per-transaction amounts rather than increased transaction volume alone.
During Bank of America’s recent Industrials, Transportation and Airlines conference, carrier executives emphasized that both passenger demand and pricing strength remain favorable. Nevertheless, capacity strategies for the latter portion of 2026 maintain flexibility, with fuel cost trajectories playing a central role in planning decisions.
Crude oil valuations have persisted above the $100 per barrel threshold, maintaining pressure on carrier operating expenses. Brent crude traded near $104 Tuesday before declining Wednesday.
Capacity Reductions Underway — With One Notable Exception
Industry-wide domestic capacity growth projections for the third quarter of 2026 have contracted by 200 basis points since mid-April, currently standing at 1.6% growth. A substantial portion of this adjustment followed Spirit Airlines’ operational cessation, which eliminated 160 basis points of system capacity.
United Airlines revised its capacity expansion forecast downward from 9.4% to 5.2%, representing an additional 80-basis-point reduction. American Airlines maintains a contrarian position, preserving its 9.3% growth target and contributing 190 basis points to aggregate industry capacity expansion.
American Airlines Group Inc., AAL
Summer period capacity is projected to remain essentially unchanged year-over-year, with additional reductions anticipated post-Labor Day. September capacity growth currently stands at 4.1%, significantly above the flat trajectory expected between May and August, with industry observers anticipating further downward adjustments in forthcoming announcements.
United Airlines projects serving over 53 million passengers during the June through August timeframe, representing approximately 3 million additional travelers versus the previous summer. American Airlines outlined plans to transport roughly 75 million customers across approximately 750,000 flights between May 21 and September 8, characterizing this as its “centennial summer.” Delta Air Lines reported that domestic demand remains consistent despite elevated fare levels.
United Airlines highlighted that reservation activity in North American cities hosting World Cup Group Stage matches has increased nearly 20%, though carriers broadly indicated they have not yet observed widespread World Cup-driven travel demand.
Regarding international traffic patterns, outbound U.S. leisure travel continues outperforming inbound volumes. Excluding Middle Eastern markets, outbound travel demonstrates 3.7% year-over-year growth while inbound traffic has declined 3.8%.
The U.S. Global Jets ETF advanced 3.3% during Wednesday morning trading. Allegiant Travel commanded sector performance with a 6.8% gain, followed by Frontier Group at 5.9%, United Airlines at 5.9%, Republic Airways at 5.6%, Alaska Air at 4.9%, and JetBlue at 4.4%.


- Real signs partnership with iExec to develop private RWA blockchain infrastructure.
- Companies explore encrypted asset issuance, lending, and compliant financial operations.
- Confidential computing gains attention as the institutional tokenization market continues expanding.
Real has entered into a memorandum of understanding with iExec to explore privacy-focused infrastructure for tokenized assets.
The collaboration will evaluate how institutional RWA issuance, distribution, and on-chain financial activity can be conducted while preserving confidentiality and supporting compliance and audit requirements.
Real provides infrastructure for the full lifecycle of tokenized assets, including onboarding, verification, risk assessment, settlement, and asset management.
iExec contributes confidential computing capabilities through Trusted Execution Environments such as Intel TDX and its Nox Protocol, which enables encrypted data processing, confidential smart contract execution, selective disclosure, and verifiable computation.
As part of the collaboration, the companies will assess how the Nox Protocol can integrate with Real’s Layer 1 blockchain to support confidential tokenized assets, encrypted transaction flows, and private financial operations.
The collaboration will focus on confidential RWA issuance and distribution, including encrypted balances and private transaction flows, as well as financial activities such as subscriptions, redemptions, dividend payments, lending, and structured credit.
“Institutions need more than tokenization. They need infrastructure that protects sensitive financial data while still allowing compliance, oversight, and auditability,” said Ivo Grigorov, CEO, Real.
“Our Partnership with iExec is an important step toward exploring how confidential computing can support the next generation of real-world asset markets.”
The companies will also explore selective disclosure tools for regulators and auditors, while assessing how confidential assets can remain interoperable with custody solutions, settlement systems, and potential secondary markets.
The agreement establishes a framework for evaluating institutional use cases such as tokenized funds and private credit. Planned next steps include technical discussions, identifying pilot opportunities, and aligning infrastructure architecture.
As real-world asset tokenization expands, institutional participation increasingly requires protection for sensitive data such as investor allocations and transaction information.
Real and iExec said they will examine how confidential computing can enable private financial operations while preserving on-chain verification and controlled regulatory access.


In the last few years, the AI conversation has been dominated by a single question: whose model is better? That framing made sense when capability gaps were wide and performance gains were visible with each new release. Today, that gap is narrowing fast. Models across providers are improving at a similar pace, costs are declining, and access is becoming increasingly uniform.
The next phase of competition will be defined by how reliably AI can act in real environments and conditions. This transition introduces a layer of value that is less visible than raw model performance, but more defensible over time because it compounds with use instead of depreciating through replication. It lives in execution, outcomes, and the feedback loops that connect the two.
When AI systems begin executing tasks, every action produces a trail. Decisions are made, tools are called, constraints are applied, and outcomes are recorded. These form structured records of intent, behavior, and result that reveal not only what happened, but why, and whether it should be repeated. Over time, this accumulation becomes institutional knowledge as a record of consequential decisions and their real-world effects that cannot simply be copied or acquired externally.
This is also where the next durable advantage is forming. Models can be trained, fine-tuned, and swapped out. Execution data tied to real workflows is a different category altogether. Generating it requires access to live systems, consistent usage at scale, and the kind of evaluation infrastructure, audit trails, outcome tracking, and structured feedback loops that turn raw activity into something a system can actually learn from. Without that, feedback remains subjective and improvement plateaus.
Financial markets offer one of the clearest illustrations of this dynamic. Trading decisions are continuous, outcomes are near-immediate, and performance can be assessed across multiple dimensions simultaneously. Profit and loss is only one lens. Execution quality, risk exposure, adherence to strategy, behavior under stress, and consistency across correlated events contribute to a fuller picture of how a system actually performs. Every trade becomes part of a longer trajectory that can be analyzed, refined, and fed into future decisions. A 2026 study on hybrid AI trading systems reported returns exceeding 135% over a 24-month testing period, outperforming benchmark equity indices through adaptive strategy selection and continuous market feedback integrated.
As execution data accumulates, the compounding effect becomes significant in ways that pure model scaling cannot replicate. Systems improve not through abstract reasoning alone, but via repeated exposure to real outcomes under real conditions, developing forms of pattern recognition that emerge only through consequential repetition. The pace of this transition is already visible across crypto markets. Early trading bots largely operated through fixed, rule-based prompts with limited adaptability. Today’s AI systems are increasingly capable of coordinating across strategies, operating through live integrations, and adapting based on market feedback. The progression from conversational assistants toward agents participating directly in execution workflows represents a meaningful shift in how AI interacts with markets. The infrastructure supporting that transition is scaling quickly. As of early 2026, the x402, an emerging payment rails for autonomous agent activity, had processed more than $600 million in transaction volume while supporting nearly 500,000 active AI wallets. These are no longer experimental systems operating in isolated environments. They reflect infrastructure that is beginning to move from demonstration into production-scale usage.” Strategies grow more disciplined, risk controls become more responsive to edge cases that simulations rarely anticipate, and decision-making becomes more grounded in observed behavior across thousands of scenarios rather than static predictions. That feedback loop, once established, becomes a structural advantage that is difficult to displace because it cannot be reconstructed from first principles.
The implication extends well beyond financial markets. Any domain where actions carry observable consequences, whether healthcare decisions, logistics routing, or legal workflows, will generate similar dynamics as AI systems become more deeply embedded in execution. What matters is not access to data alone, but the ability to structure it for learning: pairing raw activity with context, constraints, and systematic outcome evaluation until it becomes genuinely useful.
For platforms operating at the center of these workflows, the opportunity is more structural than incremental. They sit closest to the moment of execution, observing both actions and outcomes as they unfold, which positions them to capture the full cycle of execution and feedback. The challenge is significant: designing systems capable of turning that proximity into coherent, high-quality datasets while maintaining serious standards around permissions, privacy, and user control. Getting that architecture right is the product.
The industry’s attention will continue to flow toward model capability, because that is where announcements are loudest and benchmarks are easiest to read. But the more durable advantage is being built somewhere quieter, in the systems that connect intelligence to execution and in the data that emerges from that connection. The companies that grasp this early will not merely build better AI; they will build systems that improve through execution itself, compounding at a pace competitors will struggle to match.
The post AI’s Next Moat Won’t Be Models. It Will Be Execution Data appeared first on BeInCrypto.
Bitcoin-backed loans belong in the cost-of-capital conversation

Morrisons first supermarket to install male sanitary bins across all UK stores
Vikings Drop Young WR after 3 Weeks


-

 Crypto World5 days ago
BloFin War of Whales 2026 Grand Prix opens registration for $5M trading championship
-

 Fashion5 days ago
Weekend Open Thread: Theory – Corporette.com
-

 Crypto World5 days ago
E-Estate Announces 1 Year Live: Washington DC Summit as Real Estate Tokenization Enters Its Next Phase
-

 Tech5 days ago
Tech Moves: Microsoft AI leader jumps to OpenAI; former AI2 exec joins Meta; and more
-

 Tech5 days ago
Google reimburses Register sources who were victims of API fraud
-
 Crypto World6 days ago
Google’s Gemini AI Predicts Incredible Solana Price by the End of 2026
-

 Business5 days ago
H&R Real Estate Investment Trust (HR.UN:CA) Q1 2026 Earnings Call Transcript
-

 Sports5 days ago
Napoleonic enters 2026 Doomben 10,000 field via Abounding withdrawal
-
 Entertainment6 days ago
Zara Larsson Has Blunt Response To Chris Brown Diss
-
 Crypto World7 days ago
Two AI Tokens Lead May Rally, But Risks Are Rising
-

 Crypto World5 days ago
BeInCrypto 100 Institutional Awards Nomination: KAST for Best Digital Assets Neobank and Best Digital Assets Fintech
-

 Fashion4 days ago
On the Scene at Gucci’s Cruise Show in New York City: Mariah Carey, Kim Kardashian, Lindsay Lohan, Iman, and More!
-
 Crypto World5 days ago
Bitcoin Battles US Bond Nerves With BTC Price Dip Toward New May Lows
-
 Crypto World5 days ago
Wall Street’s Boldest Gold Prediction Has Russians Rushing to Buy
-

 Fashion4 days ago
Trending Western Style Vests Perfect for Summer
-

 Crypto World5 days ago
ICE and CME urge US regulators to curb Hyperliquid energy trading
-

 Politics6 days ago
DWP PIP Timms review continues to be an absolute farce
-

 Entertainment5 days ago
David Letterman Returns to Late Show, Blasts Cancellation
-

 Fashion4 days ago
Amazon Sundays: Memorial Day Hosting
-
 Crypto World6 days ago
Lido Finance Selects Chainlink CCIP as the Official Cross-Chain Infrastructure for wstETH Security
You must be logged in to post a comment Login