

Crypto World
Google Employee Arrested for Allegedly Exploiting Internal Search Data in $1.2M Polymarket Scheme


TLDR
- Michele Spagnuolo, a software engineer at Google, has been federally indicted for allegedly exploiting confidential company information for Polymarket wagers
- Prosecutors claim he operated as “AlphaRaccoon,” wagering $2.7 million and earning $1.2 million in profits
- The engineer allegedly leveraged a Google internal tool to monitor search trends before placing corresponding bets
- Federal charges include commodities fraud, wire fraud, and money laundering, carrying potential prison time of up to 50 years
- A parallel civil case from the CFTC demands financial restitution, penalties, and lifetime market prohibitions
Federal authorities allege that Michele Spagnuolo leveraged privileged access to Google’s search analytics to gain an unfair advantage on cryptocurrency prediction markets.
On May 28, the Department of Justice revealed criminal charges against Spagnuolo, a Google software engineer working within the Southern District of New York. According to prosecutors, he exploited confidential internal information to execute 25 separate wagers on Polymarket, a blockchain-based prediction marketplace.
The indictment alleges Spagnuolo utilized a proprietary Google analytics tool to identify which individuals were generating the highest search volume throughout 2025. He then allegedly placed strategic bets predicting these same people would appear on Google’s annual “most searched” rankings.
According to federal prosecutors, he conducted these activities through the Polymarket handle “AlphaRaccoon.” This account reportedly channeled approximately $3.8 million in USDC stablecoin to the platform and generated roughly $1.2 million in net gains.
Details of the Alleged Operation
The criminal complaint highlights a specific instance involving rapper D4vd, who faced recent murder charges. Spagnuolo allegedly reviewed Google’s proprietary trending analytics showing D4vd’s surge in search activity, then quickly placed a wager via AlphaRaccoon predicting his appearance among the year’s top searches—all within a matter of hours.
“Unlike the counterparties to his trades, Spagnuolo knew the outcome of these wagers before the trading public did,” the complaint stated.
Following successful wagers, Spagnuolo allegedly transferred 5 million USDC from his Polymarket wallet to external cryptocurrency addresses. These funds were subsequently processed through cryptocurrency exchange platforms and privacy-enhancing tools intended to mask transaction origins on the blockchain.
Investigators trace portions of these funds to an Italian payment processing service, connected to an account registered with Spagnuolo’s official identification documents.
Cover-Up Efforts Following Suspicion
Discussions emerged on Discord and X platforms in December, with community members theorizing that AlphaRaccoon had insider connections to Google. Soon thereafter, the account’s username was reportedly switched to a standard wallet address.
The Department of Justice has charged Spagnuolo with commodities fraud, wire fraud, and money laundering. If convicted on all counts, he could receive up to 50 years of imprisonment.
The Commodity Futures Trading Commission simultaneously launched civil proceedings, pursuing financial restitution, profit disgorgement, monetary sanctions, and lifetime prohibitions from market participation and registration.
CFTC enforcement director David Miller said the division is “a cop on the beat in policing the illegal use of inside information in prediction markets.”
Google has confirmed placing Spagnuolo on administrative leave. A company representative characterized exploiting confidential information for gambling purposes as “a serious breach of our policies,” while noting that the analytics tool in question was accessible across the employee base.
This marks the second significant insider trading prosecution involving Polymarket. Earlier in April, federal authorities arrested a U.S. Army servicemember accused of wagering on classified military intelligence regarding Venezuelan leader Nicolás Maduro’s potential capture.
Last Friday, Congressional lawmakers initiated an investigation into both Polymarket and competing platform Kalshi, expressing alarm that government personnel might be leveraging privileged information for financial gain through prediction markets.


Ethereum traded below the $2,000 level as on-chain activity weakened and short-term technical indicators stayed under pressure.
Summary
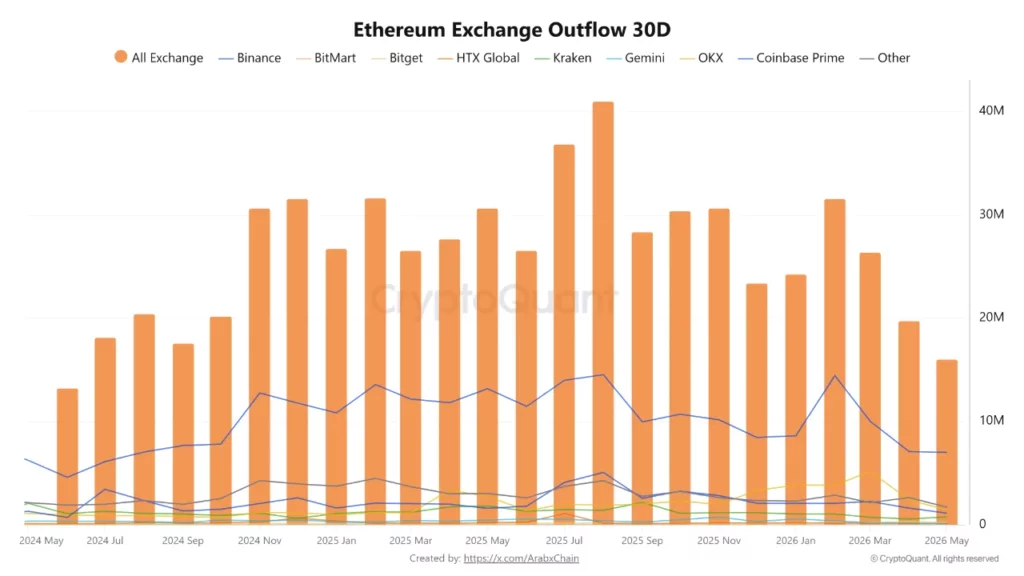
- Ethereum exchange withdrawals fell to 16.05 million ETH, their lowest level since June 2024.
- Failed transactions and exchange inflows have increased slightly as ETH trades below $2,000 support.
- RSI near 29.69 places Ethereum close to oversold levels, but sellers still control momentum.
The move came as exchange withdrawal data dropped to its lowest level since June 2024, while failed transactions and exchange inflows showed fresh signs of network and market stress.
Ethereum withdrawals fall to June 2024 low
Data from the Ethereum Exchange Outflow 30D indicator showed that total withdrawals from exchanges fell to about 16.05 million ETH. Arab Chain said the reading marked the lowest level since June 2024.
Lower exchange withdrawals can show that fewer users are moving ETH away from trading platforms. This often points to slower long-term accumulation, especially when price action remains weak or range-bound.
Binance led Ethereum withdrawals with about 7.00 million ETH. OKX followed with around 1.43 million ETH, while Coinbase Prime ranked third with about 1.12 million ETH. Kraken, Bitget, and HTX Global recorded lower withdrawal activity.
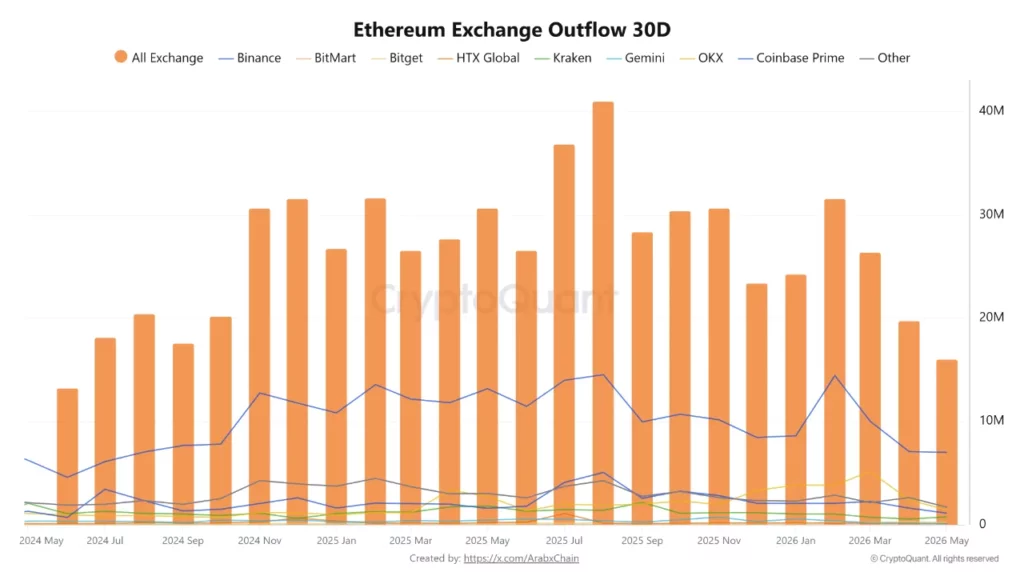
The drop does not give a direct bearish signal on its own. Still, it shows that off-exchange activity has slowed at a time when Ethereum is trying to hold key support levels.
Failed transactions and inflows add pressure
Separate on-chain data shared by nino showed that Ethereum failed transactions may be rising. The same update also pointed to a slight increase in exchange inflows.
The analyst described the failed transaction count as “may be experiencing an upward trend” and said the mix of network friction and exchange-bound liquidity “could possibly indicate a somewhat bearish outlook.”
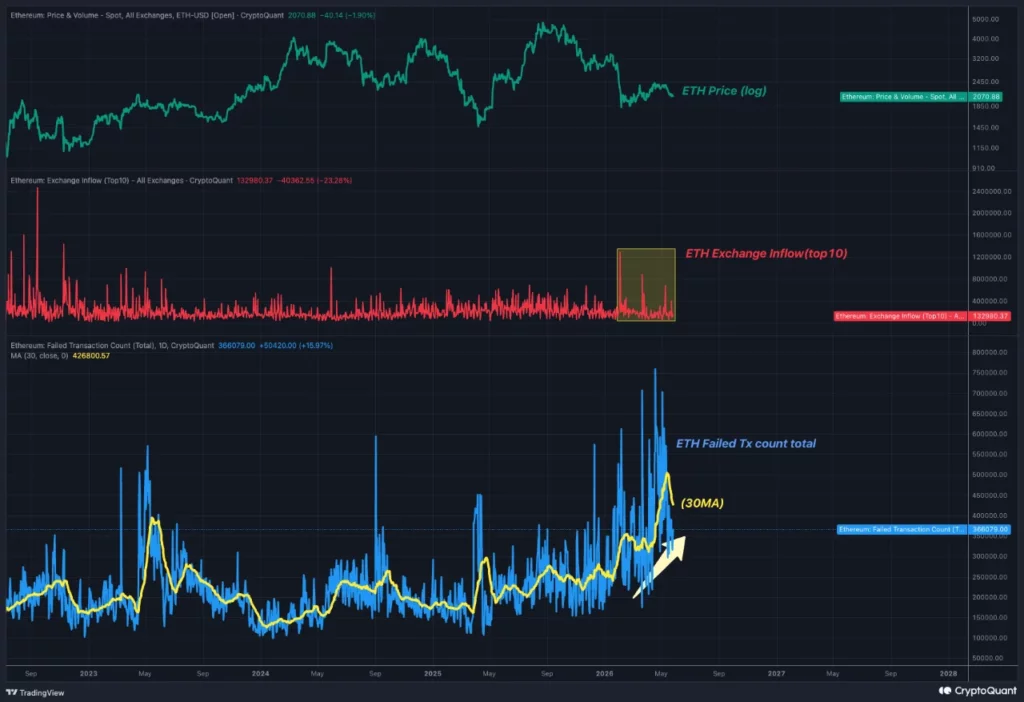
A rise in failed transactions can suggest higher network friction, user errors, or pressure around smart contract activity. It does not always mean demand is falling, but it can weaken confidence when paired with soft price action.
Exchange inflows can also carry market risk. When more ETH moves onto exchanges, traders may prepare to sell, hedge, or reposition. That does not confirm selling, but it adds caution during a weak market.
Ethereum price breaks below $2,000
Ethereum (ETH) traded near $1,986 after falling below the $2,000 mark. The move placed ETH under a key psychological level that traders often watch during market pullbacks.
As previously reported by crypto.news, the broader crypto market remained under pressure on May 28 after Bitcoin and Ethereum broke key support levels. The report said more than $900 million in leveraged crypto positions were liquidated across the derivatives market.
Ethereum also fell as the total crypto market weakened. Bitcoin dropped below $73,000, while major altcoins also posted losses as traders reduced exposure to risk assets.
Santiment said Ethereum’s drop below $2,000 triggered more “buy the dip” calls from retail traders. The firm warned that strong crowd optimism after a sharp decline can sometimes mean the market still has more downside before fear returns.
ETH technical analysis shows bearish bias
Ethereum remains below the Bollinger Band midline near $2,169. That shows short-term weakness because price has not reclaimed the central range.
ETH is also trading close to the lower Bollinger Band near $1,957. This area now acts as a key support zone. A break below it would show stronger downside pressure and could expose lower price levels.
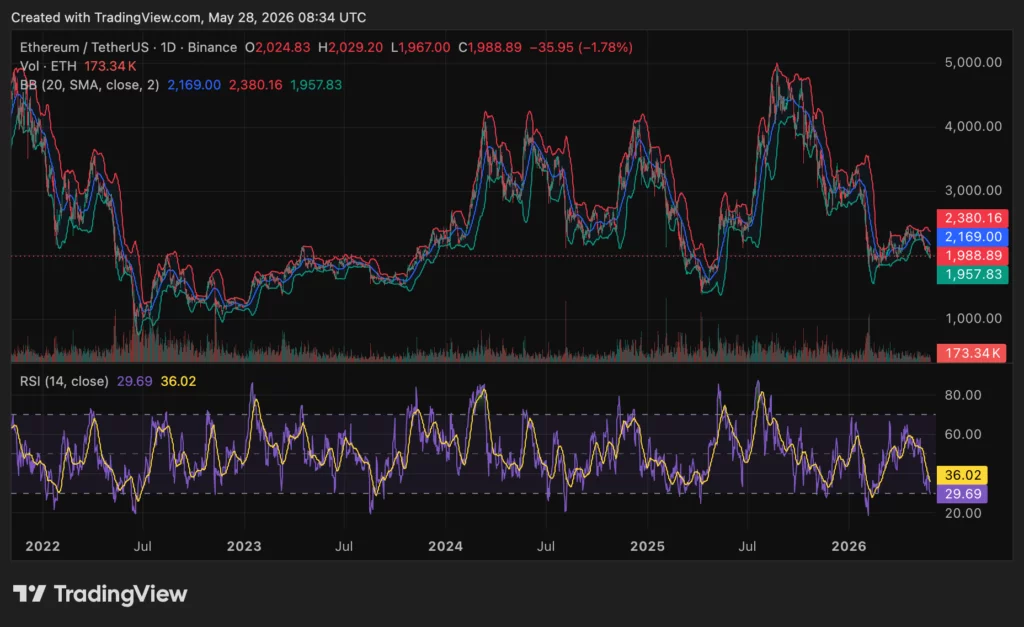
The Bollinger Bands are compressing after the recent decline. The upper band sits near $2,380, while the lower band sits near $1,957. A recovery above $2,169 would be the first clear sign that the short-term structure is improving.
The RSI stands near 29.69, below its moving average near 36.02. This confirms weak momentum and seller control. However, the low RSI also means ETH is close to oversold territory, where short-term relief bounces can form if buyers return.
For now, Ethereum’s short-term setup remains bearish. Holding the $1,950–$1,970 area is important. A drop below that range could keep sellers in control, while a move back above $2,169 would ease pressure and help rebuild recovery momentum.
Disclosure: This article does not represent investment advice. The content and materials featured on this page are for educational purposes only.
Crypto World
Crypto News, May 28: Why is Crypto Down? IBIT ETF Biggest Outflow, Trump Strikes Iran, But “Never Let Crypto Down”
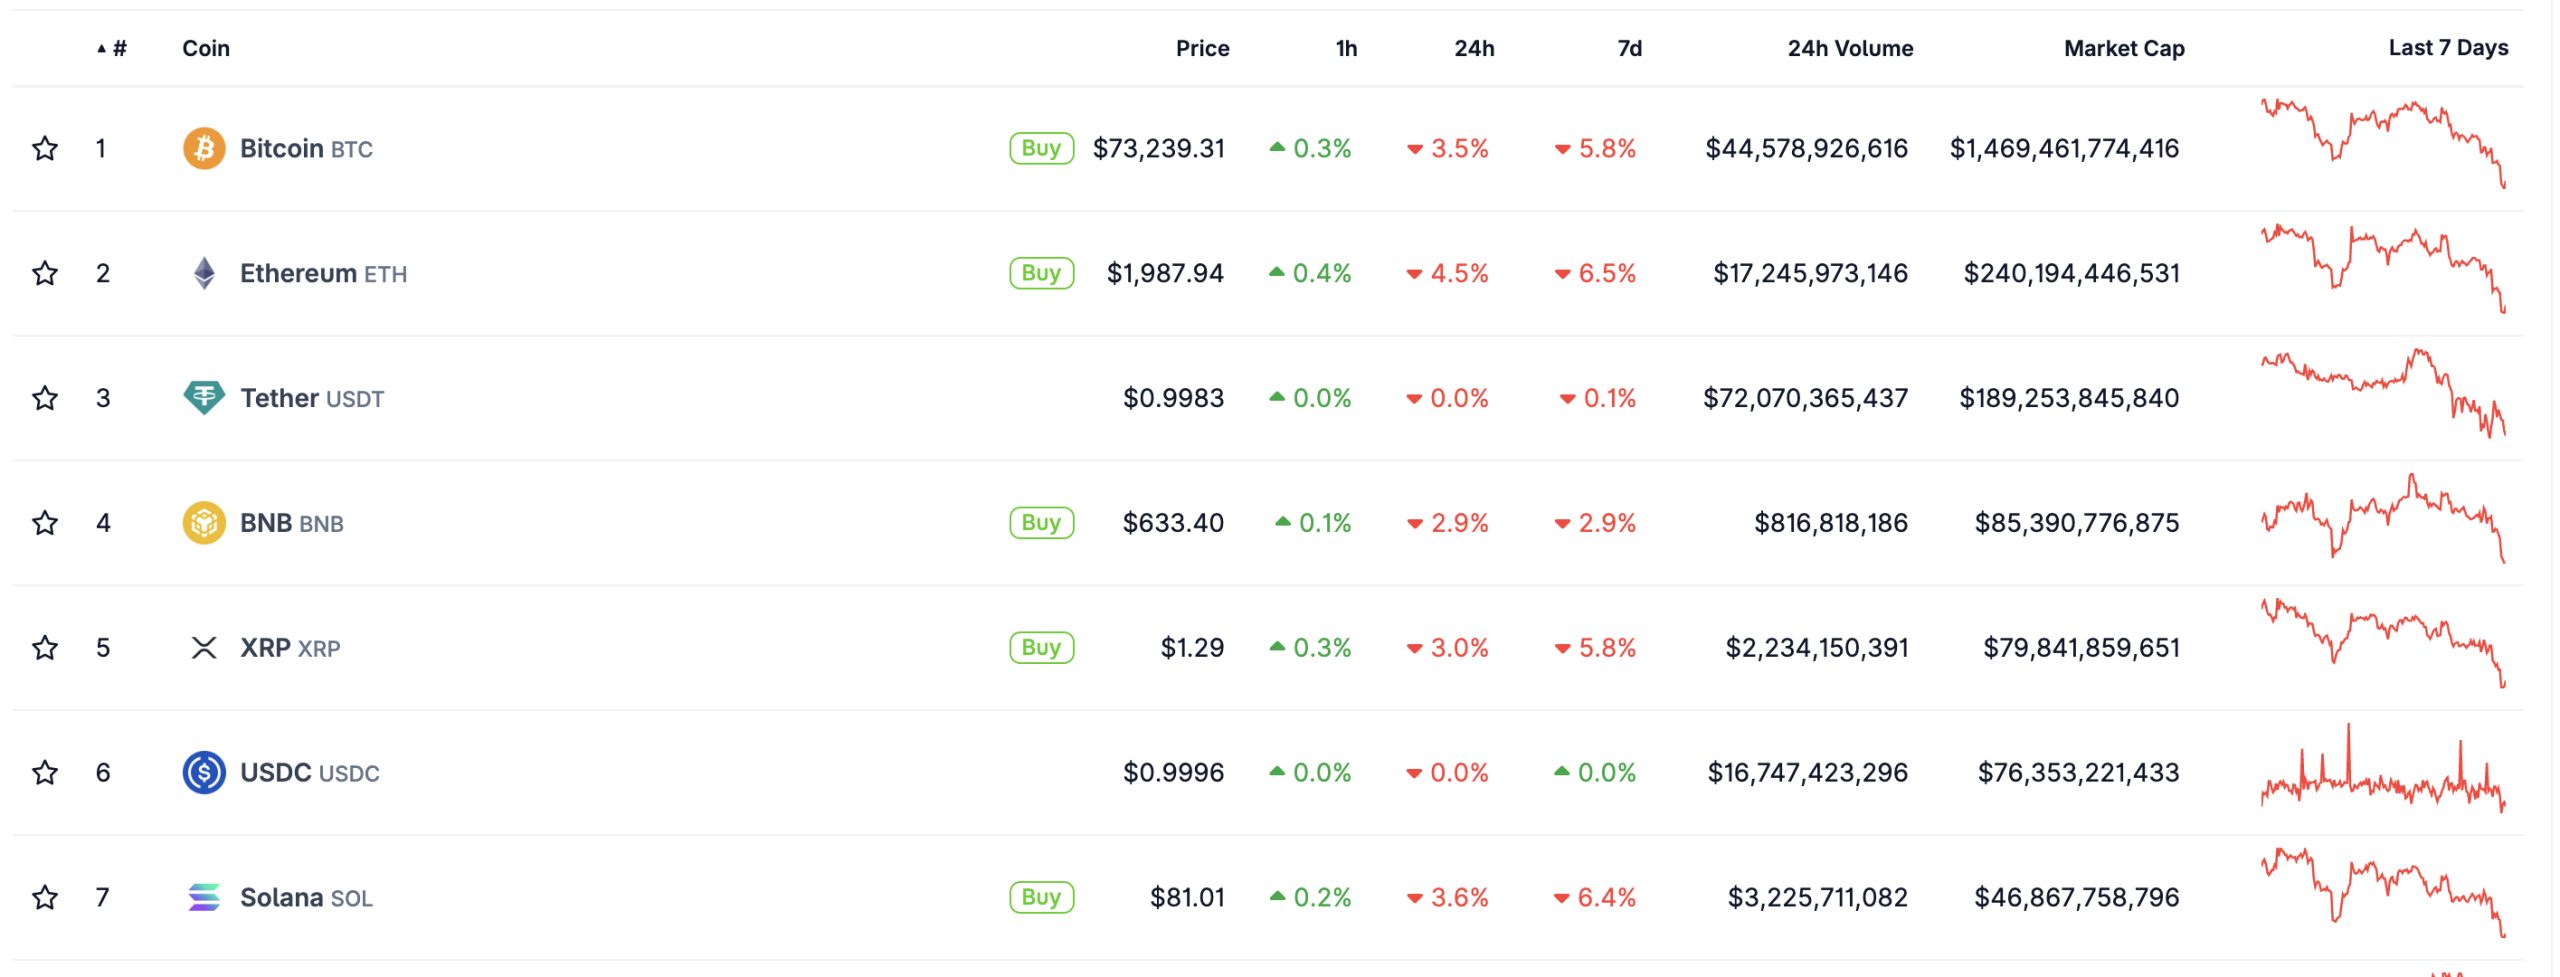
Crypto markets opened Thursday deep in the red as traders scrambled to answer one question. Why is crypto down today?
Bitcoin briefly slipped below $73,000 while major altcoins, including Ethereum, Solana, XRP, and BNB, followed the sell-off. The downturn came as markets absorbed a wave of liquidations, record-breaking IBIT ETF outflows, and escalating Trump-Iran tensions following reported strikes across the Middle East.

Despite the chaos, President Donald Trump doubled down on his pro-crypto stance, declaring he would “never let crypto down” while accusing former SEC Chair Gary Gensler of nearly destroying the industry. Trump also promised to codify a future-proof digital asset framework that “crypto haters” could not reverse.
Why Is Crypto Down?
Why crypto down became the dominant narrative, with CoinGlass data showing $936 million in liquidations over the past 24 hours. Long positions accounted for $873 million of the wipeout as aggressive bullish bets were flushed from the market.
Bitcoin alone saw $355 million in liquidations, followed by Ethereum at $242 million, Solana at $26 million, XRP at $19 million, and smaller but notable losses across BNB futures.

This decline is also happening amid a sharp risk-off shift across global markets. Geopolitical uncertainty tied to Trump-Iran developments pushed investors away from speculative assets, while crypto futures open interest fell another 1.2%.
Pressure intensified ahead of Friday’s massive options expiry, with $7.5 billion in crypto contracts set to settle. Bitcoin’s max pain level currently sits near $69,000 while Ethereum’s is under $2,000, setting the stage for heightened volatility as we unwind hedges.
Meanwhile, Pump.fun continued unloading SOL, dumping another 100,000 tokens worth $8.3 million as part of its $780 million sell-off campaign.
Discover: The best crypto to diversify your portfolio with
IBIT ETF Records Historic Outflow
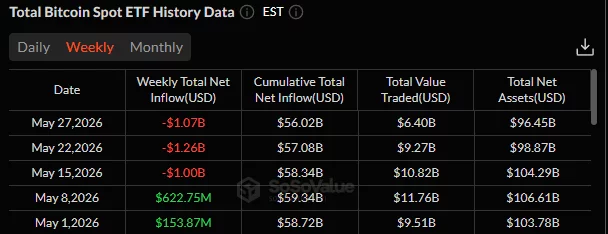
BlackRock’s IBIT ETF posted its largest single-day outflow ever, shedding $527.8 million. The redemption extended the fund’s losing streak to eight straight trading days, bringing total outflows close to $1.8 billion. This IBIT ETF sell-off heavily contributed to Bitcoin’s drop and marked the largest withdrawal episode since the product launched.

However, despite the outflows, the fund still controls nearly $60 billion in assets and represents roughly 4% of Bitcoin’s circulating supply, with cumulative net inflows still sitting above $56 billion overall.
The IBIT ETF weakness coincided with rising Treasury yields and a flight from risk assets. While Grant Cardone’s firm reportedly bought another 130 BTC during the dip, bullish narratives were overshadowed by the sheer scale of ETF selling pressure.
Why is Crypto Down? Trump and Iran Headlines
Trump-Iran tensions became another major catalyst behind today’s market weakness after reports of fresh kinetic strikes across the Middle East rattled investors globally.
Bitcoin quickly lost momentum below $73,000 as people moved toward safer assets. Yet even as geopolitical fears intensified, Trump continued reinforcing his support for crypto.
“We will never let crypto down,” Trump said, while criticizing Gensler and what he called the “anti-crypto army” for driving innovation offshore. Trump also pledged to establish permanent digital asset market structure legislation designed to protect the industry from future regulatory reversals.
TRUMP SAYS GENSLER "NEARLY DESTROYED" CRYPTO IN AMERICA
"We will codify a future-proof digital asset market structure that cannot be undone by crypto haters." pic.twitter.com/WGuB620VEp— Coin Bureau (@coinbureau) May 27, 2026
At the same time, Senator Cynthia Lummis urged Congress to send the Clarity Act to Trump immediately, warning that failure to pass the bill this session could undermine America’s position in the global crypto race.
The proposed framework would further cement the United States as a crypto hub and aligns closely with Trump economic messaging during the escalating Iran crisis.
Discover: The best pre-launch token sales
Bullish Signals Still Emerging Beneath the Panic
Despite the brutal sell-off, several longer-term bullish developments continue building. VanEck CEO Jan van Eck remains constructive on Bitcoin long term, though he warned that 2026 historically aligns with the weaker phase of the four-year halving cycle. According to Van Eck, the current correction resembles a normal cycle reset.
Adoption metrics also continue climbing. Crypto-linked payment cards reached a record $7.8 billion in cumulative transaction volume, with monthly usage growth surging 230% since May 2025.
Traditional finance remains active as well. Goldman Sachs recently raised its S&P 500 year-end target to 8,000, a move that could eventually benefit crypto markets.
Even in derivatives markets, some traders see potential upside. Ether shorts clustered near the $2,000 level could face a massive short squeeze worth nearly $2 billion if ETH decides to flip the script from current levels.
Overall, today’s session highlights exactly why crypto down remains the dominant market narrative in the short term. ETF outflows, leveraged liquidations, geopolitical stress, and options expiry volatility have combined into a perfect storm for risk assets. Yet underneath the panic, institutional adoption, regulatory progress, and expanding real-world crypto usage continue moving forward.
Follow us here for market updates today.
Discover: The best pre-launch token sales
The post Crypto News, May 28: Why is Crypto Down? IBIT ETF Biggest Outflow, Trump Strikes Iran, But “Never Let Crypto Down” appeared first on Cryptonews.
Bitcoin’s price tumbled, losing more than 3.5% in the past 24 hours.
The move saw the cryptocurrency decline by over $2,000, resulting in elevated liquidations across derivatives positions, which currently amount to slightly less than $1 billion.

There are a few reasons for this, so let’s have a look at the most likely ones.
US Resumes Strikes on Iran
As CryptoPotato reported earlier today, the US resumed strikes on Iran. To be precise, they targeted an Iranian military site, while the US shot down a total of four Iranian drones, which posed a threat around the Strait of Hormuz, according to available coverage.
Speaking on the matter, an official told Reuters:
“These actions were measured, purely defensive, and intended to maintain the ceasefire.”
That said, there already was a retaliation on behalf of Iran, which struck a US base in Kuwait. The country’s IRGC released a statement, confirming the attack, and saying that “aggression will not go unanswered.”
Oil prices surged on the news, rising 5% and putting additional strain on the global economy, which in turn had an immediate impact on Bitcoin’s price. The latter is widely seen as a risk-on asset, meaning that geopolitical uncertainty is much more likely to negatively impact its short-term value.
$1.3B Block Sale on BlackRock
Yesterday, we reported that someone offloaded 29 million shares of IBIT (BlackRock’s spot Bitcoin ETF). That position alone was worth a whopping $1.3 billion, officially making it the largest block trade of this kind and marking the largest single-day outflow from BTC ETFs.
Now that we have more context, it raises the question: did the entity have inside information about what’s to come?
Speculation aside, spot Bitcoin ETFs have grown to a position of importance and liquidating large portions surely have more than just an immediate impact on the price. They signal confidence (or the lack of) in the asset and a $1.3 billion block sale is surely to raise more than just a few eyebrows.
The post 2 Reasons Bitcoin Price Crashed Below $73,000 Today appeared first on CryptoPotato.
The crypto market remained under pressure on Thursday as renewed military tensions between the United States and Iran triggered another sharp wave of liquidations and ETF outflows.
Summary
- Bitcoin fell under the $73,000 mark as U.S.-Iran tensions, rising oil prices, and liquidations pressured crypto markets.
- U.S. spot Bitcoin ETFs recorded $733 million in outflows on Wednesday, extending their losing streak to eight straight days.
- More than $900 million in leveraged crypto positions were liquidated after Bitcoin and Ethereum broke key support levels.
According to data from CoinGecko, the total cryptocurrency market capitalization fell roughly 4% over the past 24 hours to around $2.48 trillion, while Bitcoin (BTC) dropped from the $76,000 region to hit a five-week low below $73,000 before recovering slightly at press time.
Ethereum (ETH) fell more than 5% below the $2,000 mark, while major altcoins, including Solana (SOL), XRP (XRP), BNB (BNB), Dogecoin (DOGE), and Hyperliquid (HYPE), recorded losses ranging between 6% and 14% as traders continued reducing exposure to risk assets amid rising macro uncertainty.
According to CoinGlass data, over $900 million worth of crypto positions were liquidated across the derivatives market over the past 24 hours, with bullish long positions accounting for most of the wipeout.
The latest decline accelerated after Bitcoin lost support near $75,000 while Ethereum broke below the $2,100 area, triggering another cascade of forced liquidations across leveraged trading platforms.
As exchanges automatically closed underwater bullish positions, the additional forced selling added more pressure to spot prices and intensified downside momentum across the broader market.
Oil prices jump as U.S.-Iran tensions escalate
Investor sentiment also deteriorated after military tensions between Washington and Tehran intensified again this week.
WTI crude futures climbed 2.6% to trade above $91 per barrel on Thursday, while Brent crude rose toward the $96 region after reports emerged that U.S. forces struck Iranian military targets believed to threaten commercial shipping routes near the Strait of Hormuz.
At the same time, Iran’s Revolutionary Guard reportedly targeted a U.S. airbase, though officials did not disclose the location.
Negotiations between both countries also remained deadlocked, with Iran reportedly insisting on retaining control over the Strait of Hormuz and preserving its nuclear program as part of any potential agreement.
The latest escalation weakened expectations for a short-term peace deal that could reopen the key shipping corridor and normalize global oil flows.
Rising energy prices added to fears that inflation could remain elevated for longer, potentially reducing the likelihood of near-term Federal Reserve interest-rate cuts and tightening liquidity conditions for speculative assets such as cryptocurrencies.
ETF outflows extend as institutions reduce exposure
Institutional demand also weakened considerably over the past two weeks.
U.S. spot Bitcoin ETFs recorded roughly $733 million in net outflows on Wednesday, the largest single-day withdrawal since February this year. The latest exits additionally extended the products’ losing streak to eight consecutive trading sessions.
Meanwhile, spot Ethereum ETFs extended their own outflow streak to 12 straight days after another $67 million exited the funds on Wednesday.
Cumulative withdrawals from U.S. spot Bitcoin ETFs have now reportedly reached $2.33 billion over the past two weeks as institutional investors continued rotating capital away from crypto products during the recent volatility.
In a report shared with crypto.news, Bitfinex analysts highlighted that Bitcoin’s market structure weakened after a recent $766 million liquidation event, rather than undergoing a full leverage reset typically seen after large derivative flushes.
The analysts noted that futures open interest dropped sharply after Bitcoin corrected more than 10% from highs above $82,000. However, leveraged positioning reportedly returned unusually quickly afterward, largely driven by retail traders reopening bullish positions on crypto-native exchanges.
Analysts added that institutional venues such as CME have not shown similar leverage activity, while the Coinbase Premium Gap remained negative despite elevated funding rates.
The report also noted that options traders continued paying premiums for downside protection ahead of Thursday’s U.S. Personal Consumption Expenditures report, the Federal Reserve’s preferred inflation gauge.
“A hot print for PCE on Thursday, 28 May would increase stress on the leverage-long book by shifting the rate path outlook, whereas an in-line print would remove the macro catalyst, forcing the range to resolve purely on positioning dynamics,” Bitfinex analysts said.
Disclosure: This article does not represent investment advice. The content and materials featured on this page are for educational purposes only.
Bitcoin is facing a mixed market setup as exchange reserves fall to rare lows while short-term price indicators and holder profitability remain weak.
Summary
- Bitcoin exchange reserves fell to 2.66 million BTC, matching levels last seen in August 2019.
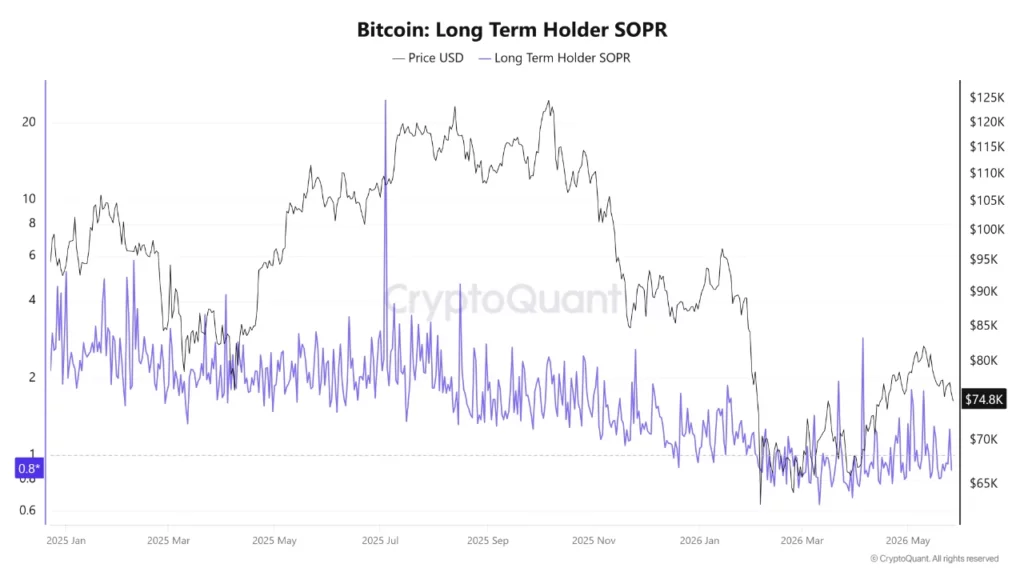
- Long-term holder SOPR near 0.87 shows some investors are moving Bitcoin at a loss now.
- Bearish MACD and RSI readings keep short-term Bitcoin momentum weak near the $73,000 price area.
Bitcoin exchange reserves have fallen to 2,666,753 BTC, according to CryptoQuant data shared by thechessONCHAIN. The last comparable reading came on August 31, 2019, when Bitcoin traded near $9,430. Bitcoin now trades far higher at nearly the same exchange inventory level.
Meanwhile, the drop means fewer coins sit on trading platforms for immediate sale. That can reduce available supply, but it does not guarantee a price rebound. For Bitcoin to move higher, demand must be strong enough to absorb supply and rebuild market confidence.
The current setup differs from 2019 because spot Bitcoin ETFs now create a demand channel that did not exist during that earlier cycle. U.S. spot Bitcoin ETFs started trading in January 2024, and exchange reserves have kept falling during the ETF era.
That shift changes the supply picture, but it does not settle the price outlook. The main question is whether ETF demand and spot buying can offset weak cycle data and cautious holder behavior.
Cycle data keeps Bitcoin bulls cautious
The CryptoQuant Bull-Bear Market Cycle Indicator shows a different backdrop from 2019. On August 31, 2019, the indicator stood at +0.83, placing Bitcoin in a bull zone. Its 30-day moving average was +1.045, while its 365-day average was -0.206.
The latest reading points the other way. In May 2026, the indicator stood at -0.379, while the 30-day moving average was -0.375 and the 365-day moving average was -0.323. That keeps Bitcoin in a weaker cycle zone even as exchange reserves continue to fall.
This means the reserve drop alone does not confirm a bullish trend. The market has a tighter exchange supply, but the cycle indicator has not yet shown the same strength seen in 2019.
Crypto analyst K A L E O also pointed to cycle timing as a bear case for short-term optimism. He noted that past market bottoms arrived much later after halvings and said, “I’d love to see a bounce at $70K,” while also stating that he was ready for more time in the current range.
Long-term holder SOPR shows weaker profitability
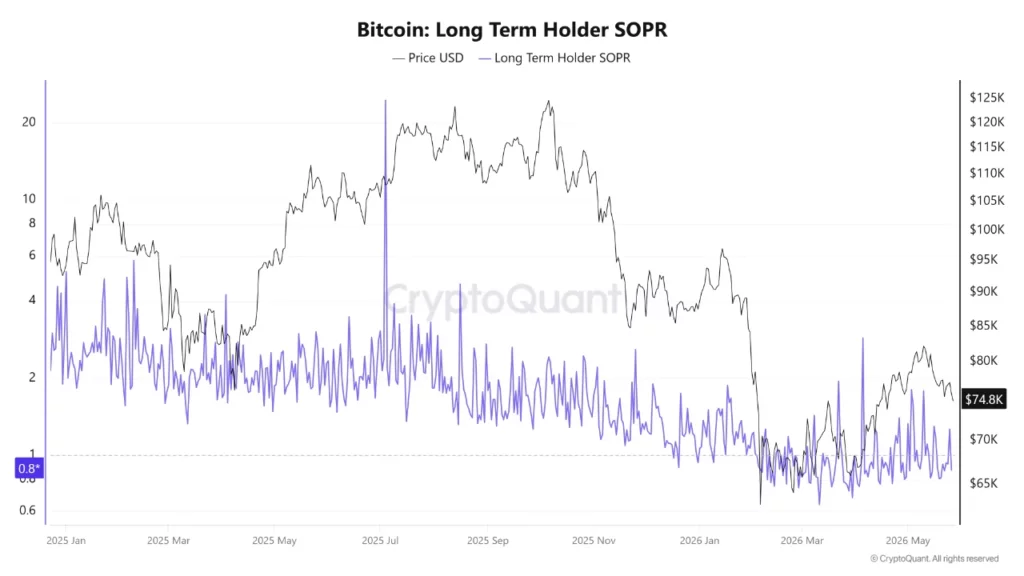
Long-term holder profitability also shows pressure. Arab Chain said the long-term holder SOPR has fallen to around 0.87 while Bitcoin trades near the mid-$70,000 area. SOPR tracks whether coins moved by long-term holders are being spent in profit or loss.
A reading below 1 means some long-term holders are moving or selling Bitcoin below their purchase price. That does not always mark the end of a longer trend, but it shows that large or older holders are not selling from a strong profit position.
Source: CryptoQuant
The reading has also moved lower in recent months after sitting at higher levels during stronger market phases. That points to caution among long-term holders after recent volatility and the pullback from earlier highs.
Some traders still view lower SOPR zones as periods of rebalancing. In past cycles, weak holder-profit readings have appeared during consolidation phases before stronger moves returned. For now, the data shows pressure rather than clear recovery.
Bitcoin price analysis: MACD and RSI stay bearish
Bitcoin (BTC) traded near $73,257 at the time of writing, with an intraday high near $75,944 and a low near $72,678. The price remains below the mid-to-high $70,000 area that bulls need to reclaim for a stronger short-term recovery.
The MACD remains bearish. The MACD line is below the signal line, and the histogram is still negative at around -145. That shows downside momentum remains active, although the histogram is not deeply stretched.
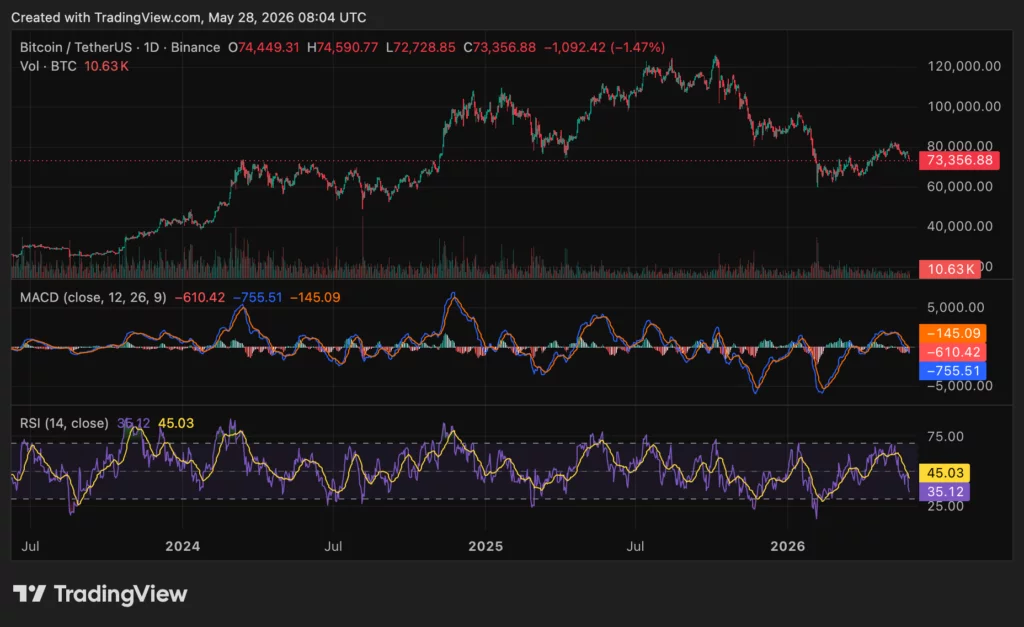
The RSI sits near 35.12, below its moving average around 45.03. This shows that sellers still control short-term momentum. RSI is moving closer to oversold levels, but it has not reached a point that confirms a full reset.
Traders are also watching whale positioning. CW said Bitcoin whales had moved toward long positions but warned, “We need to see if they maintain this trend.”
The short-term bias remains cautious while Bitcoin trades below stronger recovery levels. A move back above the mid-to-high $70,000 zone with stronger volume could improve the setup. Failure to hold current levels may keep attention on support near $70,000 and $68,000.
Disclosure: This article does not represent investment advice. The content and materials featured on this page are for educational purposes only.

Crypto markets shed roughly $80 billion in value over the past 24 hours as fresh US strikes on Iran rekindled geopolitical risk and unsettled investors. Bitcoin slid to around $72,646 on Coinbase, its lowest since April 13, while Ether eased below $2,000, trading near $1,976 as risk appetite evaporated in the wake of the flare‑up.
The US military confirmed a new round of strikes late on Wednesday targeting an Iranian military site and said it shot down four Iranian attack drones. A US official told Reuters that the actions were intended to be defensive and to maintain a ceasefire, underscoring the delicate balance in play as negotiations continue to attempt to end the broader conflict. Iran’s Islamic Revolutionary Guard Corps reportedly retaliated by attacking a US airbase in Kuwait, according to AP reports.
The strikes come as talks to halt the broader hostilities that began in late February—marked by US and Israeli offensives—proceed at a fragile pace. President Donald Trump, speaking at a White House cabinet meeting, indicated he remained not satisfied with the terms of any potential deal and suggested the possibility of further military action if needed. Crypto markets, which had shown tentative recovery earlier in the week on hints of a negotiated Iran settlement, reversed course in the face of renewed escalation.
Analysts noted that the immediate reaction reflected a risk-off posture among crypto traders, with heightened geopolitical risk, potential oil supply disruptions, and a flight to safety prompting broader deleveraging and liquidity tightening across digital assets. “Bitcoin and Ethereum, despite their long‑term narrative as hedges, continue to behave more like high‑beta risk assets during periods of uncertainty,” said Nick Ruck, director at LVRG Research. “Traders are now monitoring escalation risks in the Middle East, and any effects on inflation and Fed policy as crypto liquidity quickly thins, and leveraged positions get flushed out.”
The broader market backdrop remains sensitive to the convergence of political risk and energy prices. Oil markets reacted sharply to the news, with benchmarks climbing on the session: WTI crude moved above $92 per barrel and Brent hovered near $98, signaling tighter energy supplies could feed into inflationary pressures and potential policy responses in major economies.
Key takeaways
- Approximately $80 billion of crypto market value was erased in a 24-hour window amid renewed US strikes on Iran and rising geopolitical risk.
- Bitcoin traded around $72,646 on Coinbase, down about 3.5% for the day and at its lowest level since mid-April.
- Ether slid below the $2,000 mark, trading around $1,976, its lowest since late March.
- Crude oil prices rose, with WTI above $92 and Brent near $98 per barrel, amplifying concerns about inflation and policy responses.
- Market commentary framed crypto as a risk proxy in this episode, with liquidity thinning and leveraged positioning being flushed out as traders reassess the geopolitical tableau.
Geopolitics and the crypto risk dial
The latest wave of strikes reinforces how quickly macro and geopolitical developments can seep into crypto markets. The immediate price response reflected a broader risk-off sentiment that tends to undermine non‑yielding, inflation-hedge narratives in the near term. While the overnight moves are substantial, observers caution that the longer-term trajectory will hinge on whether diplomatic talks gain traction or deteriorate further, and how energy markets respond in the coming days.
Reuters’ portrayal of the US official’s characterization of the strikes as defensive helps frame the incident as a calibrated escalation rather than an open-ended conflict. Yet the retaliatory claim reported by AP, and the continuing negotiations, introduce a dynamic where any breakthrough or setback could quickly tilt market sentiment again. In this context, traders are weighing not only immediate price action but also the potential implications for macro variables such as inflation expectations and central bank policy—factors that historically shape crypto liquidity cycles.
Trader sentiment and the liquidity question
From a market mechanics perspective, the day’s moves underscore a recurring pattern: in times of geopolitical tension, crypto liquidity can thin as participants retreat to safer assets or reduce risk exposure. The trajectory of Bitcoin and Ether, which have at times benefited from the narrative of crypto as a hedge, now mirrors a more cautious stance where near-term catalysts drive sharper volatility.
“Bitcoin and Ethereum, despite their long-term narrative as hedges, continue to behave more like high-beta risk assets during periods of uncertainty. Traders are now monitoring escalation risks in the Middle East, and any effects on inflation and Fed policy as crypto liquidity quickly thins, and leveraged positions get flushed out.”
What to watch next
As negotiations continue, market attention will likely pivot to two pivotal threads: first, whether the tensions lead to further shocks to energy markets and credible inflationary pressures; second, how central banks respond, including any shifts in liquidity provision or policy signals that could influence crypto markets’ resilience. Investors and traders should monitor any escalation‑related headlines, potential changes in oil supply expectations, and the evolving tone from policymakers that could redefine risk appetite across digital assets.
The immediate setup remains delicate: a single development—be it a ceasefire concession, a new round of aerial strikes, or a diplomatic breakthrough—could shift the risk calculus overnight. For now, crypto traders appear to be prioritizing capital preservation, with the sector’s sensitivity to macro risk regimes underscoring the ongoing challenge of disentangling crypto markets from geopolitics.

The U.S. Commodity Futures Trading Commission has moved to vacate the $5 million settlement it reached with crypto exchange Gemini, arguing that the enforcement action rested on flawed allegations. Gemini agreed to pay the penalty in January 2025 after the agency accused the firm of making false or misleading statements related to a Bitcoin futures contract.
In a joint filing in a Manhattan federal court, the CFTC and Gemini asked the court to void the consent order, with the agency stating it had reviewed the matter and concluded that the “complaint should not have been filed — and would not have been under current enforcement standards.” The filing also notes that the complaint “was largely based on a whistleblower’s account known to be lacking in credibility.” The CFTC added that continuing enforcement of the consent order’s prospective provisions would not serve its mission or the public interest.
The case traces to allegations that Gemini issued misleading statements in 2022 during the review of a Bitcoin futures contract, particularly concerning auction volumes and liquidity. The CFTC said these claims were relevant to risk assessment and the contract’s approval. The agency’s complaint relied on a whistleblower from 2017 who purportedly alleged that Gemini inflated trading activity to distort user demand.
The CFTC’s motion also contends that Gemini was the victim of fraud in a separate matter, asserting that two customers exploited Gemini’s “preferential fee structures through a coordinated rebate-fraud scheme,” with the customers allegedly admitting defrauding Gemini of $7.5 million. The agency argued that past leadership did not act on those admissions. The politics surrounding the filing have drawn attention, as observers note a broader pattern of crypto enforcement actions that have faced shifts in priority across administrations.
The filing comes amid heightened scrutiny of crypto firms and a broader regulatory environment that intersects with policy debates on how the sector should be overseen, including licensing, disclosure standards, and the balance between innovation and investor protection. Responding to questions about the motion, Gemini and the CFTC indicated they would seek further comment when the court proceedings proceed. The outcome could influence ongoing obligations under the settlement, including an injunction prohibiting false or misleading statements to the agency, and it remains to be seen whether the $5 million penalty would be refunded if the settlement is vacated.
Cointelegraph’s reporting suggests the case sits within a wider discussion of enforcement posture and policy shifts affecting crypto firms, exchanges, banks, and investors, particularly as regulators reassess precedent and standards for disclosures, risk assessment, and market integrity in connection with novel crypto derivatives products. For context, the original complaint centered on statements made during the Bitcoin futures contract review process, with the CFTC asserting that information about liquidity and auction volumes informed regulatory approvals.
Key takeaways
- The CFTC and Gemini filed a joint motion in Manhattan to vacate the $5 million settlement, claiming the underlying complaint should not have been filed under current enforcement standards.
- The agency says the whistleblower account central to the case was largely lacking credibility, and continuing the consent order’s prospective provisions would not serve the public interest.
- The motion seeks to end ongoing obligations, including an injunction prohibiting false or misleading statements to the CFTC; it remains unclear whether the penalty would be refunded if vacatur occurs.
- The case links to 2022 statements about a Bitcoin futures contract’s auction volumes and liquidity and to a 2017 whistleblower claim about inflated trading activity; the credibility of those sources is central to the dispute.
- Context around the filing frames it within a broader discussion of crypto enforcement posture in the United States and regulatory priorities across administrations.
Unwinding the settlement and the legal questions
The core legal maneuver is a bid to vacate the consent order that accompanied the January 2025 settlement. By seeking to end the injunction and other prospective provisions, the CFTC signals a strategic re-evaluation of the case’s basis and its alignment with current enforcement standards. The agency notes that Gemini has already paid the $5 million penalty, but the question of whether the payment would be refunded if the settlement is vacated remains unresolved.
From a procedural standpoint, the motion frames the original complaint as overly dependent on a whistleblower account that the CFTC now characterizes as lacking credibility. The court will assess whether vacatur is appropriate, balancing past remedial measures with the agency’s current enforcement philosophy and public-interest considerations.
Regulatory context and policy implications
The CFTC’s request to unwind the Gemini settlement arrives amid ongoing regulatory debates about how crypto markets should be overseen, how disclosures should be handled, and how to calibrate enforcement actions in light of evolving market structures. The decision could influence future remedies for similar cases, particularly around whether settlements that involve injunctive provisions should be treated as final, even when subsequent questions about the sufficiency of the original allegations arise.
For market participants, the development underscores the importance of robust, verifiable disclosures in relation to derivative products tied to digital assets. It also highlights the interplay between enforcement actions and consent orders, and how regulators may revisit settlements in light of new standards or evidence. The outcome may affect how exchanges and crypto businesses approach risk disclosures, audit trails, and communications with regulators during reviews of new products.
In a broader regulatory frame, observers note the case against Gemini touches on ongoing questions about licensing, cross-border oversight, and the alignment of U.S. enforcement with international standards. The discussion intersects with policy considerations around MiCA implementation in Europe, the roles of the SEC and CFTC in crypto oversight, and the design of AML/KYC frameworks that govern digital-asset markets.
Notably, the move has drawn commentary about how enforcement actions in the crypto space have evolved with changes in administration and regulatory leadership. The broader narrative, as reported by industry observers, is that aggressive cases in certain periods may be revisited or reframed as policy priorities shift.
According to Cointelegraph, the development should be evaluated in the context of how enforcement actions translate into practical compliance requirements for exchanges, banks, and institutional investors, and how courts adjudicate the balance between remedial settlements and the possibility of revisiting foundational allegations.
Gemini and the CFTC have not publicly released further remarks beyond the procedural filings, and the court has yet to determine the next steps in the vacatur process. Analysts and compliance teams will be watching for the judiciary’s ruling, any adjustments to ongoing obligations, and potential implications for similar settlements involving other market participants.
Closing perspective: The vacatur motion highlights the fragility of consent-based settlements when new standards or credibility concerns arise. As regulators reassess the evidentiary basis of past actions, market participants can expect heightened scrutiny of disclosures, governance, and risk-management practices in relation to crypto derivatives and futures products.
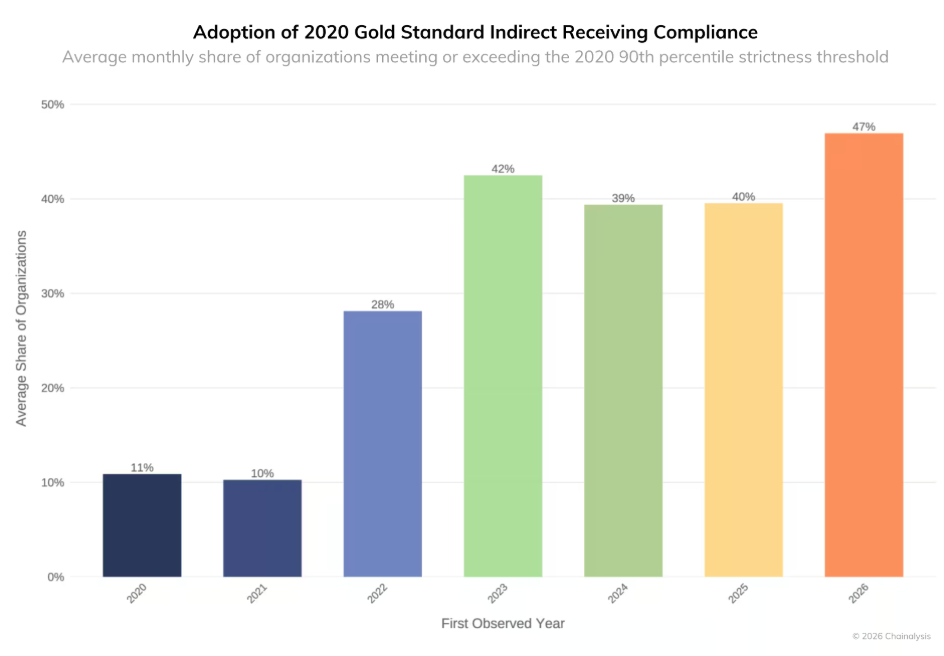
Nearly half of the organizations onboarded into the crypto industry in 2026 are operating at alerting standards that would have made them industry leaders only a few years ago, according to Chainalysis.
In a preview of a report published on Wednesday, Chainalysis said that the crypto industry’s compliance baseline around alert severity, trigger sensitivity and minimum dollar detection floors is tightening, with about 47% of organizations onboarded this year using alerting standards that would have placed them in the top 10% of strictness in 2020.
It added that companies have become more uniform in direct monitoring, where funds arrive immediately from a known illicit source, but there is still a gap with indirect monitoring, where the funds pass through intermediary addresses.
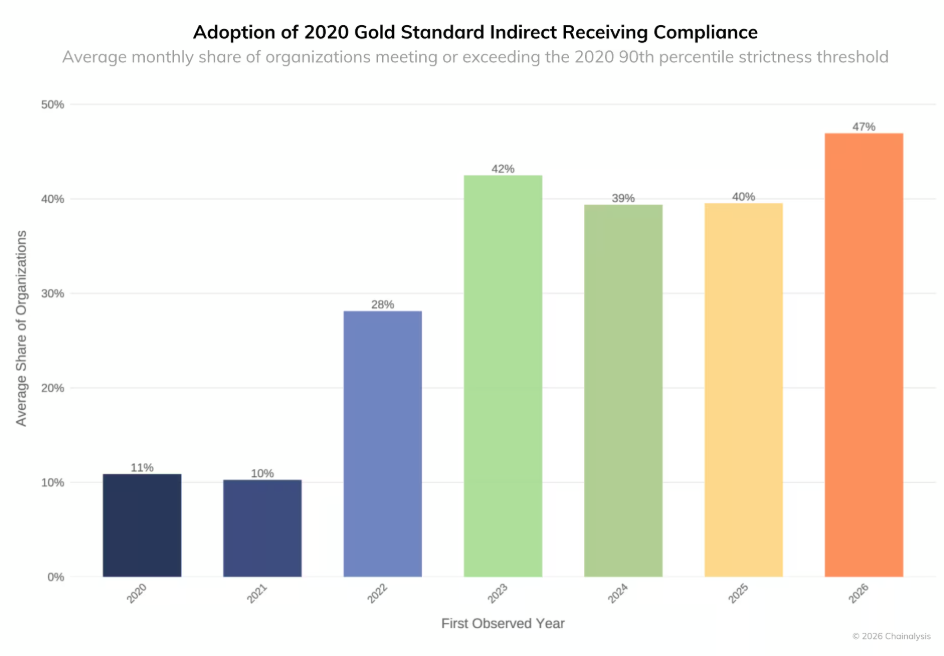
Compliance-alerting standards have improved significantly across the industry over the last few years. Source: Chainalysis
The industry has been raising its security and compliance in response to stricter regulations and growing threats from hackers. North Korean-affiliated hackers alone were responsible for an estimated $2 billion in crypto losses in 2025.
Chainalysis said that in 2020, the industry was still establishing norms, with only 10% meeting the top requirements. However, the rate started increasing in 2023, and now “newer entrants are launching with more aggressive monitoring.”
“This is a sign of rapid ecosystem maturation. Standard compliance configurations today would have been considered industry-leading just five years ago. The industry financial institutions are joining has already built substantial compliance infrastructure, and the bar continues to rise.”
Crypto has a gap in indirect monitoring
Legacy financial institutions have lower triggering thresholds for indirect exposure to both illicit and non-illicit fund flows and are alerted to smaller sums. On average, crypto exchanges set much higher alerting thresholds, and the thresholds vary across categories, according to Chainalysis.
Related: Coinbase execs face new lawsuit seeking damages, insider profit clawbacks
Categories such as ransomware, fraud shops, scams and darknet markets often have indirect thresholds 10 to 20 times higher than their direct equivalents.
“The industry’s gap between direct and indirect monitoring creates an opening for illicit actors to exploit. Organizations that close this gap improve their regulatory defensibility and differentiate themselves as trustworthy counterparties,” the Chainalysis team said.
“The data in this chapter point to an industry in transition, one that has professionalized its approach to direct exposure but which may not yet be treating indirect risk with equivalent rigor.”
Magazine: Polymarket seeks Japan entry, Harvard dumps entire ETH position: Hodler’s Digest, May 17 – 23
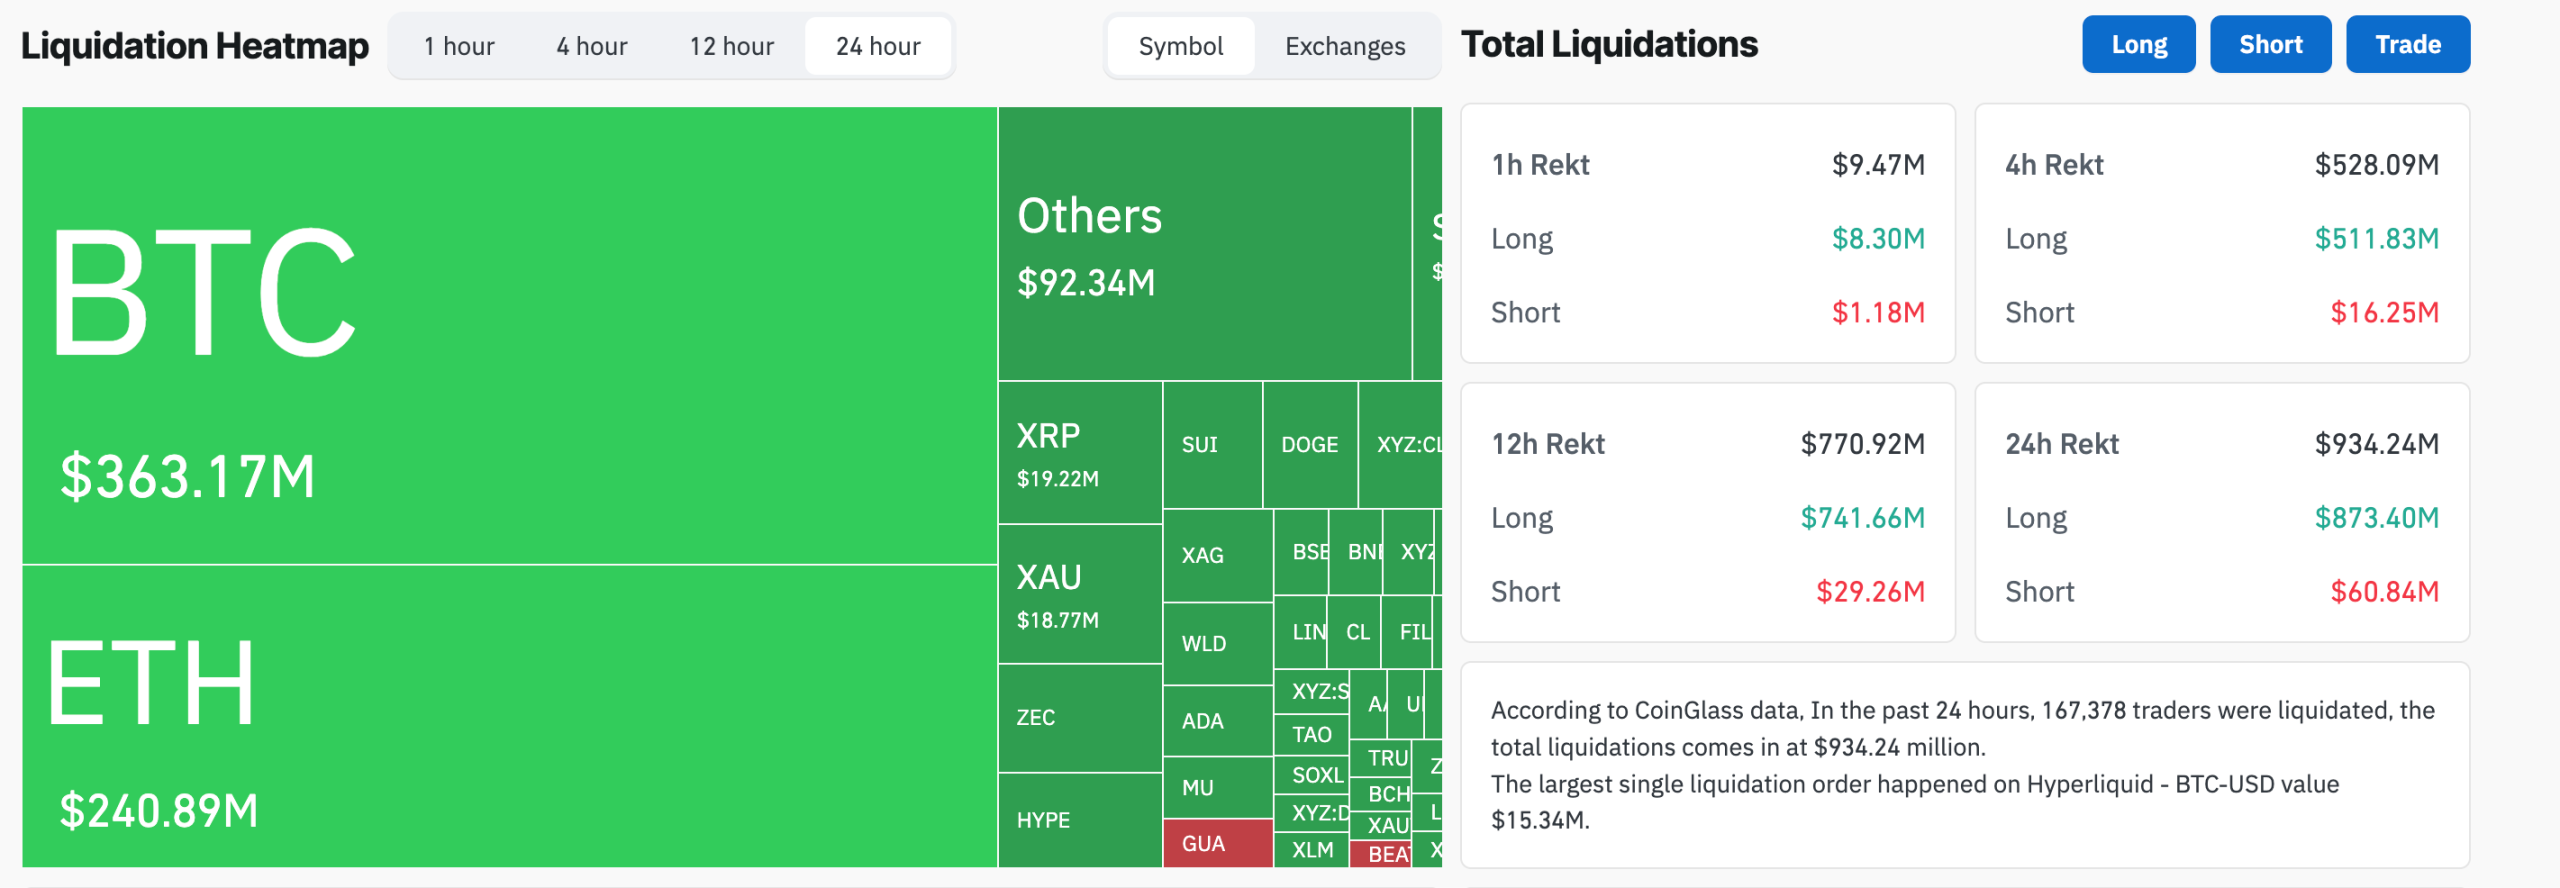
Crypto liquidations hit $934.24 million in 24 hours after the US carried out fresh strikes inside Iran. The flush wiped out roughly 167,400 trader accounts as leveraged longs collapsed.
Bitcoin (BTC) and Ethereum (ETH) took the heaviest blows, with BTC liquidations at $363 million and ETH at $240 million. The single largest order, a $15.34 million BTC long, closed on Hyperliquid.
Crypto Liquidations Skew 93% to Longs
Most of the damage hit traders positioned for a recovery. CoinGlass figures show longs made up 93% of the total. Short sellers were largely spared.
The skew points to derivatives books that had absorbed the prior week’s ceasefire optimism. Traders had added leverage on the long side. Bitcoin’s recent leverage ratio decline had already flagged thin positioning.
Bitcoin sank below $73,000 during the rout. The drop extended a slide that began when President Donald Trump first questioned a deal earlier in the week.

Risk assets across stocks and oil moved sharply. Brent crude climbed as traders priced in supply concerns around the Strait of Hormuz. The flush cleared out long bets built during the prior ceasefire rally.
New US Strikes End Brief Ceasefire Hopes
The sell-off began after the US Central Command confirmed strikes against Iranian targets. Forces hit four one-way attack drones near the Strait of Hormuz. A ground control station at Bandar Abbas was also destroyed.
The US said the targets posed a threat to American forces and to maritime traffic in the strait. Iranian state media reported no casualties from the action. Kuwait separately activated air defenses against incoming missiles and drones.
The escalation arrived only days after both sides hinted at a ceasefire framework. Trump confirmed during a Wednesday cabinet meeting that talks had stalled.
He said Tehran was “negotiating on fumes” and warned the US might “finish the job” if no agreement materialized. The blunt language reversed a market mood that had built on Trump’s earlier Iran pledge to wind the conflict down.
The next leg depends on whether Washington and Tehran return to the table. A second round of strikes inside three days has narrowed the runway for diplomacy.
Any disruption to shipping through the Strait of Hormuz would feed straight into oil and risk-off flows. The US has already widened pressure through its Operation Economic Fury crackdown targeting Iran’s digital asset network.
For crypto, the $1.7 billion liquidation cascade earlier this year showed how quickly leverage can rebuild. Traders will watch funding rates and open interest over the coming sessions.
The data will show whether sentiment is resetting or simply reloading the long side. With Bitcoin’s earlier Hormuz-driven price slide already on the books, another headline move would test the $70,000 floor.
The post Crypto Liquidations Nears $1 Billion in 24 Hours as US Strikes Iran Again appeared first on BeInCrypto.
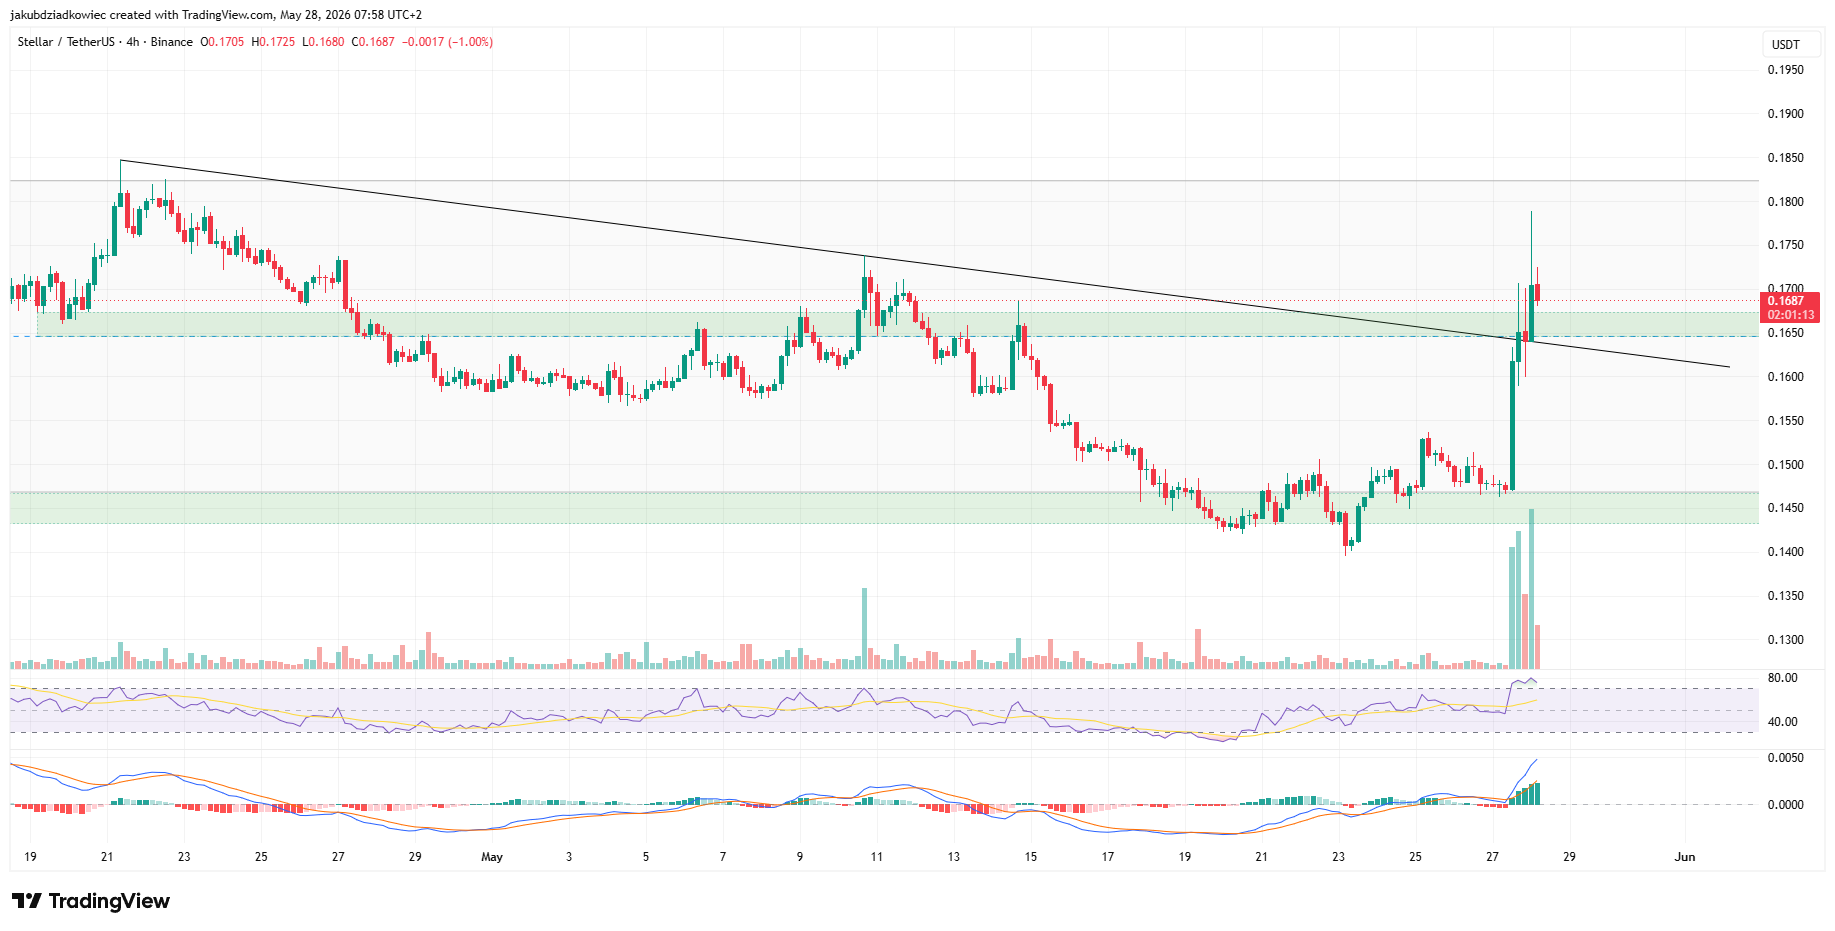
Stellar (XLM) surged more than 14% in the past 24 hours. The move reclaimed the midline of its long-term parallel channel. Price also broke above a key descending trendline.
The Layer 1 network is now trading near $0.169 with a market capitalization above $5.6 billion. Multiple charts point to follow-through. X traders are already calling for a path to $0.60 on the weekly timeframe.
Four-Hour Chart Breaks Descending Trendline
The four-hour XLM chart shows a clean break above a descending trendline. That trendline ran from the April 21 swing high near $0.185. The move came on a sharp volume spike. The largest green candle of the recent range pushed price back above $0.165.

The Relative Strength Index (RSI) reads close to 75. That sits in overbought territory and suggests the rally may be short-term extended. The Moving Average Convergence Divergence (MACD) histogram prints rising green bars. That signals expanding bullish momentum.
A pullback into the $0.165 area would give buyers a more measured entry zone. If sellers push the price below the channel midline, the support band at $0.14 to $0.15 becomes the next test. That level previously triggered the current leg of the Stellar rally.
Daily Chart Reclaims Channel Midline With Strong Volume
The daily chart adds structural weight to the breakout. XLM reclaimed the midline of a parallel channel that has framed price action since early February. The move followed a strong bounce from the support band at $0.14.
Two consecutive green candles confirm the shift in tone. Yesterday’s session added roughly 11%. The current daily candle prints another tall body. That move lifts the price back to the upper edge of the channel.

RSI on the daily timeframe broke its own descending resistance trendline. The signal points to strengthening momentum rather than fading interest. The Bollinger Band Width Percentile (BBWP) reads at extreme highs, which often coincides with the early stages of trend expansion.
The next resistance sits at $0.18, the upper band of the channel. A clean break opens the path to $0.20. The heavy supply zone near $0.25 stands as the next major target. A close back below the midline would invalidate the immediate setup. That outcome would put $0.14 back in play and echo previous XLM range failures.
Weekly Outlook Points to $0.60 if Structure Holds
Stepping out to the weekly chart widens the lens. XLM trades on a horizontal support that dates back to 2021. That same level anchored the consolidation between 2022 and 2024. The current bounce mirrors the structure that preceded earlier rallies on Stellar.
Trader PacquianPrime framed the setup as a textbook reversal pattern.
“$XLM just painted the path to $0.60. Weekly chart looking clean. Broke structure, retested, and now the liquidity sweep above is calling. $0.6 incoming. Not financial advice, but the chart doesn’t lie.”
The upside band drawn on the weekly chart sits between $0.50 and $0.60. That zone marks the prior breakdown area from late 2024. The level becomes a likely magnet for a longer-term liquidity grab. The thesis depends on the current weekly support holding through any short-term retracement.

What to Watch Next for Stellar
The convergence of signals across the three timeframes leaves XLM with a clear playbook. Bulls keep control while price holds above the channel midline near $0.165, and $0.18 stands as the first immediate test.
A failure to defend the $0.14 support would shift the story back to range-bound trading. For now, the breakout structure remains intact, and the weekly chart keeps the door open for a much larger move.
The post XLM Jumps 14% as Stellar Reclaims Long-Term Channel Midline appeared first on BeInCrypto.

Zack Polanski Says He Gets More Scrutiny Than Nigel Farage

Meghan Markle Accused Of Using Family For Clout

Premier passing on CGT concerns to PM


-

 Crypto World7 days ago
Blockchain.com files with SEC for U.S. IPO
-

 Fashion6 days ago
Holiday Weekend Open Thread – Corporette.com
-

 Politics3 days ago
Bridgerton Season 5: Cast, Release Date And Everything We Know So Far
-
 Crypto World6 days ago
Bitcoin Accumulation Weakens as BTC Realized Losses Hit $600M
-

 Tech3 days ago
Microsoft’s quiet Claude Code retreat and the real cost of enterprise AI
-

 Business6 days ago
Dell Technologies DELL Stock Surges 15% on AI Server Momentum and Analyst Upgrades in 2026
-

 Crypto World5 days ago
Robinhood crypto COO Tanya Denisova exits
-

 Business4 days ago
NYT Strands Answers May 24 2026 Revealed for Puzzle No. 812 Theme Summer Essentials
-

 Business6 days ago
Trump Invests $1M-$5M in Kura Sushi USA Chain With 27 California Locations
-

 Politics6 days ago
Makerfield: a tale of two social-media histories
-
 Crypto World6 days ago
Space X IPO Is ‘Bad News’ for Tech Stocks: But What About Bitcoin?
-
 Crypto World6 days ago
MicroStrategy’s Saylor Says Miners No Longer Set Bitcoin Price, Another Force Has Taken Over
-

 Tech6 days ago
WhatsApp ads could make Irish debut after discussions with DPC
-

 Business1 day ago
Selena Gomez Reportedly Upset Over Benny Blanco’s Comments on Her ‘Terrible’ Diet
-
Tech21 hours ago
The Samsung pay deal is the moment Korean unions changed register
-
 NewsBeat7 days ago
Charity run by Reform leader Malcolm Offord accused of ‘law breaking’ over Scottish registration
-
 Tech6 days ago
A 0.12% parameter add-on gives AI agents the working memory RAG can’t
-

 Business3 days ago
BTS Sells Out Four Las Vegas Shows at Allegiant Stadium for ARIRANG World Tour
-

 Crypto World6 days ago
AI infrastructure race heats up as IREN pitches full-stack strategy, WhiteFiber lands $160M deal
-
 Crypto World3 days ago
Nvidia (NVDA) CEO Calls on Super Micro to Strengthen Export Controls Amid Smuggling Probe
You must be logged in to post a comment Login