

Crypto World
AI infrastructure race heats up as IREN pitches full-stack strategy, WhiteFiber lands $160M deal


IREN (IREN) co-founder Daniel Roberts outlined an ambitious vision for the company as a vertically integrated AI infrastructure platform in a lengthy X post on Friday, arguing that the biggest bottleneck in artificial intelligence is no longer chips, but physical infrastructure.
“AI demand grows exponentially. Infrastructure doesn’t,” Roberts wrote, pointing to growing constraints around power, land, cooling and data center construction.
Roberts said IREN’s strategy is built around three layers: physical infrastructure such as power and data centers, compute infrastructure including NVIDIA GPUs and servers, and enterprise software and operational tooling.
“Layers 1 and 2 are where the overwhelming majority of IREN’s value is being created today,” Roberts wrote. “Layer 3 is where that advantage compounds further over time.”
The company, formerly known as Iris Energy, has expanded beyond bitcoin mining into AI infrastructure, a wider trend that has been seen in the industry, with projects spanning Texas, British Columbia, Oklahoma, Spain and Australia. Roberts said IREN has secured roughly 5 gigawatts of grid-connected capacity globally.
He argued that owning the full stack creates a long-term competitive moat as AI demand accelerates globally, particularly in underserved regions such as Europe and Asia-Pacific.
The thread also highlighted IREN’s growing relationship with NVIDIA (NVDA), including a recently announced five-year, $3.4 billion AI cloud contract tied to Blackwell GPU deployments in Texas.
Separately, WhiteFiber (WYFI) announced a five-year AI compute agreement worth more than $160 million with an investment-grade technology customer in France. The deployment will use NVIDIA GPUs and expand WhiteFiber’s European footprint.
WhiteFiber provides AI cloud and high-performance compute services using third-party data center infrastructure, while IREN focuses on owning and operating the underlying infrastructure itself.
WYFI shares rose 22% Thursday and gained another 5% in Friday premarket trading, while IREN shares gained 10% on Thursday.

Bitcoin (BTC) is carving out a possible floor near $60,000 as spot buyers step back in, yet on-chain valuation and profitability data confirm the market remains firmly in bear territory.
The recovery from the early June low has eased pressure on recent buyers without resolving it. Several indicators now point toward stabilization rather than a confirmed bottom.
BTC trades around $64,171, down 1% over the past 24 hours, with a market capitalization near $1.29 trillion.
Realized Losses Still Dominate Bitcoin Flows
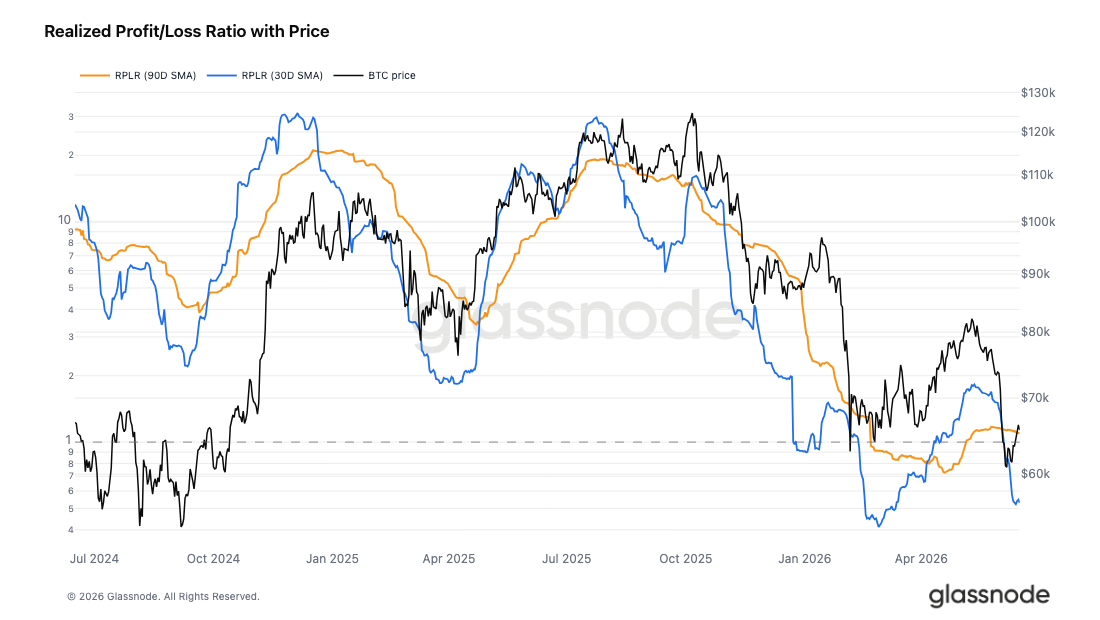
The Realized Profit/Loss Ratio measures the dollar value of coins moving in profit against those moving at a loss. Readings below 1 show that loss realization is the prevailing force.
The 30-day average sits at 0.53, while the 90-day average holds at 1.10. That split confirms loss-taking has outpaced profit-taking across most of the past month.

Valuation tells the same story. Glassnode places the True Market Mean at $77,200, roughly 15% above spot, so the on-chain regime stays bearish. Short-Term Holder MVRV has recovered to 0.90 but remains under the 1.0 breakeven line.
A sustained move in both averages toward 2 would be the first real signal that the bias is turning.
Spot Order Books Build a Bitcoin Floor Near $60K
The flow data leans bearish, yet spot liquidity has shifted in the opposite direction. That divergence is where the repair thesis begins.
Binance Spot Orderbook Depth Imbalance has moved decisively in favor of bids. Buy-side liquidity now outweighs resting sell orders by the widest margin in recent months.

This suggests traders are positioning to absorb supply at lower prices rather than sell into rallies. Passive bids near the $60,000 region appear to be defending current support.
Open interest also compressed off its late-May peak, while funding cooled toward neutral. The deleveraging points to a more patient buyer base instead of crowded leverage.
Macro Index Flags Rare Deep Value for Bitcoin
A longer-term gauge adds weight to the stabilization case. The Capriole Macro Index Oscillator reads -2.03, one of the deepest prints in its history.
Analyst Charles Edwards notes prior visits to these depths were brief. They lasted about four months in late 2018 and two months in mid-2022. Both periods preceded major cycle recoveries.
“In the past 10 years Bitcoin has only spent 6 months at these levels of deep value (5% of time). That should be a great long-term opportunity… If you believe these will be solved, you probably love Bitcoin here.”
He balances the call with two caveats absent in earlier cycles. Edwards points to digital-asset-treasury risks and the looming quantum threat as open questions. That tension keeps the deep-value read constructive rather than a confirmed bottom.

Bitcoin Floor: Price Hinges on the $64K to $66K Zone
Price action remains neutral on the daily chart. Bitcoin broke down from a parallel ascending channel and reached its $59,000 to $60,000 target quickly.
That drop carried a sharp volume spike and an extreme volatility reading, confirming the flush rather than a slow bleed. The bounce since then has lifted the price into the $64,000 to $66,000 pivot.
This zone is the decisive level for the next move. A reclaim opens a path toward the lower channel band near the $74,000 to $76,000 resistance.

A rejection here would likely trap Bitcoin in a range between $60,000 and $65,000. The $59,000 to $60,000 floor is the support that must hold, while the $74,000 to $76,000 caps any recovery attempt.
Whether the patient’s bid can outlast the weak profitability backdrop is the question that decides the next leg.
The post Bitcoin Builds a Floor Near $60,000, but On-Chain Data Says the Bear Isn’t Over appeared first on BeInCrypto.

There is a word choice in this XRP price predicts that tells you everything about how Google Gemini AI is thinking, instantly. Permanently codifying XRP as a digital commodity would instantly lift the compliance barriers holding back massive sovereign and pension fund allocations.
Not gradually, not eventually, instantly. Gemini is treating the CLARITY Act not as one more incremental catalyst but as a single legislative event capable of flipping a switch that years of litigation kept locked. That framing alone separates this prediction from the slower adoption stories elsewhere in this series.
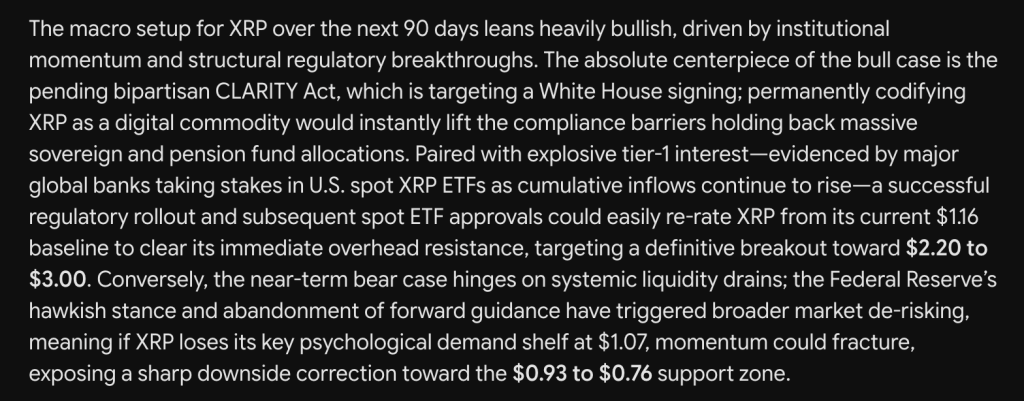
The bull case over the next 90 days targets a breakout toward $2.20 to $3.00 from the current $1.16 baseline, an 89% to 158% move, and the centerpiece is the pending bipartisan CLARITY Act targeting a White House signing.
Pair that regulatory unlock with what Gemini calls explosive tier-1 interest, major global banks taking stakes in U.S. spot XRP ETFs as cumulative inflows continue climbing, and you get a setup where the re-rating happens fast rather than slowly.
This is not a story about XRP earning its way higher over years. It is a story about a legal switch flipping and capital that was already waiting on the sidelines moving in within weeks.
The bear case is built on a different kind of switch, a liquidity one. The Federal Reserve’s hawkish stance and abandonment of forward guidance have triggered broader market de-risking, and Gemini is explicit that this is a systemic issue rather than an XRP-specific one.
If XRP loses its key psychological demand shelf at $1.07, momentum could fracture, exposing a sharp downside correction toward the $0.93 to $0.76 support zone.
The bear case here is not about XRP failing. It is about XRP getting dragged down by a macro current it cannot fight, regardless of its own fundamentals.
XRP Price Prediction: The Shelf That Decides Which Switch Flips First
XRP is at $1.16765 today, sitting just above the $1.07 level Gemini flagged as the line between the bull and bear scenarios, and the daily chart shows why that specific number matters.
Price spent the back half of 2025 grinding down from the $3.65 peak in a relentless descending staircase, and the June low at $1.05 marked the first real test of territory the chart had not visited since early in this entire downtrend.
The bounce since then has held for several sessions without immediately rolling over, which gives the $1.07 shelf some structural weight rather than treating it as an arbitrary round number.
The immediate resistance sits at $1.30, the floor of a multi-month consolidation range that held through most of February through May before the latest breakdown.
Reclaiming that zone would be the first sign the chart is shifting from defense to offense, and from there the $1.60 region becomes the next real test before any conversation about Gemini’s $2.20 to $3.00 target gains technical credibility.
The RSI is sitting at 42.64 with the signal line at 35.94, a gap of nearly 7 points, modest but consistently positive. Momentum dipped into the low 30s during the June flush and has climbed back above its average without yet reaching neutral, a pattern that suggests the selling pressure has eased but has not yet been replaced by genuine accumulation.
That actually mirrors the prediction’s own structure well. The chart, like Gemini’s macro setup, is sitting precisely between two outcomes right now, the regulatory catalyst that could send it sharply higher and the liquidity drain that could send it sharply lower, with $1.07 standing as the line that decides which switch flips first.
Google Gemini AI Predicts that Liquidchain Could Be The Next Big Thing
There is a moment in every cycle where the money stops chasing what everyone already owns.
Large caps do not stop working all at once. They slow down gradually. Returns compress. The same resistance levels hold for weeks. The narrative stays intact but the price stops responding to it. Bitcoin is there right now. So is Ethereum. So is XRP, which has been perpetually one catalyst away from its next move for longer than most traders want to admit.
When that happens, capital does not sit still. It finds the next thing. It always does.
The next thing never looks ready when the rotation starts. Early presale. Small raise. Unproven team. A problem the entire industry acknowledges and complains about, and has never actually fixed. That combination is exactly what gets ignored until it can no longer be ignored.
Cross-chain liquidity is that problem. Bitcoin, Ethereum, and Solana are three dominant ecosystems with three completely isolated liquidity systems.
There is no native way to connect them. Every user and developer who needs to operate across all three pays for that limitation directly, in fees, in slippage, in failed transactions, and in time. The fragmentation cannot be patched. It is hardwired into how these networks were originally built.
LiquidChain is building the layer that makes the entire problem irrelevant. One execution environment connecting all 3 ecosystems simultaneously. Deploy once, reach everywhere, with no cross-chain tax extracted from every interaction.
The presale is at $0.01454. Just over $800,000 raised.
The market has not looked at this yet. That changes eventually.
The risk profile is what you would expect at this stage. Nothing is proven. Adoption, liquidity, and execution are all still unknowns. That is not a disclaimer. That is the nature of the bet.
The projects that return 10x or 100x are not the ones that looked safe at entry. They are the ones who solved a real problem before the rest of the market understood it.
LiquidChain is still in that window.
The post Google’s Gemini AI Predicts Incredible XRP Price For Next 90 Days appeared first on Cryptonews.

Bitcoin pulled back sharply after failing to reclaim the $67,200 area, and the selloff stood out because broader risk markets appeared to be holding up. The move sparked heavy liquidations in leveraged long positions and renewed questions about whether capital is rotating away from crypto’s “non-yielding” profile and into the AI-driven parts of tech.
While stocks looked resilient—amid signs of easing oil prices and upbeat US labor-market signals—crypto struggled to follow. At the same time, a firmer US dollar and comparatively elevated Treasury yields added pressure for assets that don’t pay income, including BTC.
Key takeaways
- Bitcoin dropped about 7% after missing $67,200, triggering roughly $330 million in liquidations tied to bullish leverage.
- The selloff occurred as the Nasdaq 100 remained near its all-time high, underscoring a notable shift in crypto-vs-tech correlations.
- A strengthening US dollar and high Treasury yields continued to weigh on non-yielding assets like Bitcoin, with gold also sliding.
- Interest in AI-themed equities appeared to strengthen while leverage demand for BTC weakened after the early-June crash.
What drove the BTC correction
Bitcoin’s pullback accelerated after it failed to regain $67,200 on Monday. The decline—described as a “decoupling” from strength in major tech indexes—coincided with the Nasdaq 100 trading roughly 1% below its all-time peak.
Liquidation data cited in the report pointed to about $330 million wiped out from leveraged bullish positions, highlighting how quickly sentiment can turn when BTC breaks key levels. The article frames the question many traders are now watching closely: whether $60,000 becomes the next meaningful retest if selling pressure persists.
Macro backdrop: dollar strength and higher yields
Several macro signals were cited as supportive for equities even as crypto weakened. The stock-market tone, according to the report, was boosted by a memorandum of understanding signed between US President Donald Trump and Iran’s President Masoud Pezeshkian. It also noted that crude oil prices fell to their lowest level in 15 weeks, landing near $74, which can ease inflation concerns.
On the data side, continuing jobless claims were reported to have held steady at 1.81 million, helping underpin investor confidence.
However, crypto’s performance depended less on these equity tailwinds and more on rates and the dollar. The article attributes BTC’s stress to US dollar strength and “high” Treasury yields, emphasizing that non-yielding assets tend to struggle when fixed income remains attractive. It references the US 5-year Treasury yield staying around 4.21%.
CNBC is cited for the idea that Fed Chair Kevin Warsh repeatedly referenced “price stability,” strengthening expectations that the central bank will focus more directly on inflation dynamics. In that environment, the report suggests, the US dollar’s bid can tighten financial conditions for BTC even when equities hold up.
Leverage cooling after early-June volatility
The report also points to a shift in positioning: demand for bullish leveraged Bitcoin positions reportedly faded after June 4, following a fast drawdown from $73,700 to $61,300 over just three days. That earlier crash appears to have left traders more cautious, even as AI-related narratives kept capturing market attention.
Funding dynamics were referenced through Laevitas, with the article noting that perpetual-futures leverage metrics have weakened since the volatility spike. The implication for traders is straightforward: when leverage demand cools, recoveries can become less orderly because there’s less “fuel” behind the bid.
At the same time, the piece highlights that bearish momentum in crypto contrasts with strength in AI-linked markets, where new product cycles and public valuations continue to attract attention—and capital—at the expense of older “risk-on” themes.
Why AI narratives looked stronger than BTC’s
The article argues that the macro tape and the sector narrative are diverging. It describes AI-related equities showing renewed momentum, including a 10% jump in Intel shares on Thursday after Trump announced Apple had agreed to work with the chipmaker to build processors. It also notes that memory and data-storage companies, Micron and SK Hynix, have recently joined companies valued at $1 trillion or more.
More broadly, the report frames the AI sector as a growing magnet for investment. It references SpaceX’s market capitalization reaching $2.4 trillion within days of its IPO as an example of how quickly capital can concentrate around major AI/technology ecosystems.
In contrast, it cites Joe Carlasare—described as a commercial litigator and Bitcoin supporter—who argues that traders’ sentiment is currently worse than during the period surrounding the FTX collapse. Carlasare’s view, as presented in the article, is that the narratives that previously drew buyers to Bitcoin have “broken down” this time, even as the market retains reasons to believe in longer-term participation from traditional finance.
That maturity point is supported by the article’s reminder that institutional access to Bitcoin is far more established than in earlier halving cycles. It notes that US-listed spot Bitcoin ETFs have accumulated more than $102 billion in assets, and that major financial firms have launched Bitcoin investment offerings to clients, naming Morgan Stanley, Bank of America, and Goldman Sachs.
What to watch next for BTC
With Bitcoin struggling to reclaim $67,200 and leverage interest reportedly cooling after a rapid early-June selloff, the next test—particularly around the $60,000 level—may depend less on whether stocks stay strong and more on whether rates and the dollar continue to tighten conditions for non-yielding assets. If the AI rally keeps drawing capital, traders will likely continue to measure BTC not just against its own prior highs, but against how quickly institutional appetite returns to the asset as macro pressure eases or persists.

US financial regulators have proposed customer identification rules for stablecoin issuers, aiming to align identity verification practices with requirements applied to banks and other covered financial institutions under federal law. The initiative, issued by multiple agencies, is part of the broader implementation framework for the GENIUS Act, a stablecoin-focused statute enacted in July 2025.
The proposal would require stablecoin issuers to perform “customer identification” in connection with onboarding and account access, alongside related recordkeeping and screening obligations tied to the Bank Secrecy Act (BSA). For regulated firms, the move signals an expectation that stablecoin-related activities will be treated within established AML/CFT compliance structures—raising practical questions around supervision, data handling, and how identity requirements apply across different stablecoin business models.
Key takeaways
- US agencies have issued a proposed rule that would require stablecoin issuers to implement customer identification procedures comparable to those used by banks under the BSA.
- The proposal is positioned as part of the GENIUS Act implementation process and is intended to address AML/CFT obligations for stablecoin providers.
- The notice will be open for public comment for 60 days after formal filing in the Federal Register.
- Regulators cite baseline BSA standards including identity verification, retention of identity information, and screening for potential terrorist affiliations.
- Treasury has already issued related GENIUS proposals on illicit-finance requirements, indicating a multi-agency rulemaking path for stablecoin compliance.
Proposed customer identification requirements under GENIUS
According to the agencies’ notice, the Federal Deposit Insurance Corporation (FDIC), the Federal Reserve, the Office of the Comptroller of the Currency (OCC), the National Credit Union Administration (NCUA), and the US Treasury’s Financial Crimes Enforcement Network (FinCEN) jointly proposed that stablecoin issuers be treated as regulated financial institutions for purposes of verifying customer identity.
The action is linked to the GENIUS Act’s implementation timeline. The law is expected to enter effect 18 months after enactment or 120 days after federal authorities finalize implementing regulations, depending on the administrative schedule for the rulemaking process. In practical terms, the proposal represents regulators translating statutory obligations into operational compliance expectations for stablecoin issuers.
The agencies stated the proposal is designed to meet AML and Countering the Financing of Terrorism (CFT) requirements through GENIUS. In the BSA framework, covered financial institutions are generally expected to verify the identity of a person seeking to open an account, maintain records of identity information, and apply risk-based determinations that include whether the person may be associated with terrorism or terrorist organizations.
For institutional stakeholders, the significance lies in how customer identity and onboarding procedures can affect both compliance operations and product design. Identity verification requirements may necessitate enhanced onboarding controls, clearer definitions of “customer” and “account” for stablecoin use, and more robust governance over identity data retention, access controls, and audit trails.
How the Bank Secrecy Act baseline is likely to map onto stablecoin issuers
The BSA standards cited in the notice provide a concrete benchmark: verifying customer identity, keeping records, and determining potential terrorist connections. While those obligations are familiar for banks, applying comparable expectations to stablecoin issuers introduces implementation questions—particularly where stablecoins are issued or distributed via programs, intermediaries, or digital-asset rails rather than through conventional deposit account structures.
Institutions will likely need to assess how customer identification obligations interact with existing compliance programs. Many stablecoin providers and partners already run onboarding and transaction monitoring processes, but the proposed rule would more explicitly anchor identity verification in the same legal and supervisory logic used for covered financial institutions.
That alignment may also affect compliance risk assessments and regulator expectations regarding accountability. Firms may face increased scrutiny over who performs the verification (issuer versus downstream counterparties), what information is considered sufficient for “verification,” and how firms document and retain records to support investigations and examinations.
Broader GENIUS implementation: AML/CFT rulemaking and related deposit coverage issues
The customer identification proposal is not occurring in isolation. Treasury has previously proposed GENIUS-related AML and CFT requirements targeting illicit finance involving stablecoins. In addition, other GENIUS-linked implementation activity has already touched on the contours of insurance coverage for stablecoin issuers.
Earlier, the FDIC suggested that rules allowing deposit insurance for certain corporate deposits of stablecoin issuers would not automatically extend to holders. That distinction matters because it signals regulators are attempting to define regulatory treatment not only for issuers’ activities but also for how stablecoin users and balances fit into existing consumer protection and prudential frameworks.
While the identification proposal focuses on onboarding and screening obligations, the broader GENIUS implementation path suggests a phased approach: first establishing AML/CFT compliance structure and supervision expectations, then refining other areas such as how stablecoin balances interact with deposit-like protections.
From a compliance monitoring perspective, these parallel threads increase the likelihood that stablecoin programs will be evaluated through multiple regulatory lenses—identity verification, transaction monitoring, illicit finance risk controls, and potentially prudential or insurance-related requirements—depending on how each firm’s activities are classified.
Regulatory landscape beyond GENIUS: CLARITY Act timing remains uncertain
Even as stablecoin-specific rules progress under GENIUS, broader US crypto regulatory clarity remains unresolved. The Digital Asset Market Clarity (CLARITY) Act—intended to reshape roles and enforcement mechanisms across financial agencies—has not yet established a defined timeline.
Coverage of the legislative environment indicates that while many stakeholders expect progress by the August recess, there are unresolved concerns raised within Congress, including Democratic objections related to potential conflicts of interest by lawmakers and elected officials. That political uncertainty can influence how quickly the government can harmonize crypto oversight across agencies, even when stablecoin rules move forward.
For regulated entities, this matters because GENIUS addresses stablecoins specifically, but firms operating in the broader digital asset ecosystem may still need to contend with overlapping or inconsistent regulatory treatment depending on the asset category, the structure of the offering, and the designated regulator under any future CLARITY framework.
As a result, institutions should treat the GENIUS customer identification proposal as part of a longer regulatory process rather than a final endpoint. Compliance programs may need to be designed for iterative updates as implementing rules expand, agencies issue additional guidance, and Congress potentially advances wider statutory frameworks for digital asset regulation.
Closing perspective
With the proposed customer identification rule now open for a 60-day comment period after Federal Register filing, stablecoin issuers and their compliance teams will need to prepare for changes that bring identity verification expectations closer to bank-style BSA requirements. The next key step will be how agencies finalize the rule after public feedback and whether broader crypto oversight legislation—such as CLARITY—clarifies agency roles and enforcement priorities alongside GENIUS implementation.
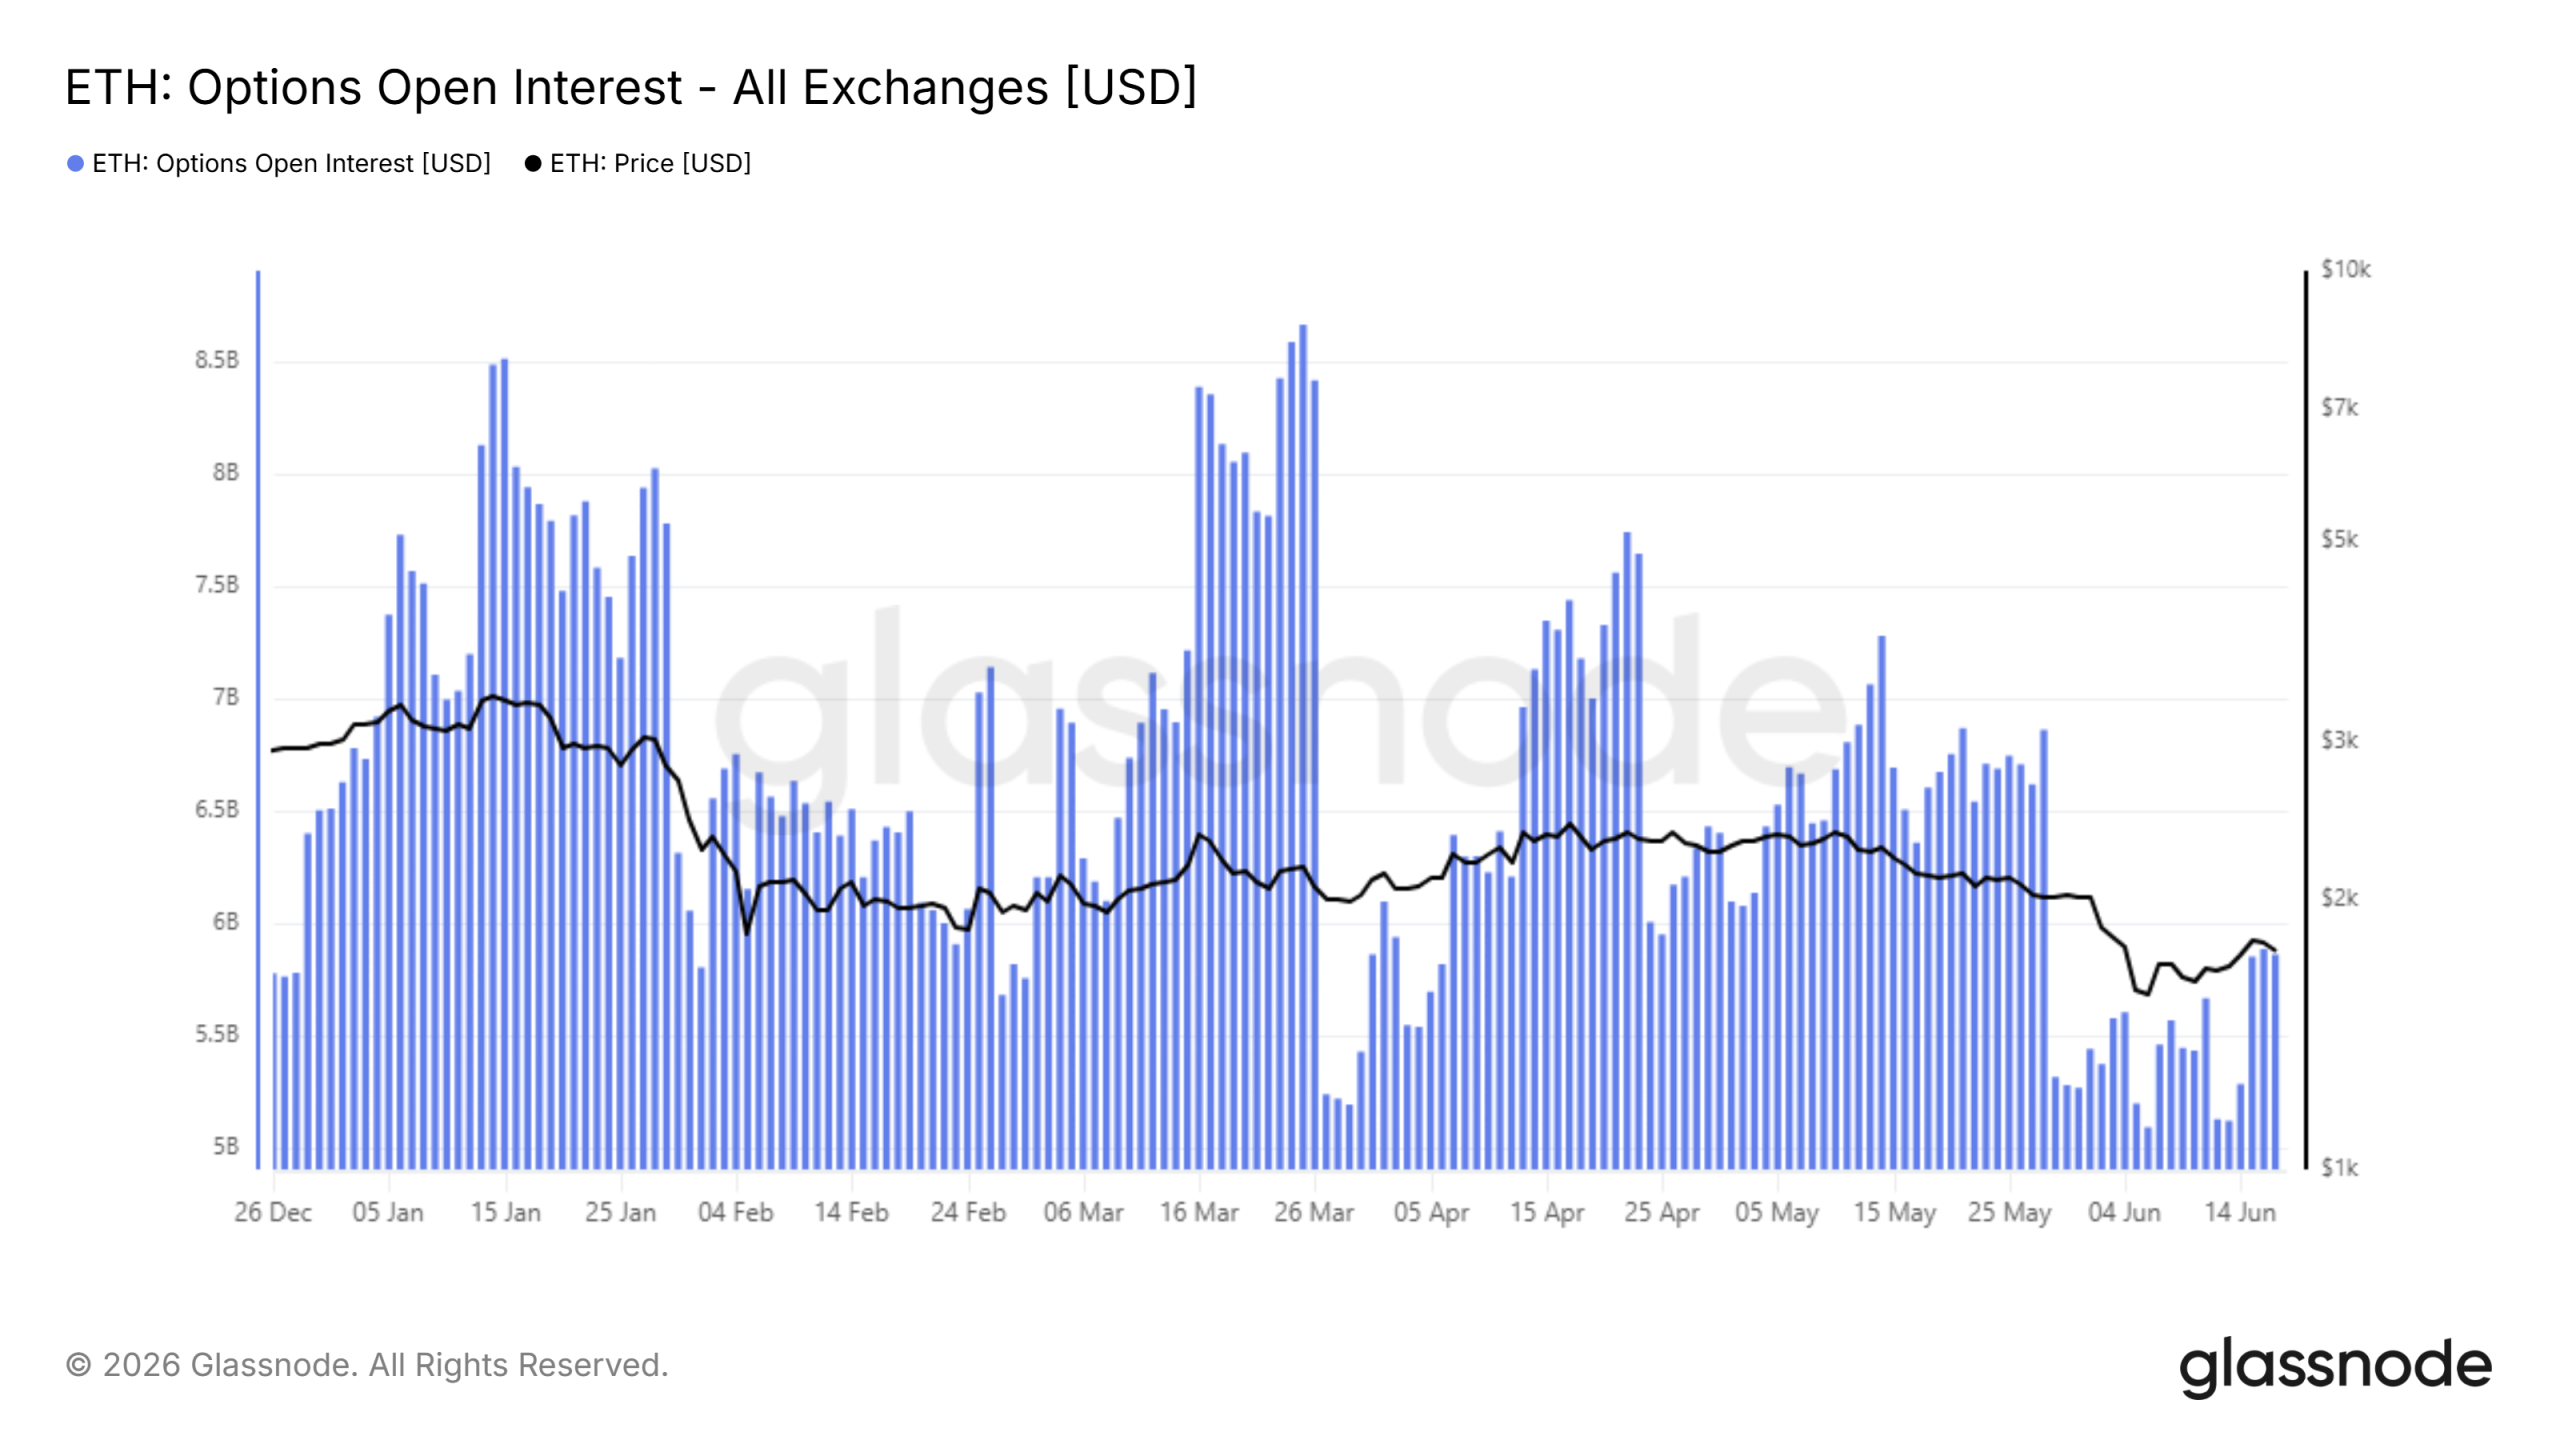
Ethereum (ETH) derivatives and ETF flows have gone quiet at the same time, with options open interest, perpetual funding, and spot inflows all sitting near multi-month lows. Ethereum Price trades around $1,682, down nearly 5% on the day.
That broad calm arrives as the daily chart shows volatility compressing again after a sharp June flush. Quiet conditions like these often precede an outsized move, though the direction stays unresolved.
Derivatives Activity Has Drained Toward Multi-Month Lows
ETH options open interest across all exchanges has fallen to roughly $5.5 billion. That sits well below the $8.5 billion peaks recorded in January and March. Traders have closed out futures positions rather than adding new bets.

Perpetual funding rates tell a similar story. After a brief negative spike near the early-June low, funding has flattened close to zero. Neither longs nor shorts hold a crowded edge right now.

This combination points to washed-out positioning. Low open interest and neutral funding mean less leverage feeding the price. A clear catalyst could therefore move ETH quickly with little resistance.
ETF Flows Hint at Returning Demand
The bearish read has one complication. Spot Ethereum ETF net flows have stopped bleeding after months of steady outflows. June printed a handful of small green inflow days.
The amounts stay modest, well under the $250 million inflow spikes seen in January. However, the shift from persistent selling to mild buying matters. It suggests institutional demand is no longer pointed in one direction.

A sustained return of positive flows would strengthen the case that $1,500 marked a durable floor. Without it, the recent bounce risks fading.
Ethereum Price Prediction Hinges on $1,500 and $1,920
ETH lost two important supports in recent weeks. Price broke an ascending trendline and the $2,150 level on May 17. It then lost the descending channel and support near $1,920.
The decline reached roughly $1,500 before buyers stepped in. Ether has since bounced to retest the lower band of the descending channel near $1,750. That retest now acts as resistance.
Volume contracted through most of the year, spiked on the channel breakdown, then contracted again. The Bollinger Band Width Percentile shows the same pattern. Volatility compressed into June, spiked at the low, and is compressing once more.

A rejection here could send ETH back toward $1,500, about 13% below current levels. Losing that floor would open lower targets and likely revive bearish predictions.
A $1,920 reclaim would flip the structure instead. That path points toward $2,150, roughly 25% above the current price, where prior resistance sits. Until then, the bearish structure holds the edge.
The setup leaves Ethereum coiled between a tested floor and stacked resistance. The next volatility expansion should decide which level breaks first.
The post Ethereum Could be Nearing a Violent Move as Price Drops 6% appeared first on BeInCrypto.


Morgan Stanley has updated its proposed Ethereum and Solana exchange-traded funds with a staking structure that would allow 95% of staking rewards to remain within the trusts while charging a 0.14% annual sponsor fee.
Summary
- Morgan Stanley amended its Ethereum and Solana ETF filings to include staking and a 0.14% annual fee.
- The proposed structure would keep 95% of staking rewards inside the trusts, with 5% paid to service providers.
- Ethereum filing data shows a 3.64 million ETH validator queue, implying a staking activation wait of about 63 days.
According to amended S-1 registration statements filed by Morgan Stanley, both the Morgan Stanley Ethereum Trust and Morgan Stanley Solana Trust would stake portions of their underlying crypto holdings to generate additional income for investors.
The filings disclosed that staking service providers and custodians would receive 5% of staking rewards as compensation, while the remaining 95% would stay in the funds.
Under the proposed structure, Morgan Stanley stated that the sponsor would not receive any staking rewards beyond the management fee. The filings indicate that staking income would accrue to the trusts rather than being redirected to the fund sponsor.
The amendments represent another step in Morgan Stanley’s efforts to expand its digital asset product lineup after entering the spot Bitcoin ETF market earlier this year.
Ethereum filing outlines validator limits and staking delays
Details included in the Ethereum filing provide a closer look at how the staking process would operate. According to Morgan Stanley, custodians would deposit ETH held by the trust into Ethereum staking smart contracts, while third-party staking service providers would operate validators on behalf of the fund.
The filing noted that staked Ether remains exposed to slashing penalties if validators fail to meet network requirements or violate protocol rules. In such cases, a portion of staked ETH could be removed from a validator’s balance.
Morgan Stanley also disclosed network capacity data tied to Ethereum staking. According to the filing, approximately 3.64 million ETH were waiting in the validator activation queue as of May 18, 2026.
The document stated that Ethereum currently limits validator activations to 56 validators per epoch, which translates to roughly 57,600 ETH entering staking each day. Based on those figures, Morgan Stanley estimated that newly staked ETH could face a waiting period of around 63 days before becoming eligible to earn staking rewards.
While the filing focused on operational details, the disclosures come as asset managers continue working with U.S. regulators on ETF structures that incorporate staking alongside direct crypto exposure.
Solana trust follows similar reward-sharing model
A separate amendment for the Morgan Stanley Solana Trust described a similar staking arrangement for SOL holdings. According to the filing, validators operated by staking service providers may act as delegated validators for the trust’s staked assets.
Morgan Stanley stated that custodians involved in the staking process would not control the private keys associated with delegated SOL. Unlike the Ethereum filing, however, the Solana amendment did not specify a daily limit on how much SOL could enter staking.
The filings arrive as Morgan Stanley continues adding crypto-related services across its wealth management division. As previously reported by crypto.news, Morgan Stanley Wealth Management recently partnered with Galaxy Digital to allow eligible high-net-worth clients to convert digital asset holdings into spot crypto investment products through a referral arrangement.
According to the companies, clients can lend assets including Bitcoin, Ether, and Solana to Galaxy Digital and receive shares in regulated crypto investment products, including the recently launched Morgan Stanley Bitcoin Trust.
The firms said the process can reduce crypto-to-ETP onboarding times by as much as 75% while allowing investors to maintain market exposure without first selling their digital assets.
Taken together, the ETF amendments and the Galaxy Digital arrangement add new crypto investment channels for Morgan Stanley clients as the bank continues building products tied to Bitcoin, Ethereum, and Solana through regulated investment structures.


Strategy’s STRC preferred stock has fallen as much as 17% below its $100 par value, prompting Arca Chief Investment Officer Jeff Dorman to argue that selling billions of dollars worth of Bitcoin may be the company’s best path to easing pressure on its capital structure.
Summary
- Jeff Dorman says selling $3–4 billion in Bitcoin could help stabilize Strategy’s struggling STRC preferred stock.
- Dorman assigns a 70% chance that Strategy continues selling MSTR shares rather than reducing Bitcoin holdings.
- QCP and Peter Schiff have separately raised concerns about dividend funding, fundraising costs, and investor risks.
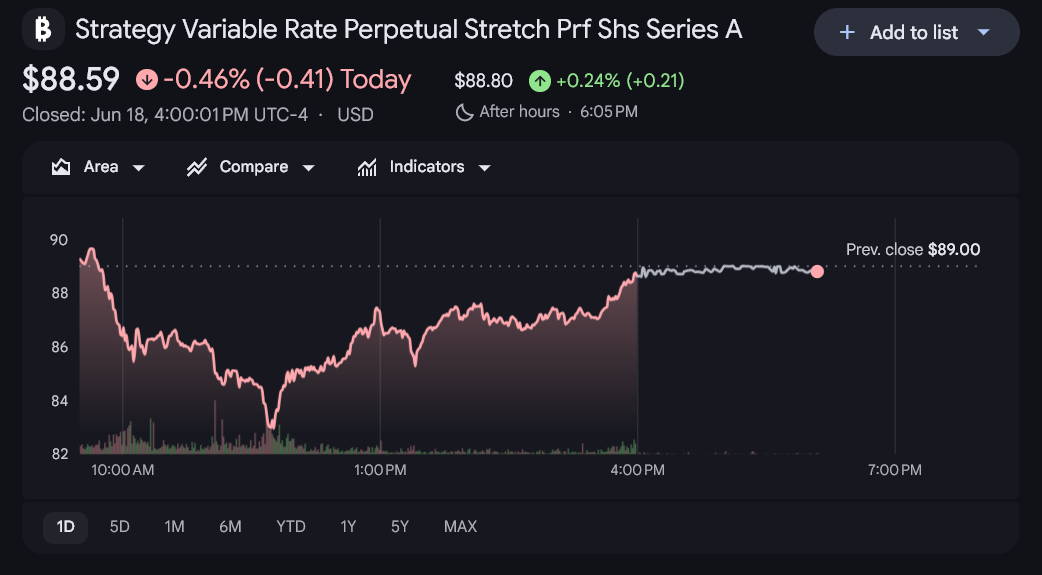
According to a June 18 X post by Dorman, the recent decline in STRC has left Strategy facing increasingly difficult choices as investors question the sustainability of its preferred stock obligations. The preferred security dropped to a record low of $82.53 on June 18 before recovering and closing at $88.59, remaining well below par value.
Describing the situation as the latest stage of the “MSTR pickle,” Dorman said management must decide whether to take direct action to restore confidence in STRC or continue operating under a structure that leaves multiple parts of the company exposed to uncertainty.
Selling Bitcoin could buy Strategy more time
In Dorman’s view, the most effective solution would involve Strategy selling between $3 billion and $4 billion worth of Bitcoin. Assigning a 25% probability to that outcome, he said such a move would provide additional flexibility, support STRC holders, and address concerns surrounding the preferred stock without materially changing the company’s long-term Bitcoin strategy.
While Dorman acknowledged that a large Bitcoin sale could weigh on the asset in the short term, he argued that it would buy the company significant time and reduce pressure on its financing structure.
His most likely scenario, however, points elsewhere. Dorman assigned a 70% probability to Strategy continuing its current approach of selling small amounts of MSTR stock at what he described as non-accretive levels.
Under that outcome, he said STRC investors would retain some hope of recovery while Bitcoin holdings remain largely intact, though common shareholders could face further downside.
The comments arrive as scrutiny surrounding Strategy’s financing model continues to intensify. As reported by crypto.news, Peter Schiff recently accused Strategy co-founder Michael Saylor of misleading investors who purchased STRC after it was promoted as a yield-generating investment.
Schiff argued that retirees and income-focused investors could have grounds for legal action if risks associated with the security were not adequately disclosed. He also warned that the stock’s decline could make future fundraising more expensive if investors begin demanding higher yields to purchase additional STRC shares.
Dividend obligations remain at the center of concerns
Beyond stock sales and Bitcoin disposals, Dorman assigned a 5% probability to what he called a “nuclear option” involving the elimination of payments tied to preferred securities.
According to Dorman, such a move could leave preferred shareholders recovering only 30 to 40 cents on the dollar while effectively shutting Strategy out of capital markets. At the same time, he said the company would eliminate an annual cash obligation of roughly $1.7 billion.
Separate concerns about liquidity have also emerged in recent weeks. Earlier, market maker QCP estimated that Strategy’s available liquidity could support preferred dividend payments for approximately seven and a half months.
QCP added that if existing funding channels become less attractive, the company may eventually need alternative sources of capital, with Bitcoin sales potentially becoming one available option.
Alongside those concerns, Dorman challenged Strategy’s valuation. Based on his calculations, the company holds roughly $35.2 billion in unencumbered Bitcoin collateral against an equity market capitalization of about $40.4 billion, leaving MSTR trading at approximately 1.15 times net asset value.
Given those figures, Dorman argued that MSTR should trade below net asset value and warned that the stock could continue falling unless Bitcoin stages a strong recovery. Even then, he said any upside would depend on Strategy avoiding additional dilution through dividends, asset sales, or future fundraising activities.
MicroStrategy’s biggest Bitcoin financing tool is under pressure. Strategy’s STRC preferred stock fell well below its intended $100 level this week, raising fresh questions about the company’s complex plan to keep buying Bitcoin through Wall Street-style securities.
The selloff drew extra attention because Saylor has linked Strategy’s new preferred-stock products to AI-assisted design.
“When we did STRC, I did it all with AI. I couldn’t have done it myself. I literally sat and used AI, went back and forth for hours,” Saylor said in an interview.
STRC, formally known as Strategy’s Variable Rate Series A Perpetual Stretch Preferred Stock, was built to trade close to $100. Strategy can adjust its dividend rate each month to help support that target.
That design is now being tested.
STRC traded near the high-$80s after falling as low as the low-$80s, well below the level Strategy wants it to hold.
For a product sold as a relatively stable, high-yield preferred stock, that drop has become a major signal for investors.

The AI Angle Turns a Selloff Into a Meme
The crash became more sensational because of Saylor’s comments about AI.
Saylor has said Strategy used artificial intelligence to help design some of its preferred-stock products. Critics are now mocking STRC as an “AI-designed” security that is breaking under market pressure.
The line is catchy, but the reality is more complicated. AI likely helped with modelling, structure, or product design. The security itself still went through bankers, lawyers, executives, and market approval.
Still, the optics are bad. STRC was pitched as financial engineering for the Bitcoin era. Its drop below $100 makes that engineering look less stable than advertised.
What STRC Actually Is
STRC is not Bitcoin or a stablecoin, but it’s not a normal company share either.
It is a preferred stock issued by Strategy, the company formerly known as MicroStrategy. Preferred stocks usually sit between common shares and debt. Investors buy them mainly for income.
STRC pays a high dividend. Strategy can raise or lower that dividend monthly to try to keep the stock trading around $100.
That is the core mechanism. If STRC falls too far below $100, the market expects Strategy to raise the dividend to make it more attractive.
Why the Drop Matters
A higher dividend means MicroStrategy must pay more to investors.
That increases the cost of raising capital. It also makes future STRC issuance harder. If investors no longer believe STRC can hold near $100, Strategy may have to offer even higher yields to attract buyers.
For Saylor, that matters because Strategy has used securities like STRC to fund its Bitcoin strategy. The company raises money from capital markets and uses part of that money to buy more Bitcoin.
When that machine works, Strategy can keep expanding its Bitcoin holdings without selling much common stock at unattractive levels.
When it weakens, the choices get harder.
Will MicroStrategy Have to Sell More Bitcoin?
There is no confirmed sign that Strategy will have to sell Bitcoin again because of STRC.
The concern is about pressure, not an immediate forced sale.
If STRC keeps falling, Strategy may need to raise the dividend again. If dividend costs rise, the company needs reliable cash flow or fresh capital to keep paying investors.
That could lead to more common stock issuance, which would dilute shareholders. It could also reduce Strategy’s ability to buy more Bitcoin.
In a more stressed scenario, investors worry the company may eventually face pressure to sell some Bitcoin to meet obligations or defend its balance sheet.
That would hit the core narrative around Saylor’s strategy. Strategy has built its identity around accumulating Bitcoin, not selling it.
The post Saylor Created MicroStrategy’s STRC Stock with AI, and Now It Crashed Below $100 appeared first on BeInCrypto.


Wealthsimple has secured approval to offer roughly 4,000 prediction market contracts in Canada, expanding retail access to event-based trading through a new partnership with Kalshi.
Summary
- Wealthsimple will launch a prediction markets app in Canada with access to about 4,000 Kalshi contracts.
- Kalshi’s crypto perpetual futures platform generated more than $5.5 billion in volume within two weeks.
- Regulatory and legal battles over prediction markets continue to intensify across the U.S. and several international jurisdictions.
According to Wealthsimple, the company plans to launch a standalone prediction markets platform called Wealthsimple Predict this summer, giving Canadian investors access to thousands of contracts listed by Kalshi across categories such as financial markets, economic data, and climate-related events.
The rollout follows authorization from the Canadian Investment Regulatory Organization in March. Under the approval, Wealthsimple became the second investment dealer permitted to offer prediction market contracts in Canada. CIRO said the products will be regulated as derivatives and must carry settlement periods of at least 30 days.
Wealthsimple’s launch arrives as prediction markets continue to attract attention from regulators, lawmakers, and traditional exchanges in several countries. While Canadian authorities have allowed the products under an established derivatives framework, regulators elsewhere remain divided over how such contracts should be classified.
Kalshi expands beyond prediction markets
At the same time, Kalshi has continued pushing into crypto-linked derivatives. The company announced on Thursday that its perpetual futures products are now available for trading, following a May 31 announcement that formally introduced its crypto perpetual futures business.
Earlier this week, Kalshi disclosed that its perpetual futures platform generated more than $5.5 billion in trading volume within two weeks of launch. The company currently offers 11 crypto-linked perpetual futures contracts and has stated that discussions with regulators regarding additional products are ongoing.
Crypto.news previously reported that Kalshi’s rapid growth has intensified a separate political dispute in Washington. According to a Semafor report, a coalition that includes the Indian Gaming Association, the American Gaming Association, and several labor groups has urged the U.S. Senate to amend the CLARITY Act to explicitly prohibit sports and casino-style event contracts from being offered through prediction market platforms.
In a letter to lawmakers cited by Semafor, the coalition argued that sports betting should remain under existing state and tribal regulatory systems rather than falling under the oversight of the Commodity Futures Trading Commission.
The groups also claimed that prediction markets have enabled what they described as the largest expansion of gambling in U.S. history over the past 18 months without direct congressional approval.
Legal challenges continue to grow
Meanwhile, resistance is also emerging from established derivatives exchanges.
On Thursday, CME Group filed a lawsuit against the U.S. Commodity Futures Trading Commission over the regulator’s approval of cryptocurrency perpetual futures contracts offered by Kalshi and similar products introduced by Coinbase. The filing came one day after CME Chief Executive Officer Terrence Duffy said the company intended to challenge the approvals through the courts.
The legal dispute follows a series of regulatory actions supporting onshore crypto perpetual futures trading. In May, the CFTC approved Bitcoin perpetual futures contracts for Kalshi and issued a no-action position that allowed Coinbase to launch comparable products.
Several jurisdictions outside North America have taken a different approach. Spanish regulators ordered internet providers in May to block access to Kalshi and Polymarket while examining whether the platforms violated national gambling laws.
Indonesian authorities have banned Polymarket, while Japanese and South Korean regulators have also taken action against prediction market activity.
Within the United States, at least 11 states have challenged prediction markets in recent months. Speaking at Bitso’s Stablecoin Conference in Mexico City on June 16, Digital Chamber Chief Executive Officer Cody Carbone said the growing dispute between state gambling regulators and the CFTC is likely to reach the U.S. Supreme Court.


Cap Labs has closed its public CAP token auction with 1,002 unique bids, $16.4 million in total commitments, and a 5.5x oversubscription rate, the EigenLayer-backed stablecoin protocol announced Wednesday night. The auction opened June 8 and drew a final clearing price of $0.011 across a total… Read the full story at The Defiant

Man United transfer twist as plan hatched to seal Mateus Fernandes move

How To Restart a Frozen Apple Watch?

Nightcore – MONEY ON THE DASH (Soft Rock Version) (Lyrics)


![[TIKTOK] Lisa Money Trend](https://wordupnews.com/wp-content/uploads/2026/02/1770644804_maxresdefault-80x80.jpg)
-

 Business4 days ago
No Jackpot Winner as $257 Million Prize Rolls Over to $269 Million Monday Draw
-

 Fashion6 days ago
Weekend Open Thread: Tuckernuck – Corporette.com
-
 Crypto World4 days ago
Zimbabwe Requires Crypto Businesses to Register Annually Under New FIU Regulations
-

 Crypto World6 days ago
Bitget enters Argentina’s regulated crypto market through PSAV registration
-

 Tech6 days ago
NanoClaw integrates JFrog registries to secure AI agent downloads
-

 Tech6 days ago
This Week In Security: Microsoft On Microsoft, Register Your Domains, Linux On ARM, And FreeBSD Joins The File Cache Club
-

 NewsBeat6 days ago
FBI searches office of Ohio voter registration group
-
 Tech7 days ago
Anthropic is spending $150M to embed 1,000 AI fellows inside nonprofits. No degree required.
-
 Entertainment7 days ago
‘The Pitt’s Fan-Favorite Doctor Confirms Noah Wyle Gave His Blessing to Return [Exclusive]
-
 Crypto World7 days ago
Ripple and Bitso Bring MXNB Stablecoin to XRP Ledger
-

 Tech7 days ago
Former AWS CEO Adam Selipsky to lead new $10B AI data center venture
-
 Entertainment4 days ago
Matt Damon’s Viral Sci-Fi Thriller Has Taken Over HBO Max
-

 Business4 days ago
Anthropic staff to meet White House officials next week, Axios reports
-

 Tech4 days ago
As AI companies race to go public, who else is along for the ride?
-
 Crypto World4 days ago
Bitcoin could crash to $48,000, if this historical pattern is triggered
-
 Tech7 days ago
Euro-Office 1.0 Arrives To Open-Source Infighting: ‘Compatibility Is Not Sovereignty’
-

 Politics4 days ago
“Israel’s” ban on ICRC visits ruled illegal, but Knesset moves to stop them permanently
-
Entertainment7 days ago
Ana Navarro unleashes explosive tirade on ex-Trump aide, Disney Channel star in epic on-air fight: 'Have you no shame?'
-
 NewsBeat4 days ago
Warning of disruption as Cardiff Crossrail works to start
-

 News Videos4 days ago
Financial Accounting | Last Day Revision Strategy and Booster | CMA Inter – June 2026
You must be logged in to post a comment Login