

Crypto World
KYC Applies Only to Beta, Not on the Live Platform

Polymarket has moved to ease a wave of regulatory uncertainty around its service by clarifying its stance on identity checks. The platform’s vice president of engineering, Josh Stevens, said there will be no mandatory KYC (Know Your Customer) requirements for the core Polymarket.com platform. Instead, a new beta product will require KYC access only during its early testing phase, after which no KYC will be required to use the main site.
The clarification follows a report from The Information that Polymarket had considered imposing user verification amid mounting regulatory scrutiny. Stevens reaffirmed the distinction: identity checks are tied specifically to early access for a separate beta product, not to the established prediction market that underpins Polymarket’s main offering.
Cointelegraph contacted Polymarket and Stevens for further comment but did not receive an immediate response. For context, the company has been navigating a broader regulatory landscape that has included widening geoblocking and cross-border access restrictions in several jurisdictions.
Key takeaways
- Polymarket states no KYC will be required for its main platform; KYC will only apply to a beta product during its early access phase.
- Stevens cautioned that this beta-related identity check is not an indicator of a broader shift away from pseudonymous trading on Polymarket’s core market.
- The clarification comes amid reporting that regulatory pressure has prompted discussions around user verification and platform access.
- Regulatory restrictions are expanding, with dozens of geographies outlined in Polymarket’s access controls and several jurisdictions taking action against prediction-market platforms.
- Policy and market dynamics point to a fragile balance between global access to prediction markets and the regulators’ focus on licensing and consumer protection.
KYC clarification amid regulatory pressures
The core message from Polymarket comes directly from Stevens’ X (formerly Twitter) posts, where he said the beta product would require KYC only for early access and that no KYC would be added to the existing Polymarket.com platform as part of this launch. He later emphasized that these identity checks are tied to a new beta product’s early access, not to a broader move away from pseudonymous participation on the main market.
The report from The Information had suggested that Polymarket had considered mandatory user verification in response to regulatory scrutiny. While multiple outlets have explored the regulatory implications for crypto-linked prediction markets, Polymarket’s stance here appears designed to prevent a blanket shift away from its current model while still enabling a controlled trial of a new product with identity checks.
Markets and users are watching how this will be implemented in practice. The beta will be accessible to a select group of users, with Stevens signaling that the approach is experimental and isolated from the platform’s ongoing, non-beta operations.
Geoblocking and the evolving regulatory backdrop
Polymarket’s stance arrives as the platform contends with expanding access restrictions in several jurisdictions. A Cointelegraph report noted that Polymarket had restricted access in dozens of jurisdictions, with some regions blocking new orders while others only permitting closing positions. The evolving geoblocking landscape underscores the tension between global reach and local regulatory regimes.
In April, Brazil moved to block Polymarket and other prediction platforms, among 27 services, in what authorities described as actions against unlicensed gambling activity. Spain’s gambling regulator followed suit in May, blocking local users from Polymarket and Kalshi as it pursued investigations into unlicensed gaming activity.
Despite these regulatory frictions, Polymarket has not halted expansion efforts. Reports from April suggested dialogue with the U.S. Commodity Futures Trading Commission (CFTC) about a broader relaunch in the United States, while May coverage indicated ongoing interest in entering Japan, despite the country’s strict gambling laws.
The dynamic illustrates a wider pattern in which prediction-market platforms face a patchwork of national rules, some of which permit limited participation while others impose outright bans or licensing requirements. For investors and users, the key question is whether access constraints—and any future KYC requirements—will erode liquidity or alter the platform’s competitive landscape.
Implications for users, investors, and builders
From a user perspective, the distinction between a beta-access KYC requirement and a non-KYC core platform matters. Beta participants may gain early exposure to new features or risk controls, but access will be limited. For the broader user base, Polymarket’s public, pseudonymous trading model remains a potential differentiator in a sector where regulators are increasingly scrutinizing online gambling and prediction-market activities.
For investors and platform builders, the situation highlights several critical considerations. First, regulatory alignment remains a moving target, with regional actions potentially changing the feasibility of cross-border participation. Second, any future product iterations that incorporate identity checks could set a precedent for other prediction-market operators seeking regulatory legitimacy, while simultaneously risking reduced user anonymity and participation in certain markets.
Finally, the ongoing talks and market rumors about a possible U.S. relaunch with regulatory clarity from the CFTC, alongside interest in markets such as Japan, signal a strategic pivot toward compliance-driven expansion. Yet the path remains uncertain, given the patchwork nature of global regulation and the persistent questions around licensing, consumer protection, and enforcement in different jurisdictions.
Analysts will be watching not only the technical rollout of the beta but also how Polymarket negotiates the balance between user privacy, regulatory expectations, and the demand for faster, more accessible forecasting markets. As jurisdictions continue to shape the boundaries of permissible activity, the platform’s ability to sustain liquidity and user trust will hinge on transparent governance and clear, enforceable rules.
Readers should monitor updates from Polymarket’s leadership, regulatory developments in key markets, and any formal statements about beta access criteria, licensing steps, or changes to the main platform’s KYC posture as the year progresses.

Quick Summary
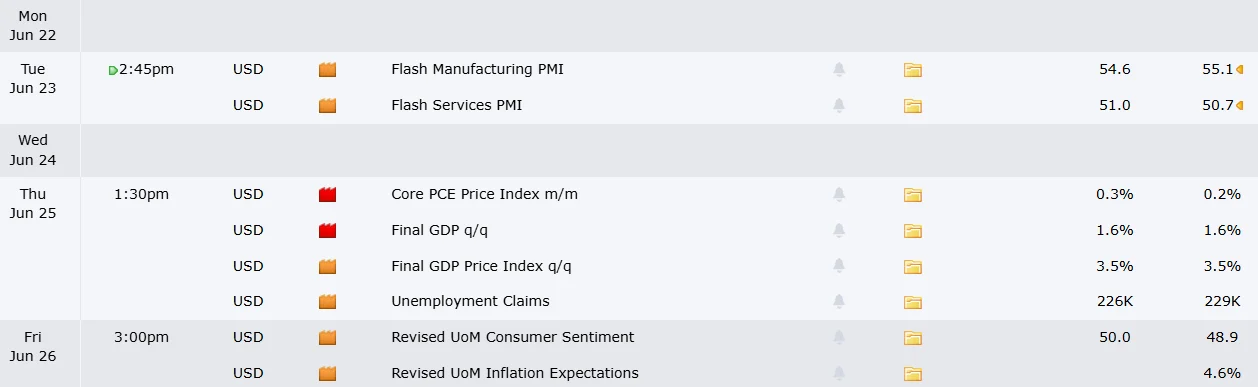
- May’s PCE inflation reading arrives Thursday and may exceed April’s 3.8% annual increase
- Micron Technology delivers quarterly results Wednesday, with its valuation reaching $1 trillion and stock surging 800%-plus year-to-date
- Weekly gains: S&P 500 up 1.08%, Nasdaq jumped 2.48%, Dow edged higher by 0.14%
- SpaceX completed the biggest IPO ever recorded, securing $85.7 billion at a valuation exceeding $2 trillion
- Bitcoin advanced 0.46% to $64,139, underperforming the technology-driven equity surge
Equity markets pushed higher through the previous week, propelled by significant technology sector developments, a landmark public offering, and renewed optimism regarding international trade relations. Here’s a breakdown of recent action and critical events approaching in the days ahead.
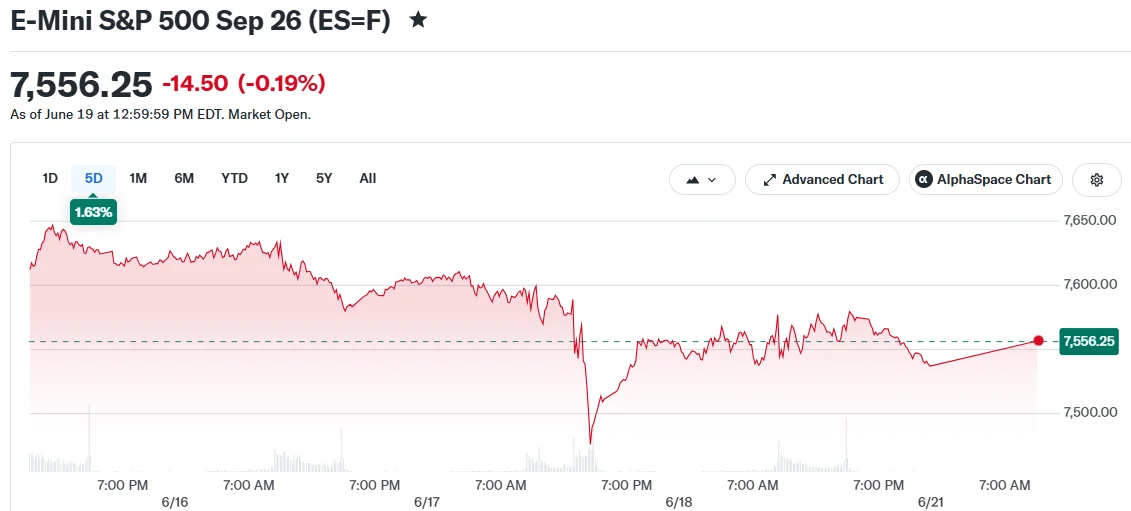
Major Indexes Close With Solid Gains
All three primary U.S. benchmarks finished in positive territory. The S&P 500 advanced 1.08% to settle at 7,500.58. The Nasdaq posted a 2.48% gain, reaching 30,406.19, buoyed by robust appetite for technology and growth-oriented equities. The Dow Jones Industrial Average rose 0.14%, finishing at 51,564.70.

A preliminary U.S.-Iran peace agreement boosted investor confidence. The potential for resumed commerce through the Strait of Hormuz contributed to declining crude prices and encouraged risk-on positioning.
The 10-year U.S. Treasury yield finished the week at 4.455%. This level remains significant for growth-focused companies, which typically face pressure when financing costs climb.
The Federal Reserve, now led by recently appointed Chair Kevin Warsh, maintained its current interest rate stance. However, policymakers indicated additional tightening remains possible should inflationary pressures persist. The central bank has kept rates unchanged since December.
Bitcoin edged up 0.46% to finish at $64,139.86. Gold dropped 1.72% to $4,172.90. Digital assets lagged the wider market advance, which was predominantly powered by technology and mega-cap growth stocks.
SpaceX Delivers Unprecedented Public Market Debut
The week’s headline event was SpaceX’s public market entrance. Elon Musk’s aerospace and satellite enterprise secured $85.7 billion through its IPO, establishing a new record. The offering valued SpaceX at more than $2 trillion.
The landmark listing redirected investor focus toward major technology and innovation-focused enterprises.
SpaceX also purportedly reached an agreement to purchase AI company Cursor for $60 billion, a strategic step toward bolstering its artificial intelligence operations.
Nvidia revealed intentions to issue at minimum $20 billion in investment-grade debt for general corporate applications. This represents one of the chipmaker’s most substantial financing initiatives since the artificial intelligence expansion commenced.
Fox Corporation disclosed a $22 billion transaction to purchase Roku, the connected TV platform. This acquisition extends Fox’s digital footprint as legacy media organizations pursue stronger streaming and advertising infrastructure.
Yum! Brands divested Pizza Hut to LongRange Capital and Yum China Holdings for $2.7 billion. Management stated the transaction enables concentration on its other primary brands.
Critical Events on the Horizon
Micron Technology unveils fiscal third-quarter financial performance on Wednesday. The memory chipmaker’s valuation has reached $1 trillion while shares have skyrocketed more than 800% year-to-date. The firm posted gross margins exceeding 68% in its latest disclosure, prompting speculation about whether the memory semiconductor cycle approaches a top.
The PCE price index for May releases Thursday. April’s figure registered 3.8% on an annual basis, marking the highest level in three years. May’s reading could climb even further based on additional recent inflation indicators. The Federal Reserve monitors the PCE as its primary inflation gauge.
Additional corporate reports this week feature Carnival Corp., FedEx, BlackBerry, and Darden Restaurants. BlackBerry shares have more than doubled during 2026 driven by its expanding Nvidia collaboration and increasing demand for its QNX operating system deployed in advanced driver assistance technologies.


Key Takeaways
- Micron’s transformation from cyclical memory producer to critical AI infrastructure provider is fueled by surging high-bandwidth memory (HBM) requirements
- The semiconductor giant secured a position as an HBM4 supplier for Nvidia’s upcoming AI platforms
- Analyst sentiment remains overwhelmingly positive: 35 Buy/Strong Buy recommendations, 4 Hold ratings, and no Sell recommendations
- Conservative projections estimate MU shares could reach approximately $840 by 2031, while optimistic scenarios suggest $1,750
- Industry experts predict this memory demand cycle may prove more durable than historical patterns due to AI’s infrastructure requirements
For years, Micron existed in the shadows as just another cyclical semiconductor stock. Today, that narrative is undergoing a dramatic transformation.
The catalyst is straightforward: artificial intelligence workloads demand enormous amounts of specialized memory. Advanced AI servers rely heavily on high-bandwidth memory solutions, and Micron stands among the select few manufacturers capable of delivering at enterprise scale.
This dynamic has fundamentally altered Micron’s investment thesis.
Shares have experienced substantial appreciation throughout the ongoing AI infrastructure buildout as HBM and datacenter memory demand continues outpacing available supply. Financial analysts have progressively increased their valuation targets as the AI memory narrative demonstrates remarkable staying power.
The company’s recent inclusion in Nvidia’s HBM4 supply chain represents a strategic win, positioning Micron at the center of next-generation AI computing infrastructure.
Industry observers highlight that Micron’s manufacturing capacity is essentially operating at full allocation. Hyperscale cloud operators and AI infrastructure builders are absorbing production output immediately upon availability.
In response to relentless demand, Micron has expanded its capital expenditure commitments. Executive leadership clearly anticipates sustained market strength.
Projected Valuation Scenarios Through 2031
Analyst modeling presents three distinct trajectories for MU shares over the coming six-year period.
Under a pessimistic scenario, AI infrastructure investment moderates and memory pricing returns to traditional cyclical behavior. Annual revenue approaches $60 billion by 2031, with earnings per share near $10, resulting in a stock price around $200.
The moderate case assumes continued AI demand momentum. HBM contributes an expanding portion of total revenue, profit margins expand, and annual sales reach approximately $110 billion. This pathway suggests earnings per share near $28 and a share price around $840.
An aggressive scenario envisions Micron achieving HBM market leadership with enhanced pricing leverage and revenue climbing toward $180 billion. Under these conditions, shares could potentially reach $1,750.
Weighting these scenarios by probability generates a blended 2031 price target of approximately $947.
Analyst Community Shows Strong Conviction
Wall Street’s endorsement of Micron reaches levels rarely observed across the semiconductor sector.
MarketBeat data reveals the stock currently carries 5 Strong Buy ratings, 30 Buy ratings, and 4 Hold ratings. Notably, zero analysts recommend selling.
Multiple research firms have argued the present memory expansion cycle may exhibit greater longevity than previous upturns, attributing this to AI creating fundamental structural demand rather than temporary purchasing spikes.
Micron’s latest quarterly results and forward guidance support this thesis. Both revenue performance and margin profiles have shown positive trends as HBM represents a growing percentage of the company’s sales composition.

Quick Overview
- Micron’s Wednesday earnings release will test the strength of AI memory chip demand
- Nvidia sentiment hinges on Micron’s performance despite not reporting earnings
- Carnival’s quarterly report reveals the state of consumer travel and leisure spending
- FedEx quarterly results provide crucial insights into trade volumes and e-commerce trends
- Darden’s earnings offer visibility into discretionary dining expenditures
Investors face a critical week ahead, with earnings releases from five major corporations and an inflation reading that could trigger significant market movement.
The Personal Consumption Expenditures index for May — which serves as the Federal Reserve’s primary inflation gauge — arrives simultaneously with quarterly reports from Micron, Carnival, FedEx, and Darden Restaurants. Though Nvidia isn’t scheduled to report, the chipmaker remains under close scrutiny.
Micron Technology
Wednesday marks Micron Technology’s fiscal Q3 earnings announcement, positioning it as the week’s most anticipated corporate disclosure.
The semiconductor manufacturer specializing in memory chips has emerged as a primary winner from the AI infrastructure boom. High-bandwidth memory requirements have skyrocketed as technology giants expand their artificial intelligence computing capabilities.
Tightening supply conditions have pushed memory chip prices upward, providing a tailwind for Micron’s profit margins. Market participants will scrutinize profitability metrics, pricing dynamics, and forward-looking statements.
Given the stock’s impressive appreciation, investor expectations have elevated substantially. Guidance that falls short or margin compression could trigger sharp price swings.
Nvidia
While Nvidia won’t be releasing quarterly results next week, it deserves investor attention nonetheless.
Micron’s financial performance serves as a proxy for the entire AI semiconductor ecosystem. Robust memory chip demand would confirm sustained spending on AI infrastructure — a positive indicator for Nvidia’s business.
Nvidia maintains its dominant position in AI accelerator chips, propelled by purchases from cloud computing platforms and corporate clients. However, the stock’s elevated valuation multiple leaves it vulnerable to shifts in interest rate expectations.
Should the PCE inflation data exceed forecasts, growth-oriented equities like Nvidia might experience selling pressure.
Carnival Corporation
Carnival’s Q2 financial results arrive next week, providing transparency into consumer appetite for travel experiences.
The cruise line operator has enjoyed robust reservation volumes, premium pricing power, and a sustained preference for experiential consumption following the pandemic. Key metrics include reservation patterns, fuel expense management, profit margins, and annual projections.
Declining oil prices may improve the company’s expense profile. Conversely, global political instability has introduced challenges throughout the travel industry.
Carnival’s performance will indicate whether households continue prioritizing vacation spending amid elevated interest rates.
FedEx
FedEx delivers its fiscal Q4 earnings next week, serving as one of Wall Street’s most reliable economic indicators.
The logistics giant’s operations touch retail commerce, online shopping, industrial production, and international shipping. Its financial results provide comprehensive perspective on business activity levels and consumer purchasing power.
FedEx exceeded analyst projections in the previous quarter while upgrading its outlook. Market watchers will assess whether this positive trajectory continued through the final quarter.
The company’s recent divestiture of its freight business, which reports separately later in the week, adds another dimension as investors evaluate FedEx’s strategic transformation and growth prospects.
Darden Restaurants
Darden Restaurants concludes the important earnings stretch with updates from its Olive Garden and LongHorn Steakhouse chains.
The restaurant operator provides direct insight into dining expenditures among middle-class and affluent American consumers. Analysts will examine menu price changes, comparable store sales performance, and customer traffic patterns.
Restaurant industry spending has demonstrated relative resilience compared to other consumer sectors, though inflation pressures and borrowing costs have influenced household spending decisions.
Strong Darden results would indicate continued discretionary spending capacity. Disappointing numbers might suggest consumers are becoming more cautious.
PCE Inflation Data Takes Center Stage
Beyond corporate earnings, the May PCE inflation release represents the week’s potentially most consequential market event.
Persistent inflation would likely keep the Federal Reserve in a holding pattern longer than markets currently anticipate. Such an outcome would weigh on interest-rate-sensitive securities and richly valued growth stocks.
Conversely, cooling inflation could provide momentum for growth equities as investors position for the latter half of 2026.
Market participants will analyze all five companies alongside the inflation figures for clarity on current market conditions and future direction.

Bitcoin’s price has been quietly regaining some momentum, slowly increasing to just over $64,000 over the weekend, but that stable progress could be halted in the following hours.
The promised peace deal between the US and Iran is in question once again, as Trump just threatened the Middle Eastern country with new strikes on his Truth Social platform.
“Iran must immediately stop their highly paid PROXIES in Lebanon from causing trouble. If they don’t, we’ll hit Iran very hard again, just like we did last week, only harder!!! President DONALD J. TRUMP”
Recall that the POTUS announced that both parties had agreed to a deal last Sunday, which was supposed to be signed by June 19. However, that deadline has passed with no official signatures, and Iran even closed (again) the Strait of Hormuz after citing a breach of its agreement with the US to end the war as a reason.
The only positive development on the matter came as Israel and Lebanon announced a ceasefire, which is also in doubt now.
Live updates from the ongoing meeting between the US and Iran in Switzerland informed minutes ago that JD Vance and other negotiators from the Trump administration are in the same room as Iranian officials in a rare face-to-face meeting.
According to CBS News, officials have added an emergency session on the fighting in Lebanon to the Swiss talks, as more than a dozen people were killed in Lebanon by new Israeli strikes on Saturday, hours after the ceasefire agreement had become official.
Consequently, the promise for a more permanent peace deal is far from being certain now. In fact, the situation appeared a lot more promising last Sunday when Trump announced the upcoming deal.
Bitcoin’s price reacted with a notable pump from $64,000 to over $67,000 at the time, but it was stopped and driven south to under $62,500 as the uncertainty grew and the Fed maintained the rates unchanged.
Although it went past $64,000 earlier today, its progress could be halted over the past few hours and days if there’s no positive resolution on the war front.
The post Is Bitcoin (And Peace) In Trouble as Trump Warns Iran of Fresh Strikes? appeared first on CryptoPotato.
Every bullish signal is in place. Exchange supply is draining, whales are accumulating, ETF money is trickling in, and a landmark law sits on the Senate floor. And still XRP keeps losing support and failing at the same ceiling. Here is why the chart is winning the argument.
Summary
- XRP lost $1.15 on heavy volume and failed to reclaim it into the close.
- The $1.25 descending trendline remains the level that keeps rejecting rallies.
- Bullish fundamentals are real, but the market is not rewarding them yet.
- A decisive trendline break is needed before the chart confirms the story.
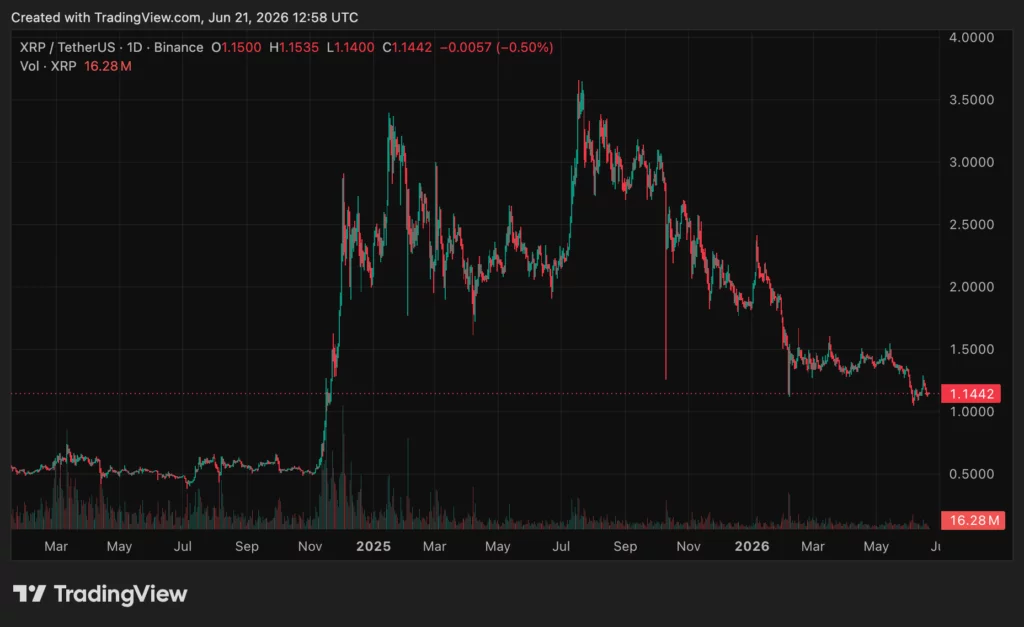
XRP broke below $1.15 on June 19, 2026, falling more than 3% on a volume spike roughly 170% above average, and the break mattered more than the size of the drop. That $1.15 level had been support, the floor buyers defended after a recent push above $1.20, and losing it on heavy volume turned a level that had held the price up into a level that now caps it.
It was the latest in a pattern that has defined XRP for months: every attempt to rally runs into a descending trendline near $1.25 and fails, every recovery stalls, and support levels give way one after another even as the fundamental case for XRP grows stronger.
Exchange supply is draining to multi-year lows, large holders are accumulating aggressively, exchange-traded fund money is flowing in, and the most important crypto legislation in American history sits on the Senate floor. And still the price cannot hold.
The chart is winning the argument against the story, and understanding why is the key to understanding XRP right now.
This piece works through that contradiction. It covers exactly what happened at the $1.15 break and the technical structure XRP is trapped in, the bullish fundamental case that keeps failing to move the price, why a market late in a downtrend stops responding to good news, the specific levels that now define the battle, and how to read a situation where strong fundamentals and weak price action point in opposite directions.
The goal is not to predict where XRP goes next but to explain why it behaves the way it does. The gap between XRP’s improving fundamentals and its deteriorating chart is one of the most instructive setups in crypto, and it teaches something important about how markets actually work when sentiment turns.
The break, and the structure XRP is trapped in
To understand why XRP cannot hold its levels, you have to see the technical structure it has been caught in, because that structure explains the repeated failures better than any single piece of news.
The June 19 break was specific and revealing. XRP fell about 3.4%, dropping from roughly $1.19 to around $1.14, with the sharpest selling arriving in a single burst when volume surged to roughly 170% above average and pushed the price decisively through the $1.15 support.

Buyers stepped in near $1.13 and managed to lift the price back toward $1.15 into the close, but the rebound failed to reclaim the broken level. That is the technically important detail: a support level that breaks and then rejects the price on the way back up has flipped into resistance, becoming a ceiling, not a floor.
This is the same pattern that has repeated at higher levels, where $1.25 was lost earlier and turned into the overhead resistance that has capped every rally since, and now $1.15 risks doing the same thing at a lower level. Each broken support becomes the next ceiling, and the price grinds lower through a staircase of failed floors.
The larger structure containing all of this is a year-long symmetrical triangle, a charting pattern in which the price oscillates within a narrowing range bounded by a descending line of lower highs above and a flatter line of support below. For XRP, the price action has compressed between support near $1.10 and resistance around $1.25, with a descending trendline near $1.25 that has rejected every recovery attempt for months, forming the series of lower highs that defines the downtrend.
This is the cage XRP is trapped in: it cannot break above the descending trendline near $1.25, so every rally fails there, and it keeps losing the support levels beneath it, so the floor keeps dropping.
The most important level on the entire chart is that descending trendline near $1.25, because XRP has failed below it repeatedly, and until the price decisively breaks above it, traders treat every rally as a test of resistance to be sold, not the start of a new uptrend. The structure, not any single news event, is what keeps defeating the price.
The bullish case that keeps failing
Here is what makes XRP’s chart so striking: the fundamental case for the asset has been getting stronger, not weaker, even as the price falls, and laying out that case sharpens the puzzle.
The on-chain and structural signals are clearly bullish. XRP held on exchanges has fallen to multi-year lows as coins move off trading venues into private wallets, which reduces the supply readily available to sell, a setup that is supposed to support prices.
That is the supply story behind the chart. Large holders have been accumulating aggressively, with wallets holding a million or more XRP controlling a record share of the circulating supply and adding well over a billion XRP over six months, the kind of conviction buying that bulls read as a positive sign.
Exchange-traded fund money has been flowing into XRP products, with XRP drawing inflows that outpaced other major altcoins on some days, signaling real institutional interest. That is the demand case for XRP, where ETF flows matter only if they become large enough to break the supply wall.
And underneath all of it sits the largest catalyst of all: the CLARITY Act, the crypto market-structure bill that would codify XRP’s status as a digital commodity into federal law, sitting on the Senate floor and representing a potential demand shock if it passes. That is the catalyst that could break the trendline.
By almost every fundamental measure, the case for XRP has been improving.
And yet the price keeps falling, which is the heart of the contradiction. XRP is down sharply over the past month even as exchange balances shrink, whales accumulate, ETF money arrives, and a transformative law advances.
The bullish signals are real, but they have not translated into price strength, and recovery attempts built on them keep failing at the same resistance.
This is the puzzle that frustrates XRP holders: every reason to be bullish is in place, the supply is tightening, the big holders are buying, the institutions are interested, the law is advancing, and none of it has stopped the price from grinding lower and losing support after support.
The fundamental case and the price action have completely diverged, with the story pointing up and the chart pointing down. That divergence is not a temporary anomaly to be dismissed.
It is itself a signal, and understanding what it means is the most important thing about XRP’s current situation.
Why a market late in a downtrend ignores good news
The explanation for the contradiction lies in market psychology, specifically in how markets behave late in a downtrend, and it is one of the most useful lessons a trader can internalize.
When an asset is no longer reacting positively to bullish news, that is often a characteristic sign of a late-stage downtrend, and it is exactly what XRP has been doing. In a healthy uptrend or a neutral market, good news lifts the price, because buyers are willing to act on it.
But when sentiment has turned negative and a downtrend is entrenched, the market stops responding to good news, because the marginal participant is a seller, not a buyer. Every rally attracts holders looking to exit at a better price, every piece of bullish news is met with selling into the strength, and the accumulated negative sentiment overwhelms the positive fundamentals.
XRP has been repeatedly failing to react positively to bullish supply data, which is precisely the behavior of a market where technical selling is overwhelming longer-term accumulation, and where traders have shifted to focusing on price action and levels instead of on fundamentals and narrative.
This is why XRP’s strong fundamentals have not saved its price: in the current sentiment regime, the fundamentals are simply not what the marginal trader is acting on. The supply tightening and whale accumulation are real, but they describe longer-term, patient positioning.
The day-to-day price is set by shorter-term traders who are selling rallies and respecting the downtrend, and right now the shorter-term selling is winning. The descending trendline near $1.25 has become a self-reinforcing level.
Because it has rejected every rally, traders expect it to reject the next one, so they sell into approaches to it, which makes the rejection happen, which reinforces the expectation. The market has, in effect, decided to trade XRP technically rather than fundamentally, and until that changes, the good news keeps arriving and the price keeps ignoring it.
This is not irrational; it is how markets behave when sentiment is negative and a technical structure has taken hold. It explains why “every bullish signal is in place and the price still falls” is not a contradiction but a recognizable late-downtrend pattern.
The levels that define the battle
With the structure and the psychology understood, the situation reduces to a small number of specific price levels, and watching them is how to read what happens next.
The single most important level is the descending trendline near $1.25, which has capped every rally for months and which defines the entire downtrend. A decisive break above $1.25, on strong volume, would change the conversation entirely, because it would mean XRP had finally broken the descending structure that has contained it.
That would flip the technical picture from “sell every rally” to “a new uptrend may be starting.” Until that happens, $1.25 is the ceiling, and traders will treat approaches to it as opportunities to sell, not as breakouts to chase.
Just below the current price, the recently broken $1.15 level now acts as resistance, the first hurdle bulls must reclaim, and beneath that, support is clustered between roughly $1.13 and $1.10, the zone buyers are trying to defend. The broader triangle is bounded by support near $1.10 and resistance near $1.25, so the price is compressed within that range, and a decisive break of either boundary would signal the next significant move.
The asymmetry in these levels is what defines the current battle. On the downside, if XRP loses the $1.13 to $1.10 support zone, the next levels of support sit lower, and a breakdown through the bottom of the year-long triangle would open the door to a deeper decline, accelerating the downtrend.
On the upside, the path is harder, because XRP must first reclaim the broken $1.15 level, then push through the resistance up to $1.25, and then decisively break the descending trendline that has rejected it repeatedly. That is a series of hurdles, not a single one.
This is why the near-term bias in the price action has been bearish even with bullish fundamentals: the downside requires only losing a nearby support, while the upside requires clearing a stack of resistances culminating in a trendline break. The levels to watch are therefore clear: $1.10 to $1.13 as the support that must hold, $1.15 as the first ceiling to reclaim, and $1.25 as the decisive level whose break would change everything.
Everything in between is the compression of a triangle reaching its resolution. For readers newer to technical setups, reading support and resistance is essential because these levels define where buyers and sellers repeatedly reveal themselves.
How to read fundamentals against price
The deeper lesson of XRP’s situation is about how to think when strong fundamentals and weak price action point in opposite directions, because this is a common and confusing situation that this case illustrates clearly.
The temptation for a fundamentals-focused observer is to conclude that the market is simply wrong, that the bullish supply data and the advancing law mean XRP must rise, and that the falling price is an irrational mistake to be ignored or bought. This is dangerous, because it dismisses the most direct evidence available, the price itself, which aggregates the actual decisions of all market participants.
When fundamentals and price diverge for an extended period, the price is telling you that something the fundamentals miss is dominating. In XRP’s case, that is the negative sentiment and technical selling that overwhelm the positive supply story.
Respecting that signal is wiser than insisting the market should agree with your fundamental analysis. The price action is not noise obscuring the fundamentals; it is information about how the market is actually weighing everything, including factors the bullish narrative leaves out, like the broad crypto downtrend and the macro headwind on XRP.
The wiser reading holds both the fundamentals and the price action as real and lets the price action govern the near-term while the fundamentals inform the longer-term possibility. XRP’s improving fundamentals truly could matter eventually, especially if the CLARITY catalyst lands and shifts sentiment, at which point the tightened supply could amplify an upside move, exactly the setup the bulls describe.
But until sentiment turns and the price confirms it by breaking the descending trendline, the fundamentals remain potential energy that the market is not yet acting on, and trading as though the bullish case is already winning ignores what the chart is plainly saying.
The synthesis is that XRP is a fundamentally improving asset trapped in a technically bearish structure, and the resolution depends on a catalyst strong enough to flip sentiment and break the trendline, most plausibly the CLARITY vote. Watching the price for that break, instead of assuming the fundamentals will force it, is the disciplined way to read the situation.
The fundamentals load the spring; the price tells you whether it has been released. None of this is investment advice; it is a frame for thinking clearly when the story and the chart disagree.
When the chart wins the argument
XRP cannot hold $1.15 for the same reason it could not hold $1.25 before it: the asset is trapped in a year-long descending structure, a symmetrical triangle bounded by resistance near $1.25 and support near $1.10, where a trendline of lower highs rejects every rally and each broken support becomes the next ceiling.
The June 19 break below $1.15 on heavy volume, with the failed attempt to reclaim it, was the latest turn of a pattern that has defined XRP for months. The price is grinding lower through a staircase of failed floors while every recovery stalls at resistance.
What makes the situation so instructive is that it happens against a genuinely bullish fundamental backdrop. Exchange supply is draining to multi-year lows, whales are accumulating a record share of the supply, ETF money is flowing in, and the CLARITY Act sits on the Senate floor as a potential demand shock.
By almost every fundamental measure, the case for XRP is strengthening, and yet the price keeps falling, because the asset is late in a downtrend where the market has stopped responding to good news. The marginal trader is a seller, and accumulated negative sentiment overwhelms the positive fundamentals.
This is not a contradiction but a recognizable pattern: when sentiment turns negative and a technical structure takes hold, fundamentals become potential energy the market is not yet acting on, and the chart wins the argument.
The resolution waits on a catalyst strong enough to flip sentiment and break the descending trendline near $1.25, most plausibly the CLARITY vote, and until that break comes, the disciplined reading is to respect what the price is saying.
The fundamentals have loaded the spring; the chart is still holding it down.
Frequently asked questions
Why did XRP break below $1.15?
On June 19, 2026, XRP fell about 3.4% from roughly $1.19 to around $1.15, with the sharpest selling arriving on a volume spike about 170% above average that pushed the price decisively through $1.15 support. Buyers stepped in near $1.13 but failed to reclaim the broken $1.15 level into the close. The break mattered because a support level that breaks and then rejects the price flips into resistance, becoming a new ceiling, continuing a months-long pattern of failed support levels.
What is the symmetrical triangle XRP is trapped in?
It is a year-long charting pattern in which XRP’s price has compressed between support near $1.10 and resistance near $1.25, bounded above by a descending trendline of lower highs. That trendline near $1.25 has rejected every rally attempt for months, defining the downtrend, while the price keeps losing support levels beneath it. The structure is the cage XRP is caught in: it cannot break above $1.25, and it keeps dropping through the floors below, grinding lower until the triangle resolves.
Why is XRP falling if the fundamentals are bullish?
Because XRP is late in a downtrend, where markets stop responding to good news. Exchange supply is draining, whales are accumulating, ETF money is flowing in, and the CLARITY Act is advancing, all bullish. But in a negative-sentiment downtrend, the marginal trader is a seller: rallies attract holders looking to exit, bullish news is sold into, and technical selling overwhelms longer-term accumulation. When an asset stops reacting positively to good news, it is a characteristic sign of a late-stage downtrend, which is exactly XRP’s behavior.
What levels matter most for XRP now?
The single most important level is the descending trendline near $1.25, which has capped every rally for months; a decisive break above it would change the technical picture entirely. The recently broken $1.15 is now the first resistance bulls must reclaim. Support is clustered between $1.13 and $1.10, the zone that must hold to prevent a deeper decline. The broader triangle runs between $1.10 support and $1.25 resistance, and a decisive break of either boundary signals the next major move.
What would it take for XRP to turn bullish?
A decisive break above the descending trendline near $1.25 on strong volume, which would flip the technical structure from “sell every rally” to a potential new uptrend. That most plausibly requires a catalyst strong enough to flip sentiment, most likely passage of the CLARITY Act, which would codify XRP’s commodity status and could trigger a demand shock that the tightened supply would amplify. Until the price confirms by breaking the trendline, the bullish fundamentals remain potential energy the market is not yet acting on.
Should I trust the fundamentals or the price?
When fundamentals and price diverge for an extended period, the price is telling you something the fundamentals miss is dominating, in XRP’s case negative sentiment and technical selling. Dismissing the falling price as an irrational mistake is dangerous, because the price aggregates all participants’ actual decisions. The wiser approach holds both as real: the fundamentals could matter eventually, especially if CLARITY lands, but until sentiment turns and the price confirms by breaking resistance, the near-term is governed by the chart. This is not investment advice.
As of June 21, 2026. Prices are volatile and move quickly; verify current levels before relying on this analysis. This article is information, not investment or trading advice.

Although the landscape is quietly and slowly improving, the spot exchange-traded funds tracking bitcoin’s performance ended the week once again in the red.
Ethereum’s negative trend was also extended, as the funds behind the two largest cryptocurrencies haven’t seen a single week in the green in a month and a half.
Bitcoin ETFs in Red (Again)
Even Monday recorded substantial net outflows, with $64.09 million leaving the BTC ETFs. This was somewhat surprising since the cryptocurrency’s price actually rose past $67,000 on that date, fueled by optimism from the deal announced by US President Trump between his country and Iran.
The only day in the green was actually Tuesday, with investors inserting $10.06 million into the financial vehicles. However, the trend reversed once again on Wednesday and Thursday, with withdrawals of $82.16 million and $90.66 million, respectively.
With Friday being a non-trading day, the week ended with a total net outflow of $226.84 million, marking the sixth consecutive week in the red since the one that ended on May 15. The total cumulative net inflows have declined during this time by a whopping $5 billion.
Perhaps the only positive conclusion from this is that the total outflows have declined from $1.72 billion during the first week of June to $316 million and the aforementioned $226.84 million in the last two.
The other notable development in the past week on the ETF front, aside from BlackRock’s new product, came from Franklin Templeton. The financial behemoth filed for two ETFs that will invest in US stocks and buy BTC with the dividends from those stocks.
Equity Bitcoin DRIP: proposed ETFs will invest in US stocks but then broad index of stocks pay out dvds the ETF will buy btc with that money. Trying it w innovation stocks too. Interesting.. https://t.co/bDpWOqijKK
— Eric Balchunas (@EricBalchunas) June 19, 2026
ETH ETFs in Red, Too
The spot Ethereum ETFs also ended the week in red, thus seeing a similar 6-week outflow-dominated streak. They had two days in the green, with Monday being the first as $22.50 million entered the products amid the growing peace optimism at the time.
Another $9.59 million went into the funds on Tuesday, but the tides turned once again on Wednesday and Thursday. The total net outflows for those days were $29.37 million and $12.77 million, as the week closed with a negative $10.05 million.
The cumulative total net inflows for the ETH ETFs are down from $12.09 billion on May 8 to $11.18 billion on June 18.
The post Bitcoin ETFs in Red for 6 Weeks in a Row Amid Major Filings From Franklin Templeton appeared first on CryptoPotato.
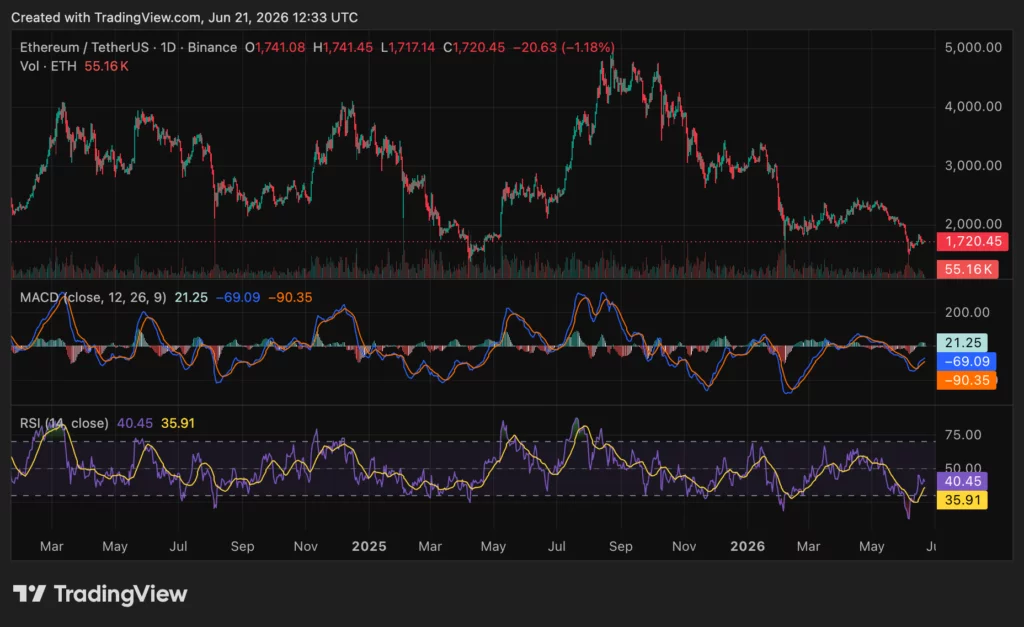
Ethereum traded near $1,731 at press time, leaving the asset close to the same area it occupied in March 2021.
Summary
- Ethereum traded near $1,731 on crypto.news, with buyers still waiting for stronger daily confirmation.
- Ali Martinez sees $1,060 as a value zone before larger rebound targets emerge for ETH.
- Binance exchange outflows suggest some holders moved ETH away from spot selling venues recently again.
According to crypto.news market data, the token rose 0.48% over 24 hours, with a daily range between $1,708 and $1,742.
The current level keeps ETH in a wide debate. Some analysts see a base forming after months of weakness. Others say the chart still needs to defend deeper support before a larger rebound can develop. For now, buyers have slowed the decline, but they have not confirmed control.
Ethereum price stays close to its 2021 level
Ali Martinez pointed out that Ethereum traded around $1,700 in March 2021 and is near the same area today. He said a “$10,000 investment made five years ago would still be worth approximately $10,000 today.”
That view captures Ethereum’s long macro reset. ETH reached new highs after 2021 and later returned to the same zone after sharp drawdowns. The move does not mean the network stopped growing, but it shows that price has not held those gains over the full period.
“Despite five years of severe volatility, explosive bull runs, and deep bear-market liquidations, ETH has posted zero net gains from that baseline,” Martinez also said.
The comment reflects the main problem for ETH bulls. They need proof that the current zone is a base, not another pause before lower levels.
Ethereum’s current market cap still sits above $200 billion, so the asset remains one of crypto’s largest markets. Yet its weak long-term return from the 2021 baseline explains why traders now focus more on levels than narratives.
Ethereum analysts watch $1,060 support and $4,630 target
Martinez said $1,060 stands out as a value zone to watch if Ethereum fails to hold higher support. That level would mark a deeper correction and could become the area where long-term buyers test demand again.
The bullish path needs ETH to protect macro support and then recover lost resistance levels. Martinez said a successful defense could open the door to $2,850 and $4,630 in the short-to-mid term. The second target sits close to the prior all-time high area.
Michaël van de Poppe took a more constructive view. He said this could be “one of the best times to be buying ETH,” adding that investors may look back in five to ten years and wish they had bought more.
Those comments support the long-term accumulation case, but they do not remove near-term risk. ETH must first reclaim key resistance levels. A move above $1,825 would be an early sign of strength, while a clean push through $2,000 would give buyers a stronger setup.
MACD and RSI show early recovery
The short-term technical picture has improved, but it is not fully bullish. The MACD histogram is positive near 21.25, while the MACD line sits around -69.09 and above the signal line near -90.35.
That setup shows a bullish crossover and weaker bearish momentum. Still, both MACD lines remain below the zero line. This means Ethereum is showing an early recovery attempt rather than a confirmed trend reversal.

The RSI also shows a similar message. It sits near 40.45, above its moving average near 35.91. That means momentum has improved from weaker levels.
However, the RSI remains below the neutral 50 mark. Buyers have not taken full control yet. A move above 50 would show stronger demand, especially if it comes with rising volume and a close above nearby resistance.
Binance outflows may ease selling pressure
CryptoQuant analyst Rei Researcher reported a spike in Ethereum exchange outflows from Binance in June 2026. The analyst said a large amount of ETH left the exchange while price traded around the $1.71K area.
Large outflows from exchanges can mean users are moving coins into cold wallets or staking. That can reduce spot sell pressure because fewer tokens remain available for immediate sale on exchanges.
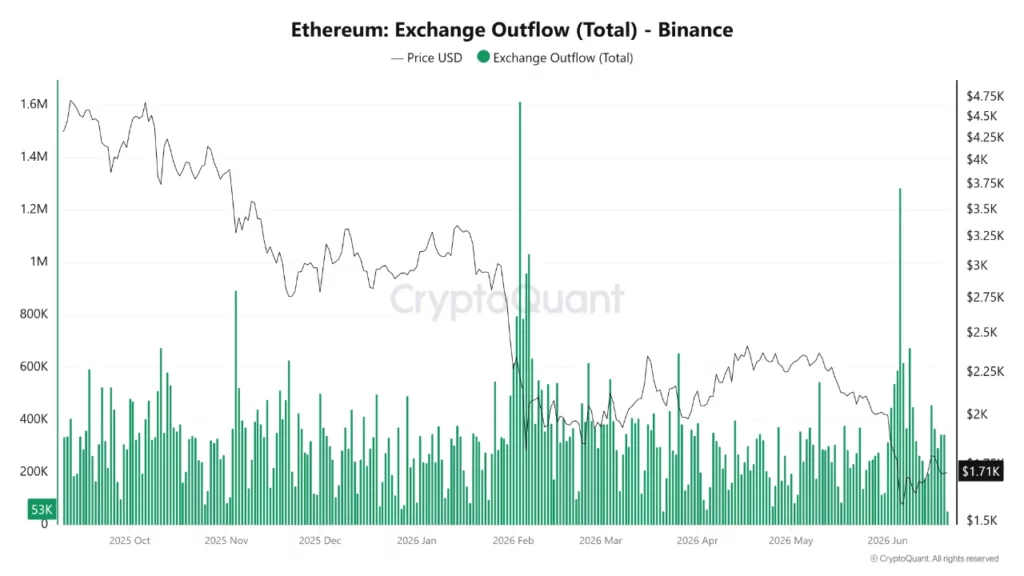
This does not guarantee a price rally. Outflows can support the market only if demand also improves. If macro conditions weaken or Bitcoin loses support, ETH can still retest lower levels.
Recent crypto.news coverage also showed that ETH had already tested lower areas near $1,500 and $1,680 during earlier sell-offs. That history keeps traders cautious until price closes above resistance with stronger volume and broader market support.
For now, Ethereum is trading between early technical recovery and unresolved macro weakness. Bulls need to hold the $1,700 zone, reclaim $1,825, and then push toward $2,000. A failure to hold the range would bring $1,500, $1,300, and the $1,060 value zone back into focus.
Disclosure: This article does not represent investment advice. The content and materials featured on this page are for educational purposes only.

XRP price prediction is getting bullish as Ripple expands to Southeast Asia. Yet, the price hasn’t caught up to the story. A resurfaced SBI Remit announcement confirms live XRP-powered remittance infrastructure across Indonesia, the Philippines, and Vietnam, three of the highest-volume remittance markets on the planet.
Crypto researcher SMQKE posted documentation on X showing SBI Remit’s official announcement of an XRP-based international money transfer service covering all three markets, built through a collaboration between SBI Remit, SBI VC Trade, Ripple, and SBI Ripple Asia.
Ripple —
 SBI Remit Indonesia
  $XRP ODL Bridge Usage
  https://t.co/f7z4ShC4iO pic.twitter.com/T5diPRbmeN
 ChartNerd
  (@ChartNerdTA) June 17, 2026
The timing is good as Indonesia’s Financial Services Authority (OJK) is actively developing a regulatory framework for real-world asset tokenization, which puts Ripple’s existing infrastructure in a strategically advantageous position.
— Indonesia Crypto Network (@idcryptonetwork) June 17, 2026
JUST IN: Indonesia's Financial Services Authority (OJK) Is Set to Release a Real World Asset Tokenization Regulation in Q3 2026. pic.twitter.com/ZuDQ5NhnF1
The service itself is designed to enable quick, low-cost, scalable cross-border bank account transfers using XRP’s architecture.
Discover: The Best Crypto to Diversify Your Portfolio
XRP Price Prediction: Break $1.50 Before Year-End?
XRP’s current price is in a $1.10–$1.25 consolidation range. Our analysts believe that XRP is in a projected grind toward $1.62 by the end of 2026, a 40% move from current levels. But this is assuming the narrative catalysts materialize into demand.
One of our analysts also cited the current spot price, with RSI attempting a reversal near 30, an oversold territory that historically precedes bounces but doesn’t guarantee them. Both VWAP and SMA20 sit above the current price, confirming the near-term bias remains to sell the rip until those averages are reclaimed.

Key resistance stacks up at $1.3 and $1.50, the levels to clear in sequence before any sustained upside becomes viable. Recent breakout attempts have already been rejected at resistance, which demands respect.
The Ripple Swell 2026 event represents another near-term catalyst that could shift the narrative, especially with Hollywood joining the case.
Discover: The Best Token Presales
LiquidChain Targets Early-Mover Upside as XRP Consolidates
XRP at here with end-year target offers just 40% upside “if the base case plays out” is respectable, but not the asymmetric setup active traders are typically hunting. That gap between fundamentals and price is exactly where early-stage infrastructure plays tend to attract capital rotation.
LiquidChain is a Layer 3 infrastructure project with a specific architectural bet: fusing Bitcoin, Ethereum, and Solana liquidity into a single execution environment, eliminating the fragmentation that kills capital efficiency across chains.
LiquidChain is always cooking something new.
This is what happens when a great idea meets innovation.pic.twitter.com/qYbth0impA
— LiquidChain (@getliquidchain) June 15, 2026

The Unified Liquidity Layer enables single-step cross-chain execution with verifiable settlement, so developers deploy once and access all three ecosystems. This is a genuine technical differentiator in a market where bridging friction still costs traders real money.
The presale is live at $0.01471 per $LIQUID, with $853,150.42 raised to date.
Research LiquidChain and assess the technical documentation before the presale ends.
The post XRP Price Prediction: Ripple Taps Indonesia, Philipines, and Vietnam Market appeared first on Cryptonews.

Dash is evaluating the Philippines as a potential destination for crypto payments, positioning the project’s technology as a way to reduce transaction costs in a market where users may be accustomed to high fees.
Speaking to Cointelegraph at Philippine Blockchain Week 2026, Daria Chernozub, global adoption lead at Dash Blockchain, said Dash is focusing on emerging markets that need simpler, lower-cost payment options and where people can adopt new financial tools more easily.
Key takeaways
- Dash says it is exploring the Philippines for crypto payments, citing demand for lower-cost transactions and easier-to-use payment tools.
- Dash’s team is still assessing local conditions and prioritizing legal compliance before pursuing any launch.
- Philippine Securities and Exchange Commission (SEC) officials describe corporate registration for foreign investors as fast via online processes, while crypto-specific compliance is expected to be more complex.
- Industry participants note that crypto firms entering regulated channels can face multi-year preparation and obligations.
Why Dash sees the Philippines as a fit for payments
Chernozub framed Dash’s approach around practical payment needs—especially in places where users encounter “high commissions” and want options that are straightforward to use. In her view, the Philippines aligns with that demand because consumers appear willing to learn about new technologies.
She also emphasized that Dash has not committed to a launch yet. Instead, the project is conducting an on-the-ground market assessment and treating compliance as a prerequisite for moving forward.
As part of its preparations, Chernozub said Dash has begun discussions with major local market participants and prepared a legal opinion letter intended to support conversations with relevant regulatory and financial industry bodies.
From quick corporate setup to tougher crypto compliance
At Philippine Blockchain Week 2026, Philippine SEC Commissioner Rogelio Quevedo told Cointelegraph that foreign investors can register a corporation online from anywhere in the world in approximately 20 to 30 minutes. He characterized this as part of the SEC’s broader digitization and innovation push.
Quevedo’s remarks point to a meaningful improvement at the corporate formation stage—setting up a local entity may now be far less time-consuming than it once was. However, the same process does not automatically translate into permission to operate in crypto markets. Crypto firms may still need additional approvals and licensing depending on what they plan to do.
That distinction matters for investors and operators because the “first gate” (legal presence) can be quick, while the “second gate” (sector-specific regulatory clearance) may still be slow and resource-intensive.
Earlier coverage from Cointelegraph on the Philippines’ regulatory posture has also highlighted how readiness varies by activity—whether the work is framed around tokenization, exchange activity, or other regulated functions. In Dash’s case, its stated focus is on payments, which typically means regulators will look closely at how value transfers are handled, how risks are managed, and what customer protections apply.
Regulated entry is possible—but timelines can be long
In a separate interview at the same event, Marie Antonette Quiogue, head of legal and CEO of Arden Consult, said the SEC has created a framework for foreign crypto exchanges to enter a regulated environment.
Still, Quiogue stressed that compliance comes with substantial obligations. She cited that BlockShoals spent roughly two years developing its arrangement with Binance, describing it as an example of how much work can be required to align with regulatory expectations.
For market participants, this “two-speed” reality—fast corporate registration on one hand and longer regulatory development on the other—helps explain why projects may take time even when the legal baseline is improving. It also suggests that investors should treat early regulatory engagement as a project-critical path rather than an afterthought.
What could attract foreign firms beyond regulation
Quiogue pointed beyond regulatory infrastructure, highlighting demographic and market characteristics that may make the Philippines attractive for foreign crypto-related businesses. She referenced the country’s young population, high mobile usage, and widespread English proficiency as factors that could support adoption.
For a payments-focused project like Dash, these elements can be especially relevant. Mobile-first behavior can reduce friction in payment experiences, while English proficiency can make onboarding and product communication easier across regions.
At the same time, adoption drivers do not eliminate compliance requirements. Even with strong user demand, Dash’s own comments indicate that it intends to proceed only after it completes legal groundwork and confirms how its proposed payment approach fits the local regulatory expectations.
Looking ahead
Dash’s next step will likely be less about announcing a market and more about clearing the compliance path it has already started discussing—particularly as the Philippines continues to modernize corporate processes while crypto oversight remains more demanding. Readers should watch for updates on Dash’s legal positioning and whether its payment model can align smoothly with Philippine regulatory expectations.


A preferred stock that was supposed to behave like a steady, high-yield bond fell to 82 cents on the dollar in a single session. The issuer says it was a leverage flush, not a credit problem. Either way, the new world of Bitcoin-backed “digital credit” just met its first stress test.
Summary
- STRC and SATA showed that Bitcoin-backed preferred stocks can trade violently under stress.
- Issuers blamed the selloff on forced deleveraging, not credit deterioration.
- The episode exposed thin liquidity, leverage, and Bitcoin volatility inside digital credit.
- High yields in these products compensate investors for risks that are now visible.
On June 18, 2026, a security that was designed to be boring did something deeply un-boring. STRC, the perpetual preferred stock issued by Michael Saylor’s company Strategy, the firm formerly known as MicroStrategy, fell to an intraday low of $82.50, far below the roughly $100 par value such an instrument is meant to trade near, before recovering to close around $88.59.
On the same day, a sister instrument called SATA, the preferred stock of a Bitcoin treasury company called Strive, tumbled from its $100 par into the low $90s. Strive’s chief executive, Matt Cole, called it “the most difficult day in the history of Digital Credit,” and was quick to insist that nothing was actually wrong.
No one had defaulted, no issuer’s fundamentals had deteriorated, and the damage was the result of a leverage-driven liquidation, a cascade of margin calls and forced selling, not a real credit event. Whether you believe that reassurance or not, something important happened: the new world of Bitcoin-backed “digital credit” met its first real stress test, and it wobbled.
This piece explains what STRC and SATA actually are and why they exist, what happened on that difficult Thursday and the leverage-liquidation explanation, why these instruments are more fragile than their steady-yield design suggests, what the episode reveals about the broader Bitcoin treasury model that Saylor pioneered and others have copied, and what it means for anyone watching this corner of the market.
The issuers’ reassurance may well be accurate, that this was a mechanical dislocation and not a sign of distress. But the episode is a window into a young, leveraged, thinly traded market built on top of Bitcoin’s volatility, and understanding its first stress test is understanding a risk that has been building quietly beneath the Bitcoin treasury boom.
What STRC and SATA actually are
To understand why the selloff matters, you have to understand these instruments, because they are a new kind of security and their design explains both their appeal and their fragility.
STRC and SATA are perpetual preferred stocks issued by Bitcoin treasury companies, and they sit at the intersection of two worlds: the steady, income-paying world of preferred equity and the volatile world of corporate Bitcoin accumulation. A perpetual preferred stock is a security that pays a fixed or variable dividend indefinitely, with no maturity date, and is meant to behave somewhat like a high-yield bond, trading near its par value and delivering a steady stream of income.
STRC, issued by Strategy, yields roughly 11.5% and pays dividends twice a month. SATA, issued by Strive, offers a variable yield of around 13% and pays dividends every business day, a remarkably frequent payout designed to make the instrument attractive to income-seeking investors.
Both are designed to trade near their $100 par and to throw off generous, regular income, which is why they appeal to investors hunting for yield.
Strategy has also moved STRC toward semi-monthly dividends, reinforcing the product’s pitch as a frequent-income instrument. The first record date for the new schedule is June 30.
The crucial detail is what backs them and what they fund. These preferred stocks are issued by companies whose core strategy is accumulating Bitcoin, and the capital raised by selling the preferred shares helps finance that Bitcoin accumulation.
This is corporate Bitcoin treasuries explained through a credit instrument rather than a normal stock filing. The company raises capital, links the balance sheet to Bitcoin, and then asks public-market investors to tolerate the volatility inside a familiar wrapper.
This is the model Strategy pioneered and that companies like Strive have adopted: raise money through instruments like preferred stock and convertible debt, use it to buy Bitcoin, and amplify Bitcoin exposure through this financial structure, what Strive’s leadership calls an “amplification” strategy. Strive, for instance, has built its structure around preferred equity as the primary form of this amplification, holding roughly 13,000 Bitcoin and maintaining a multi-month dividend reserve to ensure it can keep paying.
These instruments, in other words, are a way for Bitcoin treasury companies to raise capital from yield-seeking investors and channel it into Bitcoin, offering the investors a high income stream in exchange. They are the credit layer of the Bitcoin treasury world, a new market that links steady income products to volatile Bitcoin balance sheets, and that linkage is exactly where the fragility lives.
What happened on the difficult Thursday
The events of June 18 are worth walking through carefully, because the sequence reveals how a security meant to be stable can crater in a single session.
These instruments, which are supposed to trade near their $100 par, dropped sharply and suddenly. STRC fell to an intraday low of $82.50, a steep discount to par for an instrument designed to behave like a steady bond, before recovering to close near $88.59.
SATA fell from par into the low $90s, with one company executive noting it touched as low as $92.88 intraday before recovering toward $97.71. Both instruments, in other words, suffered sharp intraday plunges and then partially recovered, the kind of violent round trip that does not happen to a truly stable income security in normal conditions.
Selling came on heavy volume and cascaded through these thinly traded instruments, and it happened as the broader market was weak. Bitcoin itself slid around the same time toward roughly $62,900, and the United States was heading into a holiday weekend with no equity trading the following day.
Strive’s chief executive offered an explanation that same day, and it is important to take it seriously while also weighing it critically. Matt Cole attributed the plunge not to any deterioration in the creditworthiness of the issuers but to a leverage-driven liquidation.
In plain terms, some investors had bought these preferred shares using borrowed money, posting the shares as collateral, and when prices started to fall, those investors got margin calls. That forced them to sell, which pushed prices down further, triggering more margin calls in a cascade.
This is a mechanical dynamic, a leverage flush, not a fundamental one, and Cole stressed that the issuers’ balance sheets were intact, their dividend reserves full, and their ability to keep paying undisturbed. Strategy has also framed its reserve position as more than sufficient to support dividends over the long term.
Cole characterized the selloff as a temporary market dislocation, the most difficult day in the young history of digital credit, but not a sign of financial distress. The partial recovery of both instruments by the close lends some support to this reading, since a true credit event would not typically bounce back within the session.
The leverage-liquidation explanation is plausible and may well be correct. But as the next section argues, it is also not entirely reassuring.
Why these instruments are more fragile than they look
Here is the heart of the matter, because even if the leverage-liquidation explanation is accurate, the episode exposes a fragility built into these instruments that their steady-yield design obscures.
That reassurance, “it was just a leverage liquidation, not a credit problem,” is meant to calm investors, but it contains its own warning. Their ability to fall nearly 20% in a session on forced selling, regardless of the issuer’s fundamentals, is itself the risk.
An instrument designed to trade near par and behave like a steady bond should not be capable of a violent intraday plunge to $82.50. The fact that it is reveals that these securities are thinly traded and vulnerable to becoming magnets for exactly the kind of leverage that can flush them.
A market thin enough that a wave of margin-called selling can crater the price is a market where holders face real price risk even when nothing is wrong with the issuer. That is not the risk profile yield-seeking investors expect from a bond-like preferred.
That explanation, in other words, identifies the mechanism but does not eliminate the danger. It confirms that these instruments live in a market where mechanical forces can produce sudden, large losses.
A deeper fragility comes from what sits underneath these instruments: Bitcoin. These issuers are Bitcoin treasury companies whose balance sheets rise and fall with Bitcoin’s price, and although the preferred dividends are backed by reserves, the entire structure is ultimately tied to Bitcoin’s volatile value.
When Bitcoin falls, as it has substantially in 2026, the issuers’ balance sheets weaken, the broader sentiment around Bitcoin treasury strategies sours, and the appetite for their leveraged income instruments can fade. All of those pressures can hit the preferred shares at the same time.
This is the Bitcoin downturn behind the stress: a weaker Bitcoin market does not just affect the spot price, it tests every structure built on top of Bitcoin exposure.
They combine three sources of fragility at once: thin liquidity that amplifies any selling, leverage that can cascade into forced liquidations, and an underlying tie to Bitcoin’s volatility. A steady-yield preferred stock is supposed to be insulated from this kind of drama.
The design of STRC and SATA, perpetual preferreds throwing off generous regular income, presents them as stable, income-producing securities. The episode showed that beneath that steady surface lies a young, leveraged, Bitcoin-linked market that can move violently, and that is a fragility the high yields are, in part, compensation for.
What it reveals about the Bitcoin treasury model
The STRC and SATA episode is a window into something larger than two instruments: the Bitcoin treasury model itself, pioneered by Saylor’s Strategy and now widely copied, and the stresses building within it.
This model is, at its core, a leverage play on Bitcoin. Companies like Strategy raise capital through debt and preferred equity and use it to buy Bitcoin, amplifying their Bitcoin exposure so that the company’s value rises faster than Bitcoin when Bitcoin climbs.
Strategy’s goal has been to turn products like STRC into durable Bitcoin-backed credit instruments, not just temporary financing tools. That ambition is what makes the stress test matter: the market is now testing whether the instrument can behave like credit when Bitcoin behaves like Bitcoin.
The strategy made Strategy a market sensation during Bitcoin’s bull runs. Strategy now holds an enormous Bitcoin position, around 846,842 Bitcoin acquired at an average cost of roughly $75,656 per coin, which at a Bitcoin price near $62,500 represents a large unrealized loss, on the order of $11 billion.
That is the other side of leverage: it amplifies losses as well as gains. In 2026, with Bitcoin down sharply on the year, the amplification has been working in reverse, putting the model under a kind of pressure it did not face during the bull market.
The preferred instruments like STRC are part of how this leverage is financed, which is why stress in them is a signal about stress in the model.
The episode is best understood as the model meeting its first real test in a sustained Bitcoin downturn. During Bitcoin’s rises, the Bitcoin treasury strategy looked brilliant, and instruments like STRC and SATA could be issued readily to fund more Bitcoin buying, with investors happy to collect high yields backed by appreciating Bitcoin balance sheets.
A prolonged Bitcoin decline changes the picture: balance sheets show large unrealized losses, recent capital raises draw criticism as dilutive, sentiment sours, and the leveraged income instruments become vulnerable to exactly the kind of flush that hit them. This is also the macro pressure on leverage, because a hawkish rate environment makes every leveraged product harder to support.
Both companies insist their structures are conservatively leveraged or debt-light and their reserves intact, and that may be true, with Strategy and Strive both characterizing their balance sheets as sound. But the episode reveals that the whole edifice, the treasury companies and the digital-credit instruments built on top of them, is being tested by Bitcoin’s downturn in a way it never was during the boom.
The cracks in STRC and SATA are an early reading on how that test is going. The model worked beautifully on the way up; its behavior on the way down is now being discovered in real time.
The honest counterpoint
A fair account has to take the issuers’ reassurance seriously, because there is a real case that this episode was exactly what they say it was and not a sign of deeper trouble.
A bullish reading is that this was a real leverage flush, a mechanical dislocation in a thin market, and not a fundamental problem. On this view, the issuers’ balance sheets really are intact, their dividend reserves really are full, and their ability to keep paying really is undisturbed.
The sharp drop was a temporary technical event caused by overleveraged investors being forced out, not a judgment on the creditworthiness of Strategy or Strive. Partial recovery within the same session supports this, since a real credit deterioration would not typically bounce back so quickly.
The high yields these instruments pay, 11.5% on STRC and around 13% on SATA, are attractive precisely because they compensate for the volatility that episodes like this represent. Strive maintains a multi-month dividend reserve and has characterized its structure as built on long-duration preferred equity matched to the long-duration nature of Bitcoin.
That is an argument that the financing is sensibly structured, not recklessly leveraged. For an investor who believes in the Bitcoin treasury model and can tolerate volatility, a forced-selling dip might even look like an opportunity, not a warning.
A bearish reading does not dispute the mechanics but questions the comfort. Even granting that this was a leverage liquidation and not a credit event, the episode shows that these instruments can lose a fifth of their value in a session, that the market for them is thin enough to cascade, and that they are tied to a Bitcoin treasury model under real pressure from Bitcoin’s decline.
That reassurance, “nothing is fundamentally wrong,” sits uneasily next to the fact that a supposedly stable income security behaved like a volatile one. The worry is that in a young, leveraged, thinly traded market, the line between a mechanical flush and a fundamental problem can blur if Bitcoin keeps falling and the stress compounds.
Both readings have merit, and the honest position is that the issuers may be entirely right about this specific episode while the episode still reveals a fragility worth respecting. These instruments offer high yields for a reason, and that reason was on display on June 18, whatever the precise cause.
An investor should weigh the generous income against the proven capacity for sudden, sharp losses, and decide accordingly.
What it means for investors
For anyone watching or holding these instruments, or the Bitcoin treasury companies behind them, the episode offers concrete lessons regardless of which reading proves correct.
One lesson is that high-yield Bitcoin-linked preferred stocks are not the stable, bond-like income securities their design might suggest. Those generous yields, 11.5% and 13%, are compensation for real risks, including thin liquidity, leverage cascades, and an underlying tie to Bitcoin’s volatility.
An investor attracted by the income should understand that it comes with the proven possibility of sharp price drops. Treating these instruments as equivalent to a safe bond, because they are called preferred stock and pay steady dividends, misreads them.
They are a higher-risk, higher-yield instrument in a young and volatile market, and the June episode is the evidence. Anyone holding them for income should size the position to the reality that the price can move violently and that the market is thin, not to the comforting impression of a steady payout.
Another lesson is about the broader Bitcoin treasury exposure. The episode is a reminder that the Bitcoin treasury model is a leverage play that amplifies losses in a downturn as much as gains in a rally, and that the instruments financing it, and the companies issuing them, carry that amplified risk.
An investor exposed to this corner of the market, whether through the preferred instruments, the treasury companies’ shares, or the broader theme, should hold it understanding that it is leveraged Bitcoin exposure with extra layers of fragility, not a conservative income or equity position. That is why regulated Bitcoin exposure compared is important: a preferred stock tied to a Bitcoin treasury balance sheet is not the same risk as a spot ETF or a simple Bitcoin wrapper.
The broader product-design trend also matters. STRC and SATA are part of the same market impulse that produced another Bitcoin-financial-engineering product, but the risk profile is very different when leverage and dividend obligations sit inside the wrapper.
Watching Bitcoin’s price, the issuers’ balance sheets and dividend coverage, and the behavior of these instruments under stress gives a clearer read on the risk than the steady-yield marketing suggests. None of this is investment advice, and the issuers may be right that the specific episode was benign.
The prudent stance is to respect the fragility the episode revealed and to treat these instruments and the model behind them as the leveraged, volatile, Bitcoin-tied bets they fundamentally are.
A stress test, passed for now
STRC falling to $82.50 and SATA into the low $90s in a single session was, by the issuers’ account, a leverage flush rather than a credit event, and the partial recovery by the close lends that explanation real support.
The companies insist their balance sheets are intact, their reserves full, and their ability to pay undisturbed, and they may be entirely correct that this specific episode was a mechanical dislocation in a thin market and not a sign of distress. In that narrow sense, the Bitcoin dividend machine passed its first stress test: it shook, but it did not break.
But the episode revealed a fragility that the reassurance does not dissolve. Instruments designed to trade near par and behave like steady bonds showed they can lose nearly a fifth of their value in a session.
The market for them is thin enough to cascade under forced selling, and they sit on top of a Bitcoin treasury model now under real pressure from Bitcoin’s decline, with Strategy carrying billions in unrealized losses as leverage works in reverse. The high yields these instruments pay are compensation for exactly this kind of volatility, and June 18 was a vivid display of what that compensation is for.
An honest conclusion holds both truths at once: the issuers are probably right about this episode, and the episode still exposed a young, leveraged, Bitcoin-linked credit market that can move violently and that is being tested in a downturn for the first time. The machine kept running, but it was the first real test.
How it behaves through a sustained Bitcoin decline is a question now being answered in real time, one difficult Thursday at a time.
Frequently asked questions
What are STRC and SATA?
They are perpetual preferred stocks issued by Bitcoin treasury companies. STRC, issued by Michael Saylor’s Strategy, formerly MicroStrategy, yields roughly 11.5% and pays dividends twice a month. SATA, issued by Strive, offers a variable yield around 13% with daily dividend payments. Both are designed to trade near their $100 par and provide steady high income, and both help finance the issuers’ Bitcoin accumulation. They form a new “digital credit” layer linking income products to volatile Bitcoin balance sheets.
What happened to STRC and SATA on June 18, 2026?
Both fell sharply in a single session. STRC dropped to an intraday low of $82.50, well below its roughly $100 par, before recovering to about $88.59. SATA fell from par into the low $90s before partially recovering. Selling came on heavy volume and cascaded through these thinly traded instruments as Bitcoin slid toward roughly $62,900. Strive’s CEO called it “the most difficult day in the history of Digital Credit,” attributing it to forced selling, not a credit problem.
What does leverage liquidation, not a credit event, mean?
It means the plunge was caused by mechanical forced selling rather than any deterioration in the issuers’ creditworthiness. Some investors had bought the preferred shares with borrowed money, posting them as collateral; when prices fell, they got margin calls, forcing them to sell, which pushed prices down further and triggered more margin calls in a cascade. The issuers say their balance sheets and dividend reserves are intact. The partial same-session recovery supports this reading, since a true credit event would not typically bounce back so fast.
Why are these instruments considered fragile?
Even if June 18 was a leverage flush, the episode showed these instruments can lose nearly 20% in a session, which a truly stable bond-like security should not do. They combine three fragilities: thin liquidity that amplifies selling, leverage that can cascade into forced liquidations, and an underlying tie to Bitcoin’s volatility through the issuers’ balance sheets. The high yields they pay are compensation for exactly these risks, which their steady-income design tends to obscure.
What does this say about the Bitcoin treasury model?
The Bitcoin treasury model, pioneered by Strategy and copied by others, raises capital through debt and preferred equity to buy Bitcoin, amplifying exposure. That leverage amplifies losses as well as gains, and with Bitcoin down sharply in 2026, Strategy carries a large unrealized loss, around $11 billion on roughly 846,842 BTC bought near a $75,656 average. The STRC and SATA stress is an early sign of the whole model being tested in a sustained Bitcoin downturn for the first time, after looking brilliant during the boom.
Should investors treat these as safe income securities?
No. Despite being called preferred stock and paying steady dividends, they are higher-risk, higher-yield instruments in a young, leveraged, thinly traded market tied to Bitcoin’s volatility. The June episode showed they can drop sharply and suddenly. The 11.5% and 13% yields are compensation for that risk. Investors attracted by the income should size positions to the reality that prices can move violently, rather than to the impression of a stable payout. This is not investment advice.
As of June 21, 2026. Markets move quickly and figures change; verify current data before relying on this analysis. This article is information, not investment advice.
Harry and Meghan Offered Royal Residence as Family Plans First UK Visit With Children in Four Years

Micron (MU) Earnings and PCE Data: Critical Tests for Tech Stocks This Week

Trump Says ‘Starmer Will Resign’ In Social Media Post


-

 Business7 days ago
No Jackpot Winner as $257 Million Prize Rolls Over to $269 Million Monday Draw
-

 Fashion2 days ago
Weekend Open Thread: Miami – Corporette.com
-
 Crypto World7 days ago
Zimbabwe Requires Crypto Businesses to Register Annually Under New FIU Regulations
-
 Business1 day ago
Wall Street Week Ahead: Investors see Micron earnings as pulse check of AI rally momentum
-
 Entertainment7 days ago
Matt Damon’s Viral Sci-Fi Thriller Has Taken Over HBO Max
-

 Crypto World1 day ago
HIVE shares jump as $220M AI deal speeds Bitcoin mining pivot
-

 Tech7 days ago
As AI companies race to go public, who else is along for the ride?
-

 Business7 days ago
Anthropic staff to meet White House officials next week, Axios reports
-
 Crypto World7 days ago
Bitcoin could crash to $48,000, if this historical pattern is triggered
-
 NewsBeat7 days ago
what doctors are seeing in ebike crashes
-
 NewsBeat7 days ago
Warning of disruption as Cardiff Crossrail works to start
-
 NewsBeat7 days ago
Tributes to former deputy head teacher at Cambridge school among death and funeral notices
-
 Entertainment7 days ago
Kate Middleton Glare Goes Viral After Kids Booed At Royal Event
-

 Politics7 days ago
“Israel’s” ban on ICRC visits ruled illegal, but Knesset moves to stop them permanently
-
 Crypto World7 days ago
XRP ETFs Outperform As Bitcoin And Ethereum Funds Extend Outflow Trend
-

 Tech7 days ago
Over 400 Arch Linux packages compromised to push rootkit, infostealer
-

 News Videos7 days ago
Financial Accounting | Last Day Revision Strategy and Booster | CMA Inter – June 2026
-

 Sports7 days ago
Dick Advocaat’s Curacao scores first-ever World Cup goal against Germany
-

 Business7 days ago
Invesco Quality Income Fund Q1 2026 Commentary
-

 NewsBeat7 days ago
Singer Oliver Tree dies aged 32 in helicopter crash in Brazil
You must be logged in to post a comment Login